
Hypergraph Position Attention Convolution Networks for 3D Point Cloud Segmentation
by
 ,
,
Yanpeng Rong
1,
Liping Nong
2,3,*,
Zichen Liang
4,
Zhuocheng Huang
1,
Jie Peng
3 and
Yiping Huang
1 1
School of Electronic and Information Engineering/School of Integrated Circuits, Guangxi Normal University, Guilin 541004, China
2
College of Physics and Technology, Guangxi Normal University, Guilin 541004, China
3
School of Information and Communication, Guilin University of Electronic Technology, Guilin 541004, China
4
College of Computer Science and Engineering, Guangxi Normal University, Guilin 541004, China
*
Author to whom correspondence should be addressed.
Appl. Sci. 2024, 14(8), 3526; https://doi.org/10.3390/app14083526
Submission received: 19 February 2024
/
Revised: 8 April 2024
/
Accepted: 12 April 2024
/
Published: 22 April 2024
(This article belongs to the Special Issue New Insights into Computer Vision and Graphics)
Abstract
:Point cloud segmentation, as the basis for 3D scene understanding and analysis, has made significant progress in recent years. Graph-based modeling and learning methods have played an important role in point cloud segmentation. However, due to the inherent complexity of point cloud data, it is difficult to capture higher-order and complex features of 3D data using graph learning methods. In addition, how to quickly and efficiently extract important features from point clouds also poses a great challenge to the current research. To address these challenges, we propose a new framework, called hypergraph position attention convolution networks (HGPAT), for point cloud segmentation. Firstly, we use hypergraph to model the higher-order relationships among point clouds. Secondly, in order to effectively learn the feature information of point cloud data, a hyperedge position attention convolution module is proposed, which utilizes the hyperedge–hyperedge propagation pattern to extract and aggregate more important features. Finally, we design a ResNet-like module to reduce the computational complexity of the network and improve its efficiency. We have conducted point cloud segmentation experiments on the ShapeNet Part and S3IDS datasets, and the experimental results demonstrate the effectiveness of the proposed method compared with the state-of-the-art ones.
1. Introduction
With the development of 3D scanning and imaging technologies, the acquisition of point cloud data has become increasingly easy, and its applications have expanded from remote sensing information to a wide range of fields, such as robotics, virtual reality, automated driving and smart cities. Three-dimensional point clouds have shown strong vitality and great application potential, facilitating the interaction between machines and the real world [1]. Point cloud semantic segmentation is an important part of 3D processing technology. By giving machines the ability to recognize and classify elements of the surrounding environment, semantic segmentation plays an important role in enhancing our perception of the world [2,3]. The segmentation results directly affect subsequent applications such as autonomous driving and robot navigation, and therefore, accurate and effective point cloud segmentation is significant.
Point clouds possess characteristics such as disorder, unstructured, high-dimensional and non-uniform density. Currently, the mainstream method used for point cloud semantic segmentation is deep learning. Among them, two commonly used methods are point-based and graph convolution-based ones. Although, methods such as PointNet [4] and pointnet++ [5] process points independently on a local scale to maintain permutation invariance. However, this independence ignores the geometric relationships between points, resulting in an inability to capture local features [6,7]. The graph convolution-based methods, such as GACNet [8] and HDGCN [9], model point clouds with graphs, then learn point cloud features using graph neural networks. The methods improve the performance of point cloud segmentation to a greater extent. However, they consider only pairwise relationships among data while ignoring higher-order relationships. The higher-order relationships refer to those between two or more objects [10]. A growing number of studies have shown that focusing on higher-order relationships can help to dig deeper into the potential connections between data samples, thus improving the capability of the model. Hypergraph is a generalized graph structure that extends the traditional notion of a graph. It is composed of a vertex set and a hyperedge set. The hyperedge set is a collection of subsets of the vertex set, and each hyperedge can connect one or more vertices [11]. This structure allows hypergraphs to represent and handle complex relationships more flexibly.
Due to the advantages of hypergraph in modeling data correlation. In recent years, some scholars have adopted hypergraph tools to analyze and process point cloud data, but the related studies are quite sparse. Zhang et al. [12] introduced a tensor-based approach to estimate the hypergraph spectral components and frequency coefficients of the point cloud in both ideal and noisy environments, established an analytical relationship between hypergraph frequencies and structural features, then evaluated the effectiveness of hypergraph spectra in the tasks of point cloud sampling and denoising. Subsequently, they investigated the capability of hypergraph spectral analysis in unsupervised segmentation of 3D point clouds [13]. In addition, Jiang et al. [14] proposed a 3D object detection method for noisy point clouds based on hypergraph construction–compression–conversion based on the fact that the hypergraph is robust to noise, by constructing hypergraphs with multi-scale voxelized structures and clustering methods, then transforming hypergraphs into graphs, as well as learning the features using graph neural networks. Deng et al. [15] investigated point cloud resampling based on hypergraph signal processing (HGSP) and designed hypergraph spectral filters to capture multilateral interactions between nodes. In the above methods, the method of utilizing hypergraph spectrum and hypergraph signal processing will bring the problem of excessive computational complexity, and the method of converting hypergraph to graph not only brings a conversion cost but also leads to loss of higher-order information. Therefore, it is necessary to apply deep learning techniques to the hypergraph, such as constructing hypergraph neural networks, to give full access to their ability in representation learning by utilizing higher-order data correlations, so as to comprehensively explore the potential information in the data and obtain better point cloud semantic segmentation performance.
A hypergraph neural network is a neural network structure that utilizes higher-order data correlations for representation learning. Compared to graph neural networks, it is better able to capture both global and local information in data. Currently, hypergraph neural networks have shown excellent performance in a variety of tasks such as object retrieval and classification [16], action recognition [17], sentiment prediction [18] and recommender systems [19]. In the literature [20,21,22,23], K-Nearest Neighbor strategy is used to construct hypergraphs, and a hyperedge convolution operator is proposed to obtain the output features of the vertices by aggregating hyperedge features in which the vertices are located. The literature [19,21,24] considers the attention of the node layer and the hyperedge layer and introduces the attention mechanism into the vertex convolution and hyperedge convolution process, which automatically learns the different weights of the vertices and hyperedges during the feature transformation and propagation process. Although hypergraph neural networks have shown significant advantages in a variety of tasks, there are still some challenges in applying them to point cloud semantic segmentation. Firstly, in the current hypergraph neural networks, the widely adopted hyperedge convolution operator [20,25] can effectively aggregate the local information of the nodes in the hypergraph, but in the face of discrete and disordered point cloud data, it is difficult to capture the correlations between local and global features in the data, which leads to the incompleteness and distortion of the information. Secondly, some current hypergraph attention operators [26,27] adopt the vertex–hyperedge–vertex feature transformation mode by using hyperedges as the intermediate layer, but this practice increases the number of parameters, leading to an increase in model complexity. These limitations make it difficult for the current hypergraph neural networks to process large-scale point cloud data. Therefore, it is urgent to design more suitable hypergraph neural network structures for point cloud data processing, thereby better improving the semantic segmentation performance of point clouds.
To this end, we propose an end-to-end hypergraph deep learning framework, i.e., hypergraph position attention convolution network framework, for semantic segmentation of point clouds. Specifically, in order to efficiently organize disordered, unstructured, and high-dimensional point clouds, we construct a hypergraph to capture correlations between point clouds by combining the farthest point sampling and ball query methods. Then, we propose a hyperedge position attention convolution operator for extracting high-level semantic features of point clouds. This operator adopts the hyperedge–hyperedge feature propagation model, which not only effectively utilizes the spatial positional information and higher-order information of the point cloud but also avoids the vertex to hyperedge propagation process, reducing the number of network parameters. Finally, we design a ResNet-like module for feature learning, which further improves the efficiency of the network by introducing deep convolution into the network. The main contributions of our work are summarized as follows:
- We propose a new hyperedge position attention convolution module for feature information extraction, which makes the network focus more on task-related feature information through the position information of the points and the combination of hyperedges generated from other features.
- We design a hypergraph position attention convolution network framework for the semantic segmentation of point clouds. Particularly, we introduced a ResNet-like deep convolution module to lighten the network and improve its efficiency.
- We perform segmentation and a series of ablation experiments on the S3IDS and ShapeNet Part datasets to validate the performance of the proposed method.
2. Related Work
The key techniques involved in this paper include deep learning-based semantic segmentation of 3D point clouds, hypergraph learning and hypergraph attention networks, which are briefly described below.
2.1. Deep Learning-Based Semantic Segmentation of 3D Point Clouds
The voxel-based methods [28] provide a way to convert unstructured geometric data into regular 3D meshes that can be directly applied by standard CNNs. The methods effectively motivate the regularization of unorganized point clouds. However, the inhomogeneity of the point cloud leads to redundant 3D meshes, which require a lot of computation and consume significant amounts of memory. Multiview-based methods [29,30] map 3D objects to 2D images from different perspectives and then process them using 2D convolution followed by fusion of these features to predict the results. Compared to voxel-based methods, the methods reduce the memory cost, but they are vulnerable to virtual viewpoints, leading to the loss of geometric feature information in the point cloud. Point cloud-based methods such as the well-known PointNet [4] and PointNet++ [5] employ direct processing of raw point cloud data to maximize the preservation of spatial features of the point clouds and achieve impressive results in testing. However, this kind of methods ignore the geometric relationships between points, resulting in a lack of localized features. The graph convolution-based methods [8,9,31] consider each point in the point clouds as a vertex of the graph and generate directed edges with neighboring points, which learn the point and edge features in the spatial or spectral domain to capture the local geometric structure features of point clouds. However, the higher-order relationships between objects are not taken into account, and it is difficult to capture the complex structures present in 3D data.
2.2. Hypergraph Neural Networks
Recently, a number of hypergraph neural networks have been proposed for various machine learning tasks, such as image classification, object detection, semantic segmentation, and human pose estimation. Depending on how they process hypergraphs, they can be divided into two categories. One is to map the hypergraph into a graph, then graph convolution methods can be applied to it. For example, in HyperGCN [25], each hyperedge is approximated by a set of pairs of edges, and then a GCN is executed on that graph. Line hypergraph convolution networks (LHCNs) [32] mapped the hypergraph to a weighted and attributed line graph and used GCN to learn the line graph. These methods increase the difficulty of the transformation and do not retain higher-order information well. Another kind of method is to design convolution operators directly on the hypergraph. For example, Feng et al. [20] proposed a Hypergraph Neural Network (HGNN) framework in which hyperedge convolution is designed by using hypergraph Laplacian operators, so that the output vertex features are obtained by aggregating their associated hyperedge features. Considering the differences in the hypergraph structure on each layer, the Dynamic Hypergraph Neural Networks (DHGNNs) [22] further extended the idea of HGNN by adding a dynamic hypergraph building block and designing vertex convolution and hyperedge convolution to aggregate vertex and hyperedge features, respectively. Bai et al. [26] proposed both hyperedge convolution and hypergraph attention operators, where hyperedge convolution is the same as HGNN, and the hypergraph attention operator utilized the attention mechanism to measure the connectivity between vertex and hyperedge. These methods can allow for a large degree of preservation of higher-order information while avoiding complex transformation processes. These works open up new perspectives and greatly broaden research ideas in the field of point cloud segmentation.
2.3. Hypergraph Attention Networks
In recent years, hypergraph attention networks (HGATs) have been an important research direction that has attracted much attention in the field of graph neural networks. The architecture of HANs [33] has been carefully designed to take full advantage of the adaptive attention mechanism, which helps to capture the association information between the hypergraph and node. Some research works have been conducted to aggregate higher-order correlation information between nodes by constructing hyperedge and introducing attention mechanisms [34]. In addition, certain methods [21] introduce attention mechanisms at both the node and hyperedge levels, thus facilitating the automatic learning of different weights for vertices and hyperedges during vertex and hyperedge convolution. However, the methods may face the problem of high computational complexity when dealing with large-scale hypergraphs, thus motivating scholars to explore the design of more effective hypergraph attention mechanisms. Scholars have combined hypergraph attention networks with gated recurrent unit networks [35] to capture higher-order correlations and temporal features. In addition, to further enhance the performance and scalability of hypergraph attention networks, Cui et al. [36] enhanced hypergraph convolution networks by hierarchical organization of intra-hyperedge, inter-hyperedge and inter-hypergraph attention modules to reduce information loss. These innovative research works have expanded a new possibility for hypergraph attention networks in handling challenging tasks with complex relationships. In this paper, we follow this line of thought and construct attention mechanisms to better aggregate feature information and work on reducing its complexity.
3. Method
In this section, we introduce the proposed hypergraph position attention convolution network. First, we review graph attention and hypergraph definitions. Second, we describe the hypergraph construction process. Finally, we describe the architecture of the network and the corresponding modules in detail.
3.1. Review
Since our hyperedge attention convolution is inspired by graph attention. Therefore, we first introduce the relevant theory of graph attention and then review the definition of a hypergraph.
3.1.1. Graph Attention
The input to the graph attention layer is a set of node features , where N is the number of nodes, and F is the number of features in each node. In order to obtain enough expressive power to convert the input features into higher level features, a shared attention mechanism is executed on the nodes to compute the attention coefficients:
That shows the importance of the features of node j for node i. In order to make the coefficients between different nodes easily comparable, all choices of j are normalized using the softmax function:
Once obtained, the normalized attention coefficients are used to compute a linear combination of the features corresponding to them as the final output features for every node:
where denotes the activation function.
3.1.2. Hypergraph Definition
A hypergraph is an important concept in discrete mathematics, which is a generalization of ordinary graphs [37]. In a hypergraph, the hyperedge can connect more than 2 vertices, unlike an ordinary graph where each edge connects only two vertices. Thus, a hypergraph can represent higher-order relations more flexibly. Hypergraph consists of a vertex set V, a set of hyperedges E, and a diagonal matrix W of hyperedge weights. Here, each hyperedge is assigned a positive weight . A hypergraph with N vertices can be represented by an incidence matrix whose elements are defined as
The degree of vertex based on H is denoted by
The degree of hyperedge is denoted by
Further, let and denote the diagonal matrices of the vertex degree and hyperedge degree, respectively.
3.2. Hypergraph Construction
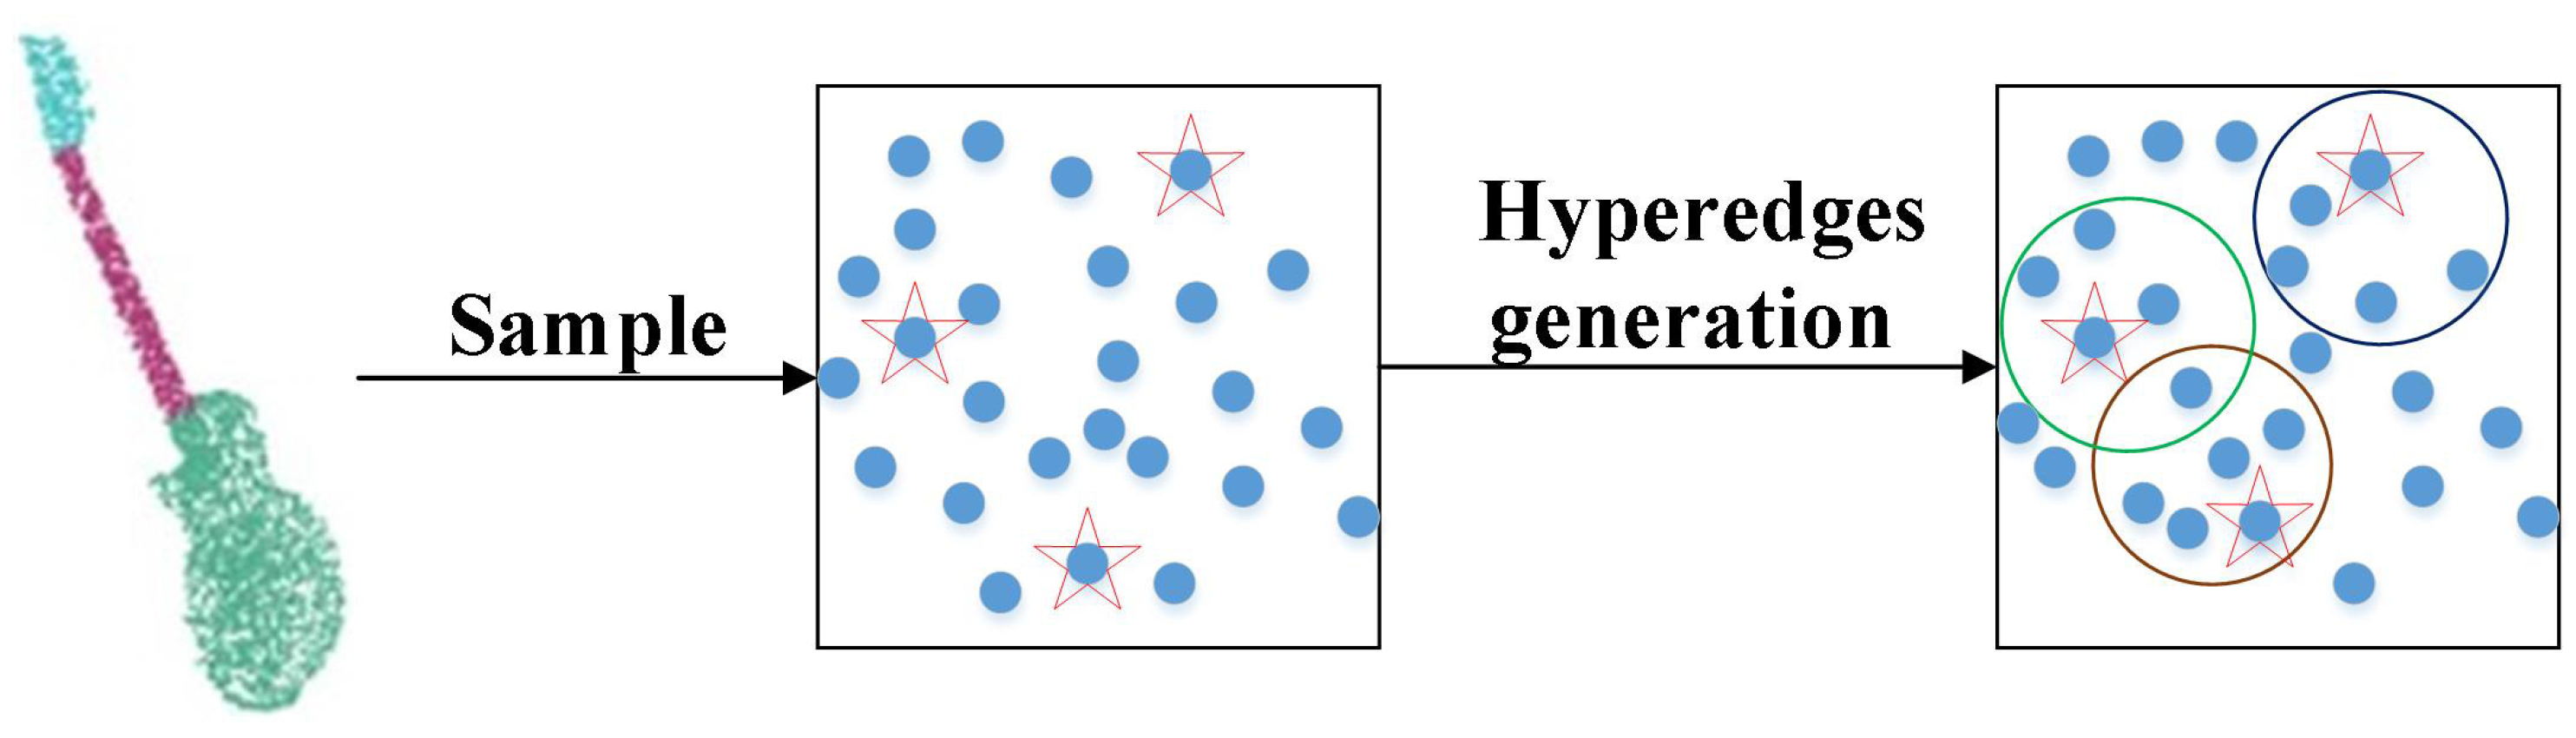
In this paper, we use the hypergraph method to construct point cloud data. We sample the original point cloud using farthest point sampling (FPS) to identify representative centroids. Furthermore, we use the ball query to generate hyperedges that effectively capture the local and global structural relationships between point clouds, as shown in Figure 1. First of all, a vertex set is obtained from point clouds with N points, then the representative vertex is obtained using the furthest point sampling algorithm, , where p represents the number of points sampled, and represents the number of target classes. Next, we use a ball query to divide the entire point set into a set of hyperedges. Specifically, a sampled point is chosen as the centroid at a time, and all nodes within the ball of radius R (including the centroid) are found and used to generate hyperedges. An important basis for choosing a radius R is the construction of a connected hypergraph, which means a reachable path exists between any pair of vertices within the hypergraph. The sampling radius of a sampling point is therefore restricted between its own maximum and minimum distances from other sampling points. The sampling radius distance of a sampled point is
where the maximum sampling radius is denoted as . The minimum sampling radius is denoted as , denotes the need to remove the starting point , the center point and the sampling point that has been used by other nodes to generate the radius. is expressed as
In this way, we obtain the hypergraph generated from point clouds, where denotes the vertex set, and E denotes the hyperedge set. The method is more suitable for point cloud data with uneven distribution, irregularity, and other characteristics than kNN for constructing hypergraphs. It also reduces the complexity of computing distances.
3.3. Hypergraph Position Attention Convolution Networks
Figure 2 shows the hypergraph position attention convolution network framework for point cloud segmentation. First, the input point cloud data information is constructed by a hypergraph to obtain nodes and hyperedges. Then, it is passed into the ResNet-like module, which undergoes a 1 × 1 convolution operation. Next, the feature information enters the hyperedge position attention convolution module, and after passing through the DWconv convolution module, BN and activation function, the new feature information is obtained by multiplying with the features transmitted by the residual mechanism. Finally, the feature information is pooled by pooling operation and then enters the upsampling process to obtain the feature information by interpolation and skip operation.
3.3.1. Hyperedge Position Attention Convolution Module
The purple part of Figure 2 shows our proposed hyperedge position attentional convolution module, which aims to focus on the local features of the point cloud efficiently. We utilize hyperedge–hyperedge propagation to construct a position adaptive attention mechanism that focuses on the most relevant parts of local features. This allows the convolution kernel to dynamically adapt to the complex spatial variations and geometric structure of the point clouds. The attention mechanism dynamically adapts the weights of input features, and we calculate the attention weights between hyperedge and hyperedge as follows:
where denotes the connectivity relation and denotes the 1 × 1 convolution operation. denotes the DWConv operation, which is used to reduce the number of parameters in the convolution operation. The first term in denotes the hyperedge feature information constructed based on the spatial location relationship of the point cloud, which helps to aggregate the spatial information of the unordered vertices. The second term denotes the computation of the spatial location relationship between neighboring points on each edge, which aims to enhance the local feature information. Considering the spatial relationships between neighboring hyperedges, our method can capture the local structural information to improve the performance of the model more accurately. Through computing the attention weights, we are able to efficiently assess the degree of association between hyperedges, which leads to more accurate feature aggregation and point cloud segmentation.
Next, we normalize the attention weights of all neighbors of hyperedge i and obtain the final measure of the hyperedge attention factor for the whole hypergraph as follows:
With this approach, we generate a new attention factor for the hyperedge–hyperedge relationship, ∈[0, 1]. Thus, the final output equation obtained by our proposed method is as follows:
where denotes Batch Normalization and denotes the activation function. We apply operations such as the function to it to obtain the final coefficients.
Comparison with existing methods: Current hypergraph attention convolution operators [21,26] usually use the vertex–hyperedge–vertex feature transformation model, which introduces an attention mechanism to handle vertex convolution and hyperedge convolution, as well as automatically learning the different weights of vertices and hyperedges during the feature transformation and propagation process. However, the method increases the number of model parameters and leads to training difficulties. In contrast, we design the hypergraph position attention convolution with the hyperedge–hyperedge feature propagation model. It eliminates the need for the vertex–hyperedge transformation process and simplifies the architecture of the model, which reduces the number of network parameters and decreases the complexity of the model. Thus, the designed convolution operator improves some of the limitations of the current hypergraph attention networks and provides a more effective solution for point cloud segmentation and other related tasks. Furthermore, experimental comparisons are made later in the network analysis to demonstrate the effectiveness of the method.
3.3.2. ResNet-like Module
In the field of deep learning, the residual network (ResNet) [38] is known for its unique residual module design, which mainly consists of multiple convolutional layers and shortcuts. It effectively solves the problems of gradient vanishing and network degradation caused by over-deep networks while reducing the number of parameters. DWConv [39] is a decomposition of the standard convolution operation into deep convolution and pointwise convolution. In the deep convolution stage, each input channel undergoes the convolution operation independently, thus effectively extracting the spatial features within each channel. Then, pointwise convolution fuses the features from different channels to generate the final output feature map. Inspired by the idea of the ResNet network, we introduced DWConv to construct a ResNet-like module, as shown in the red part of Figure 2a. We input the hyperedge information into the hyperedge position-attentive convolution module and multiply it with the processed node information to obtain the output feature information. We skillfully integrate this module into the hypergraph positional attention convolutional network, which not only reduces the computational complexity of the model but also significantly improves the operation efficiency of the network. The formula for the output characteristics is as follows:
where denotes a set of input vertex features, each feature is associated with a corresponding hypergraph vertex, and the dimensional information of each vertex includes the most basic 3D coordinate information and also other information , such as colors and normal vectors. denotes the weight library, defined as , where each is a weight matrix, and D controls the number of weight matrices in the weight library. ⊙ denotes the product, which is performed as an element-by-element product of two vectors. By introducing this innovative module, hypergraph neural networks with high efficiency in point cloud segmentation are obtained.
3.3.3. Pooling Operation
The pooling operation performs aggregation of local area features to reduce the dimensionality of the point cloud, it can help to retain important feature information as well as reduce the amount of computation. In point cloud segmentation, the features of each vertex in the hypergraph come from the set of aggregated output features in the previous-level hypergraph . The vertex feature of the l+1 layer in is computed as follows:
where denotes the vertex output feature at layer l. denotes the ResNet-like attentional convolution operation. denotes the pooling function, and we use maximum pooling for the downsampling operation.
3.3.4. Skip Connection
In point cloud segmentation, skip connection is a technique that fuses different levels of features to improve the model performance. The process consists of three main steps: interpolation, concatenation and 1 × 1 convolution. First, the weight of each node is calculated based on the distance between the known point cloud position information and the target point cloud position information. The magnitude of the weight value depends on the distance. New point cloud features are generated by weighted average interpolation operation. Subsequently, the features are concatenated together to form a richer feature representation. Finally, the 1 × 1 convolution operation is applied to reduce the number of channels of the fused features, thus effectively reducing the complexity of the model. The equations for the upsample output features are as follows:
where I denotes weighted average interpolation operation, and and , respectively, denote the target point cloud position information and the known point cloud position information. denotes the result of the interpolation operation between them. This technique provides an effective means to improve the performance of the model in point cloud segmentation tasks.
4. Experiment
In this section, we evaluate our approach by performing semantic segmentation experiments on the S3IDS dataset [40] and instance segmentation experiments on the ShapeNet Part dataset [41]. First, we present the datasets and implementation details, then we show the experimental results, and finally we present the ablation experiments.
4.1. Datasets and Evaluation Indicators
4.1.1. Dataset
S3IDS dataset covers different types of indoor areas, making it a representative indoor point cloud dataset. The dataset contains over 200 million points, each categorized into 13 different semantic categories, providing large-scale data for training and testing. In this dataset, we use Area 5 as a test set, while the rest of the area is used for training in order to perform an objective evaluation of the model performance. This dataset provides an important resource for the task of semantic segmentation of point clouds, which can be used to develop and evaluate various algorithms and models, thus advancing research and applications in the field of indoor environment understanding.
ShapeNet Part dataset is a richly annotated and large-scale 3D image dataset designed to be used to evaluate the performance of 3D object part segmentation networks. The dataset consists of 16 different classes and a total of 50 segments, containing a total of 16,846 samples that exhibit a variety of inhomogeneous features. The dataset is divided into 12,137 samples for training, 1870 samples for validation, and 2874 samples for testing, reaching a total of 16,881 samples. Notably, it contains 35 duplicate samples. Using this dataset for in-depth research work could advance the field of computer vision in 3D image analysis.
4.1.2. Evaluation Indicators
On the S3IDS dataset, we use three metrics to quantitatively evaluate the performance of the proposed method on semantic segmentation, namely overall segmentation accuracy (OA), mean accuracy (mAcc) and mean intersection over union (mIoU). On the ShapeNet Part dataset, we use two metrics to quantitatively evaluate the performance of the proposed method on instance segmentation, namely class mIoU (Cls.mIoU) and instances (Ins.mIoU). FLOPs are used to measure the model computational complexity.
4.2. Implementation Details
Our proposed framework uses the PyTorch 1.8.1 deep learning framework with hardware configuration CPU:16-core Intel(R) Xeon(R) Platinum 8350C CPU @ 2.60 GHz and GPU: RTX 3090. In the S3DIS dataset, the training dataset was generated following the same preprocessing scheme as well-known networks such as PointNet++ [5] and PAConv [42]. Specifically, the room is divided into blocks using the sliding window method, and then, 4096 points are randomly sampled as samples in each block. We utilize the farthest point sampling and ball querying schemes for hypergraph construction of XYZ and RGB feature information of the sample point clouds for the point cloud semantic segmentation task. We train the model using the SGD optimizer with the cross-entropy loss function minimized, the number of weight matrices set to 16, the PAConv convolution kernel set to [16, 16, 16], and the empirical learning rate set to 0.05. We maintain the same training and testing batches as PAConv so that we can better evaluate the performance of the network.
In the ShapeNet Part dataset, we use the same hardware and software configuration. We set the training batch size to 32 and use 200 epochs for training, the number of sample points is set to 2048, the model [42] convolution kernel is set to [16, 16, 16], and we also train the model using the Adam optimizer, set the momentum to 0.9 for batch normalization, set the minimum learning rate to 0.003, and use a fixed-step decay scheme to test our network. Our comparison with other models can demonstrate the effectiveness of our proposed method. To enhance the data, we also perform random scaling, rotation and dithering on the points of the tested model.
4.3. Results
4.3.1. Segmentation Evaluation Results
Table 1 and Table 2 show the segmentation evaluation results for two different datasets: the S3IDS and ShapeNet datasets, respectively. In the S3IDS dataset, we use the same configuration of sample size and training parameters as models such as GACNet [8], DGCNN [6] and PAConv [42], e.g., 4096 samples and 100 epochs of input for training. This careful configuration is used in order to perform a robust comparative analysis. Compared to PAConv, our new method provides a significant improvement, increasing the mIoU by 0.21%. In addition, our method achieves significant progress in terms of overall accuracy (OA), mAcc, and mIoU by 1.3%, 0.3%, and 4.1%, respectively, compared to the BIDEL model. Similarly, with respect to the ShapeNet Part dataset, we conducted an evaluation using consistent sampling points to assess the performance of multiple networks such as AGNet [43], DGCNN, and PAConv. Through rigorous analysis, we found an improvement in mIoU for instance segmentation 0.7% compared to the SBSNet network.
PointNet++ [5], SegGCN [44] and our method represent point-based, graph-based and hypergraph-based methods, respectively. The analysis in Figure 3 shows that our method achieves the best results in all three indicators, OA, mAcc and mIoU, and it proves the effectiveness and advancements of our method using a hypergraph for point cloud segmentation. Specifically, PointNet++ directly deals with the raw point cloud data, maximizing the preservation of the spatial features of the point cloud. However, this method ignores the geometric relationships between points, resulting in a lack of local features. SegGCN is to process graph-structured data by using graph convolution, which performs convolution operations on nodes and edges, thus realizing feature extraction and representation learning on graph-structured data. However, it is difficult to capture the complex structures present in 3D data because the higher-order relationships between objects are not taken into account. Our approach utilizes hypergraph convolution models that act directly on the raw feature data of the point cloud, which naturally preserves the spatial position information of the point cloud and helps to better capture the local feature information, thus improving the performance of the model in the point cloud data.

Table 1.
Semantic segmentation results on Area 5 in the S3IDS dataset (%).
| Method | OA | mAcc | mIoU |
|---|---|---|---|
| PointNet++ [5] | 86.4 | 61.2 | 56.0 |
| PointWeb [45] | 87.0 | 66.6 | 60.3 |
| KPConv [46] | - | 72.8 | 67.1 |
| GACNet [8] | 87.8 | - | 62.9 |
| SegGCN [44] | 88.2 | 70.4 | 63.6 |
| PAConv [42] | - | - | 66.6 |
| GAPointNet [47] | 85 | - | 51.2 |
| CBL [48] | 87.6 | 71.9 | 64.1 |
| AGNet [43] | 85.9 | - | 59.6 |
| BIDEL [49] | 88.0 | 73.6 | 64.7 |
| SuperCluster [50] | - | - | 68.1 |
| Ours | 89.3 | 73.9 | 66.8 |
Table 2.
Shape part segmentation results for the ShapeNet part dataset (%).
| Method | Cls. mIoU | Ins. mIoU |
|---|---|---|
| PointNet [4] | 80.4 | 83.7 |
| PointNet++ [5] | 81.9 | 85.1 |
| DGCNN [6] | 82.3 | 85.2 |
| PointConv [51] | 82.8 | 85.7 |
| PAConv [42] | 84.2 | 86.4 |
| GAPointNet [47] | - | 84.9 |
| AGNet [43] | - | 85.4 |
| Win-Former [52] | - | 85.4 |
| SBSNet [53] | - | 85.3 |
| APES [54] | 83.7 | 85.8 |
| Ours | 84.4 | 86.0 |
Figure 3.
Accuracy of different methods.

4.3.2. Complexity Results Analysis
Table 3 shows the comparison of the computational complexity of our model on the two datasets. By setting the same hyperparameters and comparing them on the two datasets, it is clear that there is a significant reduction in the FLOPs of our proposed method, and the model is more efficient. This is attributed to the fact that we introduce a ResNet-like module in the model to reduce the FLOPs by incorporating a deep convolution in the module, which performs the convolution operation independently for each channel. Meanwhile, we design the hypergraph position attentive convolution with a hyperedge–hyperedge feature propagation model. It eliminates the need for vertex–hyperedge transformation process and simplifies the architecture of the model, which reduces the number of network parameters and decreases the complexity of the model. As a result, our model achieves higher computational efficiency compared to other methods, reinforcing its advantages in resource utilization.
4.3.3. Visualization Results
Figure 4 shows the visualization of the results of the S3IDS dataset [40] on area 5. The first row is the original scene input, the second one is the real scene information labeling, and the third one is the segmentation scene of our proposed method. From this result, we can see that our proposal method obtains better segmentation results.
4.4. Ablation Study
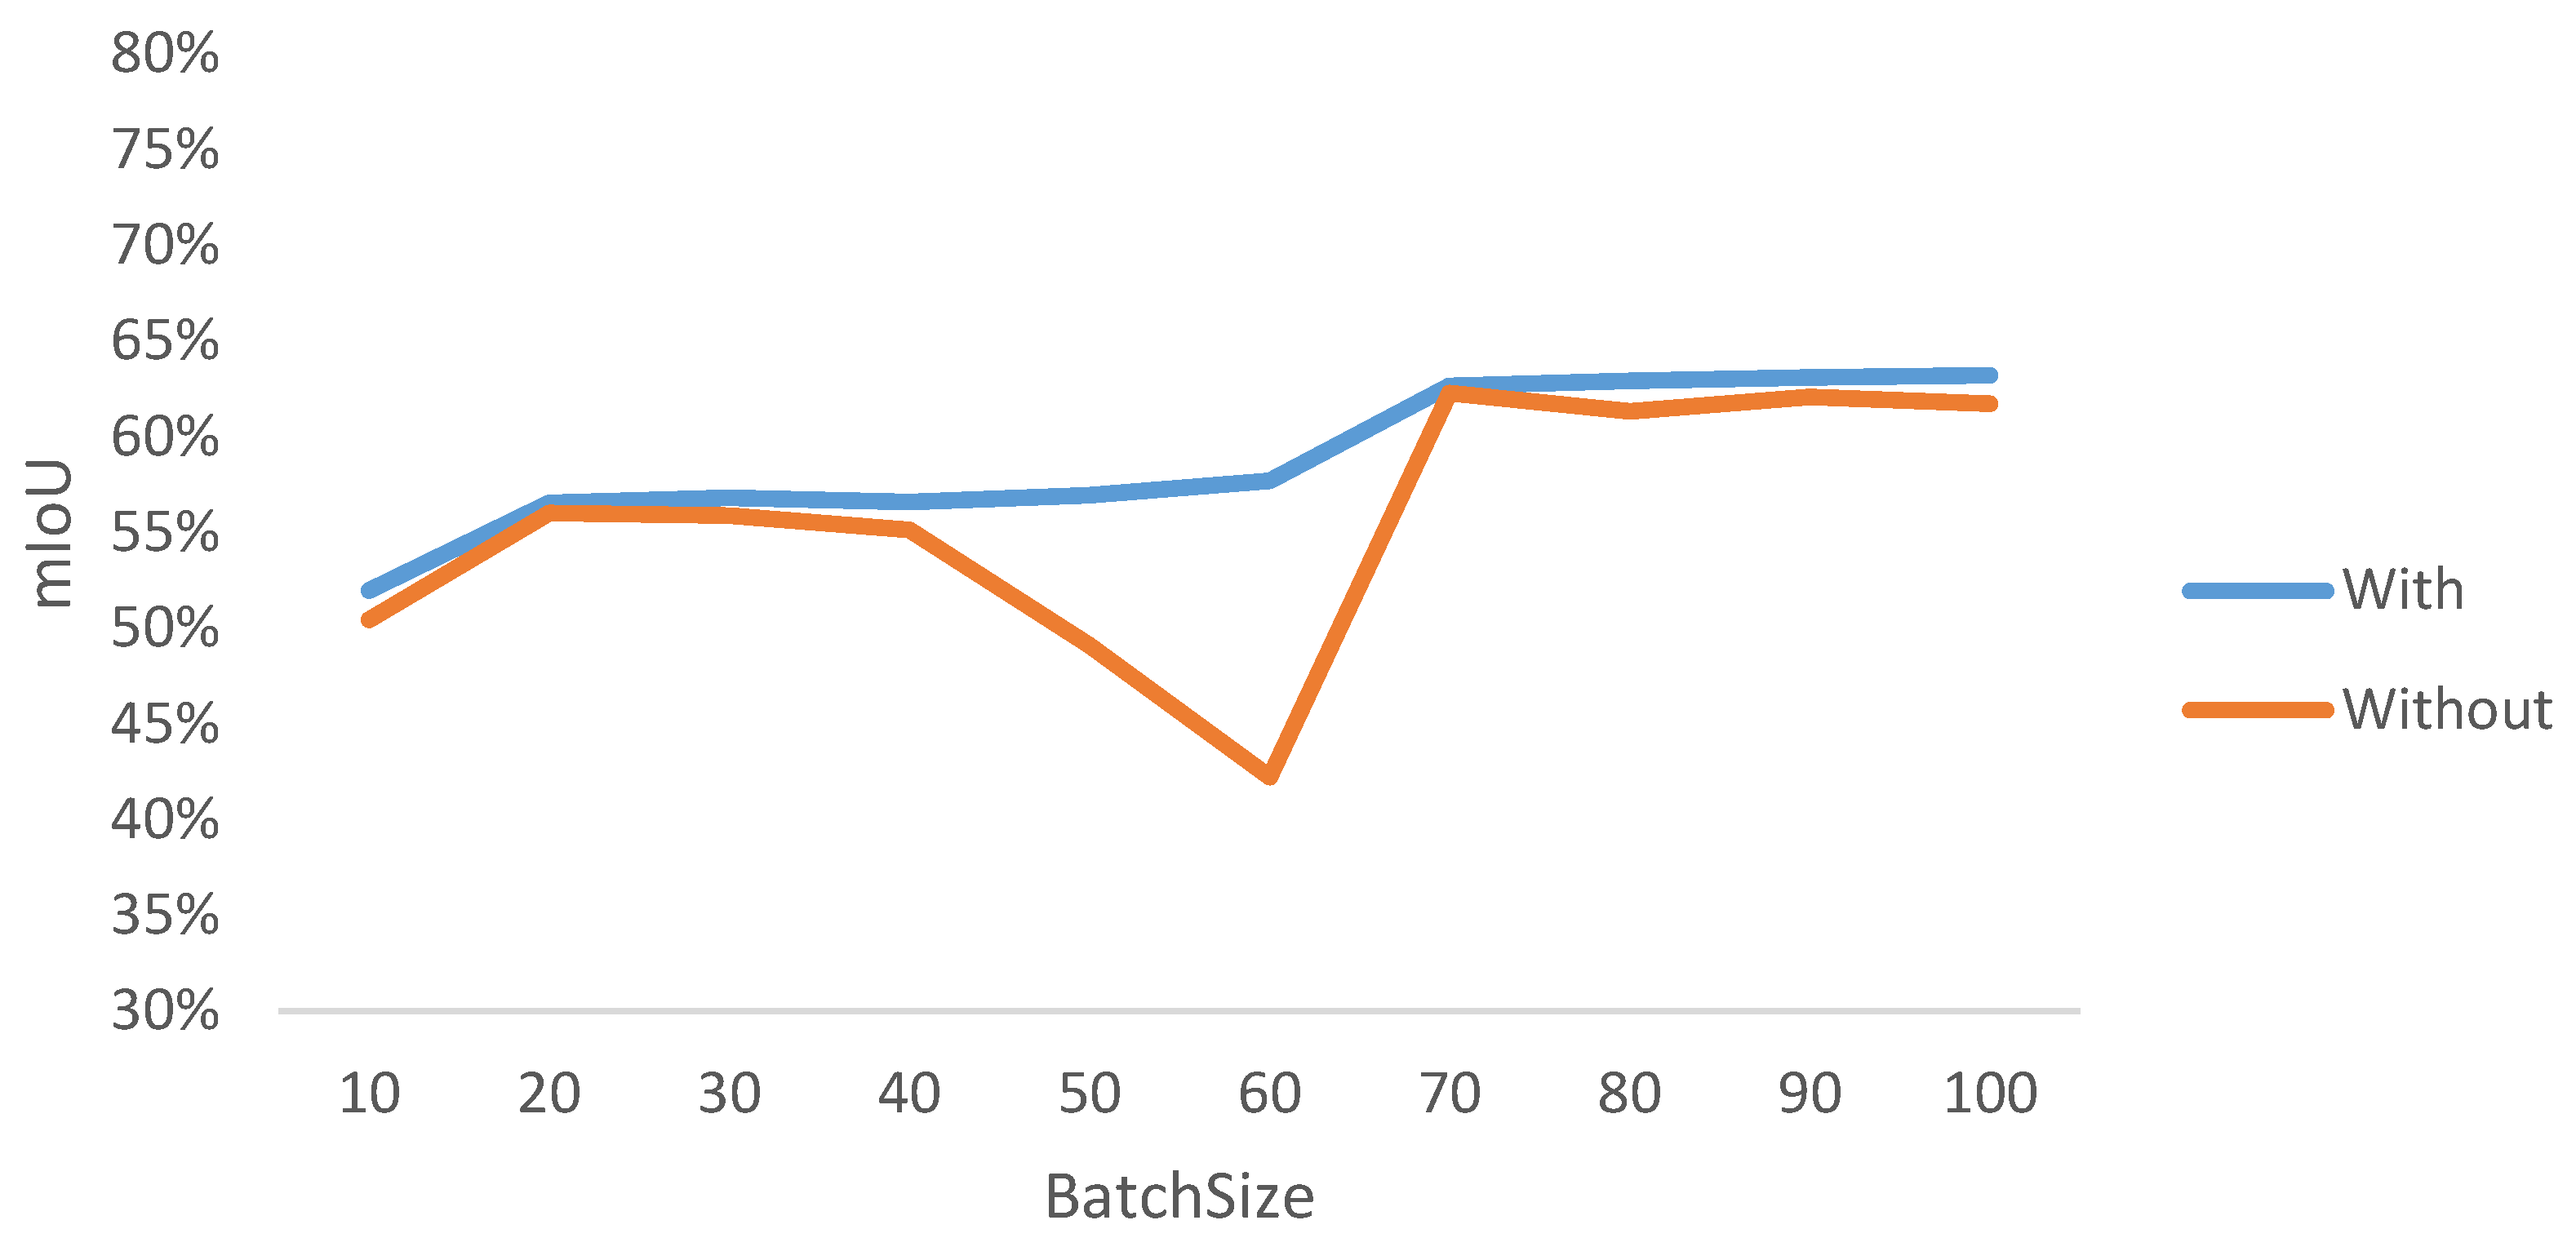
This section explores in depth the impact of integrating the Dwconv convolution module into the model architecture. The experimental results in Table 4 demonstrate the effect of this architectural modification. As can be seen from the data, the introduction of the convolution module significantly reduces the computational complexity of the model, i.e., the FLOPs are reduced by 143 M. This improvement is particularly important because before the introduction of the convolution module, the initial computational complexity of the model was as high as 1302 M. The significant reduction in computational complexity is a strong argument for a more efficient model design. This result shows that our model not only improves the accuracy of the segmentation task, but also increases the computational efficiency. As shown in Figure 5, the unintroduced convolution module has a large impact on the stability of the network, and the performance of the model on the point cloud semantic segmentation task can be comprehensively evaluated based on the change in mIoU.
4.5. Parameter Sensitivity Study
In this section, we delve into our proposed method and conduct a series of experiments with a parametric analysis for comparative studies. All experiments were tested on region 5 of the S3IDS dataset.
4.5.1. Influence of Hyperedge Feature Information
We utilize different point cloud feature information for hyperedge construction and hyperedge concatenation, which apply to the hyperedge attention mechanism. The different hyperedge construction information includes spatial position information (XYZ), local spatial position information (local XYZ) and feature information containing RGB (features). In order to evaluate the effect of hyperedge information on segmentation, we conduct tests with different hyperedge information as shown in Table 5, where “||” indicated the concatenation of different hyperedge information. The comparison reveals that using the spatial position of the point cloud to construct the hyperedge is superior to using the feature information to construct the hyperedge, verifying the superiority of constructing the hyperedge by spatial position information.
4.5.2. Influence of the Number of Weight Matrices
The weight matrices in the network help the model to better process and analyze the input data. Therefore, we discuss the effect of varying the number of weight matrices (denoted by the number of D) in the model weight library on the point cloud segmentation results. As shown in Table 6, the size of D increases exponentially, and when the number reaches 16, the segmentation metric mIoU appears to decrease, but FLOPs gradually increase. The test results show that when the number of weight matrices is too large, it brings redundancy and leads to heavy memory/computation overhead, which results in a rise in complexity FLOPs and a decrease in segmentation metric mIoU. Comparative analysis shows that the mIoU metric performs best when the weight matrix size is 16. As shown in Figure 6, it can be seen on the test set that the accuracy tends to increase when the weight matrix size is 16. When the weight matrix size is 32, there is a fluctuation. In comparison, it is not as stable as when the weight matrix size is 16.
4.5.3. Influence of the Number of Sampling Points
In order to further validate the feature learning effect of the proposed network under different sampling parameters, we conducted experiments using different numbers of sampling points (i.e., 2048, 4096, 8192, 16,384 and 32,768) in this study. As shown in Figure 7, the segmentation metric mIoU tends to increase with the increase in the number of sampling points, which indicates that the accuracy of the model has improved. However, it is worth noting that the increase in the number of sampling points leads to an increase in storage and computation requirements. From the observations in Figure 7, it can be seen that the difference in the mIoU values corresponding to the changes in the last four parameters is less than 0.1%. Thus, we can find that the model achieves an optimal solution between segmentation efficiency and computational cost using 4096 sampling parameters.
4.5.4. Influence of Convolutional Layers
We test the effect of a different number of layers given to the network. Observing Table 7, we can find that the number of convolutional layers increases, and the segmentation metrics mIoU and accuracy grow gradually. However, when the number of convolutional layers reaches four layers, the two metrics do not increase but rather decrease. Through analysis, we find that due to increasing the number of convolutional layers, it causes overfitting of the model, which affects the segmentation results of the model.
5. Conclusions
In this paper, we propose a novel hypergraph position attention convolutional network for 3D point cloud segmentation. This method improves the performance of point cloud segmentation by taking advantage of the hypergraph position attention convolutional model, which makes full use of the inherent neighborhood information and spatial geometric structure information between point clouds. In addition, we propose a ResNet-like module that lightens the model and improves the network efficiency. A large number of experiments have proven the effectiveness of our method and provided new solutions in the field of point cloud segmentation. However, there are some limitations of our method. For example, we only utilize the spatial position information and color information of the point cloud without fully combining and utilizing other feature information, such as normal vectors. In the future, we will use this information further to explore the possibility of this network for point cloud segmentation performance enhancement. Meanwhile, we will use the network in other fields such as sentiment recognition and the recommender system to further prove the effectiveness of our network.
Author Contributions
Y.R.: Conceptualization, methodology, software, writing—original draft. L.N.: Conceptualization, validation, writing—review and editing. Y.H.: Mentoring, obtaining funding. J.P.: Writing-review and editing. Z.H. and Z.L.: Formal analysis. All authors have read and agreed to the published version of the manuscript.
Funding
This research was funded by the Guangxi Science and Technology Program, grant number Guike AD23026225, 2022GXNSFAA035629 and GuikeAD23026298; the National Natural Science Foundation of China, grant number 62371149 and 61966007; the Key Laboratory of Cognitive Radio and Information Processing, Ministry of Education, grant number CRKL230205.
Data Availability Statement
The S3IDS and ShapeNet Part datasets used in this article are publicly available datasets. The dataset links are http://buildingparser.stanford.edu/dataset.html (accessed on 15 March 2023); https://shapenet.org/ (accessed on 15 March 2023).
Acknowledgments
The authors thank the referees whose comments helped to improve the manuscript.
Conflicts of Interest
The authors declare no conflicts of interest.
Abbreviations
The following abbreviations are used in this manuscript:
| 3D | Three-dimensional |
| kNN | k-Nearest Neighbor |
| GCNs | Graph Convolutional Network |
| HGNNs | Hypergraph Neural Networks |
| HGATs | Hypergraph Attention Networks |
| FPS | Farthest Point Sampling |
| HGSP | Hypergraph signal processing |
| FLOPs | Floating-Point Operations |
References
- Guo, Y.; Wang, H.; Hu, Q.; Liu, H.; Liu, L.; Bennamoun, M. Deep learning for 3d point clouds: A survey. IEEE Trans. Pattern Anal. Mach. Intell. 2020, 43, 4338–4364. [Google Scholar] [CrossRef] [PubMed]
- Cao, Y.; Teruggi, S.; Fassi, F.; Scaioni, M. A Comprehensive Understanding of Machine Learning and Deep Learning Methods for 3D Architectural Cultural Heritage Point Cloud Semantic Segmentation. In Proceedings of the Italian Conference on Geomatics and Geospatial Technologies, Genova, Italy, 20–24 June 2022; pp. 329–341. [Google Scholar] [CrossRef]
- Silva, I.M.; Moioli, R.C. A method for creating interactive, user-resembling avatars. PeerJ Comput. Sci. 2017, 3, e128. [Google Scholar] [CrossRef]
- Qi, C.; Su, H.; Mo, K.; Guibas, L.J. PointNet: Deep Learning on Point Sets for 3D Classification and Segmentation. In Proceedings of the 2017 IEEE Conference on Computer Vision and Pattern Recognition (CVPR), Honolulu, HI, USA, 21–26 July 2017; pp. 7652–7660. [Google Scholar] [CrossRef]
- Qi, C.R.; Yi, L.; Su, H.; Guibas, L.J. Pointnet++: Deep hierarchical feature learning on point sets in a metric space. Adv. Neural Inf. Process. Syst. 2017, 30. [Google Scholar] [CrossRef]
- Wang, Y.; Sun, Y.; Liu, Z.; Sarma, S.E.; Bronstein, M.M.; Solomon, J.M. Dynamic graph cnn for learning on point clouds. ACM Trans. Graph. (TOG) 2019, 38, 1–12. [Google Scholar] [CrossRef]
- Xie, Z.; Chen, J.; Peng, B. Point clouds learning with attention-based graph convolution networks. Neurocomputing 2020, 402, 245–255. [Google Scholar] [CrossRef]
- Wang, L.; Huang, Y.; Hou, Y.; Shenman, Z.; Shan, J. Graph Attention Convolution for Point Cloud Semantic Segmentation. In Proceedings of the IEEE/CVF Conference on Computer Vision and Pattern Recognition, Long Beach, CA, USA, 15–20 June 2019; pp. 10288–10297. [Google Scholar] [CrossRef]
- Liang, Z.; Yang, M.; Deng, L.; Wang, C.; Wang, B. Hierarchical Depthwise Graph Convolutional Neural Network for 3D Semantic Segmentation of Point Clouds. In Proceedings of the 2019 International Conference on Robotics and Automation (ICRA), Montreal, QC, Canada, 20–24 May 2019; pp. 8152–8158. [Google Scholar] [CrossRef]
- Battiston, F.; Cencetti, G.; Iacopini, I.; Latora, V.; Lucas, M.; Patania, A.; Young, J.G.; Petri, G. Networks beyond pairwise interactions: Structure and dynamics. Phys. Rep. 2020, 874, 1–92. [Google Scholar] [CrossRef]
- Bretto, A. Hypergraph theory. In An Introduction. Mathematical Engineering; Springer: Cham, Switzerland, 2013; Volume 1. [Google Scholar]
- Zhang, S.; Cui, S.; Ding, Z. Hypergraph Spectral Analysis and Processing in 3D Point Cloud. IEEE Trans. Image Process. 2021, 30, 1193–1206. [Google Scholar] [CrossRef]
- Zhang, S.; Cui, S.; Ding, Z. Hypergraph Spectral Clustering for Point Cloud Segmentation. IEEE Signal Process. Lett. 2020, 27, 1655–1659. [Google Scholar] [CrossRef]
- Jiang, P.; Deng, X.; Wang, L.; Chen, Z.; Zhang, S. Hypergraph Representation for Detecting 3D Objects from Noisy Point Clouds. IEEE Trans. Knowl. Data Eng. 2023, 35, 7016–7029. [Google Scholar] [CrossRef]
- Deng, Q.; Zhang, S.; Ding, Z. An Efficient Hypergraph Approach to Robust Point Cloud Resampling. IEEE Trans. Image Process. 2022, 31, 1924–1937. [Google Scholar] [CrossRef]
- Gao, Y.; Wang, M.; Tao, D.; Ji, R.; Dai, Q. 3-D object retrieval and recognition with hypergraph analysis. IEEE Trans. Image Process. 2012, 21, 4290–4303. [Google Scholar] [CrossRef] [PubMed]
- Hao, X.; Li, J.; Guo, Y.; Jiang, T.; Yu, M. Hypergraph Neural Network for Skeleton-Based Action Recognition. IEEE Trans. Image Process. 2021, 30, 2263–2275. [Google Scholar] [CrossRef] [PubMed]
- Huang, Y.; Lu, H. Deep learning driven hypergraph representation for image-based emotion recognition. In Proceedings of the 18th ACM International Conference on Multimodal Interaction, Tokyo, Japan, 12–16 November 2016; pp. 243–247. [Google Scholar] [CrossRef]
- Wang, J.; Ding, K.; Zhu, Z.; Caverlee, J. Session-based Recommendation with Hypergraph Attention Networks. In Proceedings of the 2021 SIAM International Conference on Data Mining (SDM), Virtual Event, 29 April–1 May 2021. [Google Scholar] [CrossRef]
- Feng, Y.; You, H.; Zhang, Z.; Ji, R.; Gao, Y. Hypergraph Neural Networks. In Proceedings of the AAAI Conference on Artificial Intelligence, New Orleans, LA, USA, 2–7 February 2018. [Google Scholar]
- Chen, C.; Cheng, Z.; Li, Z.; Wang, M. Hypergraph Attention Networks. In Proceedings of the 2020 IEEE 19th International Conference on Trust, Security and Privacy in Computing and Communications (TrustCom), Guangzhou, China, 29 December 2020; pp. 1560–1565. [Google Scholar] [CrossRef]
- Jiang, J.; Wei, Y.; Feng, Y.; Cao, J.; Gao, Y. Dynamic Hypergraph Neural Networks. In Proceedings of the IJCAI, Macao, China, 10–16 August 2019; pp. 2635–2641. [Google Scholar] [CrossRef]
- Zhu, J.; Zhao, X.; Hu, H.; Gao, Y. Emotion Recognition from Physiological Signals using Multi-Hypergraph Neural Networks. In Proceedings of the 2019 IEEE International Conference on Multimedia and Expo (ICME), Shanghai, China, 8–12 July 2019; pp. 610–615. [Google Scholar] [CrossRef]
- Ding, K.; Wang, J.; Li, J.; Li, D.; Liu, H. Be More with Less: Hypergraph Attention Networks for Inductive Text Classification. In Proceedings of the 2020 Conference on Empirical Methods in Natural Language Processing (EMNLP), Online, 16–20 November 2020; Webber, B., Cohn, T., He, Y., Liu, Y., Eds.; pp. 4927–4936. [Google Scholar]
- Yadati, N.; Nimishakavi, M.; Yadav, P.; Nitin, V.; Louis, A.; Talukdar, P. Hypergcn: A new method for training graph convolutional networks on hypergraphs. Adv. Neural Inf. Process. Syst. 2019, 32, 1511–1522. [Google Scholar] [CrossRef]
- Bai, S.; Zhang, F.; Torr, P.H. Hypergraph convolution and hypergraph attention. Pattern Recognit. 2021, 110, 107637. [Google Scholar] [CrossRef]
- Liu, S.; Lv, P.; Zhang, Y.; Fu, J.; Cheng, J.; Li, W.; Zhou, B.; Xu, M. Semi-Dynamic Hypergraph Neural Network for 3D Pose Estimation. In Proceedings of the International Joint Conference on Artificial Intelligence, Yokohama, Japan, 11–17 July 2020. [Google Scholar] [CrossRef]
- Maturana, D.; Scherer, S. Voxnet: A 3d convolutional neural network for real-time object recognition. In Proceedings of the 2015 IEEE/RSJ International Conference on Intelligent Robots and Systems (IROS), Hamburg, Germany, 28 September–2 October 2015; IEEE: Piscataway, NJ, USA, 2015; pp. 922–928. [Google Scholar]
- Su, H.; Maji, S.; Kalogerakis, E.; Learned-Miller, E. Multi-view convolutional neural networks for 3d shape recognition. In Proceedings of the IEEE International Conference on Computer Vision, Santiago, Chile, 7–13 December 2015; pp. 945–953. [Google Scholar]
- Wu, B.; Zhou, X.; Zhao, S.; Yue, X.; Keutzer, K. Squeezesegv2: Improved model structure and unsupervised domain adaptation for road-object segmentation from a lidar point cloud. In Proceedings of the 2019 International Conference on Robotics and Automation (ICRA), Montreal, QC, Canada, 20–24 May 2019; IEEE: Piscataway, NJ, USA, 2019; pp. 4376–4382. [Google Scholar]
- Jung, T.W.; Jeong, C.S.; Kim, I.S.; Yu, M.S.; Kwon, S.C.; Jung, K.D. Graph Convolutional Network for 3D Object Pose Estimation in a Point Cloud. Sensors 2022, 22, 8166. [Google Scholar] [CrossRef]
- Bandyopadhyay, S.; Das, K.; Murty, M.N. Line Hypergraph Convolution Network: Applying Graph Convolution for Hypergraphs. arXiv 2020, arXiv:2002.03392. [Google Scholar] [CrossRef]
- Kim, E.S.; Kang, W.Y.; On, K.W.; Heo, Y.J.; Zhang, B.T. Hypergraph Attention Networks for Multimodal Learning. In Proceedings of the 2020 IEEE/CVF Conference on Computer Vision and Pattern Recognition (CVPR), Seattle, WA, USA, 13–19 June 2020; pp. 14569–14578. [Google Scholar] [CrossRef]
- Liu, J.; Xue, Z.; Li, A. Scientific Paper Classification Based on Graph Neural Network with Hypergraph Self-attention Mechanism. In Proceedings of the 2022 IEEE 8th International Conference on Cloud Computing and Intelligent Systems (CCIS), Chengdu, China, 26–28 November 2022; IEEE: Piscataway, NJ, USA, 2022; pp. 511–515. [Google Scholar]
- Liu, C.; Tan, J.; Li, J.; Li, Y.; Wang, H. Temporal Hypergraph Attention Network for Silicon Content Prediction in Blast Furnace. IEEE Trans. Instrum. Meas. 2022, 71, 1–13. [Google Scholar] [CrossRef]
- Cui, C.; Li, X.; Zhang, C.; Guan, W.; Wang, M. Temporal-relational hypergraph tri-attention networks for stock trend prediction. Pattern Recognit. 2023, 143, 109759. [Google Scholar] [CrossRef]
- Zhou, D.; Huang, J.; Schölkopf, B. Learning with hypergraphs: Clustering, classification, and embedding. Adv. Neural Inf. Process. Syst. 2006, 19. [Google Scholar] [CrossRef]
- He, K.; Zhang, X.; Ren, S.; Sun, J. Deep residual learning for image recognition. In Proceedings of the IEEE Conference on Computer Vision and Pattern Recognition, Las Vegas, NV, USA, 27–30 June 2016; pp. 770–778. [Google Scholar]
- Chollet, F. Xception: Deep learning with depthwise separable convolutions. In Proceedings of the IEEE Conference on Computer Vision and Pattern Recognition, Honolulu, HI, USA, 21–26 July 2017; pp. 1251–1258. [Google Scholar]
- Armeni, I.; Sener, O.; Zamir, A.R.; Jiang, H.; Brilakis, I.; Fischer, M.; Savarese, S. 3d semantic parsing of large-scale indoor spaces. In Proceedings of the IEEE Conference on Computer Vision and Pattern Recognition, Las Vegas, NV, USA, 27–30 June 2016; pp. 1534–1543. [Google Scholar]
- Yi, L.; Kim, V.G.; Ceylan, D.; Shen, I.; Yan, M.; Su, H.; Lu, A.; Huang, Q.; Sheffer, A.; Guibas, L.; et al. A scalable active framework for region annotation in 3d shape collections. ACM Trans. Graph. (TOG) 2016, 35, 210. [Google Scholar] [CrossRef]
- Xu, M.; Ding, R.; Zhao, H.; Qi, X. Paconv: Position adaptive convolution with dynamic kernel assembling on point clouds. In Proceedings of the IEEE/CVF Conference on Computer Vision and Pattern Recognition, Nashville, TN, USA, 20–25 June 2021; pp. 3173–3182. [Google Scholar]
- Jing, W.; Zhang, W.; Li, L.; Di, D.; Chen, G.; Wang, J. AGNet: An attention-based graph network for point cloud classification and segmentation. Remote Sens. 2022, 14, 1036. [Google Scholar] [CrossRef]
- Lei, H.; Akhtar, N.; Mian, A. Seggcn: Efficient 3d point cloud segmentation with fuzzy spherical kernel. In Proceedings of the IEEE/CVF Conference on Computer Vision and Pattern Recognition, Seattle, WA, USA, 13–19 June 2020; pp. 11611–11620. [Google Scholar]
- Zhao, H.; Jiang, L.; Fu, C.W.; Jia, J. Pointweb: Enhancing local neighborhood features for point cloud processing. In Proceedings of the IEEE/CVF Conference on Computer Vision and Pattern Recognition, Long Beach, CA, USA, 15–20 June 2019; pp. 5565–5573. [Google Scholar]
- Thomas, H.; Qi, C.R.; Deschaud, J.E.; Marcotegui, B.; Goulette, F.; Guibas, L.J. Kpconv: Flexible and deformable convolution for point clouds. In Proceedings of the IEEE/CVF International Conference on Computer Vision, Long Beach, CA, USA, 15–20 June 2019; pp. 6411–6420. [Google Scholar]
- Chen, C.; Fragonara, L.Z.; Tsourdos, A. GAPointNet: Graph attention based point neural network for exploiting local feature of point cloud. Neurocomputing 2021, 438, 122–132. [Google Scholar] [CrossRef]
- Wang, Z.; Wang, Y.; An, L.; Liu, J.; Liu, H. Local transformer network on 3d point cloud semantic segmentation. Information 2022, 13, 198. [Google Scholar] [CrossRef]
- He, L.; She, J.; Zhao, Q.; Wen, X.; Guan, Y. Boundary–Inner Disentanglement Enhanced Learning for Point Cloud Semantic Segmentation. Appl. Sci. 2023, 13, 4053. [Google Scholar] [CrossRef]
- Robert, D.; Raguet, H.; Landrieu, L. Scalable 3D Panoptic Segmentation As Superpoint Graph Clustering. arXiv 2024, arXiv:2401.06704. [Google Scholar]
- Wu, W.; Qi, Z.; Fuxin, L. Pointconv: Deep convolutional networks on 3d point clouds. In Proceedings of the IEEE/CVF Conference on Computer Vision and Pattern Recognition, Long Beach, CA, USA, 15–20 June 2019; pp. 9621–9630. [Google Scholar]
- Sun, Y.; Guo, X.; Yang, H. Win-Former: Window-Based Transformer for Maize Plant Point Cloud Semantic Segmentation. Agronomy 2023, 13, 2723. [Google Scholar] [CrossRef]
- Zhang, L.; Zhang, K. Semi-Supervised Semantic Segmentation Network for Point Clouds Based on 3D Shape. Appl. Sci. 2023, 13, 3872. [Google Scholar] [CrossRef]
- Wu, C.; Zheng, J.; Pfrommer, J.; Beyerer, J. Attention-Based Point Cloud Edge Sampling. In Proceedings of the 2023 IEEE/CVF Conference on Computer Vision and Pattern Recognition (CVPR), Vancouver, BC, Canada, 17–24 June 2023; pp. 5333–5343. [Google Scholar]
Figure 1.
Point cloud construction hypergraph process.

Figure 2.
Point cloud segmentation framework based on hypergraph position attention convolution networks. (a) denotes the ResNet-like module, (b) denotes the hypergraph position attention convolution module, and (c) denotes the skip connection module.
Figure 2.
Point cloud segmentation framework based on hypergraph position attention convolution networks. (a) denotes the ResNet-like module, (b) denotes the hypergraph position attention convolution module, and (c) denotes the skip connection module.

Figure 4.
Visualization of the semantic segmentation results of the S3IDS dataset on Area 5.

Figure 5.
mIoU changes on the validation set.

Figure 6.
The accuracy change on the test set when D is 16 and 32.

Figure 7.
Influence of the number of sampling points.

Table 3.
Comparison of the computational complexity of FLOPs for different models (M denoted ).
| Dataset | Method | FLOPs |
|---|---|---|
| S3IDS [40] | PAConv [42] | 1253 |
| KPConv [46] | 2042 | |
| ours | 1159 | |
| ShapeNet Part [41] | PAConv [42] | 1963 |
| ours | 1846 |
Table 4.
Influence of convolution module on the model.
| Convolution Module | FLOPs |
|---|---|
| With | 1159 M |
| Without | 1302 M |
Table 5.
Influence of different hyperedge information for concatenation (%).
| Method | mIoU |
|---|---|
| features||features | 61.28 |
| xyz||features | 64.91 |
| xyz||local xyz | 66.79 |
Table 6.
Influence of the number of weight matrices on the model (%).
| D | mIoU | FLOPs |
|---|---|---|
| 4 | 65.01 | 697 |
| 8 | 65.26 | 815 |
| 16 | 66.79 | 1159 |
| 32 | 64.85 | 1401 |
Table 7.
Influence of convolutional layers (%).
| Later | mIoU | OA |
|---|---|---|
| 1 | 63.8 | 88.6 |
| 2 | 65.3 | 88.9 |
| 3 | 66.8 | 89.3 |
| 4 | 65.9 | 89.1 |
Disclaimer/Publisher’s Note: The statements, opinions and data contained in all publications are solely those of the individual author(s) and contributor(s) and not of MDPI and/or the editor(s). MDPI and/or the editor(s) disclaim responsibility for any injury to people or property resulting from any ideas, methods, instructions or products referred to in the content. |
© 2024 by the authors. Licensee MDPI, Basel, Switzerland. This article is an open access article distributed under the terms and conditions of the Creative Commons Attribution (CC BY) license (https://creativecommons.org/licenses/by/4.0/).
Share and Cite
MDPI and ACS Style
Rong, Y.; Nong, L.; Liang, Z.; Huang, Z.; Peng, J.; Huang, Y. Hypergraph Position Attention Convolution Networks for 3D Point Cloud Segmentation. Appl. Sci. 2024, 14, 3526. https://doi.org/10.3390/app14083526
AMA Style
Rong Y, Nong L, Liang Z, Huang Z, Peng J, Huang Y. Hypergraph Position Attention Convolution Networks for 3D Point Cloud Segmentation. Applied Sciences. 2024; 14(8):3526. https://doi.org/10.3390/app14083526
Chicago/Turabian StyleRong, Yanpeng, Liping Nong, Zichen Liang, Zhuocheng Huang, Jie Peng, and Yiping Huang. 2024. "Hypergraph Position Attention Convolution Networks for 3D Point Cloud Segmentation" Applied Sciences 14, no. 8: 3526. https://doi.org/10.3390/app14083526
Note that from the first issue of 2016, this journal uses article numbers instead of page numbers. See further details here.