
Shear Strength and Durability of Expansive Soil Treated with Recycled Gypsum and Rice Husk Ash
by
 , ,
, ,
Mary Ann Adajar
*,
Jomari Tan
 ,
,
Allaina Bernice Ang
,
Miles Louis Lim
,
Kendrick Roy Seng
and
Vince Patrick Sy
Department of Civil Engineering, De La Salle University, Manila 1004, Philippines
*
Author to whom correspondence should be addressed.
Appl. Sci. 2024, 14(9), 3540; https://doi.org/10.3390/app14093540
Submission received: 9 March 2024
/
Revised: 15 April 2024
/
Accepted: 17 April 2024
/
Published: 23 April 2024
(This article belongs to the Section Civil Engineering)
Abstract
:Featured Application
This research paper encourages repurposing waste material for ground improvement. The results of this study contribute towards a greater understanding of the strength and durability performance of treated soils under normal, fluctuating, and adverse moisture conditions.
Abstract
Expansive soil underlying structures pose a significant risk to the integrity of superstructures. Chemical soil stabilization can be used to strengthen soils due to the cost and impracticality of mechanical approaches. Waste materials such as recycled gypsum and rice husk ash have been considered alternatives because of their sustainable and economic advantages. A combination of these additives was used to address the high absorption of gypsum and the lack of cohesion of the pozzolan. The study assessed the short-term and long-term performance of expansive soil treated with recycled gypsum and rice husk ash under normal and fluctuating moisture conditions. Direct shear tests indicated ductile and compressive soil behavior with improved shear strength. A good approximation of stress–strain response was made with a modified hyperbolic model for treated soils that exhibited strain hardening and compressive volumetric strain. Durability and water immersion tests were performed for samples after varying curing periods and cycles of capillary soaking to assess the behavior when exposed to varied environmental conditions. Samples under the modified durability test experienced significant strength loss, with decreasing compressive strength as curing durations increased. Specimens in the modified water immersion test experienced significant strength loss; however, it was determined that curing durations did not contribute to the change in the strength of the sample. Expansion index tests also determined that the treatment effectively mitigated expansivity and collapsibility in all samples. Despite improvement in shear strength and expansion potential, further investigation is needed to enhance the durability of soil treated with gypsum and rice husk ash.
1. Introduction
Expansive soils consist of fine-grained particles that allow for significant modification in their entire volume [1]. The shrink-swell behavior of expansive soils can be attributed to montmorillonite [2], which enables notable volumetric changes due to their expanding lattice structure [3]. The climate conditions in tropical regions establish a wet–dry cycle, thus making expansive soil swell during the rainy season and shrink, leading to cracks during the dry period [4]. The Philippine climate is characterized by a dry season from December to May and a rainy season from June to November. However, this delineation has been altered by the impact of climate change on the country. As a result, fluctuating weather conditions are more likely to occur in subsequent years [5]. This repetitive wet–dry cycle poses threats to the integrity of the soil structure.
The prevalence of fertile land classified as clay in the Philippines exposes large areas to this extreme shrink-swell behavior [6]. Expansive soils are often not recognized in projects, yet they can be found to be highly prevalent throughout the country. Morales and Morales [7] cited shrink-swell behavior in soils as incorrectly identified as settlement. Furthermore, they explained that expansive soils in the Philippines are formed due to the flooding of low-lying areas containing volcanic ash deposits. Research on expansive volcanic soils has been mainly focused on their viability as landfill liners. Mendoza et al. [8] revealed that smectite in Manila indicates moderate to high plasticity indices and low hydraulic conductivity values ideal for landfill lining. Research by Tiongson and Adajar [9] on compacted clay linings was conducted in response to the imminent operation of a sanitary landfill in Kauswagan, Lanao del Norte, and nearby municipalities. Local soil samples intended as landfill lining material were identified as expansive soils.
The distress caused by shrink-swell soil behavior impacts overlying structures, causing costly damage to life and property. Swelling action has led to cracking and breakup on pavements, roads, building foundations, slab-on-grade members, channel and reservoir linings, irrigation systems, water lines, and sewer lines [3,10,11]. Muntohar and Hashim [12] also stated that damage done by expansive soils spread over vast areas rather than concentrating on a small locality. Furthermore, expansive soils can lie in inclined areas on embankments, cuttings, and channel slopes, leading to a greater risk of landslides [4]. To address these concerns, engineers often resort to implementing soil stabilization techniques.
Soil stabilization and improvement include the modification of specific properties in a mass of soil to produce improved parameters, bringing forth improved engineering performance [13]. Kilic et al. [14] emphasize that the progress in soil performance should be relevant to its intended use. Some parameters considered and improved in this practice are shear strength, compressibility, density, and hydraulic conductivity. Moreover, soil stabilization improves the California bearing ratio, tensile strength, and friction angle of the subgrade soil used in road and highway construction [15]. Reducing volumetric changes in expansive soil requires the addition of admixtures that aim to modify the swelling behavior of clay [2]. Cement, lime, and fly ash are common additives in stabilizing weak soil types by improving their mechanical properties [16]. The cementitious properties of these agents introduce a considerable increase in the strength of the soil. Like concrete, tricalcium silicate and dicalcium silicate were the compounds responsible for this in cement [17], while calcium oxide corresponded to lime and fly ash. Due to the inclination of the existing literature to these materials, little definitive information can be obtained from other alternative additives [18]. The extensive use of cement and lime made these materials expensive, opening new avenues for cheaper additives such as waste materials [16]. Among these waste materials, those with promising stabilizing potential include gypsum and rice husk ash.
Gypsum is a mineral that is primarily associated with compounds containing calcium sulfate (CaSO4) [19], containing 32.6% calcium oxide, 46.5% sulfur trioxide, and 20.6% water [13]. This material is commonly used in industrial cement and plasterboard production. Recycling plaster boards has been popularized to improve the ground in Japan [15,20,21]. Past findings [19,22] indicate that the disposal of gypsum boards as a waste material harms the environment. Gypsum boards constitute almost 1% of global construction and demolition waste [23]. When present in landfills, sulfates from the gypsum may react with organic material in the paper sheets that hold the material together. This anaerobic reaction produces hydrogen sulfide gas that can harm the health of humans and animals and the well-being of the surrounding environment. While regulations are currently implemented to limit the presence of these materials in disposal sites, more is needed to combat such an issue. Therefore, recycling plasterboards as an additive for soil stabilization should be made known as a viable option for many to consider.
Recent research has shown promising results on adding specific percentages of gypsum to various soil types. Studies have attempted to use gypsum as a stand-alone additive. The investigations by Rahman et al. [16] involved the addition of 20% gypsum to reduce the liquid limit of the tropical peat sample from 144% to 123%. Ahmed, Ugai, and Kamei [21] evaluated high-plasticity clay from Gunma Prefecture in Japan treated with gypsum, which resulted in greater unit weights, with an observed rise from 17.75 kN/m3 to 18.75 kN/m3. This was associated with the particle flocculation exhibited by expansive soil in the presence of calcium components. Positively charged calcium ions are attracted to negatively charged soil particles. The same study determined a significant increase in compressive strength in clayey soil from 50 kPa to 125 kPa. They introduced gypsum into the clay soil-induced particle hardening, which enhanced the cohesive strength between soil grains. Water absorption following the change in the composition of gypsum from its hemihydrate to hydrate forms reduced voids between particles.
In naturally occurring gypsiferous, gypseous, and sulfate-bearing soils, high concentrations of gypsum reduce the capacity of the soil to become an effective subgrade material for roads and highways, particularly when faced with prolonged soaking [24]. Moisture absorption is increased in these soils due to gypsum’s soluble properties, which promote the presence of caverns and pores and continuous settlements. Schanz and Karim [25] also reported problems associated with highly gypsiferous soils with properties such as strength losses and a sharp increase in compressibility when saturated. Ahmed and Issa [20] stated that the solubility of gypsum negatively impacts soil stability due to bonding within the soil being undermined. The inclusion of gypsum in the soil introduced sulfates in the sample, which can induce swelling, especially in reactions with water. This may prove that a second additive is required to address concerns about gypsum solubility.
Other research tried different proportions of gypsum together with other additives. Sivapullaiah and Jha [26] examined the role of gypsum on the physical and strength behavior of soil stabilized with fly ash-lime. Accelerated strength increase after 14 days for soil with fly ash, 6% lime, and gypsum was observed due to the development of ettringite within the voids and cementitious binders that enhance particle interlock. Kamei, Ahmed, and Shibi [27] investigated using recycled bassanite, produced from gypsum waste, in conjunction with coal ash as a stabilizer material to improve the strength of very soft clay soil. The moisture absorption of bassanite formed calcium hydroxide, which changed to calcium carbonate after a reaction with atmospheric carbon dioxide. Calcium carbonate initiated the hardening process between particles. Despite these positive outcomes, complementary additives have been primarily limited to lime, cement, and fly ash. Although extensive research attests to their effectiveness, there are concerns about the sustainable use of these materials.
Rice husk is defined as the external layer of the rice grain obtained as a by-product in rice milling [28]. This layer constitutes about 23% of the initial weight of a rice grain [29]. From the estimated 545 million metric tons of global rice production [30], one-fifth of the worldwide rice paddy cultivation was converted to rice husk [31]. Most global production is attributable to several Southeast Asian countries with favorable soil and climate conditions. While rice production is significant, issues in disposal arise due to the sheer abundance of harvest, the lack of nutritional value, and the long decomposition time [32].
Rice husk is mainly composed of several organic materials such as hemicellulose, cellulose, and lignin. These components comprise 75–90% of the material, while approximately 17–20% includes ash primarily composed of silica and other metallic impurities such as iron, manganese, calcium, sodium, potassium, and magnesium [28]. Basha et al. [33] discussed that the abundance of silicates in plant cuticles like rice husks is widespread among crops grown regularly. Rice husk is converted to ash form through thermal decomposition or burning. Depending on the component, temperature, and burning time, this process produces non-crystalline silica ash, which contains pozzolanic properties [29]. This feature makes the material a possible admixture for expansive soils [33].
Muntohar [12] added 7.5%, 10%, and 12.5% rice husk ash (RHA) combined with 2, 4, 6, and 10 percent lime by dry weight on Indonesian soils, decreasing the plasticity index. Adajar et al. [34] determined that 20% and 25% RHA effectively reduced the expansion index to a very low potential according to ASTM D4829-11 [35] criteria. However, the same RHA contents resulted in a decrease in maximum dry density and unconfined compression strength and an increase in optimum moisture content. These are indicators that RHA requires a cementitious binder to produce an increase in strength. Eliaslankaran et al. [36] added 8% lime to 16% RHA, which saw a significant improvement in the optimal moisture content (10%), a friction angle of 38.5 degrees (770% increase), and an improved maximum shear strength (46% increase).
This study treated Kauswagan clay with varying amounts of recycled gypsum and rice husk ash to assess its shear strength and durability characteristics. Previous work by Tan and Adajar [37] and Adajar and Valbuena [6] highlighted the efficacy of rice husk ask and recycled gypsum in treating the shrink-swell potential of expansive soils. However, previous studies only focused on the short-term performance of several index properties. The present research subjected expansive soils treated with varying proportions of recycled gypsum mixture to direct drained shear loading to identify shear strength parameters. Although gypsum and RHA effectively improve several properties of expansive soils, each has limitations. Gypsum has cementitious properties, yet also manifests plasticity at high water content. RHA has no cementitious properties, but its lack of cohesion effectively reduces expansion. Therefore, a second round of direct shear tests was performed with soils treated with recycled gypsum and 10% RHA, whose content was adopted from Adajar et al. [34]. Direct shear specimens’ conditions characterized expansive soil’s behavior under short-term loading conditions. The resulting stress–strain behavior was assessed versus the calculated prediction from a modified hyperbolic stress–strain model [38] derived from direct shear test results.
There is also a disparity in the literature comparing the performance of soils treated with a gypsum-RHA combination in short-term shear strength and long-term conditions under fluctuating moisture conditions due to wetting, drying, and flooding. Similar studies can be found from Rao [39], who examined the influence of cyclic drying and wetting on the swelling behavior of lime-treated black cotton and ash-modified soils, and Kamei, Ahmed, and Shibi [27], who explored the durability and strength of very soft clay treated with bassanite and coal ash in dry and wet environmental conditions. Adajar and Edora [40] also assessed the performance of gypsum and RHA in a soaked CBR test. However, these studies have yet to consider variations in the curing period of additive treatment, and the expansion index test is another option to assess the shrink-swell potential of soils after multiple dry–wet cycles.
The results of this study can help identify new approaches to improving the strength and durability of expansive soils under varied curing and moisture conditions. Investigating low-cost and waste materials such as recycled gypsum and rice husk ash to enhance the engineering properties of weak expansive soils may show potential to reduce the number of harmful substances deposited in waste disposals that contribute to the cumulative impact of pollution on the environment. Utilizing natural and recycled gypsum as a primary additive and a complement to established soil stabilization supplements creates new opportunities to openly discuss and analyze its short- and long-term effects on clay soil characteristics. This research may also contribute to the current pool of knowledge built on using gypsum to stabilize the soil. Moreover, new alternatives can be introduced in the construction industry, particularly in the Philippine setting, to propose methods that economize the cost and time of certain construction activities while reducing unattended debris in disposal sites. This investigation may also inspire further explorative work in the local setting, which could likely perform analyses in other critical areas with a significant presence of weak clayey and expansive soils.
2. Materials and Methods
2.1. Kauswagan Clay
The soil to be investigated in this experiment was gathered from Kauswagan, a coastal municipality in the province of Lanao del Norte in the Philippines. This soil was selected for this study to explore its viability for applications other than as a landfill liner for a planned landfill project in the locality. The municipal government identified four types of soil in the Kauswagan lands. These were hydrosol (0.54%), Boac clay loam (30.32%), Adtuyon clay loam at stony phase (38.56%), and Adtuyon clay loam (30.58%). Among these varieties, Adtuyon clay loam coincided with the characteristics of the soil specimen used in various experiments for this research. This soil series is characterized by having developed from volcanic deposits consisting of basalt and andesite boulders. Surface soils were observed to be brown, friable, and granular like clay. Meanwhile, the subsoil is generally darker in color with hints of reddish tint in some cases. Possessing clayey properties, the subsoil is plastic in the presence of moisture, but hard and brittle in dry conditions. Finally, the substratum varies from dark yellowish-brown to light reddish-brown grains; these layers are slightly compacted clay that becomes hard and cloddy in drier states. This soil extends beyond Bukidnon, and is also located in the provinces of Lanao, Misamis Occidental, Zamboanga, and Sulu [41].
2.2. Additives
In this research, recycled gypsum was sourced from a local wet market stall that sells the powder as plaster for nearby construction projects. Recycled gypsum is typically prepared from excess and rejected plasterboard from manufacturing, new construction, and demolition [23]. Contaminants from nails, screws, paint, wall coverings, etc., are removed before the recycling process. The collected waste gypsum is pulverized into powder form and is typically heated at 130 °C to 160 °C. The Energy Dispersive X-ray (EDX) test results indicated the mean elemental distribution in the recycled gypsum in Table 1 and the EDX spectrum in Figure 1.
Rice husk ash was obtained from the Restored Energy Biomass Power Plant in Muntinlupa City. Adajar et al. [34] stated that the company incinerates rice husks at a fixed temperature to produce roughly textured ash. EDX test results indicated the mean elemental distribution in RHA in Table 2 and the spectrum in Figure 2.
2.3. Experimental Setup
This investigation is interested in determining the impact of gypsum and rice husk ash on expansive soil’s shear strength and durability properties. This study used varying gypsum and RHA percentages for the direct shear tests. It also adopted the most effective mixture in the study of Tan and Adajar [37] (15% gypsum + 10% RHA) to treat cylindrical expansive soil samples for the durability tests. Five different curing periods were applied to all specimens under air-dried conditions before the unconfined compression strength test was conducted for samples not subjected to moisture fluctuations. Durability and water immersion tests were performed for cured samples treated with gypsum and RHA to assess the impact of moisture fluctuation and inundation on soil strength. The effect on durability was quantified using the collapse index and the percentage of strength loss. The effectiveness of the treatment on the expansion potential of the cured samples was also verified through the expansion index test using an oedometer.
The following standardized laboratory procedures were performed with a methodological sequence shown in Figure 3.
- Shear Strength and Angle of Internal Friction
- Cyclic Wetting–Drying—ASTM D559-03 (Guidelines for Wetting and Drying Compacted Soil–Cement Mixtures) [44].
- ○
- Strength Loss (calculation adopted from Samuel [45]).
- Expansion Index—ASTM D4829-11 (Standard Test Method for Expansion Index of Soils) [35].
- ○
- Collapsibility Index (calculation adopted from Bell [49]).
2.4. Sample Preparation
Clay was crushed and oven-dried before being mixed with recycled gypsum and rice husk ash. The direct shear tests used proportions of 0%, 5%, 10%, and 15% gypsum and 10% RHA. The admixture proportion of 15% gypsum + 10% rice husk ash was selected for the durability tests, as Tan and Adajar [37] reported that this ratio resulted in the most significant maximum dry density, least optimum moisture content, and lowest expansion index, which rendered the sample non-expansive.
The soil was mixed with water to reach the optimum moisture content of 31.395%. Recycled gypsum and rice husk ash were added to the soil–water mixture to prevent the crumbling observed during dry mixing before adding water. The mixed samples were cured inside airtight containers for at least 16 h, as prescribed by ASTM D4829-11. Relative compaction of 90% was targeted to achieve minimum compaction requirements, as suggested by Rahman et al. [50]. This was achieved across all trials using manual tamping.
Variations in curing periods (7, 14, 21, 28, and 35 days) were applied to all untreated and treated samples to observe the strength development in each sample as curing days increased. Air-drying was done for the specified curing period before the unconfined compression strength test, modified durability test, and modified water immersion test. After curing, the soil mixtures were tamped in a mold with an approximate diameter of 50 mm and height of 100 mm, considering the targeted 90% relative compaction. The entire compacted cylindrical sample was used for the unconfined compression test, while smaller portions were cut from the molded sample for the expansion index test.
2.5. Shear Strength
ASTM D3080-11 outlines that the direct shear test on soil specimens is performed in consolidated-drained conditions. In simulating this state, the treated fully saturated sample is contained in a shear box and subjected to normal and shear loading. The normal load consolidates the moist specimen within the apparatus, while a shear load induces horizontal displacement at a constant rate. The shearing rate was adjusted based on the desired type of loading. Simulating short-term loading conditions requires faster displacement rates, while mimicking long-term loading on the specimen would necessitate a slower shearing rate. Based on preliminary consolidation data, the shearing rate for long-term loading conditions was identified as 0.151 mm/min. Shearing was performed on the sample until a lateral displacement of 15 mm was attained. Test results provide a timed log of shear force and horizontal and vertical displacements. These values shall be used to calculate normal and shear stress required for the Mohr–Coulomb failure criterion and to determine the parameters necessary to generate a modified hyperbolic stress–strain model. The experimental design for shear strength tests is shown in Table 3.
2.6. Modified Hyperbolic Model
Employing a constitutive model to illustrate a correlation between stress–strain parameters is essential to characterizing geotechnical materials. Numerical analysis considers several boundary conditions and properties that may be specific to a given type of soil. The hyperbolic stress–strain equations by Duncan and Chang [51] define the stress–strain behavior in a nonlinear elastic constitutive model approximated by a hyperbolic function. Assumptions on soil hardening describe the specimen to be isotropic. In the same triaxial test, Mohr–Coulomb strength parameters c and ϕ are determined with four additional parameters from the resulting stress–strain curve.
The modified hyperbolic model developed by Adajar and Zarco [38] introduces the method of determining the hyperbolic parameters from the direct shear test. Several parameters were replaced in this new model. An initial shear modulus, Gi, is used instead of an initial Young’s modulus. The deviator shear stress was substituted with the failure shear strength. The constant bulk modulus was also replaced with volumetric strain parameters, letting volumetric strain vary against shear strain and normal effective stress. This change produces a reasonable estimate of the gradual change in volumetric strain at all stages of stress and strain. However, the model is not applicable for samples manifesting strain softening or dilatant volume change.
The introduction of shear strength parameters replaces specific parameters from the original hyperbolic model of Duncan and Chang [51], yet retains the form of the equations. The relationship between shear strain γ and shear stress τ can be expressed as a straight-line function like Equation (1). This new equation is shown as follows:
Parameters a and b are the resulting straight-line function’s intercept and slope. These values are the reciprocals of the initial shear modulus (Gi) and asymptotic shear stress (τult), respectively.
The initial shear modulus is determined through the approach proposed by Janbu [52] in Equation (2). This includes the shear modulus number (K), atmospheric pressure (Pa) equal to 101.325 kPa, and the shear modulus exponent (n).
When Equation (2) is transformed logarithmically into a transformed plot, it can be identified that the logarithms of Gi/Pa and σ′/Pa are linearly correlated with the slope of the fitted line as the shear modulus exponent (n).
The asymptotic behavior of the hyperbolic stress–strain plot would require that the failure shear stress (τf) be obtained at 15% horizontal displacement. A failure ratio (Rf) describes the magnitude of the asymptotic shear stress (τult) relative to this failure shear stress; this value also emphasizes that τult will always be greater than τf. This ratio is expressed in Equation (3) as:
The introduction of volumetric strain parameters in the modified hyperbolic model begins with the relationship of the volumetric strain (εv) against the shear strain (γ). The hyperbolic function in Equation (4) determines this behavior.
Parameters α and β are constants derived from test data; α is the intercept of the linearly fit line in a γ/εv versus γ graph, while β is the slope of the same line. These values can also be expressed in a power equation as a function of the normal effective stress, as presented in Equations (5) and (6).
In these equations, and are volumetric strain numbers, while and are volumetric strain exponents. These constants are determined in normalized logarithmic plots of and against /. The volumetric strain numbers are the equivalent normalized and for a normalized confining stress of 1 atmosphere. On the other hand, the volumetric strain exponents are the slope of the resulting straight-line function in the normalized logarithmic plot.
Meanwhile, the failure shear stress is identified through a function of normal effective stress, as expressed with Equation (7).
The angle of internal friction in Equation (8) varies logarithmically with the effective stress given the non-linearity of the failure envelope. This expression is shown as:
Summing all modified hyperbolic parameters in a predictive function, the model can estimate the stress–strain response of the test specimen. The shear stress and the volumetric strain can be approximated through the following equations:
2.7. Unconfined Compression Strength
This study evaluated the strength of both treated and untreated specimens using the unconfined compression strength (UCS) test. The obtained strength values were used to compare strength before and after subjecting specimens to wet–dry cycles for the durability test and submergence for the water immersion test, as shown in Table 4. The data gathered from the compression test trials served as the bases of the response surface model that predicted the UCS of treated soil.
ASTM D2166-16 stipulated that cylindrical samples with a height-to-diameter ratio of 2 must be centered in the loading device before applying axial load. The applied load produced axial strain at a rate of 0.5% to 2% per minute. Deformation, load, and time values were recorded digitally at intervals to generate a stress–strain curve. The corresponding peak stress in the stress–strain diagram is the unconfined compression strength of the specimen. Given that the confining pressure on the sample is zero, plotting the result using a Mohr circle indicates that cohesion is half the value of the unconfined shear strength. This cohesion value is termed as the undrained shear strength of the soil.
2.8. Durability
This study assessed the durability of treated specimens using the modified durability and water immersion tests. The modified durability test adopted from Samuel [45] simulated cyclic wetting and drying due to seasonal moisture fluctuations. Both untreated and treated samples were subjected to the same curing periods of 7, 14, 21, 28, and 35 days. Three trials were allotted for each mix proportion for all the listed curing periods to ascertain the reliability of the results. The number of cycles applied to the modified durability test where each cycle represents the 24 h wetting through capillary soaking and 24 h drying. Averages of the results from the three samples were used in the data analysis. Table 4 displays the experimental setup for the durability tests.
2.9. Strength Loss
Strength loss is a measure of strength reduction after a durability test. The basis of the calculation for strength loss is the unconfined compression test. A positive value from the given equation indicates a decrease in strength, while a negative value implies a corresponding increase in strength. Samuel [45] discussed that strength losses reaching 50% are reasonable when subjected to durability tests.
Equation (11) requires determining the unconfined compression strengths of treated soil to durability tests (UCSDT) and treated soils not subjected to the durability test (UCS).
2.10. Water Immersion
The modified water immersion test simulated extreme flooding conditions characterized by prolonged soil inundation. Wang et al. [47] conducted water immersion tests based on the French standard NF P 94-102-2 [53], where cylindrical samples were submerged in distilled water for 32 days at room temperature. After the prescribed period of submersion, samples were air-dried 2 h before conducting the unconfined compression test. Modifications to the approach by Wang et al. [47] were made to reduce the possibility of sample disintegration. Cylindrical samples were encased in split-type molds with filter paper and submerged for two days. Air-drying lasted for 2 h before performing the unconfined compression test.
2.11. Expansion Index
ASTM D4829-11 determines the expansion index of soils to define their swelling potential numerically. Samples were placed in a metal ring in an oedometer, and two air-dried disks were placed on the top and bottom ends. A pressure of 6.9 kPa was applied for 10 min, followed by inundation with distilled water for 24 h or until a rate of less than 0.005 mm/h was obtained (must be achieved later than 3 h of elapsed time). Additional expansion index tests, as outlined in Table 2, were performed to determine the effectiveness of the additive treatment in reducing the soil swelling potential after exposure to cyclical changes in moisture.
2.12. Collapse Index
Collapsible soils are sensitive to volume change resulting from increased moisture content. The collapse index is a parameter that estimates the potential settlement in a soil layer for a specific site.
Equation (12) calculates collapse strain (εc %) by taking the ratio of the change in specimen height due to swelling or collapse after wetting (Δh2) to the initial height (h1).
2.13. Criteria for Assessment
The shear strength of the treated specimen was examined based on resulting trends in peak shear strengths and angles of internal friction versus the variation in additive content. The stress–strain behavior of each specimen was compared with a modified nonlinear elastic constitutive model that illustrates the correlation between stress–strain parameters using an approximate hyperbolic function.
The durability of the specimen was assessed using the collapse index and strength loss. ASTM D5333-03 classified collapse indices that qualitatively described the degree of specimen collapse after multiple wet–dry cycles. Samuel [45] also considered strength losses reaching 50% reasonable when subjected to durability tests. A response surface model was generated to predict the unconfined compression strength of the treated soil.
Treatment of specimens with expansion indices below 20 after their respective durability tests was deemed effective per the National Structural Code of the Philippines (NSCP) 2015 Section 303.5 [37]. Four criteria are used to consider a sample as expansive. The first three are optional and can be satisfied if the last requirement is achieved.
- Plasticity index of 15 or less and liquid limit higher than 50.
- More than 10% of soil particles pass the No. 200 sieve.
- More than 10% less than 5 μm in size.
- Expansion index greater than 20.
3. Results and Discussion
3.1. Direct Shear Test
Samples subjected to the direct shear test were reconstituted at 90% relative compaction and optimum moisture content to mimic the soil condition at maximum dry density closely. A fully saturated condition was simulated on these test specimens to identify stress–strain behavior at its weakest or most compressible form. In this state, moisture may exert pore water pressure on soil particles, thus influencing the deformation and strength of soil. Although pore water pressure dissipates with time, this depends on the specimen’s permeability. Coarse soils such as sands and gravels create void spaces between grains, facilitating easier moisture flow. In contrast, slightly impermeable media such as expansive and other cohesive soils may dissipate pressure significantly. The direct shear apparatus cannot measure pore water pressure within the shear box; hence, it is necessary to perform a slow loading test to prevent the development of these pressures. ASTM D3080-11 provides equations for determining the shearing rate required for complete pressure dissipation. The elapsed time for failure may be determined at 50% or 90% consolidation, depending on whether log time or root time curve was used. The calculation identified a shearing rate of 0.151 mm/min.
The stress–strain behavior and volumetric change observed in the soil sample and its treated variants are shown in Figure 4, Figure 5 and Figure 6. Positive values in the volumetric strain plots indicate compressive volume change. All specimens subjected to the direct shear test manifested a direct correlation between effective normal stress and shear stresses at failure. In this study, trials with an applied effective stress of 54.50 kPa obtained the most significant stress values for each additive proportion. Samples also exhibited a progressive increase in shear stress, which resulted in a nearly constant value; hence, no definitive peak stress was exhibited. The absence of a peak is most prominent among normally consolidated clays. This type of stress–strain constitutes ductile failure in soils.
Similar levels of increase in shear strength were observed with both gypsum-only and gypsum + RHA samples as shown in Table 7 and Table 8. The rise in gypsum content among these specimen results corresponds to more compact samples. The gypsum-only samples exhibited a steady increase in strength. The 15% gypsum samples attained the highest shear strength values among all tested specimens. However, samples with RHA slightly lowered in strength compared to their gypsum-only counterparts. The same trend in values was observed with the specimen’s failure friction angle. The friction angle increased in value for all gypsum-only specimens and up to 5% gypsum + 10% RHA. The friction angle was 33.9° for untreated soil and rose to 41.7° for soil + 5% gypsum + 10% RHA. However, the friction angle decreased significantly for the remaining samples with RHA, reaching a friction angle of 35.2° for soil with 15% gypsum + 10% RHA. In theory, more compact samples should be able to obtain higher strength values as expected from the specimens with RHA. Still, non-cohesive porous rice husk ash introduced more moisture in the specimen during the saturation process, offsetting the expected increase in strength by adding gypsum. Moreover, samples with RHA have less expansive particles, which may have improved cohesion and, consequently, the strength of the specimen.
3.2. Modified Hyperbolic Model
All tested specimens’ progressive increase in shear strength indicates strain hardening in each soil. Strain increase is coupled with added stiffness, which yields higher strength values. The non-linearity of the stress–strain curve of fine-grained soil and its treated variants can be characterized as asymptotic, highlighted by the general tendency to reach a relatively constant shear strength. This curve behavior is akin to hyperbolic functions modeled by Duncan and Chang [51] and Duncan [55], where approximations are made for the non-linear elastic movement of isotropic soils using finite element methods.
Modifications were applied to the model based on volumetric strain parameters introduced by Adajar [38] to fit results from direct shear tests. Predicted stress–strain and volumetric-strain–shear-strain plots of all specimen proportions are also illustrated as solid lines in Figure 4, Figure 5 and Figure 6. The stress–strain and volumetric-strain–shear-strain plots generated from treated samples formed the basis for calculating the modified hyperbolic model. Transformed plots of shear strain/shear stress vs. shear strain, as shown in Figure 7, display a straight-line function that confirms the hyperbolic stress–strain behavior of the samples.
The modified hyperbolic model determines the initial shear modulus of a given sample through a transformed plot. These graphs define parameters K (shear modulus number) and n (shear modulus exponent). The failure ratio characterizing the difference of shear strength at failure and asymptotic shear strength is also identified. Parameters ϕo and Δϕ defining the relationship between the friction angle and effective stress are also known.
The introduction of volumetric strain parameters highlights modifications in the initial hyperbolic model α and β. A corresponding volumetric strain number and exponent describe the variation of these parameters with the effective stress. For α, these are hyperbolic parameters Ka and m. For β, these are hyperbolic parameters Kb and r. Hyperbolic parameters, which define the calculated shear modulus and volumetric strain parameters, are enumerated in Table 9 and Table 10.
After determining the hyperbolic parameters, the soil’s stress–strain and volume change response can be predicted using Equations (9) and (10) for any normal effective stress and shear strain value. The modified hyperbolic model provides a satisfactory approximation of the specimen’s actual stress–strain response and volumetric change. The disparity between actual and predicted stress–strain values is minimal due to the non-linear behavior of the sheared samples, which closely resembled hyperbolas due to the progressive increase in shear strength. Good estimation was also shown by the model on the volumetric response of the sample despite several slight deviations demonstrated in a few samples. A desirable outcome was attained with the modeling due to the ductile and compressive behavior of the test specimen. Brittle and dilatant responses cannot be modeled adequately due to the inability of the model to predict strain softening and negative volumetric strains.
3.3. Unconfined Compression Strength
The unconfined compression strength of a given soil specimen is the peak axial stress resisted by an unconfined cylindrical soil specimen. The absence of confining pressure in the specimen eases the determination of the undrained shear strength; this value is simply half of the unconfined compressive strength of the sample. A uniform strain rate of 0.25 mm/s was applied to each treated soil.
Table 11 presents untreated samples’ unconfined compressive strength values with varying curing periods. Results show an increase in unconfined compressive strength as each specimen was subjected to a more extended curing period, a similar trend observed by Niyomukiza et al. [56]. This can be attributed to the prolonged pozzolanic reactions within the specimens [57] and thixotropic hardening, which is characterized by the return of soil to a harder state under constant water content or volume conditions from a softening state [58]. This occurs due to the presence of energy imbalances by the rearrangement of soil particles by compacting or remolding soil samples. The disturbed soil from compaction gradually recovers its original strength or stiffness by attractive forces, creating a structure until the equilibrium state of the soil strength is reached.
3.4. Modified Durability Test
The results of the unconfined compression tests conducted on the modified durability samples are summarized in Table 12. Samples cured for prolonged periods had weaker UCS than the 7- and 14-day samples. A sharp decrease in the unconfined compressive strength was observed after the first cycle of the modified durability test, which was kept almost constant across all three cycles. Test results in Table 13 indicate that earlier curing days show better resistance to cyclic wetting and drying, as lower strength losses were recorded for shorter curing periods. This coincided with higher strength values in Table 12 for the same curing periods. The better resistance of earlier curing days may be attributed to rapid exothermic hydration occurring during the first ten days of the early curing stage.
The rapid hydration process contributed to the durability of early curing day samples, such as 7-day and 14-day curing samples, which led to better management of newly introduced water into the hydration process, lowering potential strength loss. However, a significant strength loss was observed when samples were exposed to prolonged wetting and drying. Strength losses from 75% to 95% were incurred after 1, 2, and 3 wet–dry cycles. Similar studies on lime-treated soils revealed significant particle rearrangement after wetting and drying cycles [59]. The first drying cycle induced cracks due to water loss in saturated soil samples, as suction in the soil formed tensile stresses within the specimen. The succeeding wetting cycle exacerbated damage as moisture filled the newly formed cracks, reducing soil strength and stiffness. The contamination of these lime-treated soils containing sulfates increases the risk of induced heave and distress of structures [60].
Strengths of samples after cycles 1, 2, and 3 did not exhibit significant differences due to the initial degradation that occurred in cycle 1. This meant a minimum compression strength was reached before the succeeding cycles. The ingress of water within the sample pores alters the microstructure of the soil, where microcracks develop within the sample, resulting in significant deterioration [61], as observed in cycle one samples.
The modified durability test conducts capillary soaking to allow fluctuation of moisture levels to simulate cyclic wetting and drying [45]. Seasonal water content changes caused by periods of precipitation and evaporation result in volume and void ratio changes in the soil [62]. Water absorption during cyclic wetting led to a decrease in unconfined compressive strength due to a reduction in cohesive forces that ensure particle interlock. Bell [49] suggested that cyclic wetting and drying of soil caused soil particles in residual soils to flocculate. The drying phase initiated the cementation of particles, resulting in relatively large void spaces between aggregated soil lumps. Table 12 showed that the moisture contents ranged from 51.14% to 66.77%, which is noticeably more significant than those of the untreated batch. The increased moisture was induced by capillary rise, allowing rainwater infiltration into the voids through cohesion and surface tension. The water absorption during the exothermic reaction by the pozzolanic stabilizer of the soil contributed to this increase in moisture content [63]. Most samples had increased unconfined compressive strengths with the decrease in moisture content of the soil.
3.5. Modified Water Immersion Test
Table 14 shows the results of samples subjected to modified water immersion, which exhibit minimal unconfined compressive strength. Regardless of curing days, the unconfined compressive strength of the samples was reduced to around 20 to 30 kPa.
Sun et al. [64] noted a reduction in undrained shear strength of soft clay treated with electrokinetic geosynthetics when moisture content increased in the specimens. This inverse relationship is caused by decreased cohesive forces that bind soil particles [65]. The proximity of the strength values with each other (ranging from 20 to 30 kPa) can be attributed to the range of moisture contents falling within 40–60%. The rapid and sudden introduction of water content into the sample caused by the modified water immersion test must be controlled, with the incorporation of lateral support, to help with the durability against extreme wetting conditions of the treated soil.
Table 14 shows that the moisture content of the soil samples varied from 46.62–54.11%. The correlation between the moisture content and the unconfined compressive strength of soils that underwent water immersion has similar levels of consistency compared to samples subjected to the modified durability test, as all samples experienced the same drying and wetting duration of 2 days each. This duration uniformity eliminates potential confounding factors related to different and longer exposure periods.
3.6. Failure Planes Exhibited
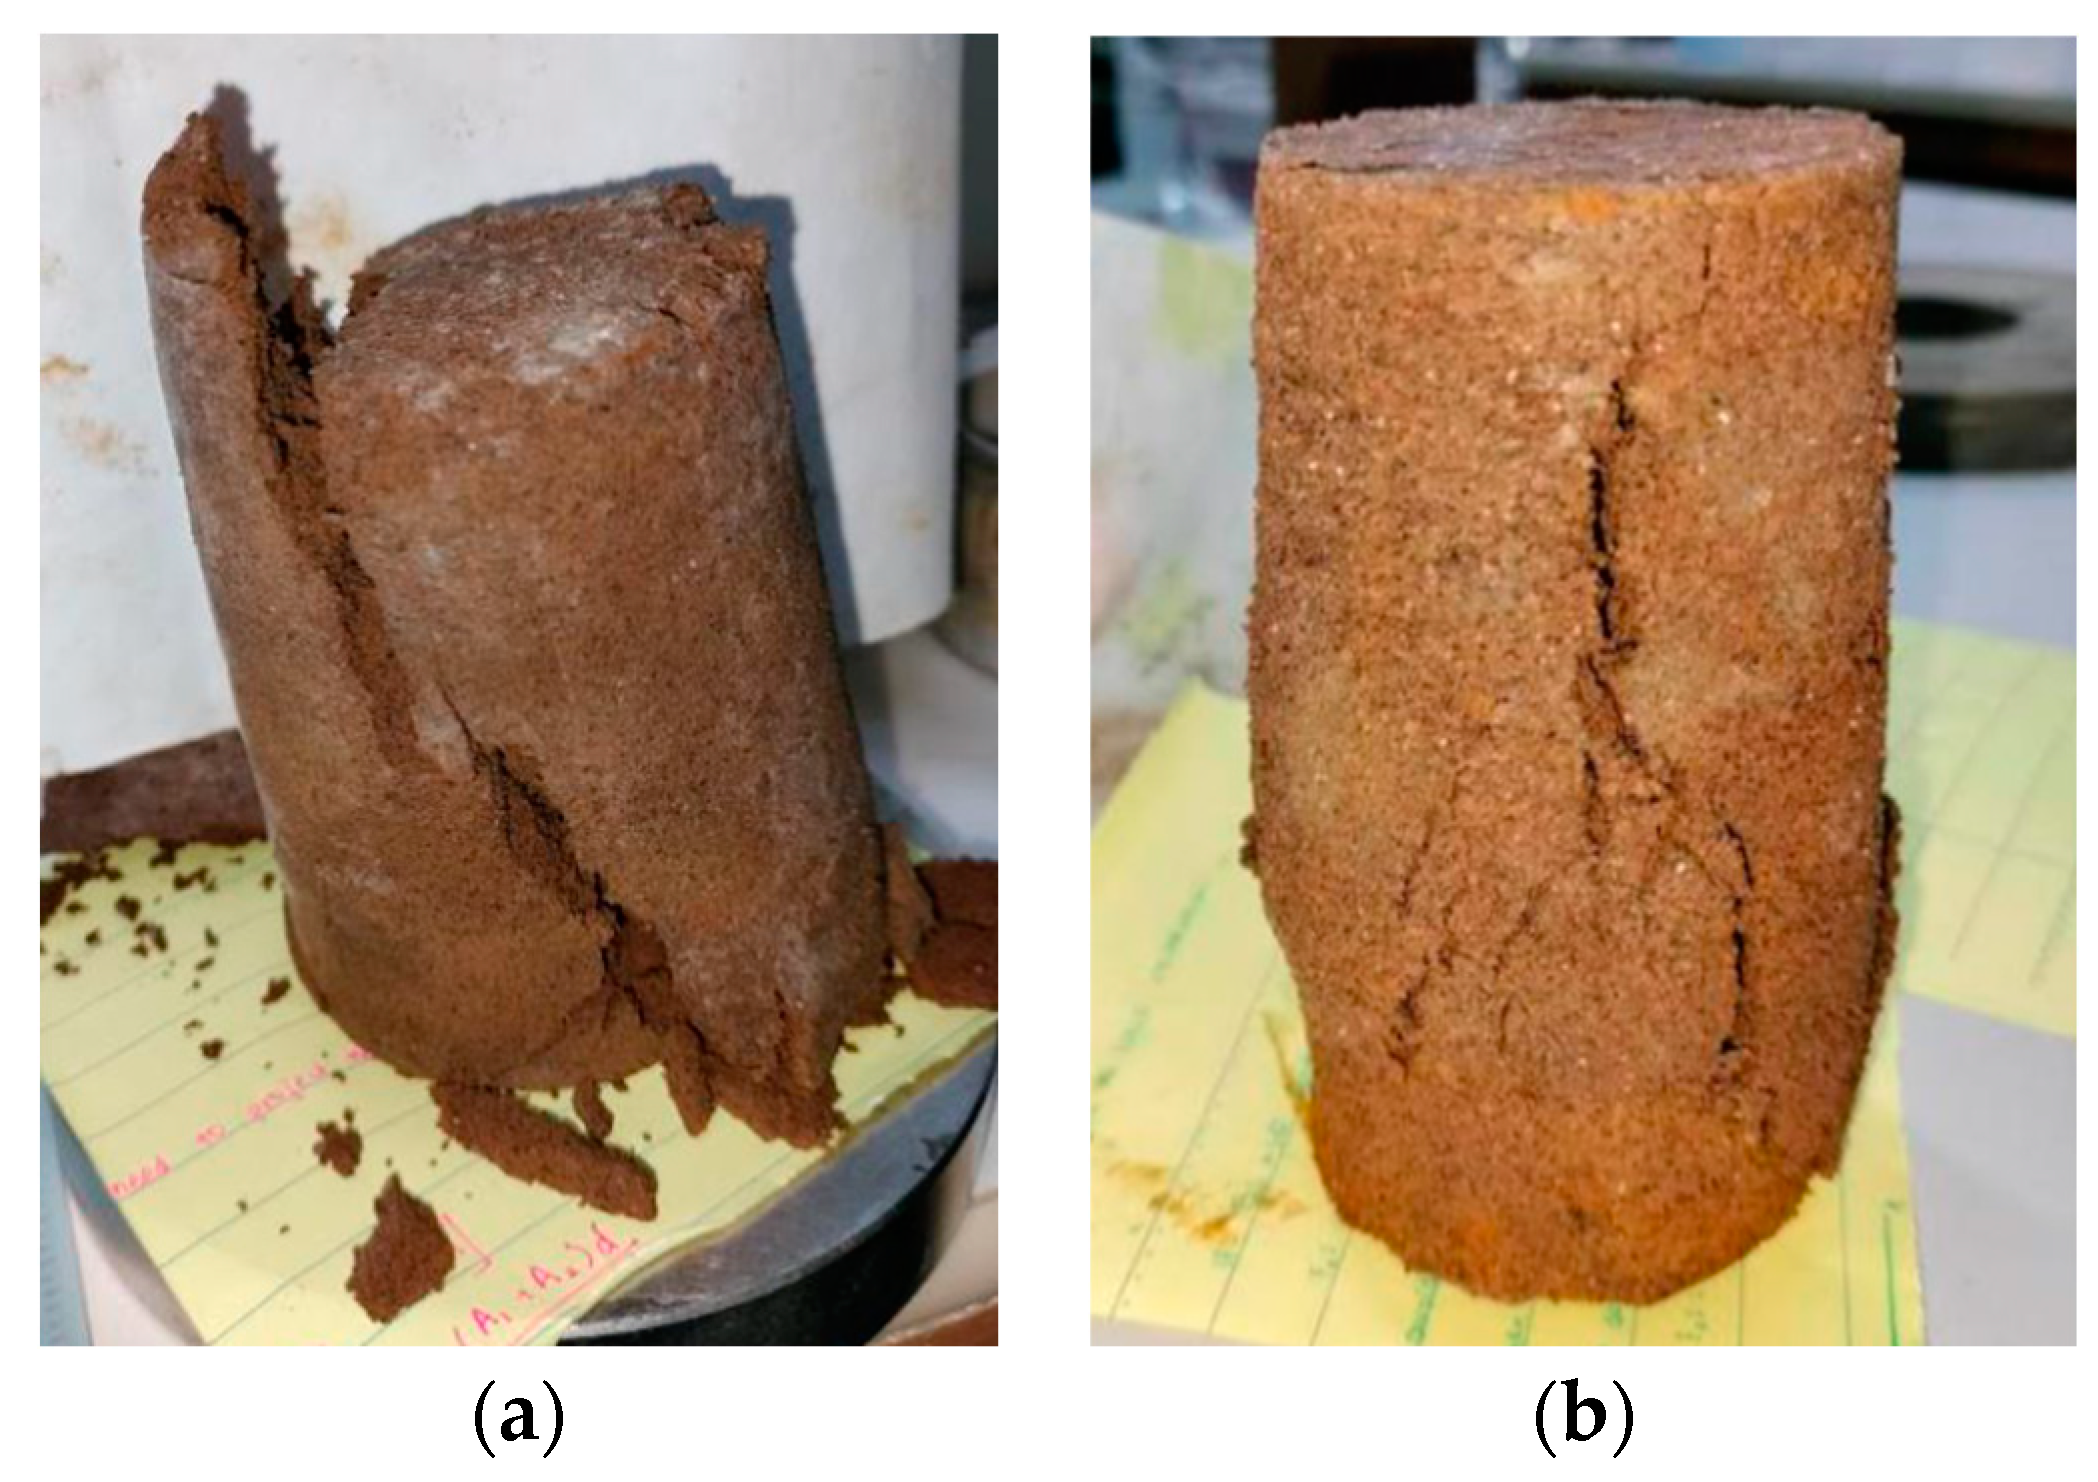
The deformation behavior of soil samples was assessed using the stress–strain curves. Samples not subjected to wet–dry cycles exhibited shear failure characterized by an approximately 45-degree failure plane. Treated specimens subjected to durability and water immersion tests exhibited mild shear with swelling due to bulging failure resulting from the cyclic absorption of the moisture content. Ductile materials exhibit larger axial strain compared to brittle materials. The stress–strain behavior of expansive soils is dependent on the moisture content. Soils on the dry side of the optimum value display brittle behavior, while soils on the wet side display ductile behavior [64]. Samples that did not undergo durability testing incurred brittle failure, as shown in Figure 8a, since test specimens were prepared with moisture that was less than the optimum values. Durability test samples demonstrated hints of ductile behavior, as seen in Figure 8b, where slight bulging occurred with a distinct failure plane in the middle.
The peak normal stress in the untreated sample reached approximately 5% axial strain. The axial strain at peak normal stress was around 8% for the sample subjected to the durability test. The slightly ductile durability test sample absorbed more energy since this material showed a higher percentage of elongation under stress than the brittle material. Moreover, the untreated sample reached a more significant axial stress of 337.63 kPa before failing compared to the test sample subjected to the durability test, which only withstood a load of approximately 28.09 kPa before reaching its failure state.
3.7. Expansion Index
The swelling potential of a given soil specimen is dictated by its expansion index property. Section 303.5 of the NSCP 2015 states that an expansion index of over 20 will be considered expansive. The expansion index of the soil is an essential parameter for civil engineers to look at, as there is a tremendous potential risk for the overlying structures when problematic soil such as this exists. This parameter can also greatly influence the design of the substructure elements found in a structure.
As shown in Table 15, untreated samples do not exhibit expansivity after the introduction of RHA and gypsum. Table 16, Table 17 and Table 18 show the soil samples’ expansion index after being subjected to a modified durability test simulating cyclic wetting and drying. Samples with an admixture proportion of 15% gypsum + 10% rice husk ash could keep their non-expansive properties. Table 19 shows results from another durability test conducted where a modified water immersion simulates intense wetting and drying. Results also show that the admixture proportion could control the soil’s expansivity well despite being rigorously exposed to extreme wetting conditions. However, observations show that soil samples subjected to modified durability tests after 35 days of curing experienced hydro compression instead of swelling. Hydro-compression occurs when soil collapses when exposed to water or any fluid [66]. Ying et al. [67] determined that wetting–drying cycles contribute to volume changes during the compression of lime-treated soils due to the collapse of macro-pores within the sample. This mechanism mainly destroyed the soil structure and played a significant role in soil collapsibility. As shown in Table 16, Table 17, Table 18 and Table 19, the calculated collapsibility index falls below 5%, displaying a low-to-no-collapsibility degree. Despite the hydro compression experienced by the treated soil, the collapsibility index shows that the severity of collapse experienced by the sample is insignificant.
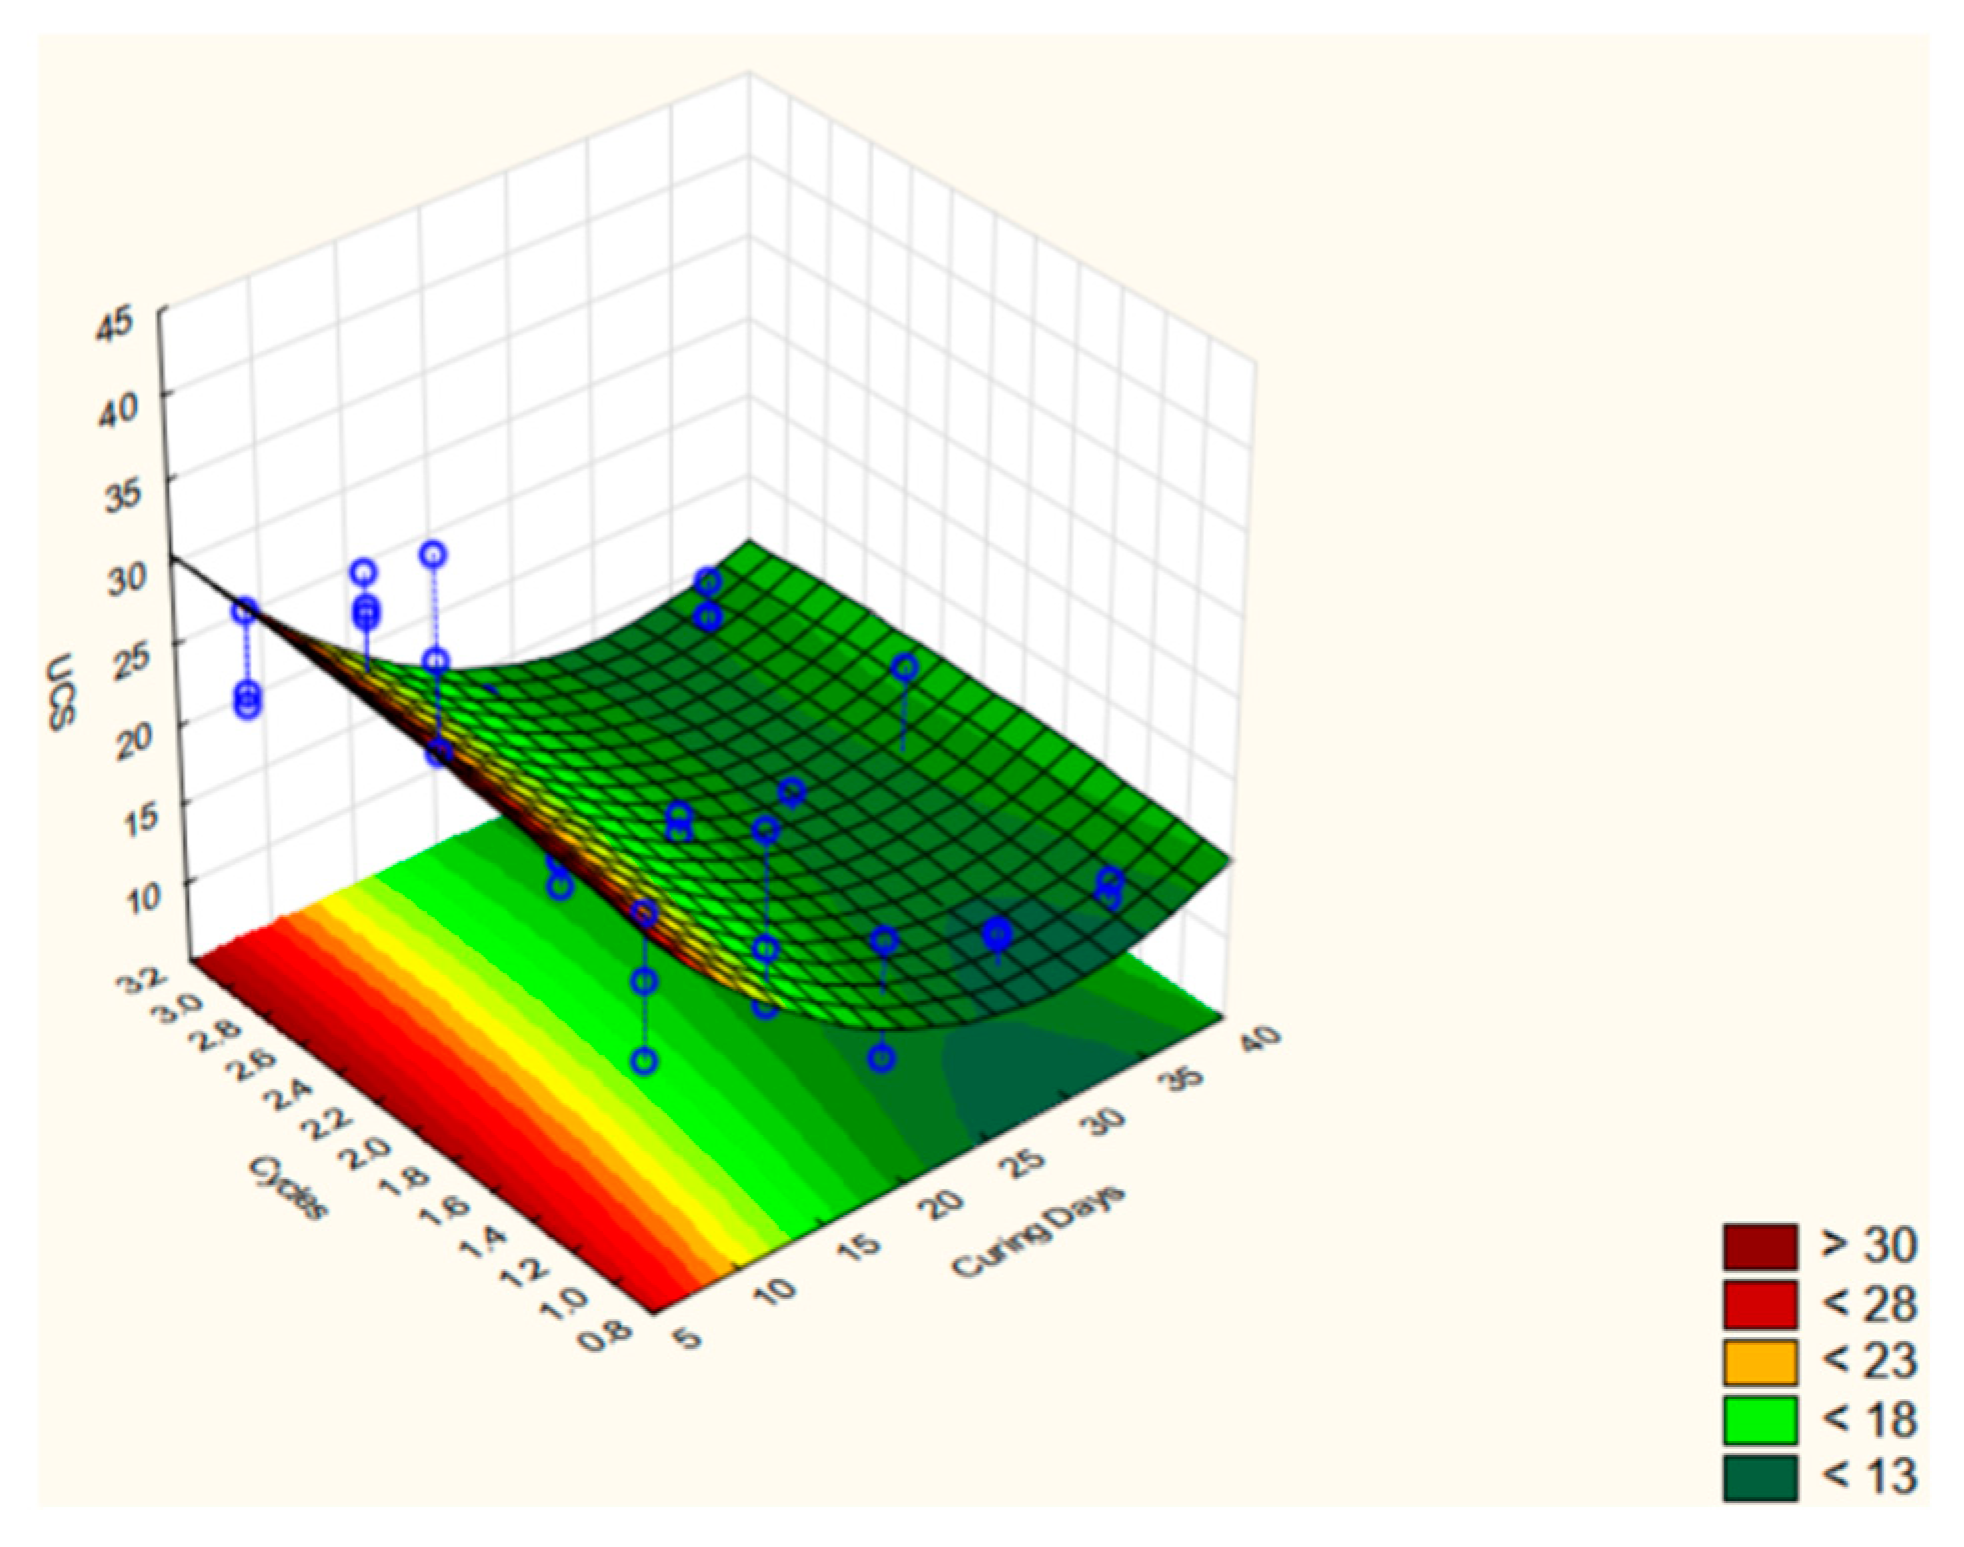
3.8. Effect of Number of Cycles and Curing Days on Unconfined Compression Strength
A response surface model was used to analyze the combined effect of the number of cycles and curing days on the unconfined compression strength of the treated samples. Table 20 summarizes the coefficient of the predictive model with corresponding p-values for each coefficient. A p-value less than 0.05 is required to consider the statistical significance of the independent variable.
With small p-values of only 0.00014 for x1 and x12, the number of curing days is considered statistically significant in the resulting unconfined compression strength values. However, higher p-values were obtained for the number of cycles (x2) and the combined effect of the curing period and cycles (x1×2), indicating that its effect on the UCS is statistically insignificant.
The equation of the surface regression suggests a quadratic fit for the response of the unconfined compression strength to the combined effects of curing days and the number of cycles. The relationship between the three variables is given in Equation (13), with an adjusted R2 of 0.6039, which signifies a medium correlation.
Figure 9 illustrates the fitted surface regression of the unconfined compression strength values across varying curing days and number of cycles. The x-axis represents the curing days, the y-axis represents the number of cycles, and the z-axis represents the strength values. The variation of the surface along the x-axis resembled the shape of a parabola, with the peak situated in the early stages of the curing period, as shown by the dark red surface. The critical point is located along the 30-day curing period, represented by the dark green surface. Variations along the y-axis are minimal, as suggested by the similarity in the color of the contour across different numbers of cycles.
Despite the medium correlation exhibited by the prediction model, the surface regression curve equation is still viable in determining the UCS of the soil using both the number of cycles and curing days in the absence of any available data. Since soil is subjected to infinite wet–dry cycles, it is also helpful to determine a critical number of cycles that will result in total strength loss. Considering the variation along the number of cycles, a quadratic curve is generated to visualize the anticipated loss of strength, as shown in Figure 10. The curve trend suggests a total loss of strength after eight cycles as UCS reached a value of only 0.39 kPa. It must be noted that the developed response surface model is only applicable to the treated expansive soil in this study and will need further verification for other types of soil or additives.
4. Conclusions
Gypsum was introduced into fine-grained soils considered expansive to evaluate the effectiveness of the admixture in stabilizing expansive soils under short- and long-term conditions. A fixed amount of 10% RHA was added as a complementary additive to gypsum to address their respective weakness in soil improvement. The test soil samples and additives were proportioned in the treated specimen by volume. The outcome of various laboratory tests based on ASTM standards converge to the following conclusions.
Drained direct shear test samples exhibited ductile and compressive behavior at different normal effective stresses. A rise in shear strength resulted from increased additive content for gypsum-only specimens. Samples with 15% gypsum achieved the highest shear strength. A decrease in strength occurred with the addition of RHA. Similar behavior was recorded with the friction angle of gypsum-only samples, which yielded high-angle values. Peak friction angle was achieved at 5% gypsum + 10% RHA, but was followed by a significant drop with further addition of gypsum.
The ductile behavior shown by the stress–strain response of the test specimen exhibited a hyperbolic form. A modified hyperbolic model was generated to predict the treated specimen’s shear-stress–shear-strain and volumetric-strain–shear-strain relationship. The resulting model yielded a reasonable projection of the stress–strain and volumetric-strain–shear-strain response due to the ductile and compressive behavior of the test specimen.
The durability of specimens with 15% recycled gypsum and 10% was assessed by comparing the unconfined compression strengths of trials not subjected to moisture fluctuations and trials subjected to wet–dry cycles and water immersion. Control specimens manifested a linear increase in compressive strength with longer curing days. Treated samples subjected to durability tests showed significant strength loss compared to control samples, regardless of the number of cycles. Samples with shorter curing days withstood the cyclic wetting and drying better as new water was introduced during the early curing stage. Rapid exothermic hydration occurred during the first ten days of curing. The results indicate that the curing period influences the resistance of soil to cyclic wetting and drying, as opposed to the number of cycles of capillary soaking.
Subsequent expansion index tests determined that treated samples subjected to durability tests had reached a very low expansion potential. All samples also experienced hydro-compression settlement due to water intrusion into the pore spaces. However, the collapse strain of the soil sample shows that the treated soil has a negligible degree of collapsibility.
A response surface methodology generated a predictive model for the UCS of soil as a function of curing days and number of cycles. It was identified that eight wetting and drying cycles would result in the complete loss of soil strength. With this model, the unconfined compressive strength of the treated soil can be determined at any curing day and any value of the wetting and drying cycle. Without available data, the model can evaluate the critical number of wetting and drying cycles for soil treated with 15% gypsum and 10% RHA free of sulphatic contamination under in situ conditions.
Based on test results, the RHA-gypsum admixture is an effective treatment to control the expansiveness of the soil; however, the treated soil has some concerns about its durability when exposed to moisture fluctuation and extreme wetting conditions. Under these circumstances, the soil treated with RHA and gypsum must include additional preventive measures to maintain the soil’s mechanical properties. Further research on other gypsum-RHA proportions or any other materials with cementitious and pozzolanic properties can be conducted to explore approaches to improving soil durability. A one-dimensional swell or collapse test (ASTM D4546-21—Method C) [68] is suggested to assess the effects of treatment on hydro-compression and long-term settlement. Additionally, the soil microstructure can be investigated using SEM after cyclic wetting and drying to contextualize the occurrence of strength losses in this study.
Author Contributions
Experimentation and data analysis were the responsibilities of J.T., A.B.A., M.L.L., K.R.S., and V.P.S. for their master’s thesis (J.T.) and undergraduate thesis (the remaining four authors) under the supervision of M.A.A. as thesis adviser. Conceptualization, checking of analysis, review, writing, and editing of the paper for journal submission were the responsibilities of J.T. and M.A.A. All authors have read and agreed to the published version of the manuscript.
Funding
This research was partially funded by the Department of Science and Technology (Philippines) under the Engineering Research and Development for Technology (ERDT) grant.
Data Availability Statement
The data presented in this study are available on request from the corresponding author. The data are not publicly available due to privacy.
Conflicts of Interest
The authors declare no conflicts of interest.
References
- Dang, L.C.; Hasan, H.; Fatahi, B.; Jones, R.; Khabbaz, H. Enhancing the Engineering Properties of Expansive Soil Using Bagasse Ash and Hydrated Lime. Int. J. Geomate 2021, 11, 2447–2454. [Google Scholar] [CrossRef]
- Çokça, E. Use of Class C Fly Ashes for the Stabilization of an Expansive Soil. J. Geotech. Geoenviron. Eng. 2001, 127, 568–573. [Google Scholar] [CrossRef]
- Chittoori, B.C.S.; Mishra, D.; Islam, K.M. Forensic Investigations into Recurrent Pavement Heave from Underlying Expansive Soil Deposits. Transp. Res. Rec. 2018, 2672, 118–128. [Google Scholar] [CrossRef]
- Shi, B.; Chen, S.; Han, H.; Zheng, C. Expansive Soil Crack Depth under Cumulative Damage. Sci. World J. 2014, 2014, e498437. [Google Scholar] [CrossRef]
- Mitchell, P.W. Climate Change Effects on Expansive Soil Movements; The International Society for Soil Mechanics and Geotechnical Engineering: Paris, France, 2013. [Google Scholar]
- Adajar, M.A.; Valbuena, K. Optimization of the Strength Properties of Expansive Soil Stabilized with Agricultural Wastes. Int. J. GEOMATE 2021, 21, 35–41. [Google Scholar] [CrossRef]
- Morales, E.M.; Morales, M.K. Expansive Soils—Identification, Detection and Remediation Strategies. 2004. Available online: https://globaluserfiles.com/media/119046_fc7e0c63036d7d756dd4073e61e7cfc3574792da.pdf/o/expansive_soils_identification_detection_and_remediation_strategies.pdf (accessed on 16 April 2024).
- Mendoza, E.P.; Catane, S.; Pascua, C.; Zarco, M. Geological and Geotechnical Characteristics of Metro Manila Volcanic Soils and Their Suitability for Landfill Soil Liner. In Proceedings of the EGU General Assembly Conference Abstracts, Vienna, Austria, 2–7 May 2010. [Google Scholar]
- Tiongson, J.; Adajar, M.A. Hydraulic Conductivity Characteristics of a Fine-Grained Soil Potential for Landfill Liner Application. Int. J. GEOMATE 2021, 20, 56–61. [Google Scholar] [CrossRef]
- Rogers, J.D.; Olshansky, R.; Rogers, R. Damage to Foundations from Expansive Soils. Claims People 2004, 3, 1–4. [Google Scholar]
- Phanikumar, B.R. Expansive Soils—Problems and Remedies. Expans. Soils 2009, 1, 907–913. [Google Scholar]
- Muntohar, A.S.; Hashim, R. A Study of Expansive Clay Treated with LRHA. In Proceedings of the 2nd World Engineering Congress (WEC2002), Sarawak, Malaysia, 22–25 July 2002. [Google Scholar]
- Kuttah, D.; Sato, K. Review on the Effect of Gypsum Content on Soil Behavior. Transp. Geotech. 2015, 4, 28–37. [Google Scholar] [CrossRef]
- Kiliç, R.; Küçükali, Ö.; Ulamiş, K. Stabilization of High Plasticity Clay with Lime and Gypsum (Ankara, Turkey). Bull. Eng. Geol. Environ. 2016, 75, 735–744. [Google Scholar] [CrossRef]
- Ahmed, A.; Ugai, K.; Kamei, T. Investigation of Recycled Gypsum in Conjunction with Waste Plastic Trays for Ground Improvement. Constr. Build. Mater. 2011, 25, 208–217. [Google Scholar] [CrossRef]
- Rahman, Z.A.; Lee, J.Y.Y.; Rahim, S.A.; Lihan, T.; Idris, W.M.R. Application of Gypsum and Fly Ash as Additives in Stabilization of Tropical Peat Soil. J. Appl. Sci. 2015, 15, 1006–1012. [Google Scholar] [CrossRef]
- Lavagna, L.; Nisticò, R. An Insight into the Chemistry of Cement—A Review. Appl. Sci. 2023, 13, 203. [Google Scholar] [CrossRef]
- Yilmaz, I.; Civelekoglu, B. Gypsum: An Additive for Stabilization of Swelling Clay Soils. Appl. Clay Sci. 2009, 44, 166–172. [Google Scholar] [CrossRef]
- Claisse, P.A.; Ganjian, E. Briefing: Gypsum: Prospects for Recycling. Constr. Mater. 2015, 159, 3–4. [Google Scholar] [CrossRef]
- Ahmed, A.; Issa, U.H. Stability of Soft Clay Soil Stabilised with Recycled Gypsum in a Wet Environment. Soils Found. 2014, 54, 405–416. [Google Scholar] [CrossRef]
- Ahmed, A.; Ugai, K.; Kamei, T. Laboratory and Field Evaluations of Recycled Gypsum as a Stabilizer Agent in Embankment Construction. Soils Found. 2011, 51, 975–990. [Google Scholar] [CrossRef]
- Kobayashi, M.; Ahmed, A.; Ugai, K. Improvement Properties of Cohesion-Less Soil Using Recycled Bassanite. JCEA 2013, 7, 1566. [Google Scholar] [CrossRef]
- Bumanis, G.; Zorica, J.; Korjakins, A.; Bajare, D. Processing of Gypsum Construction and Demolition Waste and Properties of Secondary Gypsum Binder. Recycling 2022, 7, 30. [Google Scholar] [CrossRef]
- Razouki, S.S.; Kuttah, D.K. Effect of Soaking Period and Surcharge Load on Resilient Modulus and California Bearing Ratio of Gypsiferous Soils. Q. J. Eng. Geol. Hydrogeol. 2004, 37, 155–164. [Google Scholar] [CrossRef]
- Schanz, T.; Karim, H.H. Geotechnical Characteristics of Some Iraqi Gypseous Soils. MATEC Web Conf. 2018, 162, 01005. [Google Scholar] [CrossRef]
- Sivapullaiah, P.V.; Jha, A. Gypsum Induced Strength Behaviour of Fly Ash-Lime Stabilized Expansive Soil. Geotech. Geol. Eng. 2014, 32, 1261–1273. [Google Scholar] [CrossRef]
- Kamei, T.; Ahmed, A.; Shibi, T. The Use of Recycled Bassanite and Coal Ash to Enhance the Strength of Very Soft Clay in Dry and Wet Environmental Conditions. Constr. Build. Mater. 2013, 38, 224–235. [Google Scholar] [CrossRef]
- Bakar, R.A.; Yahya, R.; Gan, S.N. Production of High Purity Amorphous Silica from Rice Husk. Procedia Chem. 2016, 19, 189–195. [Google Scholar] [CrossRef]
- Della, V.P.; Kühn, I.; Hotza, D. Rice Husk Ash as an Alternate Source for Active Silica Production. Mater. Lett. 2002, 57, 818–821. [Google Scholar] [CrossRef]
- Srivastava, V.C.; Mall, I.D.; Mishra, I.M. Characterization of Mesoporous Rice Husk Ash (RHA) and Adsorption Kinetics of Metal Ions from Aqueous Solution onto RHA. J. Hazard. Mater. 2006, 134, 257–267. [Google Scholar] [CrossRef] [PubMed]
- Hwang, C.L.; Chandra, S. 4—The Use of Rice Husk Ash in Concrete. In Waste Materials Used in Concrete Manufacturing; Chandra, S., Ed.; William Andrew Publishing: Westwood, NJ, USA, 1996; pp. 184–234. [Google Scholar] [CrossRef]
- Chen, R.; Congress, S.S.C.; Cai, G.; Duan, W.; Liu, S. Sustainable Utilization of Biomass Waste-Rice Husk Ash as a New Solidified Material of Soil in Geotechnical Engineering: A Review. Constr. Build. Mater. 2021, 292, 123219. [Google Scholar] [CrossRef]
- Basha, E.A.; Hashim, R.; Mahmud, H.B.; Muntohar, A.S. Stabilization of Residual Soil with Rice Husk Ash and Cement. Constr. Build. Mater. 2005, 19, 448–453. [Google Scholar] [CrossRef]
- Adajar, M.A.; Aquino, J.; Dela Cruz, J.; Martin, C.P.; Urieta, D.K. Investigating the Effectiveness of Rice Husk Ash as Stabilizing Agent of Expansive Soil. Int. J. GEOMATE 2019, 16, 33–40. [Google Scholar] [CrossRef]
- ASTM D4829-11; Standard Test Method for Expansion Index of Soils. American Society for Testing and Materials: West Conshohocken, PA, USA, 2011.
- Eliaslankaran, Z.; Daud, N.N.N.; Yusoff, Z.M.; Rostami, V. Evaluation of the Effects of Cement and Lime with Rice Husk Ash as an Additive on Strength Behavior of Coastal Soil. Materials 2021, 14, 1140. [Google Scholar] [CrossRef]
- Tan, J.; Adajar, M.A. Recycled Gypsum and Rice Husk Ash as Additives in the Stabilization of Expansive Soil. Int. J. GEOMATE 2020, 18, 197–202. [Google Scholar] [CrossRef]
- Adajar, M.Q.; Zarco, M.H. Predicting the Stress-Strain Behavior of Mine Tailing Using Modified Hyperbolic Model. Int. J. GEOMATE 2016, 10, 1834–1841. [Google Scholar] [CrossRef]
- Rao, S.M.; Reddy, B.V.V.; Muttharam, M. The Impact of Cyclic Wetting and Drying on the Swelling Behaviour of Stabilized Expansive Soils. Eng. Geol. 2001, 60, 223–233. [Google Scholar] [CrossRef]
- Adajar, M.Q.; Edora, A. Strength and Permeability Characteristics of Expansive Soil with Gypsum and Rice Husk Ash. Int. J. GEOMATE 2021, 21, 28–34. [Google Scholar]
- Carating, R.B.; Galanta, R.G.; Bacatio, C.D. The Soils of the Philippines; World Soils Book Series; Springer: Dordrecht, The Netherlands, 2014. [Google Scholar] [CrossRef]
- ASTM D3080-11; Direct Shear Test of Soils Under Consolidated Drained Conditions. American Society for Testing and Materials: West Conshohocken, PA, USA, 2011.
- ASTM D2166-16; Standard Test Method for Unconfined Compressive Strength of Cohesive Soil. American Society for Testing and Materials: West Conshohocken, PA, USA, 2016.
- ASTM D559-03; Standard Test Methods for Wetting and Drying Compacted Soil-Cement Mixtures. American Society for Testing and Materials: West Conshohocken, PA, USA, 2003.
- Samuel, R.A. Synthesis of Metakaolin-Based Geopolymer and Its Performance as Sole Stabilizer of Expansive Soils; The University of Texas at Arlington: Ann Arbor, MI, USA, 2019. [Google Scholar]
- Pandey, A.; Schwab, P.; Little, D.N. Optimization of Magnesium Phosphate Cement: Stabilization of a Kaolinitic Soil. Transp. Geotech. 2022, 37, 100854. [Google Scholar] [CrossRef]
- Wang, D.; Zentar, R.; Abriak, N.E. Durability and Swelling of Solidified/Stabilized Dredged Marine Soils with Class-F Fly Ash, Cement, and Lime. J. Mater. Civ. Eng. 2018, 30, 04018013. [Google Scholar] [CrossRef]
- Mohanty, S.; Roy, N.; Singh, S.P.; Sihag, P. Strength and Durability of Flyash, GGBS and Cement Clinker Stabilized Dispersive Soil. Cold Reg. Sci. Technol. 2021, 191, 103358. [Google Scholar] [CrossRef]
- Bell, F.G. Engineering Properties of Soils and Rocks; Elsevier: Oxford, UK, 2013. [Google Scholar]
- Rahman, M.G.F.; Talukder, M.D.H.; Rahman, A. Assessment of Soil Compaction—A Project Study. MIST J. GALAXY (DHAKA) 2011, 3, 1–12. [Google Scholar] [CrossRef]
- Duncan, J.M.; Chang, C.-Y. Nonlinear Analysis of Stress and Strain in Soils. J. Soil Mech. Found. Div. 1970, 96, 1629–1653. [Google Scholar] [CrossRef]
- Janbu, N. The Resistance Concept Applied to Deformation of Soils. In Proceedings of European Conference on Soil Mechanics and Foundation Engineering; International Society for Soil Mechanics and Geotechnical Engineering: Wiesbaden, Germany, 1963; Volume 1, pp. 19–25. [Google Scholar]
- NF P94-102-2; Soils: Investigation and Testing—Soil Treated with Hydraulic Binder, Possibly Combined with Lime, for use as a Selected Fill—Part 2: Methodology of Laboratory Formulation Studies. Association Française de Normalisation: Saint-Denis, France, 2001.
- ASTM D5333-03; Standard Test Method for Measurement of Collapse Potential of Soils (Withdrawn 2012). American Society for Testing and Materials: West Conshohocken, PA, USA, 2012.
- Duncan, J.M. Strength, Stress-Strain and Bulk Modulus Parameters for Finite Element Analyses of Stresses and Movements in Soil Masses; College of Engineering, Office of Research Services, University of California: Berkeley, CA, USA, 1980. [Google Scholar]
- Niyomukiza, J.B.; Wardani, S.P.R.; Setiadji, B.H. The Effect of Curing Time on the Engineering Properties of Sawdust and Lime Stabilized Expansive Soils; Atlantis Press: Dordrecht, The Netherlands, 2020; pp. 157–161. [Google Scholar] [CrossRef]
- Barman, D.; Dash, S.K. Stabilization of Expansive Soils Using Chemical Additives: A Review. J. Rock Mech. Geotech. Eng. 2022, 14, 1319–1342. [Google Scholar] [CrossRef]
- Seng, S.; Tanaka, H. Properties of Very Soft Clays: A Study of Thixotropic Hardening and Behavior under Low Consolidation Pressure. Soils Found. 2012, 52, 335–345. [Google Scholar] [CrossRef]
- Shivanshi; Kumar Jha, A.; Parwez Akhtar, M. Influence of Wetting-Drying Cycles on Strength Behaviour of Cured Lime Treated Soil Contaminated with Monovalent and Divalent Sulphatic Solutions. Transp. Geotech. 2023, 40, 100988. [Google Scholar] [CrossRef]
- Thyagaraj, T.; Rao, S.M.; Sai Suresh, P.; Salini, U. Laboratory Studies on Stabilization of an Expansive Soil by Lime Precipitation Technique. J. Mater. Civ. Eng. 2012, 24, 1067–1075. [Google Scholar] [CrossRef]
- Wassermann, A.; Abdallah, A.; Cuisinier, O. Impact of Wetting and Drying Cycles on the Mechanical Behaviour of a Cement-Treated Soil. Transp. Geotech. 2022, 36, 100804. [Google Scholar] [CrossRef]
- Estabragh, A.R.; Parsaei, B.; Javadi, A.A. Laboratory Investigation of the Effect of Cyclic Wetting and Drying on the Behaviour of an Expansive Soil. Soils Found. 2015, 55, 304–314. [Google Scholar] [CrossRef]
- Sinha, P.; Iyer, K.K.R. Effect of Stabilization on Characteristics of Subgrade Soil: A Review. In Advances in Computer Methods and Geomechanics; Prashant, A., Sachan, A., Desai, C.S., Eds.; Lecture Notes in Civil Engineering; Springer: Singapore, 2020; pp. 667–682. [Google Scholar] [CrossRef]
- Sun, Z.; Lu, L.; Gong, J.; Wei, G.; Ye, W. Shear Strength Performance of Electrokinetic Geosynthetics Treated Soft Clay after Water Immersion. Processes 2023, 11, 529. [Google Scholar] [CrossRef]
- Pezowicz, P.; Choma-Moryl, K. Moisture Content Impact on Mechanical Properties of Selected Cohesive Soils from the Wielkopolskie Voivodeship Southern Part. Stud. Geotech. Mech. 2015, 37, 37–46. [Google Scholar] [CrossRef]
- Adajar, M.Q.; Cutora, M. The Effect of Void Ratio, Moisture Content, and Vertical Pressure on the Hydrocompression Settlement of Copper Mine Tailing. Int. J. GEOMATE 2021, 14, 82–89. [Google Scholar] [CrossRef]
- Ying, Z.; Benahmed, N.; Cui, Y.-J.; Duc, M. Wetting-Drying Cycle Effect on the Compressibility of Lime-Treated Soil Accounting for Wetting Fluid Nature and Aggregate Size. Eng. Geol. 2022, 307, 106778. [Google Scholar] [CrossRef]
- ASTM D4546-21; Standard Test Methods for One-Dimensional Swell or Collapse of Soils. American Society for Testing and Materials: West Conshohocken, PA, USA, 2021.
Figure 1.
EDX spectrum of test gypsum additive.

Figure 2.
EDX spectrum of test rice husk additive [34].
Figure 2.
EDX spectrum of test rice husk additive [34].

Figure 3.
Methodological sequence of the study.

Figure 4.
Comparison of the experimental and model-predicted stress–strain and volumetric strain-shear strain plots of fine-grained soil without treatment in a saturated condition.
Figure 4.
Comparison of the experimental and model-predicted stress–strain and volumetric strain-shear strain plots of fine-grained soil without treatment in a saturated condition.

Figure 5.
Experimental and model-predicted shear stress vs. shear strain and volumetric strain vs. shear strain behavior for samples of fine-grained soil with gypsum as the primary additive.
Figure 5.
Experimental and model-predicted shear stress vs. shear strain and volumetric strain vs. shear strain behavior for samples of fine-grained soil with gypsum as the primary additive.

Figure 6.
Experimental and model-predicted shear stress vs. shear strain and volumetric strain vs. shear strain behavior for fine-grained soil samples with gypsum and rice husk ash as complementary additives.
Figure 6.
Experimental and model-predicted shear stress vs. shear strain and volumetric strain vs. shear strain behavior for fine-grained soil samples with gypsum and rice husk ash as complementary additives.

Figure 7.
Transformed stress–strain plot from the direct shear test of fine-grained soil at 90% relative compaction.
Figure 7.
Transformed stress–strain plot from the direct shear test of fine-grained soil at 90% relative compaction.

Figure 8.
Failure planes for (a) 35-day samples with 15% gypsum + 10% RHA (not subjected to wet-dry cycles) and (b) 35-day samples with 15% gypsum + 10% RHA (subjected to the durability test).
Figure 8.
Failure planes for (a) 35-day samples with 15% gypsum + 10% RHA (not subjected to wet-dry cycles) and (b) 35-day samples with 15% gypsum + 10% RHA (subjected to the durability test).

Figure 9.
Fitted regression surface curve of UCS versus the number of cycles and curing days.

Figure 10.
Variation of UCS of soil cured for 30 days as a function of cycles.


Table 1.
Mean elemental distribution of recycled gypsum.
| Symbol | Element Name | Atomic Concentration (%) |
|---|---|---|
| O | Oxygen | 79.81 |
| Al | Aluminum | 0.44 |
| Si | Silicon | 0.70 |
| Ca | Calcium | 19.05 |
Table 2.
Mean elemental distribution of rice husk ash.
| Symbol | Element Name | Atomic Concentration (%) |
|---|---|---|
| O | Oxygen | 49.1 |
| Si | Silicon | 49.1 |
| K | Potassium | 1.8 |
Table 3.
Direct shear specimen trials for various percentages of gypsum and RHA as a primary and complementary additive, respectively, in expansive soil.
Table 3.
Direct shear specimen trials for various percentages of gypsum and RHA as a primary and complementary additive, respectively, in expansive soil.
| Gypsum (%) | Gypsum Only (Trials) | Gypsum + 10% RHA (Trials) |
|---|---|---|
| 0% | 3 | - |
| 5% | 3 | 3 |
| 10% | 3 | 3 |
| 15% | 3 | 3 |
Table 4.
Experimental setup for durability and water immersion tests.
| Soil Mixture | Experiment | Curing Periods (Days) | ||||
|---|---|---|---|---|---|---|
| 7 | 14 | 21 | 28 | 35 | ||
| Tests Performed | ||||||
| Untreated Expansive Soil | Modified Durability Test (1, 2 & 3 cycles 1) | Unconfined Compression Strength (ASTM D2166-16) Expansion Index (ASTM D4829-11) | ||||
| Modified Water Immersion Test | ||||||
| Expansive Soil with 15% gypsum + 10% RHA | Modified Durability Test (1, 2 & 3 cycles 1) | Unconfined Compression Strength (ASTM D2166-16) Expansion Index (ASTM D4829-11) | ||||
| Modified Water Immersion Test | ||||||
1 One cycle—24 h of wetting via capillary soaking + 24 h of drying.
Table 5.
Index of defining the intensity of collapsibility [49].
Table 5.
Index of defining the intensity of collapsibility [49].
| Collapse Index | Degree of Collapsibility |
|---|---|
| 0% | No Collapsibility |
| 1–2% | Low Collapsibility |
| 5–10% | Moderate Collapsibility |
| 10–20% | High Collapsibility |
| Greater than 20% | Very High Collapsibility |
Table 6.
Classification of Collapse Index, Ic [49].
Table 6.
Classification of Collapse Index, Ic [49].
| Collapse Index | Degree of Collapsibility |
|---|---|
| 0% | None |
| 0.1–2% | Slight |
| 2.1–6.0% | Moderate |
| 6.1–10% | Moderately severe |
| Greater than 10% | Severe |
Table 7.
Shear strength at failure for all specimens at saturated condition.
| Specimen | Shear Strength at Failure (kPa) | ||
|---|---|---|---|
| σv = 27.25 kPa | σv = 40.88 kPa | σv = 54.50 kPa | |
| Untreated Soil | 23.551 | 35.813 | 41.863 |
| Soil + 5% Gypsum | 18.849 | 36.021 | 45.141 |
| Soil + 10% Gypsum | 24.324 | 38.285 | 47.447 |
| Soil + 15% Gypsum | 25.769 | 40.920 | 49.201 |
| Soil + 5% Gypsum + 10% RHA | 24.226 | 39.801 | 48.483 |
| Soil + 10% Gypsum + 10% RHA | 24.018 | 38.732 | 43.685 |
| Soil + 15% Gypsum + 10% RHA | 23.082 | 38.357 | 42.333 |
Table 8.
Friction angle and cohesion of fine-grained soil and its treated variants.
| Specimen | Friction Angle at Failure (ϕf) | Cohesion (kPa) |
|---|---|---|
| Untreated Soil | 6.272 | |
| Soil + 5% Gypsum | - | |
| Soil + 10% Gypsum | 1.998 | |
| Soil + 15% Gypsum | 3.480 | |
| Soil + 5% Gypsum + 10% RHA | 1.159 | |
| Soil + 10% Gypsum + 10% RHA | 5.975 | |
| Soil + 15% Gypsum + 10% RHA | 5.712 |
Table 9.
Hyperbolic parameters for stress–strain behavior of fine-grained soil and treated variants in a saturated condition.
Table 9.
Hyperbolic parameters for stress–strain behavior of fine-grained soil and treated variants in a saturated condition.
| Specimen | Shear Modulus Hyperbolic Parameters | ||||
|---|---|---|---|---|---|
| (deg) | (deg) | ||||
| Untreated soil | 46.478 | 0.938 | 35.701 | −4.394 | 0.951 |
| Soil + 5% gypsum | 22.669 | 0.215 | 45.930 | 7.777 | 0.943 |
| Soil + 10% gypsum | 56.505 | 1.126 | 41.278 | −0.735 | 0.940 |
| Soil + 15% gypsum | 50.507 | 0.626 | 42.060 | −1.523 | 0.943 |
| Soil + 5% gypsum + 10% RHA | 107.153 | 1.565 | 42.932 | 0.445 | 0.949 |
| Soil + 10% gypsum + 10% RHA | 67.541 | 0.772 | 38.085 | −3.277 | 0.966 |
| Soil + 15% gypsum + 10% RHA | 90.821 | 1.001 | 37.775 | −2.802 | 0.970 |
Table 10.
Hyperbolic parameters for volumetric change of fine-grained soil and treated variants in a saturated condition.
Table 10.
Hyperbolic parameters for volumetric change of fine-grained soil and treated variants in a saturated condition.
| Specimen | Hyperbolic Parameters Defining α | Hyperbolic Parameters Defining β | ||
|---|---|---|---|---|
| Untreated soil | 0.0038 | −2.308 | 0.0041 | −1.032 |
| Soil + 5% gypsum | 0.0195 | −0.356 | 0.0046 | −0.653 |
| Soil + 10% gypsum | 0.0315 | −0.124 | 0.0110 | −0.405 |
| Soil + 15% gypsum | 0.0326 | −0.019 | 0.0076 | −0.965 |
| Soil + 5% gypsum + 10% RHA | 0.0506 | −0.002 | 0.0073 | −1.083 |
| Soil + 10% gypsum + 10% RHA | 0.0092 | −0.378 | 0.0074 | −0.881 |
| Soil + 15% gypsum + 10% RHA | 0.0163 | −0.483 | 0.0067 | −0.921 |
Table 11.
Unconfined compressive strength of samples not subjected to capillary soaking with varying curing days.
Table 11.
Unconfined compressive strength of samples not subjected to capillary soaking with varying curing days.
| Curing Period (Days) | UCS (kPa) |
|---|---|
| 7 | 131.84 |
| 14 | 163.18 |
| 21 | 241.52 |
| 28 | 259.29 |
| 35 | 383.39 |
Table 12.
Average unconfined compressive strength (UCS) and moisture content (w%) of treated samples subjected to modified durability tests.
Table 12.
Average unconfined compressive strength (UCS) and moisture content (w%) of treated samples subjected to modified durability tests.
| Cycles | 1 | 2 | 3 | |||
|---|---|---|---|---|---|---|
| Curing Period (Days) | UCS (kPa) | w (%) | UCS (kPa) | w (%) | UCS (kPa) | w (%) |
| 7 | 22.12 | 59.28 | 33.10 | 54.47 | 24.12 | 56.11 |
| 14 | 21.96 | 56.74 | 16.85 | 54.93 | 25.30 | 59.47 |
| 21 | 13.97 | 57.86 | 14.31 | 53.02 | 15.21 | 58.51 |
| 28 | 13.66 | 51.14 | 13.09 | 57.09 | 12.96 | 59.38 |
| 35 | 12 | 59.28 | 13.80 | 63.17 | 15.35 | 66.77 |
Table 13.
Average strength loss of treated soil samples subjected to modified durability tests.
| Cycles | 1 | 2 | 3 |
|---|---|---|---|
| Curing Period (Days) | Strength Loss (%) | ||
| 7 | 83.22 | 74.89 | 81.71 |
| 14 | 86.54 | 89.67 | 84.50 |
| 21 | 94.22 | 94.07 | 93.70 |
| 28 | 94.73 | 94.95 | 95.00 |
| 35 | 96.56 | 96.40 | 96.02 |
Table 14.
Average unconfined compressive strength (UCS) and moisture content (w%) of samples subjected to modified water immersion tests.
Table 14.
Average unconfined compressive strength (UCS) and moisture content (w%) of samples subjected to modified water immersion tests.
| Curing Period (Days) | UCS (kPa) | w (%) |
|---|---|---|
| 7 | 25.04 | 52.92 |
| 14 | 21.61 | 54.11 |
| 21 | 29.05 | 52.94 |
| 28 | 22.01 | 46.62 |
| 35 | 27.24 | 47.32 |
Table 15.
Expansion index and collapse index of untreated samples with varying curing days.
| Curing Period (Days) | Expansion Index | Collapse Index | Classification |
|---|---|---|---|
| 7 | 2.01 | 0.00% | Low Expansion |
| 14 | 0 | 1.85% | Low Collapsibility |
| 21 | 0 | 0.89% | No Collapsibility |
| 28 | 0 | 1.22% | Low Collapsibility |
| 35 | 0 | 0.43% | No Collapsibility |
Table 16.
Expansion index and collapse index of cycle one samples with varying curing days.
| Curing Period (Days) | Expansion Index | Collapse Index | Classification |
|---|---|---|---|
| 7 | 0 | 0.09% | No Collapsibility |
| 14 | 0 | 0.13% | Low Collapsibility |
| 21 | 0 | 0.20% | No Collapsibility |
| 28 | 0 | 0.41% | Low Collapsibility |
| 35 | 0 | 0.12% | Low Expansion |
Table 17.
Expansion index and collapse index of cycle two samples with varying curing days.
| Curing Period (Days) | Expansion Index | Collapse Index | Classification |
|---|---|---|---|
| 7 | 0 | 0.91% | No Collapsibility |
| 14 | 0 | 0.50% | No Collapsibility |
| 21 | 0 | 0.61% | No Collapsibility |
| 28 | 0 | 0.43% | No Collapsibility |
| 35 | 0 | 0.33% | No Collapsibility |
Table 18.
Expansion index and collapse of index of cycle three samples with varying curing days.
| Curing Period (Days) | Expansion Index | Collapse Index | Classification |
|---|---|---|---|
| 7 | 0 | 0.06% | No Collapsibility |
| 14 | 0 | 0.43% | No Collapsibility |
| 21 | 0 | 1.04% | Low Collapsibility |
| 28 | 0 | 0.18% | No Collapsibility |
| 35 | 0 | 4.14% | Moderate Collapsibility |
Table 19.
Expansion index and collapse index of water immersion samples with varying curing days.
| Curing Period (Days) | Expansion Index | Collapse Index | Classification |
|---|---|---|---|
| 7 | 0 | 0.41% | No Collapsibility |
| 14 | 0 | 0.48% | No Collapsibility |
| 21 | 0 | 0.61% | No Collapsibility |
| 28 | 0 | 0.52% | No Collapsibility |
| 35 | 0 | 8.28% | Moderate Collapsibility |
Table 20.
Surface regression parameters for the treated samples.
| Variables | Coefficients | p-Value |
|---|---|---|
| c | 32.33586 | 7.45 × 10⁻⁶ |
| x1 | −1.48181 | 0.00136 |
| x12 | 0.025434 | 0.001397 |
| x2 | 3.208004 | 0.558037 |
| x22 | −0.45647 | 0.724482 |
| x1×2 | −0.02801 | 0.71079 |
where: c = intercept, x1 = curing days, and x2 = cycles.
Disclaimer/Publisher’s Note: The statements, opinions and data contained in all publications are solely those of the individual author(s) and contributor(s) and not of MDPI and/or the editor(s). MDPI and/or the editor(s) disclaim responsibility for any injury to people or property resulting from any ideas, methods, instructions or products referred to in the content. |
© 2024 by the authors. Licensee MDPI, Basel, Switzerland. This article is an open access article distributed under the terms and conditions of the Creative Commons Attribution (CC BY) license (https://creativecommons.org/licenses/by/4.0/).
Share and Cite
MDPI and ACS Style
Adajar, M.A.; Tan, J.; Ang, A.B.; Lim, M.L.; Seng, K.R.; Sy, V.P. Shear Strength and Durability of Expansive Soil Treated with Recycled Gypsum and Rice Husk Ash. Appl. Sci. 2024, 14, 3540. https://doi.org/10.3390/app14093540
AMA Style
Adajar MA, Tan J, Ang AB, Lim ML, Seng KR, Sy VP. Shear Strength and Durability of Expansive Soil Treated with Recycled Gypsum and Rice Husk Ash. Applied Sciences. 2024; 14(9):3540. https://doi.org/10.3390/app14093540
Chicago/Turabian StyleAdajar, Mary Ann, Jomari Tan, Allaina Bernice Ang, Miles Louis Lim, Kendrick Roy Seng, and Vince Patrick Sy. 2024. "Shear Strength and Durability of Expansive Soil Treated with Recycled Gypsum and Rice Husk Ash" Applied Sciences 14, no. 9: 3540. https://doi.org/10.3390/app14093540
Note that from the first issue of 2016, this journal uses article numbers instead of page numbers. See further details here.