

A Simulator Study on the Driving Impacts of Four Speed-Calming Measures at Unsignalized Intersections
Faculty of Transportation Engineering, Kunming University of Science and Technology, Jingming South Road 727, Kunming 650504, China
*
Author to whom correspondence should be addressed.
Appl. Sci. 2024, 14(9), 3542; https://doi.org/10.3390/app14093542
Submission received: 25 February 2024
/
Revised: 22 March 2024
/
Accepted: 19 April 2024
/
Published: 23 April 2024
(This article belongs to the Section Transportation and Future Mobility)
Abstract
:Intersections, especially those without traffic signals, are prone to frequent traffic accidents and disorder. The regulation of vehicle speed is an effective measure that can be taken in order to mitigate accidents and alleviate disorder at unsignalized intersections. This study aims to assess the effectiveness of four different temporary low-cost speed-calming measures: traffic crash barrels, lane markings, intersection markings, and a combination of the three. In this study, we used a driving simulator to design four speed-calming static measures that are typical of intersections; we then statistically analyzed the speed and acceleration data (recorded by the driving simulator) and the driver’s visual data (recorded by an eye tracker). The simulation results demonstrated that different speed-calming measures have varied effects on the attention and visual fixations of drivers; however, they are all effective in reducing the average driving speed at the intersection. The traffic-channelizing lane demonstrated superior performance compared to the other three measures in terms of its cumulative impact on deceleration, driving comfort, and safety. The experimental findings presented herein broaden the range of currently accessible temporary speed-limiting strategies and provide valuable insight into intersections that require low-cost speed management solutions.
1. Introduction
Excessive speed is one of the biggest risk factors affecting road traffic safety; it increases the probability of accidents and can exacerbate their severity [1]. The association of speed with risk in accidents is particularly pronounced in collisions between cars and VRUs (vulnerable road users). Multiple studies have indicated deviations in this correlation; thus, a prevailing trend has emerged: speeds below 30 km/h seldom lead to fatalities, speeds around 50 km/h result in fatal outcomes in approximately 10–15% of cases, and velocities exceeding 80 km/h almost invariably result in fatalities [2]. In order to address this concern, numerous studies and practical endeavors have been undertaken in the pursuit of practicable solutions [3]. One potential strategy for mitigating traffic accidents involves decreasing the maximum permissible speed limit [4,5].
Traffic-calming measures (TCMs) are a combination of predominantly physical measures that reduce the negative consequences of motor vehicle use, alter driver behavior, and help to safeguard non-motorized street users [6]. Speed-calming measures (SCMs) are one form of traffic-calming measure; they are put in place to ensure acceptable driving speeds in urban areas. In one meta-analysis, area-wide urban SCM schemes were found to significantly reduce the number of accidents that cause injuries [7]. Elevations in the road surface, such as speed bumps, are a commonly applied speed-calming measure. Speed bumps have considerable efficacy in reducing driving speed [8]. Speed bumps appear to be the most efficient way of reducing vehicle speeds; however, when deployed independently and inappropriately, their effectiveness is insufficient [9]. Speed bumps of different heights have varied effects on driving speeds. As the height of speed bumps increases, the speeds measured in their vicinity decrease [10]. However, speed bumps may also have some undesirable effects, such as increases in noise [11], vibration [12], fuel consumption, and the emission of harmful gases [13]. Therefore, traffic authorities and environmental protection authorities are working to reduce the use of such deceleration measures on urban roads and explore more cost-effective and appropriate deceleration measures.
In urban areas, several other speed-calming measures have been developed; these include vertical road signs and road surface markings (RSMs). These measures can influence the direction of drivers’ visual attention and change their behavior. Several speed-calming measures (such as rumble strips and modified signs) have been designed, and their effects on driving speed and lateral distance have been measured; all said measures were shown to significantly decrease the mean speed of traffic [14]. TCMs including landscaping, planting, and other similar methods are currently used to slow motor vehicle speed, narrow traffic lanes, and/or create smaller distances for pedestrian crossings [15]. Speed tables, which are midblock traffic-calming devices, have demonstrated effectiveness in reducing speed [16]. Chicanes and speed tables have demonstrated greater speed reduction capacity than other measures [17]. Radar speed cameras (RSCs) are a proven and timely speed-calming measure [18]. The effectiveness of these measures has been demonstrated; however, their widespread implementation is hindered by the significant costs they incur.
Speed-calming measures are often prioritized at intersections, which represent one of the most complex traffic situations due to their multiple approaches and the overlapping movement of motorists, pedestrians, and cyclists. Vehicles’ left turns are complicated maneuvers and pose a considerable threat to pedestrians at intersections. Left turns usually occur at higher speeds than right turns [19]. To address pedestrian safety concerns resulting from left-turning vehicles at intersections, countermeasures such as leading pedestrian intervals, exclusive pedestrian phases, and protected left-turn phases have been developed and proven effective [20]. Traffic-calming treatments have recently been installed at left-turning points in a growing number of cities. New York City is the leader of left-turn speed-calming efforts. One type of left-turn speed-calming measure, the hardened-centerline treatment, which was used in Washington, DC, reduced conflicts between left-turning vehicles and pedestrians and slowed down left-turn movements [21].
The predominant form of SCM in China is speed bumps; alternative measures have not yet been implemented on a large scale. In Kunming City, a newly emerging first-tier city in southwest China, there is an abundance of newly constructed roads and intersections at which signaling lights have not yet been installed. There are also some intersections that, due to power failures or traffic light failures, have on occasion become unsignalized intersections. In these circumstances, the responsible parties did not implement temporary traffic control measures in a timely manner. The aforementioned circumstances significantly elevate the likelihood of excessive speed and traffic collisions. We, therefore, sought to examine the impact of traffic-controlling interventions on drivers’ behavior and identify temporary speed-calming measures that are suitable for unsignalized intersections. As municipalities strive to mitigate traffic conflicts and potential accidents, it is crucial that we consider flexible and relatively inexpensive traffic-calming measures for use at uncontrolled intersections.
2. Materials and Methods
This study obtained approval from both the Faculty of Traffic Engineering and the Research Committee at Kunming University of Science and Technology, ensuring strict adherence to professional and academic standards in accordance with established guidelines.
2.1. Participants
Twenty Chinese participants took part in this experiment (fifteen males and five females). Their ages ranged from 23 to 40 years (M = 26.15, SD = 3.41), and their driving experience ranged from 1 to 11 years (M = 3.35, SD = 2.23). All participants’ eyesight was normal or corrected-to-normal (a log MAR value lower than 0.1 on an exam using an E chart was required). The participants were primarily recruited through a campus networking platform focusing on students and staff affiliated with the campus. We recruited a low number of participants because it was sufficient to study the feasibility of the experiment. The real purpose of the experiment was not disclosed, and this may have reduced the impact of the participants’ purposeful driving on the results.
All participants underwent warm-up training and drove in a driving simulator to familiarize themselves with the necessary maneuvers before the experiment commenced. All participants successfully completed the experiment, during which no adverse physical reactions occurred. The participants were each rewarded with a token of appreciation in the form of CNY 100 (about USD 14) upon completion of the experiment.
2.2. Apparatus
2.2.1. Driving Simulator
The experiment was conducted using the KURTDS (Kunming University Road Traffic Driving Simulation), a tool developed at the Road Traffic Simulation Laboratory of Kunming University of Science and Technology. The driving simulator consists primarily of three components: a computer control system, a cockpit, and a display screen. To ensure that the subjects’ experience aligned with real-world conditions during the experiment, the cockpit was meticulously designed to closely replicate the environment of a real car, and the testing site was illuminated using indoor lighting.
The backrest of the driver’s seat in the cockpit was made adjustable and equipped with a securely fastened seat belt. The display system primarily consists of a curved projection screen, with the screen supported by a bracket on the ground. The height, distance, and angle could be dynamically adjusted to enable real-time visualization of road traffic scenes. The pre-designed simulation scene was projected onto the screen by a projector, thereby enabling the subjects to fully immerse themselves in the driving simulation.
Figure 1 depicts the console and simulator, featuring a prominent screen showcasing the virtual scenario. The driving simulator computer system is capable of collecting and recording comprehensive data pertaining to each driver’s operation of the vehicle (such as braking, acceleration, and steering) and the vehicle’s state of motion (including velocity and moving between lanes).
2.2.2. Eye Tracker
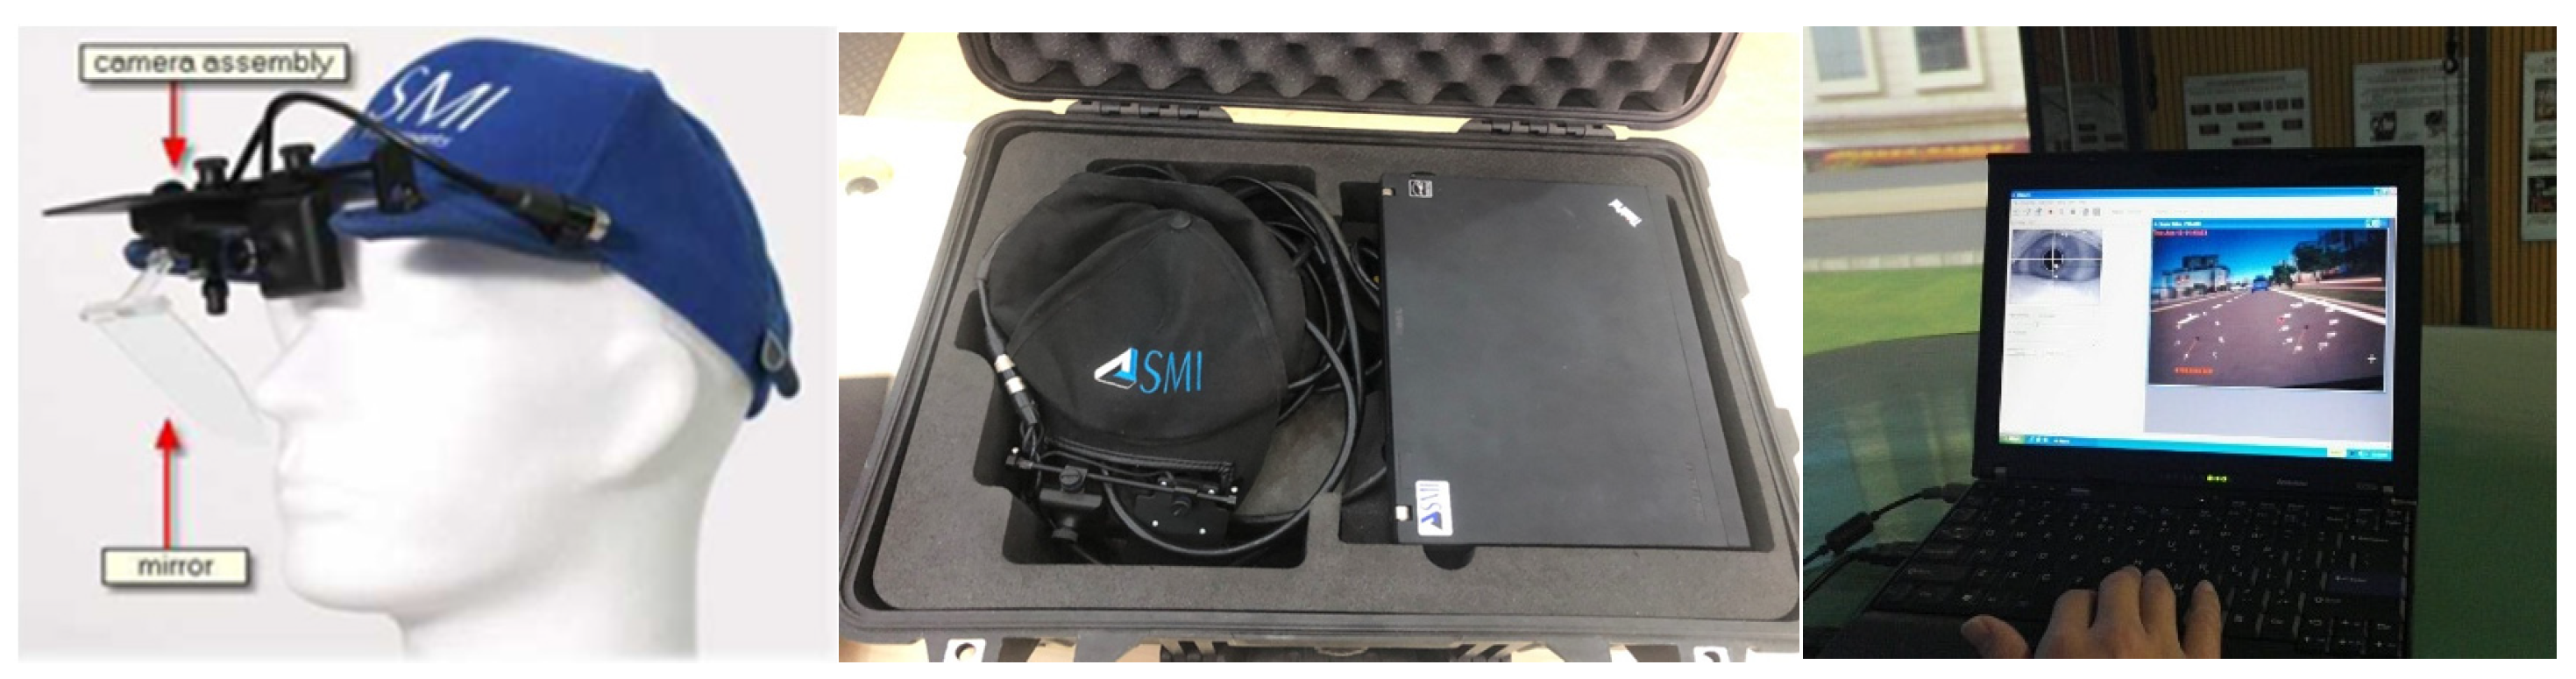
During the experiment, we employed an SMI I-View XTM HED 4 eye tracker to meticulously record eye movement data. Figure 2 shows the eye tracker and software interface. This head-mounted eye tracker is made up of a hat, video-capturing camera, pupil-tracking camera, and semi-reflective half-lens. Once the participant puts on the hat and directs their gaze through the half-lens toward the object of interest, the camera captures light reflections that serve as recordings of drivers’ eye movements. These recordings are then inputted into a computer for the purpose of data collection and analysis. Subsequently, parameters such as gaze time and speed of movement (of the pupil in both cases) are set.
2.3. Experimental Setup
2.3.1. Experimental Design
This study used the driving simulation method to conduct the test. Many previous studies on the effectiveness of traffic-calming measures are based on a large number of measured data analyses, such as Bayesian regression analysis, the SWOT method, the and SPEIR method [22,23,24]. Compared with the methods of data analysis, the driving simulator simulation test has the advantages of fast design, convenience, and the presence of more detail in the experimental design itself. In general, the results of field research on drivers’ visual perceptions are consistent with results obtained using simulators [25]. Laboratory simulations were conducted under controlled video conditions.
The research subject of this study is an intersection located in the suburban area of Kunming City at which there are newly constructed roads but no traffic signals. This unsignalized intersection is located at the intersection of South Jingming Road and Wan Qing Road, Chenggong District, Kunming City, Yunnan Province. Figure 3 shows an image captured by Google Earth and an image captured by a UAV (Unmanned Aerial Vehicle). This specific road is situated in close proximity to Kunming University of Science and Technology. A field survey was carried out at a busy intersection from 5 to 7 p.m. each day for a week. The volume of traffic at this location was relatively limited, with an average flow of 600 vehicles per hour. Since the area is not an industrial zone and is not on the bus line, the vehicles passing through the section are small cars and small trucks, and there are no large buses or large trucks. Nevertheless, there are currently no traffic lights and very few obvious traffic-calming measures in place; consequently, a significant number of vehicles exceeded the speed limit at this intersection. During the field investigation, we discovered that high-speed vehicles frequently veer off the usual left-turn route when driving at excessive speeds, leading to significant disruptions for other vehicles and pedestrians. To address this issue and identify effective deceleration solutions for intersections, we installed various temporary speed-calming measures designed specifically for said intersections.
We utilized 3D scene-editing software (VS-Design 2.0) developed independently by the Road Traffic Safety Laboratory of Kunming University of Science and Technology to design a simulated experimental scene that accurately reflects real road conditions. To facilitate the creation of virtual scenarios and driving tasks, we designed road sections with double four-lane configurations and barriers in the form of fences featuring double yellow solid lane markings. Each lane measures 3.5 m wide, and we implemented a speed limit of 40 km/h at junctions. The center of the intersection has dimensions of 50 m × 50 m. The straight road section before the intersection is 1 km long. In order to enhance the consistency of our experimental simulation with real-world driving environments, we incorporated buildings and greenery on both sides of the experimental lane based on actual road settings.
We established four treatments at the intersection to investigate vehicle deceleration patterns and the movement of drivers’ visual focus under five distinct sets of environmental conditions (Figure 4).
Temporary speed-calming measures include anti-collision barrels, traffic-channelizing lane markers, speed bumps, and cross-hatched intersection markers. Anti-collision barrels were crafted from a highly elastic and durable modified plastic material with a reflective coating on the surface (making them clearly visible during the day and night). The design uses a small-diameter anti-collision drum, and the size specification is 400 mm × 740 mm. The interior is filled with sand to maintain stability. These measures serve primarily as visual warning devices to guide vehicles. The traffic-channelizing lane markers are colored yellow and function to better guide vehicles through the intersection. Speed bumps primarily serve as a visual reminder rather than providing a tactile sensation of vibration to drivers.
Treatment 1. Experimental control group (a setup without any speed-calming measures).
Treatment 2. Installation of anti-collision barrels (set at 15 m from the junction; each anti-collision barrel is 3 m apart and 7 anti-collision barrels are placed in the center of the intersection to remind the driver of their relative position).
Treatment 3. Installation of traffic-channelizing lane markers (set at 15 m from the junction, with each marker spaced 1 m apart).
Treatment 4. Installation of anti-collision barrels and traffic-channelizing lane markers (combining Treatments 2 and 3).
Treatment 5. Installation of speed bumps and cross-hatched intersection markers (with two speed bumps 20 m and 10 m, respectively, from the intersection, and a 30 m × 30 m yellow cross-hatched marker in the center of the intersection).
2.3.2. Experimental Procedure
The experiment comprised a warm-up exercise and the formal experiment. Prior to the commencement of the experiment, all participants were instructed to engage in warm-up exercises within the driving simulator for about ten minutes. Participants selected comfortable seating positions within the driving simulator, attentively observed the video on the monitor, and familiarized themselves with the operational aspects of the driving simulator. During the formal experiment, participants were tasked with completing a designated driving route using the driving simulator. Each participant conducted five trials, progressively accelerating from the starting point until they reached a speed of 40 km/h and subsequently navigating through the intersection by executing a left turn toward their intended destination. Completion of the left turn maneuver was mandatory for all participants, to be carried out along the predetermined test route (via the inner lane) approaching the intersection. The sequence of the five scenarios was random, with each scenario lasting about 1 min. Each participant had around 1 min of relaxation time after the end of each scenario and completed around 10 min of formal trial time.
In each driving scenario, since this trial, by design, only studied the effects of speed-calming measures on a single driver, participants did not encounter collisions between vehicles and pedestrians coming from other directions at intersections; they only had to focus on the road’s geometry and speed-calming measures. Prior to the experiment, participants were not provided with any information on the purpose of the study, and their performance of regular driving tasks was recorded. The experiment area was illuminated with lights close to natural light intensity, and the environment did not cause adverse reactions in the participants. No additional stimuli were presented to them during the course of the experiment.
2.4. Data Collection
2.4.1. Eye Movement Data
During the experiment, eye movement data were collected from participants via the eye tracker’s computer software (SMI BeGaze 3.5) to evaluate the visibility and attentional impact of deceleration measures. The collected data encompassed metrics such as the number of eye fixations, fixation duration, and distribution of fixation points. The data were output after the eye tracker recorded results in a video file and a binary I-view data folder (IDF) for each subject. The IDF file was converted into a more visual “.txt” file, which contains pupil and fixation data. To examine disparities in visual characteristics before and after the implementation of four deceleration measures, we extracted total counts, durations, and coordinated distributions of fixations during observation periods from installation to departure (within a specified range). The data were statistically and manually corrected, and the missing values and outliers were processed.
2.4.2. Driving Behavior Data
In the conducted experiment, vehicle motion data from the driving simulator were meticulously collected; these included crucial parameters such as simulation time, distance, vehicle speed, lateral acceleration, and longitudinal acceleration. These essential metrics were directly obtained from the control computer of the driving simulator. Our primary objective was to evaluate and quantify the impact of various speed-calming measures on changes in vehicle motion and driving stability. We screened and classified the obtained data to facilitate subsequent statistical analysis.
3. Results
3.1. Eye Movement
The eye movement data from the experiment were collected and used to assess the degree of various speed-calming measures’ impacts on the number and duration of drivers’ visual fixations. Table 1 shows the descriptive statistical findings.
The experimental results demonstrate that not all of the four speed-calming measures had a significant impact on the duration and number of visual fixations (p < 0.1). Regarding the duration of fixations, with the exception of Treatment 5, the remaining three measures had remarkable effects on the duration of fixations. Only the diversion line had a substantial influence on the number of fixations.
To further validate the impact of various velocity-stabilizing measures on participants’ visual perceptions, we selected a linear distance of 30 m before the vehicle passed the intersection and a visual fixation time of more than 200 milliseconds in order to extract the necessary data. Subsequently, we accurately calibrated the locations of participants’ visual fixations relative to the experimental screen display and generated a distribution diagram illustrating their attentional focus over the course of the study (Figure 5).
It can be seen from the distribution of subjects’ fixation points that drivers’ visual fixations vary when they pass through areas with different velocity-stabilizing measures. In the case of Treatment 1, wherein no speed-calming measures were taken, the drivers’ fixation points showed greater dispersion and a broader range. On the contrary, in the case of Treatment 2, which only made use of one speed-calming measure (anti-collision barrels), the drivers’ visual attention was too concentrated. These observations suggest that anti-collision barrels have greater visual appeal for drivers, causing them to ignore the broader environment of the road in front of and on both sides of the vehicle.
In the case of Treatment 3, which only featured traffic-channelizing lane markings, the drivers’ fixation points were distributed in the front and left–front areas, and the scope of the direction of the drivers’ gaze was expanded horizontally. It is worth noting that in Treatment 4, when traffic-channelizing lane markings were combined with anti-collision barrels, the drivers’ visual focus was more focused on the area directly in front of them; this result was more significant than in Treatment 2. Finally, in the case of Treatment 5, which combined speed bumps and cross-hatched intersection markings, the distribution of drivers’ visual fixations was very similar to that in Treatment 1, which involved no speed-calming measures; this indicates that the cross-hatched intersection markings at the center of the intersection had the smallest effect on the drivers’ visual attention.
3.2. Speed
Due to the implementation of speed-calming measures, the driving velocity of the subjects was reduced as they passed through the affected area. To further investigate the pattern of variation in vehicle speed across the experiment, we calculated and plotted the average velocity for 20 sets of experimental subjects at each point. This analysis produced the chart in Figure 6, which is a comprehensive depiction of global speed fluctuation throughout the experiment.
Within the above figure, the black curve represents the change in vehicle speed in the process of turning left at an intersection without the use of any speed-calming measures (Treatment 1); the speed of the vehicles was the highest of all of the different treatments throughout the experiment.
The blue curve shows the change in vehicle speed within the setup featuring anti-collision barrels. As shown in the figure, the vehicle speed was initially low, and the recovery speed was at its lowest level after the completion of the left turn, during which the rate of change in speed was low. This trend can be attributed to the narrowing of the road by the anti-collision barrels and drivers’ subsequent need to reduce their speed to avoid a potential collision.
In contrast, in Treatment 3 (traffic-channelizing lane markings), the vehicles’ speed is represented by a smooth curve. Notably, in this case, drivers generally began to slow down closer to the intersection; this is mainly due to the guiding effect of the trim line on the driver, encouraging them to cross the intersection at a more even speed.
Treatment 4, which is represented by the green curve, combined anti-collision barrels and traffic-channelizing lane markings. As shown in the figure, the lowest-speed vehicle in this case was close to a stop, and the speed of the vehicle throughout the whole process was lower than that in other cases utilizing different measures.
As shown by the purple curve in the figure, in the case of Treatment 5, the vehicle began to slow down at the point farthest from the intersection. These results indicate that the prior implementation of observable speed bumps has a significant effect on vehicle deceleration. When vehicles passed near the center of the intersection, they still maintained a high speed, indicating that the cross-hatched intersection markings had no obvious effect on vehicle deceleration.
In summary, compared with zero speed-calming measures, all four speed-calming measures had the effect of decelerating vehicles passing through unsignalized intersections. Among these measures, Treatment 4 (which combined anti-collision barrels and traffic-channelizing lane markings) had the most significant effect in terms of deceleration, but it also caused the overall speed of the vehicle to decrease too much. Therefore, it is important that other driving factors, such as acceleration and driving safety indicators, are considered and that speed-calming measures at intersections are chosen carefully.
3.3. Longitudinal Acceleration
On the basis of our descriptive analysis of velocity, this study further examined whether different types of velocity-stabilizing measures have significant effects on longitudinal acceleration by comparing this measure before and after they were set. The LSD testing method was used to evaluate longitudinal acceleration, a functional index of driving behavior, and the results are summarized in Table 2.
At a significance level of 0.05, except for Treatment 5 (the combination of speed bumps and cross-hatched intersection markings), there was a significant difference in the mean acceleration before and after measures were installed. p-values of 0.021, 0.018, 0.048, and 0.383 represent the difference in mean acceleration pre- and post-installation of the anti-collision barrels, traffic-channelizing lane markings, both anti-collision barrels and traffic-channelizing lane markings, and both speed bumps and cross-hatched intersection markings.
3.4. Acceleration Noise
In the experiment, the speed of the vehicle was reduced to a certain extent due to the influence of the speed-calming measures as the vehicle undertook the left-turning maneuver. Research has indicated a significant correlation between road traffic accidents and vehicle speed, with higher risk associated with greater changes in vehicle speed [26]. The metric of acceleration noise (AN) utilizes the standard deviation of vehicle acceleration relative to the average acceleration to quantify the extent of variation in speed. This parameter serves as a quantitative evaluation index for assessing driving smoothness and reflecting both the driver’s comfort and driving stability [27]. Its calculation is presented in Formula (1). In this study, acceleration noise was employed as a parameter for evaluating the operational stability of simulated vehicles, using the following formula for computation:
The acceleration noise experienced by each participant during the process of installing each processing unit (expressed in m/s2) is denoted (t), where t represents the time needed to traverse the data analysis area (in seconds). Additionally, (t) signifies the acceleration at a specific time point, while refers to the average acceleration observed throughout the whole process (measured in m/s2). Table 3 shows the numerical values of acceleration in cases featuring different measures.
The acceleration interference values were consistently higher when velocity stabilization measures were implemented, suggesting that these measures had a discernible impact on the drivers’ adaptability and comfort. Notably, the traffic-channelizing lane markings exhibited the minimum acceleration interference value, indicating this particular measure had the smallest influence on driving adaptability and comfort. Conversely, the combination of anti-collision barrels and traffic-channelizing lane markings resulted in the highest acceleration interference value, highlighting its significant impact on driving adaptability and comfort.
Based on a substantial volume of experimental data and case analysis, there is an inverse relationship between traffic safety and acceleration interference [28]. Specifically, the degree of acceleration interference directly impacts driving safety and comfort performance. Lower levels of acceleration interference correspond to better driving safety and comfort, while higher levels result in poorer outcomes. When σ > 1.5 m/s2, driving safety can be significantly compromised, necessitating the implementation of appropriate safety warnings. Conversely, when σ < 0.7 m/s2, both driving safety and comfort can be deemed satisfactory. When values fall within the range 0.7 m/s2 < σ<1.5 m/s2, vehicles can be considered to be in satisfactory running condition.
4. Discussion
The aim of this study was to examine the impact of four types of temporary speed-calming measures on driving behavior and deceleration in the vicinity of an unsignalized intersection on a newly constructed road. Our primary focus was on assessing the efficacy of these temporary speed-calming measures and identifying changes in their associated safety indicators.
The results of this study revealed statistically significant findings after installation of anti-collision barrels, traffic-channelizing lane markers, and the combined utilization of these speed-calming measures; these results derived from our analysis of eye movements. Visual focus is the driver’s primary means of appraising the upcoming road’s geometry and the vehicle’s movement relative to its immediate environment [29]. All four speed-calming measures designed in the experiment were of a clear and highly conspicuous color that consistently captured the participants’ attention. Focusing one’s gaze forward can help drivers to better detect surrounding hazards and prepare for them in advance [30]. When drivers approach intersections, the presence of anti-collision barrels and traffic-channelizing lane markings is likely to effectively attract their attention. Importantly, the implementation of traffic-channelizing lane markings showed a substantial impact on driving outcomes. These findings have the potential for application to other roads of limited width. However, it is worth noting that identifying simulated speed bumps was a relatively challenging task for the participants, as their tactile effects could not be accurately replicated by the simulator. Nevertheless, it was possible to simulate their visual effects.
The analysis of driving speed data reveals that the presence of traffic-diverting line markings significantly impacts drivers’ behavior and its consequences. The results showed that several (e.g., lines on the road creating the illusion of speed and anti-collision barrels functioning as a bottleneck) measures can significantly reduce speed, which is consistent with the findings of Michael H. Cale et al. [31]. In addition, in terms of overall effectiveness in reducing vehicle speed, the effect of installing diversion lines alone is not as great as the effect of combining the two measures, which is consistent with the conclusions of Hatfield’s study [32]. An explanation for this finding is that an increase in the number and nature of external stimuli increases the complexity of drivers’ visual perceptions and encourages them to drive in a more cautious manner. In addition, too-low traffic speeds at intersections may lead to congestion. In contrast, the effect of installing a single type of speed-calming measure is acceptable.
The results of our analysis of drivers’ comfort indicate that speed-calming measures have a significant adverse effect on drivers’ comfort, leading to a reduction in driving smoothness. However, it is worth noting that vertical speed bumps are commonly implemented on real roads. This study mainly focused on the impact of speed-calming measures on drivers’ visual perceptions and did not include an in-depth assessment of the impact of vehicle vibration (caused by speed bumps in Treatment 5) on drivers’ physiological perceptions. Notably, acceleration noise was found to be higher after the installation of measures compared to pre-installation levels within each treatment, highlighting certain drawbacks associated with speed-calming measures such as decreased stability and diminished comfort. These findings align with previous research conducted by Moreno et al. [33]. Compared with the other three measures, the traffic-channelizing lane markings in Treatment 3 were the most acceptable in terms of driving smoothness.
In order to optimize the effectiveness of deceleration measures, meticulous attention should be paid to the precise selection, allocation, and placement of such measures. Moreover, it must be acknowledged that the long-term effects of tried and tested deceleration measures tend to diminish over time [34]. In order to accurately assess the perceived level of vehicle fatigue, empirical data can be combined with a driver self-assessment questionnaire as a reliable assessment tool for future studies.
5. Conclusions
In this study, conducted at an uncontrolled intersection in the rural–urban fringe area, we simulated and evaluated four viable, low-cost, and adaptable speed-calming measures that function to provide appropriate warning and guidance to drivers. These measures included anti-collision barrels, traffic-channelizing lane markings, a combination of anti-collision barrels and traffic-channelizing lane markings, and the integration of speed bumps with cross-hatched intersection markings. The collected data included observations of driving behavior and analysis of participants’ eye movements as they approached and departed the uncontrolled intersection. As anticipated, these findings suggest that the installation of speed-calming measures has significant potential to improve traffic safety.
In contrast with existing studies examining the effects of speed-calming measures, this paper presents an analysis and evaluation of the effects of four tested speed-calming measures on drivers’ behavior and eye movements near an uncontrolled intersection; such intersections are prevalent in China, yet they have not received sufficient attention from researchers. The study’s findings can be summarized as follows.
Analyses of both vehicle motion and drivers’ visual focus revealed that the implementation of anti-collision barrels, traffic-channelizing lane markings, and their combination had a statistically significant impact. However, acceleration noise measurements indicate that these speed-calming measures may have adverse effects on driving stability and driving comfort. Overall, the impact of lane markings on the direction of drivers’ visual attention and on vehicle deceleration is acceptable.
In conclusion, this study suggests that the four experimentally simulated speed-calming measures have the potential to effectively promote driving at reduced speeds and foster safety-oriented behavior. Our study successfully elucidates the impact of various speed-calming measures on drivers’ perceptions and behavior, providing insights into the cognitive processes involved in drivers’ visual perceptions of such measures. These low-cost temporary speed-calming measures can be used as a feasible method of effectively reducing vehicle speed at unsignalized intersections. In addition, when traffic authorities have sufficient funds to install traffic signal lights, left-turn diversion lines can be retained, attracting the attention of drivers and regulating their left-turning driving paths.
6. Limitations and Further Research
As this study is based on a driving simulator, it has some limitations. The findings are highly dependent on the form of the simulator, the design of the experiment, and the differences among the participants. The electronic display screen and fixed driver seats in a driving simulator may not provide the same visual and physical feedback as that in a real vehicle, which may impact the driver’s sense of control and immersion. We will strive to improve the fidelity and immersion of driving simulators to enhance the effectiveness of simulation-based training and research.
In the actual traffic scenario, there are a lot of interaction behaviors between vehicles and pedestrians at unsignalized intersections [35,36]. In further studies, we plan to design conflict scenarios between vehicles and pedestrians at unsignalized intersections to find more reasonable speed-calming measures.
In addition, we used a low number of participants to demonstrate the feasibility of the methodology at this stage of the research. Although we have reached an acceptable conclusion, it is important to acknowledge that the results may not be as accurate or reliable as studies with larger sample sizes. Studies have shown that drivers of different ages and personality traits respond differently to traffic-calming measures [37]. In future studies, we aim to increase the sample size to improve the reliability and validity of the findings.
Author Contributions
Conceptualization, Y.Q.; methodology, Y.Q.; software, Y.Q.; validation, Y.Q.; formal analysis, Y.W.; investigation, Y.Q.; resources, Y.Q.; data curation, Y.W.; writing—original draft preparation, Y.W.; writing—review and editing, Y.W.; visualization, M.G.; supervision, M.G.; project administration, Y.Q. All authors have read and agreed to the published version of the manuscript.
Funding
This research received no external funding.
Institutional Review Board Statement
Not applicable.
Informed Consent Statement
Not applicable.
Data Availability Statement
The data presented in this study are available upon request from the corresponding author. The data are not publicly available due to privacy concerns.
Acknowledgments
The authors would like to acknowledge the Road Traffic Driving Simulation Laboratory of Kunming University of Science and Technology (Faculty of Traffic and Transportation Engineering) for granting permission to utilize their simulator in this study, thus facilitating its successful execution.
Conflicts of Interest
The authors declare that they have no known competing financial interests or personal relationships that could have appeared to influence the work reported in this paper.
References
- Vaitkus, A.; Čygas, D.; Jasiūnienė, V.; Jateikienė, L.; Andriejauskas, T.; Skrodenis, D.; Ratkevičiūtė, K. Traffic calming measures: An evaluation of the effect on driving speed. Promet-Traffic Transp. 2017, 29, 275–285. [Google Scholar] [CrossRef]
- Rosen, E.; Stigson, H.; Sander, U. Literature review of pedestrian fatality risk as a function of car impact speed. Accid. Anal. Prev. 2011, 43, 25–33. [Google Scholar] [CrossRef] [PubMed]
- Ariën, C.; Jongen, E.M.; Brijs, K.; Brijs, T.; Daniels, S.; Wets, G. A simulator study on the impact of traffic calming measures in urban areas on driving behavior and workload. Accid. Anal. Prev. 2013, 61, 43–53. [Google Scholar] [CrossRef]
- Elvik, R. The Power Model of the Relationship between Speed and Road Safety: Update and New Analyses. 2009. Available online: https://trid.trb.org/View/1150311 (accessed on 18 April 2024).
- Nilsson, G. Traffic Safety Dimensions and the Power Model to Describe the Effect of Speed on Safety; Lund University: Lund, Sweden, 2004. [Google Scholar]
- Behzad, M.; Hodaei, M.; Alimohammadi, I. Experimental and numerical investigation of the effect of a speed bump on car noise emission level. Appl. Acoust. 2007, 68, 1346–1356. [Google Scholar] [CrossRef]
- Elvik, R. Area-wide urban traffic calming schemes: A meta-analysis of safety effects. Accid. Anal. Prev. 2001, 33, 327–336. [Google Scholar] [CrossRef]
- Agerholm, N.; Knudsen, D.; Variyeswaran, K. Speed-calming measures and their effect on driving speed–Test of a new technique measuring speeds based on GNSS data. Transp. Res. Part F Traffic Psychol. Behav. 2017, 46, 263–270. [Google Scholar] [CrossRef]
- Ziolkowski, R. Influence of traffic calming measures on drivers’ behaviour. In Proceedings of the Environmental Engineering. Proceedings of the International Conference on Environmental Engineering (ICEE), Vilnius, Lithuania, 22–23 May 2014; Vilnius Gediminas Technical University, Department of Construction Economics & Property: Vilnius, Lithuania, 2014. [Google Scholar]
- Antić, B.; Pešić, D.; Vujanić, M.; Lipovac, K. The influence of speed bumps heights to the decrease of the vehicle speed–Belgrade experience. Saf. Sci. 2013, 57, 303–312. [Google Scholar] [CrossRef]
- Lockwood, I.M. ITE traffic calming definition. Institute of Transportation Engineers. ITE J. 1997, 67, 22. [Google Scholar]
- Gonzalo-Orden, H.; Pérez-Acebo, H.; Unamunzaga, A.L.; Arce, M.R. Effects of traffic calming measures in different urban areas. Transp. Res. Procedia 2018, 33, 83–90. [Google Scholar] [CrossRef]
- Ahn, K.; Rakha, H. A field evaluation case study of the environmental and energy impacts of traffic calming. Transp. Res. Part D Transp. Environ. 2009, 14, 411–424. [Google Scholar] [CrossRef]
- Akbari, A.; Haghighi, F. Traffic calming measures: An evaluation of four low-cost TCMs’ effect on driving speed and lateral distance. IATSS Res. 2020, 44, 67–74. [Google Scholar] [CrossRef]
- Cantisani, G.; Corazza, M.V.; Di Mascio, P.; Moretti, L. Eight traffic calming “easy pieces” to shape the everyday pedestrian realm. Sustainability 2023, 15, 7880. [Google Scholar] [CrossRef]
- Doomah, M.Z.; Paupoo, D.P. Evaluation of the effectiveness of speed tables combined with other traffic calming measures and their community acceptance in Mauritius. Case Stud. Transp. Policy 2022, 10, 1550–1565. [Google Scholar] [CrossRef]
- Distefano, N.; Leonardi, S. Evaluation of the benefits of traffic calming on vehicle speed reduction. Civ. Eng. Archit. 2019, 7, 200–214. [Google Scholar] [CrossRef]
- Lee, T.K.; Kim, B.S. Vibration analysis of automobile tire due to bump impact. Appl. Acoust. 2008, 69, 473–478. [Google Scholar] [CrossRef]
- Roudsari, B.; Kaufman, R.; Koepsell, T. Turning at intersections and pedestrian injuries. Traffic Inj. Prev. 2006, 7, 283–289. [Google Scholar] [CrossRef] [PubMed]
- Mead, J.; Zegeer, C.; Bushell, M. Evaluation of Pedestrian-Related Roadway Measures: A Summary of Available Research; P a BI Center; UNC Highway safety Research Center: Chapel Hill, NC, USA, 2014; p. 115. [Google Scholar]
- Hu, W.; Cicchino, J.B. The effects of left-turn traffic-calming treatments on conflicts and speeds in Washington, DC. J. Saf. Res. 2020, 75, 233–240. [Google Scholar] [CrossRef] [PubMed]
- Batomen, B.; Cloutier, M.-S.; Carabali, M.; Hagel, B.; Howard, A.; Rothman, L.; Perreault, S.; Brown, P.; Di Ruggiero, E.; Bondy, S. Traffic-calming measures and road traffic collisions and injuries: A spatiotemporal analysis. Am. J. Epidemiol. 2023, kwad136. [Google Scholar] [CrossRef] [PubMed]
- Al-Mashaykhi, B.; Hammam, R.; Wahab, M.; Rani, W.; Jasimin, T. Shared Street as A Means of Liveable Urban Space. In Proceedings of the IOP Conference Series: Earth and Environmental Science, the 1st International Conference on Urban Design and Planning, Semarang, Indonesia, 10 September 2019. [Google Scholar]
- Distefano, N.; Leonardi, S. Evaluation of the effectiveness of traffic calming measures by SPEIR methodology: Framework and case studies. Sustainability 2022, 14, 7325. [Google Scholar] [CrossRef]
- Engström, J.; Johansson, E.; Östlund, J. Effects of visual and cognitive load in real and simulated motorway driving. Transp. Res. Part F Traffic Psychol. Behav. 2005, 8, 97–120. [Google Scholar] [CrossRef]
- Park, E.S.; Fitzpatrick, K.; Das, S.; Avelar, R. Exploration of the relationship among roadway characteristics, operating speed, and crashes for city streets using path analysis. Accid. Anal. Prev. 2021, 150, 105896. [Google Scholar] [CrossRef]
- Jones, T.R.; Potts, R.B. The measurement of acceleration noise—A traffic parameter. Oper. Res. 1962, 10, 745–763. [Google Scholar] [CrossRef]
- Xu, L.; Huang, B. Lateral acceleration interference model of vehicle driving on curved road. J. Chongqing Jiaotong Univ. (Nat. Sci.) 2019, 38, 92. [Google Scholar]
- Nash, C.J.; Cole, D.J.; Bigler, R.S. A review of human sensory dynamics for application to models of driver steering and speed control. Biol. Cybern. 2016, 110, 91–116. [Google Scholar] [CrossRef] [PubMed]
- Polikarpova, M. Eye-movements during the perception of dangerous driving among drivers of different age and social groups. Soc. Psychol. Soc. 2018, 9, 87–97. [Google Scholar] [CrossRef]
- Cale, M.H.; Gellert, A.; Katz, N.; Sommer, W. Can minor changes in the environment lower accident risk at level crossings? Results from a driving simulator-based paradigm. J. Transp. Saf. Secur. 2013, 5, 344–360. [Google Scholar] [CrossRef]
- Hatfield, J.; Murphy, S.; Job, R.S.; Du, W. The effectiveness of audio-tactile lane-marking in reducing various types of crash: A review of evidence, template for evaluation, and preliminary findings from Australia. Accid. Anal. Prev. 2009, 41, 365–379. [Google Scholar] [CrossRef] [PubMed]
- García, A.; Moreno, A.T.; Romero, M.A. Development and validation of speed kidney, a new traffic-calming device. Transp. Res. Rec. 2011, 2223, 43–53. [Google Scholar] [CrossRef]
- Hunter, M.; Boonsiripant, S.; Guin, A.; Rodgers, M.O.; Jared, D. Evaluation of effectiveness of converging chevron pavement markings in reducing speed on freeway ramps. Transp. Res. Rec. 2010, 2149, 50–58. [Google Scholar] [CrossRef]
- Pawar, D.S.; Patil, G.R. Response of major road drivers to aggressive maneuvering of the minor road drivers at unsignalized intersections: A driving simulator study. Transp. Res. Part F Traffic Psychol. Behav. 2018, 52, 164–175. [Google Scholar] [CrossRef]
- Haleem, K.; Alluri, P.; Gan, A. Analyzing pedestrian crash injury severity at signalized and non-signalized locations. Accid. Anal. Prev. 2015, 81, 14–23. [Google Scholar] [CrossRef] [PubMed]
- Domenichini, L.; Branzi, V.; Smorti, M. Influence of drivers’ psychological risk profiles on the effectiveness of traffic calming measures. Accid. Anal. Prev. 2019, 123, 243–255. [Google Scholar] [CrossRef] [PubMed]
Figure 1.
Driving simulator and computer control platform.

Figure 2.
iView XTM HED 4 eye tracker.

Figure 3.
The actual state of the intersection.

Figure 4.
The four speed-calming measures utilized in the experiment.

Figure 5.
Distribution of the direction of drivers’ gazes.

Figure 6.
Depiction of vehicle speed.


Table 1.
Analysis of significance of impacts on duration and number of fixations.
| Dependent Variable | Control Group (Baseline) 1 | Treatment Group | Mean Difference (95% CI) 2 | p-Value 3 |
|---|---|---|---|---|
| Duration of fixation | 1 | 2 | −2450.7 (−4355.5, −546.0) | 0.035 |
| 3 | −1924.3 (−3829.1, −19.6) | 0.097 | ||
| 4 | −2038.9 (−3943.7, −134.2) | 0.079 | ||
| 5 | −1132.9 (−3037.7, 771.9) | 0.325 | ||
| Number of fixations | 1 | 2 | −3.8 (−11.3, 3.7) | 0.406 |
| 3 | −8.6 (−16.1, −1.1) | 0.060 | ||
| 4 | −4.4 (−12.1, 3.2) | 0.328 | ||
| 5 | −3.0 (−10.5, 4.5) | 0.509 |
1 Treatment 1, no speed-calming measures; 2, anti-collision barrels; 3, traffic-channelizing lane markings; 4, anti-collision barrels and traffic-channelizing lane markings combined; 5, speed bumps and cross-hatched intersection markings combined. 2 95% Confidence Interval. 3 p < 0.1.
Table 2.
Significance analysis of mean of longitudinal acceleration.
| Treatment Group | p-Value * |
|---|---|
| 1. No speed-calming measures (baseline) | - |
| 2. Anti-collision barrels | 0.021 |
| 3. Traffic-channelizing lane markings | 0.018 |
| 4. Anti-collision barrels and traffic-channelizing lane markings | 0.048 |
| 5. Speed bumps and cross-hatched intersection markings | 0.383 |
* p < 0.05.
Table 3.
Acceleration noise in the presence of different speed-calming measures.
| Treatment | Numerical Value |
|---|---|
| 1. No speed-calming measures | 0.725 |
| 2. Anti-collision barrels | 1.382 |
| 3. Traffic-channelizing lane markings | 0.903 |
| 4. Anti-collision barrels and traffic-channelizing lane markings | 1.820 |
| 5. Speed bumps and cross-hatched intersection markings | 1.787 |
Disclaimer/Publisher’s Note: The statements, opinions and data contained in all publications are solely those of the individual author(s) and contributor(s) and not of MDPI and/or the editor(s). MDPI and/or the editor(s) disclaim responsibility for any injury to people or property resulting from any ideas, methods, instructions or products referred to in the content. |
© 2024 by the authors. Licensee MDPI, Basel, Switzerland. This article is an open access article distributed under the terms and conditions of the Creative Commons Attribution (CC BY) license (https://creativecommons.org/licenses/by/4.0/).
Share and Cite
MDPI and ACS Style
Qin, Y.; Wu, Y.; Guo, M. A Simulator Study on the Driving Impacts of Four Speed-Calming Measures at Unsignalized Intersections. Appl. Sci. 2024, 14, 3542. https://doi.org/10.3390/app14093542
AMA Style
Qin Y, Wu Y, Guo M. A Simulator Study on the Driving Impacts of Four Speed-Calming Measures at Unsignalized Intersections. Applied Sciences. 2024; 14(9):3542. https://doi.org/10.3390/app14093542
Chicago/Turabian StyleQin, Yaqin, Yang Wu, and Miao Guo. 2024. "A Simulator Study on the Driving Impacts of Four Speed-Calming Measures at Unsignalized Intersections" Applied Sciences 14, no. 9: 3542. https://doi.org/10.3390/app14093542
Note that from the first issue of 2016, this journal uses article numbers instead of page numbers. See further details here.