Novel Microscopic Approach to Particle Size Evaluation in Colloidal Systems
by
 , , , , and
Pietro Calandra
1 ,
,
Abraham A. Abe
2,* ,
,
Antonio Scavo
3,
Leonardo Bruno
4 ,
,
Cesare Oliviero Rossi
3,5,* and
Paolino Caputo
3,5 1
National Research Council, Institute of Nanostructured Materials (CNR-ISMN), Via Salaria km 29.300, 00015 Monterotondo, Italy
2
Department of Chemistry, University of Bari, Via E. Orabona 4, 70126 Bari, Italy
3
Department of Chemistry and Chemical Technologies, University of Calabria, Via P. Bucci, Cubo 14/D, 87036 Rende, Italy
4
Department of Biology, Ecology and Earth Sciences (DiBEST), University of Calabria, 87036 Rende, Italy
5
UdR INSTM della Calabria, Via P. Bucci, Cubo 14/D, 87036 Rende, Italy
*
Authors to whom correspondence should be addressed.
Appl. Sci. 2024, 14(9), 3567; https://doi.org/10.3390/app14093567
Submission received: 22 March 2024
/
Revised: 13 April 2024
/
Accepted: 19 April 2024
/
Published: 24 April 2024
Abstract
:Colloidal systems are peculiar mixtures formed by the uniform dispersion of sub-micro sized particles of one substance through another substance. In this framework, a particular colloidal system, known as sol, is a colloid in which the dispersed particles are solid, and the dispersing medium is fluid. Sols have extensive applications in industries ranging from material science to food to pharmaceuticals and cosmetics. The size and size distribution of colloidal particles within these systems play a pivotal role in determining their stability, rheological properties, and overall functionality (which in turn directly influence material quality, performance, and shelf life). As a result, this study is aimed at devising a new method to analyze the dimensions of the colloidal particles (dispersed phase) of a colloidal system (sol), like bitumen, by (i) a cheap and common technique, optical microscopy, and (ii) the more complex confocal laser scanning microscopy. To do so, a validation by comparison with a standard technique—in this case, atomic force microscopy is presented. Both optical and confocal microscopies turned out to be suitable, valid, and effective for particle size determination. Both techniques effectively revealed, upon bitumen aging, a shift of the size distribution to slightly larger sizes. Large particles, whose abundance did not increase significantly, appeared to be more inert than small ones. A huge advantage of optical microscopy is its popularity and cost-effectiveness as it is commonly featured in laboratories independently of the research topic. On the other hand, confocal microscopy can observe more particles, thus providing better statistics. It also appears to be more efficient for particles smaller than 1 µm2. These microscopy techniques were used to evaluate the dimensions of the asphaltenes present in a complex colloidal system; bitumen; the model colloidal system for this study, which was examined before and after an aging process which is expected to change the size distribution.
1. Introduction
Colloidal systems and their applicability span through a variety of industrial and research fields such as material science, biology, and chemistry. They include sols, gels, macromolecules, proteins, polymer latexes, nanocrystallites, and even living cells. To effectively exploit the range of applications of nanoparticles having dimensions ranging from 1 to 100 nm, high-resolution preparation, sizing, and classification techniques are fundamental. Several chemical approaches involving liquid-phase methods, such as reverse micelles and sol-gel, exist for the production of colloidal nanoparticles. An in-depth understanding of nanoparticle size and particle dispersity is fundamental for the stability of colloidal systems as many of the properties associated with nanosized particles are largely dependent on size [1,2,3]. In this ambit, the most effective methods for nanoparticle characterization involve microscopy-based methods [4]. Recent developments in nanoscience have been inspired by the observation that materials and their properties can be improved by tuning and adjusting particle size to match the desired outcome. However, the possibility of unpredictable and undesirable systemic effects which can be brought about by enhanced reactivity and modified properties has recently been a source of concern. Therefore, the proper characterization of the physicochemical properties of the nanomaterials in question is very important [5,6,7].
The colloidal model system used in this study is bitumen, which is a multidisperse micellar colloidal system (in particular, a sol) with a complex internal structure of the colloidal particles (solid asphaltene micelles) uniformly dispersed and suspended in an oily maltene phase. The asphaltene phase structure, which depends on the nature of the dispersion of the asphaltene micelles, has a significant effect on bitumen’s rheological properties. Maltenes are believed to constitute a continuous dispersing phase in which the asphaltenes are dispersed. During the aging of bitumen, its aromatic components and resins become oxidized and are reduced to saturates leading to the hardening of the bitumen binder [8,9]. This oxidation results in an increase in the size of the asphaltene micelles, thereby changing the bitumen’s structure and reducing the fluidity of the system [10]. It has been observed that the asphaltene aggregates which form during bitumen aging form a dispersed ‘sol’ structure in the continuous maltene phase instead of an expected network ‘gel’ structure [11]. The aging phenomenon brings about a degradation in the quality of the road pavement (bituminous conglomerate) and so the bituminous layers need to be removed and replaced using a new bituminous conglomerate. It is important to state that in view of a circular economy, a practice promoting resource conservation and recycling can be implemented. Using this approach, degraded bituminous layers, after removal, can be milled and processed to extract valuable asphalt binder (bitumen) and inorganic stone aggregates. This is known as reclaimed asphalt pavement (RAP). In recent years, researchers have investigated the use of RAP in the production of recycled asphalt. The use of RAP for the production of new road pavements is at the center of research in the asphalt industry. The use of chemical additives is aimed at increasing the percentage of RAP in the production of bituminous conglomerates while maintaining the performance and life span of the road. The most common problem faced by both those who carry out quality control on bituminous conglomerates and those who research new additives to improve the performance of road pavements with RAP is to distinguish a potential rejuvenating effect from a fluxing effect. In fact, a flux-improving additive does not interact with the oxidized parts of the bitumen, leaving them unchanged while merely reducing the viscosity of the asphalt concrete. For this reason, the resulting road pavement will be very fragile and, therefore, its lifespan will be very short. On the contrary, a rejuvenating additive, thanks to its chemical interaction with the parts of the oxidized bitumen, will restore elasticity to the bitumen binder, thus restoring its physicochemical properties to the initial pre-oxidation state. In this study, only the solid part of bitumen, the asphaltenes, was considered due to the fact that studies in the literature [10,12,13] have shown that during the oxidation process, they tend to increase in size, thus stiffening the system. It is evident how fundamental it is to have techniques that can efficiently analyze the size distribution of these solid dispersed particles within bitumen. The present study is aimed at finding and validating new and cost-effective methods for size distribution analysis in this kind of material. Optical and confocal laser scanning microscopy techniques were used to investigate the size distribution of the asphaltene particles in a paving-grade bitumen subjected to an aging process. The changes in the dimensions of the asphaltenes during the process of aging were evaluated to estimate the effect of oxidation on the asphaltene fraction of the bitumen system. To do so, the standard atomic force microscopy technique, generally recognized as the pivotal technique to investigate asphaltene size distribution in bitumen, has been taken into account for comparative purposes. The novelty of this work lies in the development of a new, relatively easy sample preparation method making it easier and more straightforward to directly observe colloidal particles (asphaltenes) using optical microscopy (OM). This sample preparation method coupled with software image analysis and elaboration using data-based software brings about determination of the area values of the elliptical colloidal particles, thereby providing particle dimensions and size distributions.
Generally, the bitumen samples analyzed by AFM are investigated in intermittent-contact (IC) mode (tapping) [14,15]. Compared to many other microscopic techniques, this device can resolve surfaces below the Abbe diffraction limit by simply scanning or tapping the surface with a nanometer-sized tip. It has thus become one of the most popular techniques to investigate the microstructure of bitumen and tackle the question mentioned above on the origin or reason for the microstructure [16].
In the present study, the AFM analysis was used as an evaluation template to determine the effectiveness of the confocal and optical microscopy methods in measuring the asphaltene size of the bitumen system [17,18,19]. Confocal laser scanning microscopy (CM) particularly exploits the principle of measurements which are dynamically focused based on a focus-detection technique. This technique is also a scanning optical microscopy technique due to the fact that the light beam illuminates only one spot (with a diameter of (≈0.5 µm) at a time and the sample surface must be scanned or rotated to generate the image pixel by pixel. Three-dimensional measurements using CM can also be carried out by performing a raster scan of the laser spot over the measured surface [20].
Optical microscopy (OM) imaging requires no scanning and thus can be acquired rapidly, even in real-time, limited only by the camera frame rate. At low magnification, even though the internal structure is no longer resolved, such microstructures appear as near-point-like optical scattering centers. All microstructures within the optical absorption depth contribute to the observed optical scattering, thus optical probes provide access to subsurface structures. Finally, optical microscopy investigations require no mechanical contact with the sample surface so they can characterize bitumen microstructures equally well at any temperature, whether the sample is frozen or heated beyond its melting point [21]. In addition, these instruments are very popular and relatively cheap. In fact, optical microscopes are commonly found in science laboratories regardless of the research theme.
Bitumen’s viscoelastic performance and especially the aging phenomenon have been investigated by several researchers and scholars using an array of physicochemical and mechanical methods due to the direct correlation of these analyses with asphalt behavior and performance. Microscopic approaches to investigating the microstructural patterns and changes associated with oxidative aging are becoming increasingly popular, making it very instrumental to achieving an in-depth understanding of the intricacies of bitumen’s structure pre- and post-aging. In the scientific literature, several studies have been published involving the use of atomic force microscopy (AFM) or confocal laser scanning microscopy (CM) in the investigation of bitumen’s microstructure. These studies were able to evidence the changes in the dimensions of the so-called bee structures present in bitumen’s matrix. Some of these studies either revealed or aimed at resolving the conflicting observations that exist on the subject of the fluorescent centers (asphaltenes) of oxidized bitumen, especially regarding their number, dimensions, and clustering [22,23]. This present study utilized a microscope equipped with a photo camera to capture images of the microscopic morphology of bitumen’s structure. The images obtained were elaborated using ImageJ software (v1.4.3.x) to determine the sizes of the asphaltene particles. This software was coupled with another software developed by our research group which enabled us to obtain the representation of the distributions of these particles in a predefined range with a subdivision into a set number of classes. This paper provides a comparative analysis of the three techniques (OM, AFM, and CM) used to evaluate the dimensions of the asphaltenes present in the colloidal system of aged bitumen, This comparative study was carried out on the basis of validating this new method which combines easy sample preparation, microscopy, image analysis via software, and data elaboration via particle range subdivision software.
2. Experimental Section
2.1. Materials
The base bitumen (having a penetration grade of 170/210) was kindly supplied by Cimar srl, (Salerno, Italy).
2.2. Bitumen Aging Process
In the laboratory, the aging process bitumen undergoes during its lifespan on the road surface was simulated by the Rolling Thin-Film Oven Test (RTFOT, according to ASTM D2872-04) [24,25,26,27]. The duration of this test was extended from 75 to 225 min in order to obtain a bitumen rigid enough to simulate a prolonged ageing process of about 10–12 years, which is a period typical of recycled asphalts.
2.3. Atomic Force Microscopy (AFM)
The atomic force microscopy (AFM) analysis was carried out using a Bruker Nanoscope VIII microscope set to tapping mode. The oscillations of the cantilever were regulated close to its resonance frequency of 150 kHz. As a result of the upward and downward oscillation of the cantilever, its tip interacts sporadically with the surface of the sample. This interaction between the sample surface and the cantilever tip brings about the vibration of the cantilever. The morphological features of the tested sample determine the magnitude of the vibrations, which is influenced by the phase angle shift of the of the cantilever tip when it vibrates, signifying energy dissipation in the tip–sample ensemble. Cantilevers with elastic constants of 5 N/m and 42 N/m were used for the measurements. Phase and topography images were taken contemporarily.
2.3.1. Intermittent-Contact (IC) Mode (Tapping)
This mode is similar to non-contact (NC)-AFM, except that the vibrating cantilever tip is brought closer to the sample so that at the downward end of its motion, it just barely hits or “taps” the sample. In IC-AFM, the cantilever’s oscillation amplitude changes in response to tip-to-sample spacing just as in NC-AFM. An image representing the surface topography is obtained by monitoring these changes.
Some samples are best handled using IC-AFM instead of contact or non-contact AFM. IC-AFM is less likely to damage the sample than contact AFM because it eliminates lateral forces (friction or drag) between the tip and the sample. In general, it has been found that IC-AFM is more effective than NC-AFM for imaging larger scan sizes that may include greater variation in sample topography. IC-AFM has become an important AFM technique since it overcomes some of the limitations of both contact and non-contact AFM. In the case of AFM, the surface of the sample (reflex) is analyzed while in the microscopy techniques, a beam passes through to the sample (transmittance).
2.3.2. AFM Sample Preparation
- -
- A laboratory grade oven was set to a temperature of 100 °C. When the oven reached the desired temperature, the sample was introduced. Using a spatula, a small scoop of solid bitumen was taken and smeared on the AFM sample disk.
- -
- The sample disk was put in the oven for 10 min.
- -
- After 10 min, the oven was turned off and left open in order to enable the bitumen sample to cool gradually.
- -
- When the oven temperature had cooled down to room temperature, the sample was taken out.
- -
- The sample was analyzed using the AFM instrument and images were captured.
2.4. Optical Microscopy (OM)
Each sample was placed on a microscope slide and observed using a Prior MP3500K (Prior Scientific Instruments Ltd., Cambridge, UK) optical microscope stand with Koehler Type Illumination Halogen 6 V 20 W for transmitted polarized light, equipped with 20× 5× and 2.5× objective lenses [28]. The microscope setup also comprised of a Canon EOS 4000D (Tokyo, Japan) camera which was attached to the ocular lens of the microscope and was used to capture the images observed.
2.5. Confocal Laser Scanning Microscopy (CM)
Confocal laser scanning microscopy (CM) operates differently from a regular optical microscope as it focuses light on and images the sample one point at a time through a pinhole [29,30]. A light beam passes through this pinhole, falling on the objective lens via a beam splitter. This illuminating light beam is focused by the objective to a diffraction-limited spot at the focal plane. If the objective lens or the sample specimen is adjusted or shifted in order to focus the light spot on the sample surface, then the shift of the objective lens or the sample specimen determines the information gathered on the vertical dimension of the surface topography. When the sample surface is stationary, such as in the case of this study, the objective is moved by a piezo-electrical transducer so as to focus the light beam laser spot on the sample surface. As soon as the laser spot is focused on the surface, the light reflected back passes through the pinhole and is detected by the detector. If the sample surface is not in focus, the size of the laser spot on the detector plane is larger and there is less light intensity transmitted. The coinciding nature of the focal planes of illumination and imaging systems is how the term confocal microscopy was coined [31].
The specimens on microscope slides were observed under a Leica inverted TCS SP8 confocal scanning laser microscope equipped with 20× and 40× objective lenses. An argon laser excitation wavelength at 488 nm and an emission window of 509 nm were used.
The fluorescence exited at 555 nm and the fluorescence emissions was assessed at 569 nm 40 × 0.3 NA HC PL fluotar lens.
Preparation of Glass Slides for Optical (OM) and Confocal Microscopy
- -
- A glass slide was placed on an electric heating plate which was set to between 150 and 200 °C.
- -
- Using a spatula, a small scoop of solid bitumen was taken and smeared on the hot glass slide.
- -
- After a few seconds, a glass cover slip was placed on the part of the glass slide covering the smeared bitumen.
- -
- The glass slide was removed from the heating plate and the cover slip was gently moved in a circular motion to continuously smear the bitumen sample until it became so thin in that light could pass through it; see Figure 1.
- -
- The glass slide was allowed to cool, and then microscopic analysis was carried out.
Figure 1 shows how the bitumen samples placed between the 2 slides appears transparent and can be said to be penetrable by light rays.
2.6. Data Elaboration
The statistical analyses of the sizes of the asphaltene particles were performed using ImageJ [32,33,34]. Data were collected from multiple images made at different points of the same sample and these data were used to obtain the representation of the distributions of these particles in a predefined range with a subdivision into a set number of classes.
3. Results and Discussion
The x-axis in each graph represents the calculated area. The area was calculated using the ImageJ program (which gives us the major and minor axis of the particles) and the data software which returns an area calculated by approximating the particle to an ellipse. To reduce the error, particles with circularity < 0.3 were not taken into account (the formula for circularity is 4π(Area/Perimeter2) [35].
Once the area of the particles was calculated, it was divided into classes and the number of particles detected for each class was counted (class population). All the values reported on the y-axis of the following graphs are presented according to the fraction of solid particles present and dispersed in the colloidal system. This axis represents the abundance of the colloidal particles (asphaltenes). This abundance is a measure of the occurrence of each size range of the particles relative to the total particle number in the tested sample. The abundance was obtained by dividing the number of particles of a certain dimension by the total number of particles. On the y-axis, the population of the columns which have been divided by the total number () is shown.
The calculation of the abundance was repeated separately for each technique (and each thickness of the glass slides in the case of the optical microscope). The reason for choosing the area limits and the number of classes is explained below.
Optical microscopy: From the photos taken, approximately 10,000 particles per photo are detected. Of these, those that are too small to be distinguished (smaller than 0.4 µm2) and those that are too large most likely from spots in the microscope lenses up to a maximum size of 4 µm are discarded.
- Confocal microscopy: Confocal microscope photos have a photo resolution of 0.3 µm2/pixel, therefore, we opted to group the particle count into 14 classes (this is a low resolution for a line graph, and is due to the poor resolution of the photos) thanks to the data software provided by our collaborator (Professor Ranieri who is duly acknowledged in the footnotes).
- Atomic Force Microscopy: The procedure is the same, but since this technique has a high resolution, we did not consider the particles which are undetectable on the optical microscope (being the technique with the lowest resolution); for the same reason, the total number of particles per photo is very low (about a hundred).
With regards to the trend lines in the graphs, the points that are graphed as in the previous explanations on the values plotted on x and y axes were then interpolated with fifth and sixth degree polynomial trend lines in Excel [36,37]. The correlation with the number of data points and the degree of polynomial interpolation is explained below.
“Generally, if we have n data points, there is exactly one polynomial of degree at most n−1 going through all the data points. The interpolation error is proportional to the distance between the data points to the power n. Furthermore, the interpolant is a polynomial and thus infinitely differentiable. So we see that polynomial interpolation overcomes most of the problems of linear interpolation”.[38]
In general, the graphs show the notable differences between the sizes of the particles and their frequency or distribution in general. It can thus be said that different particle size classes occurred in varying frequencies in this investigation.
The virgin bitumen sample was initially analyzed using OM at the different thicknesses obtained, sequentially reducing the distance between the two glass slides starting from 21 µm all the way to 9 µm. From the graph, it can be seen that the thickness does not influence the dimensions of the asphaltenes present in the bitumen sample. Therefore, since the measurements are independent of the thickness, all the analyses reported in this study will be carried out at 21 µm.
The dimensions of the solid particles (asphaltenes) are significantly smaller than the minimum thickness reached between the two slides, therefore problems of the possibility of deformation (crushing) of any asphaltene aggregates interacting together [39,40], due to compression during sample preparation, should not exist.
However, elongated clusters can be found in bitumen, presenting an interior with rippled patterns and sub-nanometer edges which are dispersed in a quite consistent matrix. These clusters are made up of asphaltene molecules showing different levels of aggregation as they are patterned into a hierarchical aggregation system [41]. This self-assembly phenomenon of asphaltenes at high levels of aggregation presents particles having a prolate ellipsoidal shape extending up to a few thousand nanometers [39,42].
For each sample, at least 10 images were captured at different points in order to obtain and thus elaborate over 10,000 data points that guarantee a significant value for each asphaltene dimension. In fact, Figure 2 shows the excellent reproducibility of the data obtained, even though they were carried out on the same sample at different thicknesses.
To validate the effectiveness of the OM technique, measurements of the dimensions of the asphaltenes present in the virgin bitumen sample were carried out using two other previously mentioned techniques already commonly used in scientific literature on this subject. Figure 3 shows the measurements using the three different techniques, OM, CM, and AFM, while the Figure 4 reports optical microscopy (OM) and confocal microscopy (CM) data of aged bitumen. It was observed that the results of the three techniques gave similar results, validating the use of OM to outline the trend of the size of the asphaltenes present in bitumen. In the case of the CM technique, it is possible to observe many more particles, as this technology allows us to acquire the image and then process the image itself digitally, therefore zooming in digitally and not using the lens. On the other hand, with OM and AFM techniques, it was not possible to have the same number of data points because these techniques operate at a higher magnification which only covers a smaller area. As a result of this, the quantity of observable particles is decidedly more limited.
In fact, for some types of bitumen whose dimensions are visible to the instrument (>0.5 nm), the OM technique is advantageous and is accredited as a less expensive and excellent complex asphaltene size measuring method when compared to the other techniques. However, for smaller dimensions, the other two techniques turn out to be the only ones that can be used and work best for this case scenario.
From the results, it is demonstrated that the asphaltene size measurements were independent of the sample thickness. This allows the analysis of any sample without concerning its thickness. We know that the asphaltenic fraction of bitumen is the most susceptible to oxidation, in fact by incorporating oxygen, they tend to form increasingly larger clusters. We expect that after the aging process, the distribution should shift significantly towards larger particles. The dimensions of the oxidized bitumen significantly increase compared to those of the asphaltenes of the virgin bitumen; in particular, the asphaltene size in the range 1.4–2.5 µm2. This is due to the increase of polar functional groups of the molecules in bitumen [43] with their ultimate aggregation and constrained dynamics typically caused by the aging process. The aged bitumen size distribution is, therefore, shifted, as expected, to slightly larger sizes compared to that of neat bitumen as can be seen in Figure 4.
From a deeper point of view, as shown in Figure 5, the abundance of larger particles did not increase significantly, so they appear to be more inert than small ones. This is reasonable since smaller particles are more susceptible to kinetic processes and are, therefore, less stable toward growth compared to larger particles; it is in fact well known that all kinetic processes are slower for larger particles. Figure 6 and Figure 7 show the particle distribution observed using OM and CM respectively.
However, not all asphaltenes increase their size so evidently after aging; some turn out to be less sensitive to this phenomenon, or sometimes the oxidation time is not sufficient for all the asphaltene particles to be oxidized. This brings about obtaining a non-homogeneous sample consisting of particles of different sizes which exhibit different aggregation patterns. This size distribution is shown in the graph plotted in Figure 8. For a complete characterization, it is, therefore, necessary to carry out an overall analysis of the sample and not calculate individual measurements on the sample. The goal of this study is to provide, through calculation and imaging programs, a method to process the results recorded by optical and confocal microscope and AFM, thus obtaining more information on the effect of aging and the effectiveness of additives.
4. Conclusions
The results showed that both optical and confocal microscopy (OM and CM) techniques are suitable, valid, and effective for particle size determination. OM is very popular and cheap, and it is often featured in laboratories independent of the research theme. On the other hand, in the case of the CM technique, it is possible to observe many more particles as this technology allows us to acquire the image and then process the image itself digitally, therefore, zooming in digitally and not using the lens. This allows for better statistics. Confocal microscopy also appears more efficient for particles smaller than 1 µm2.
In addition, the method of sample preparation turns out to be fundamental; in fact, although the asphaltene size measurements are independent of the sample thickness, the passage of light through the sample is necessary in order to acquire images. This method of sample preparation has not been performed in previous studies and can save a lot of time and effort in the study and investigation of bitumen’s inner morphology. Due to the fact that different bitumen samples from different sources might have varying amounts of asphaltenes, the method proposed by this study can prove to be a simple method of generating a visual representation of the distribution of asphaltenes in the bituminous matrix. It can also help in evaluating the effect of bitumen aging on asphaltene size.
In conclusion, given the importance of particle size determination in colloidal systems, these techniques will be very useful in the field of research of sol-gel colloidal systems like bitumen, and in the future, tests should be carried out on other types of colloidal systems to verify their effectiveness on them as well.
Author Contributions
P.C. (Pietro Calandra): writing—review and editing; A.A.A.: conceptualization and writing; A.S.: investigation and data curation; L.B.: methodology and validation C.O.R.: writing, methodology and validation P.C. (Paolino Caputo): methodology, validation and supervision. All authors have read and agreed to the published version of the manuscript.
Funding
This research received no external funding.
Institutional Review Board Statement
Not applicable.
Informed Consent Statement
Not applicable.
Data Availability Statement
Dataset available on request from the authors.
Acknowledgments
Special thanks to G.A. Ranieri (University of Calabria) for his support on software development and testing.
Conflicts of Interest
The authors declare no conflict of interest.
References
- Lenggoro, W.; Xia, B.; Okuyama, K. Sizing of Colloidal Nanoparticles by Electrospray and Differential Mobility Analyzer Methods. Langmuir 2002, 18, 4584–4591. [Google Scholar] [CrossRef]
- Kuchibhatla, S.; Karakoti, A.; Seal, S. Colloidal stability by surface modification. JOM 2005, 57, 52–56. [Google Scholar] [CrossRef]
- Pileni, M.P. Nanosized Particles Made in Colloidal Assemblies. Langmuir 1997, 13, 3266–3276. [Google Scholar] [CrossRef]
- Calandra, P.; Longo, A.; Liveri, V.T. Preparation and Characterisation of Na2S and ZnSO4 Nanoparticles in Water/AOT/n-Heptane Microemulsions. Colloid Polym. Sci. 2001, 279, 1112–1117. [Google Scholar] [CrossRef]
- Tuoriniemi, J.; Johnsson, A.C.J.H.; Holmberg, J.P.; Gustafsson, S.; Gallego-Urrea, J.A.; Olsson, E.; Pettersson, J.B.C.; Hassellöv, M. Intermethod comparison of the particle size distributions of colloidal silica nanoparticles. Sci. Technol. Adv. Mater. 2014, 15, 035009. [Google Scholar] [CrossRef] [PubMed]
- Joudeh, N.; Linke, D. Nanoparticle classification, physicochemical properties, characterization, and applications: A comprehensive review for biologists. J. Nanobiotechnol. 2022, 20, 262. [Google Scholar] [CrossRef]
- Stone, V.; Nowack, B.; Baun, A.; Van den Brink, N.; Von der Kammer, F.; Dusinska, M.; Handy, R.; Hankin, S.; Hassellöv, M.; Joner, E.; et al. Nanomaterials for environmental studies: Classification, reference material issues, and strategies for physico-chemical characterisation. Sci. Total Environ. 2010, 408, 1745–1754. [Google Scholar] [CrossRef]
- Rossi, C.O.; Caputo, P.; Loise, V.; Ashimova, S.; Teltayev, B.; Sangiorgi, C. A New Green Rejuvenator: Evaluation of Structural Changes of Aged and Recycled Bitumens by Means of Rheology and NMR. In Proceedings of the RILEM 252-CMB-Symposium on Chemo Mechanical Characterization of Bituminous Materials, Braunschweig, Germany, 17–18 September 2018; Poulikakos, L.D., Falchetto, A.C., Wistuba, M.P., Hofko, B., Porot, L., Di Benedetto, H., Eds.; RILEM Bookseries. Springer: Berlin/Heidelberg, Germany, 2019; Volume 20, pp. 177–182. [Google Scholar] [CrossRef]
- Tauste, R.; Moreno-Navarro, F.; Sol-Sánchez, M.; Rubio-Gámez, M.C. Understanding the bitumen ageing phenomenon: A review. Constr. Build. Mater. 2018, 192, 593–609. [Google Scholar] [CrossRef]
- Loise, V.; Calandra, P.; Abe, A.A.; Porto, M.; Rossi, C.O.; Davoli, M.; Caputo, P. Additives on aged bitumens: What probe to distinguish between rejuvenating and fluxing effects? J. Mol. Liq. 2021, 339, 116742. [Google Scholar] [CrossRef]
- Abe, A.A.; Rossi, C.O.; Eskandarsefat, S.; Porto, M.; Loise, V.; Venturini, L.; Caputo, P. Reclaimed asphalt recycling agents: Looking into the blueprint of their mechanisms of action. Constr. Build. Mater. 2023, 363, 129843. [Google Scholar] [CrossRef]
- Porto, M.; Caputo, P.; Loise, V.; Teltayev, B.; Angelico, R.; Calandra, P.; Rossi, C.O. New Experimental Approaches to Analyse the Supramolecular Structure of Rejuvenated Aged Bitumens. Ser. Geol. Tech. Sci. 2019, 6, 295–301. [Google Scholar] [CrossRef]
- Farshad, F.; Fardin, K.; Yong-Rak, K.; Reddy, K.S.; Hamzeh, F.H. Molecular dynamics modeling and simulation of bituminous binder chemical aging due to variation of oxidation level and saturate-aromatic-resin-asphaltene fraction. Fuel 2019, 237, 71–80. [Google Scholar] [CrossRef]
- Yu, X.; Burnham, N.A.; Tao, M. Surface microstructure of bitumen characterized by atomic force microscopy. Adv. Colloid Interface Sci. 2015, 218, 17–33. [Google Scholar] [CrossRef] [PubMed]
- Xing, C.; Jiang, W.; Li, M.; Wang, M.; Xiao, J.; Xu, Z. Application of atomic force microscopy in bitumen materials at the nanoscale: A review. Constr. Build. Mater. 2022, 342 Pt B, 128059. [Google Scholar] [CrossRef]
- Masson, J.F.; Leblond, V.; Margeson, J. Bitumen morphologies by phase-detection atomic force microscopy. J. Microsc. 2006, 221, 17–29. [Google Scholar] [CrossRef] [PubMed]
- Mirwald, J.; Hofko, B.; Pipintakos, G.; Blom, J.; Soenen, H. Comparison of microscopic techniques to study the diversity of the bitumen microstructure. Micron 2022, 159, 103294. [Google Scholar] [CrossRef] [PubMed]
- Amin, J.S.; Nikooee, E.; Ghatee, M.H.; Ayatollahi, S.; Alamdari, A.; Sedghamiz, T. Investigating the effect of different asphaltene structures on surface topography and wettability alteration. Appl. Surf. Sci. 2011, 257, 8341–8349. [Google Scholar] [CrossRef]
- Sabbaghi, S.; Shariaty-Niassar, M.; Ayatollahi, S.H.; Jahanmiri, A. Characterization of asphaltene structure using atomic force microscopy. J. Microsc. 2008, 231, 364–373. [Google Scholar] [CrossRef] [PubMed]
- Udupa, G.; Singaperumal, M.; Sirohi, R.S.; Kothiyal, M.P. Characterization of surface topography by confocal microscopy: I. Principles and the measurement system. Meas. Sci. Technol. 2000, 11, 305. [Google Scholar] [CrossRef]
- Ramm, A.; Sakib, N.; Bhasin, A.; Downer, M.C. Optical characterization of temperature- and composition-dependent microstructure in asphalt binders. J. Microsc. 2016, 262, 216–225. [Google Scholar] [CrossRef]
- Loebera, L.; Mullera, G.; Morelb, J.; Sutton, O. Bitumen in colloid science: A chemical, structural and rheological approach. Fuel 1998, 77, 1443–1450. [Google Scholar] [CrossRef]
- Pipintakos, G.; Hasheminejad, N.; Lommaert, C.; Bocharova, A.; Blom, J. Application of Atomic Force (AFM), Environmental Scanning Electron (ESEM) and Confocal Laser Scanning Microscopy (CLSM) in bitumen: A review of the ageing effect. Micron 2021, 147, 103083. [Google Scholar] [CrossRef] [PubMed]
- ASTM D2872-22; Standard Test Method for Effect of Heat and Air on a Moving Film of Asphalt (Rolling Thin-Film Oven Test). ASTM International: West Conshohocken, PA, USA, 2020; ASTM Book of Standards Volume 04.03. pp. 1–4. [CrossRef]
- Hu, Z.; Zhang, H.; Wang, S.; Xu, T. Thermal-oxidative aging mechanism of asphalt binder based on isothermal thermal analysis at the SARA level. Constr. Build. Mater. 2020, 255, 119349. [Google Scholar] [CrossRef]
- Saoula, S.; Soudani, K.; Haddadi, S.; Munoz, M.E.; Santamaria, A. Analysis of the Rheological Behavior of Aging Bitumen and Predicting the Risk of Permanent Deformation of Asphalt. Mater. Sci. Appl. 2013, 4, 312–318. [Google Scholar] [CrossRef]
- Rossi, C.O.; Caputo, P.; De Luca, G.; Maiuolo, L.; Eskandarsefat, S.; Sangiorgi, C. 1H-NMR Spectroscopy: A Possible Approach to Advanced Bitumen Characterization for Industrial and Paving Applications. Appl. Sci. 2018, 8, 229. [Google Scholar] [CrossRef]
- Bevan, M.A.; Eichmann, S.L. Optical microscopy measurements of kT-scale colloidal interactions. Colloid Interface Sci. 2011, 16, 149–157. [Google Scholar] [CrossRef]
- Lu, P.J. Confocal scanning optical microscopy and nanotechnology. In Handbook of Microscopy for Nanotechnology; Springer: Boston, MA, USA, 2005; pp. 3–24. [Google Scholar]
- Kino, G.S.; Corle, R.T. Confocal Scanning Optical Microscopy and Related Imaging Systems; Academic Press: Cambridge, MA, USA, 1996. [Google Scholar]
- Shaw, P.J. Introduction to confocal microscopy. In Light Microscopy in Biology; Oxford Academic: New York, NY, USA, 1999; pp. 45–71. [Google Scholar]
- Hasanvand, M.Z.; Behbahani, R.M.; Feyzi, F.; Mousavi-Dehghani, S. Asphaltene particles size and size distribution change at high pressure high temperature conditions: Experimental study on a heavy oil sample. High Temp. High Press. 2017, 46, 85–99. [Google Scholar]
- Duran, J.A.; Casas, Y.A.; Xiang, L.; Zhang, L.; Zeng, H.; Yarranton, H.W. Nature of Asphaltene Aggregates. Energy Fuels 2019, 33, 3694–3710. [Google Scholar] [CrossRef]
- Li, X.; Lu, S.; Niu, M.; Cheng, R.; Gong, Y.; Xu, J. Asphaltene Inhibition and Flow Improvement of Crude Oil with a High Content of Asphaltene and Wax by Polymers Bearing Ultra-Long Side Chain. Energies 2021, 14, 8243. [Google Scholar] [CrossRef]
- Takashimizu, Y.; Iiyoshi, M. New parameter of roundness R: Circularity corrected by aspect ratio. Prog. Earth Planet. Sci. 2016, 3, 2. [Google Scholar] [CrossRef]
- Walsh, S.; Diamond, D. Non-linear curve fitting using Microsoft Excel Solver. Talanta 1995, 42, 561–572. [Google Scholar] [CrossRef] [PubMed]
- Murphy, S. The Art of Polynomial Interpolation; Pennsylvania State University: University Park, PA, USA, 2022; Available online: https://psu.pb.unizin.org/polynomialinterpretation/ (accessed on 4 April 2024).
- Steffensen, J.F. Interpolation, 2nd ed.; Dover Publications Inc.: Mineola, NY, USA, 2006; ISBN 978-0-486-15483-1. [Google Scholar]
- Calandra, P.; Caputo, P.; De Santo, M.P.; Todaro, L.; Liveri, V.T.; Rossi, C.O. Effect of additives on the structural organization of asphaltene aggregates in bitumen. Constr. Build. Mater. 2019, 199, 288–297. [Google Scholar] [CrossRef]
- Kotlyar, L.S.; Sparks, B.D.; Woods, J.R.; Chung, K.H. Solids Associated with the Asphaltene Fraction of Oil Sands Bitumen. Energy Fuels 1999, 13, 346–350. [Google Scholar] [CrossRef]
- Tanaka, R.; Sato, E.; Hunt, J.E.; Winans, R.E.; Sato, S.; Takanohashi, T. Characterization of asphaltene aggregates using X-ray diffraction and smallangle X-ray Scattering. Energy Fuels 2004, 18, 1118–1125. [Google Scholar] [CrossRef]
- Tanaka, R.; Hunt, J.E.; Winans, R.E.; Thiyagarajan, P.; Sato, S.; Takanohashi, T. Aggregates structure analysis of petroleum asphaltenes with small-angle neutron scattering. Energy Fuels 2003, 17, 127–134. [Google Scholar] [CrossRef]
- Prosperi, E.; Bocci, E. A Review on Bitumen Aging and Rejuvenation Chemistry: Processes, Materials and Analyses. Sustainability 2021, 13, 6523. [Google Scholar] [CrossRef]
Figure 1.
The appearance of the final slide to be analyzed viewed from different angles of observation.
Figure 1.
The appearance of the final slide to be analyzed viewed from different angles of observation.

Figure 2.
Different thicknesses of the virgin bitumen sample via optical microscope.

Figure 3.
Comparison between the three techniques in an investigation on virgin bitumen.
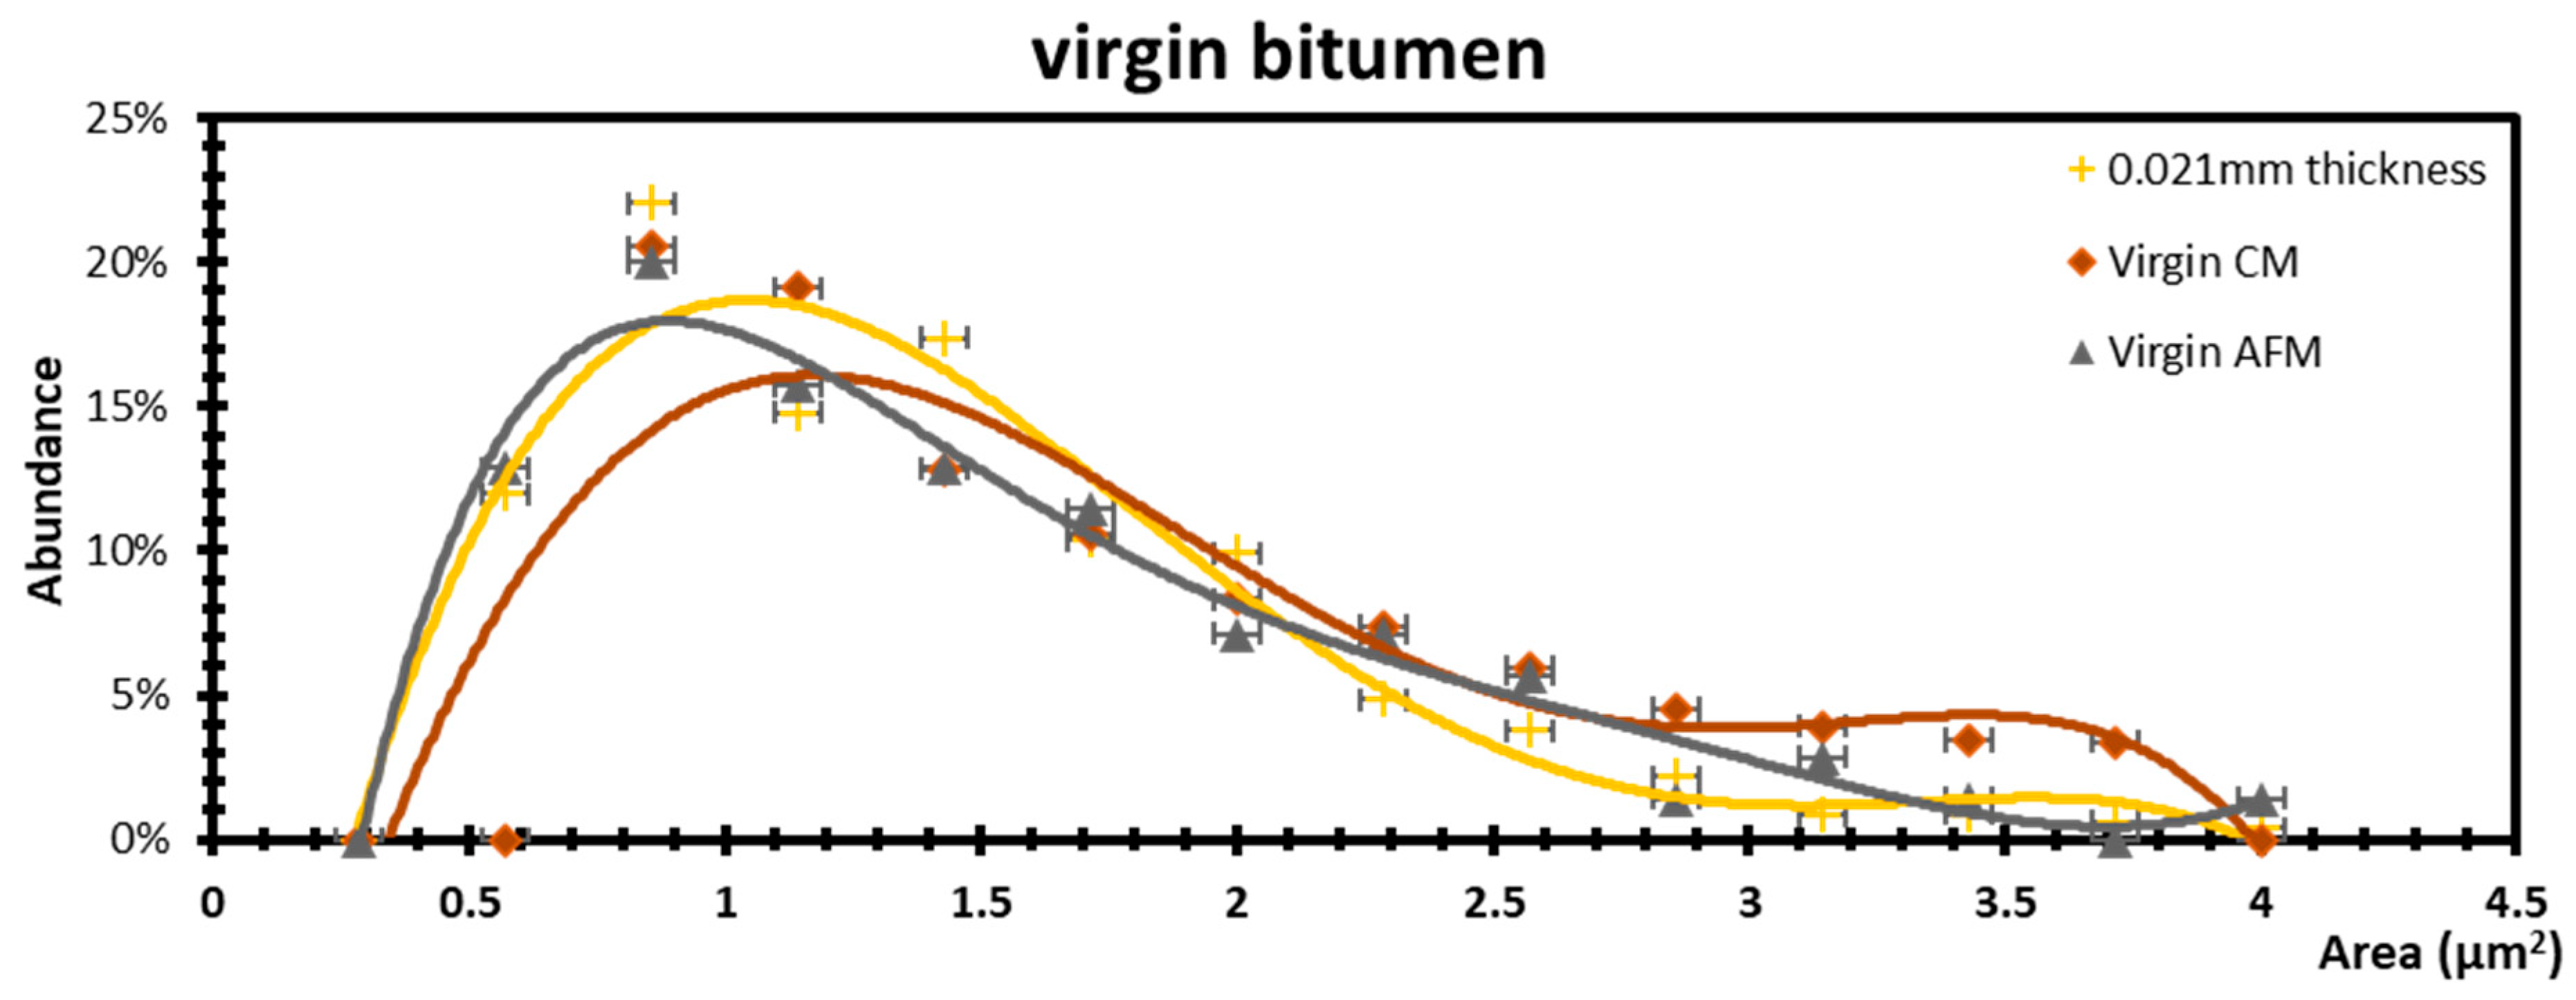
Figure 4.
Comparison between optical microscopy (OM) and confocal microscopy (CM) of aged bitumen.
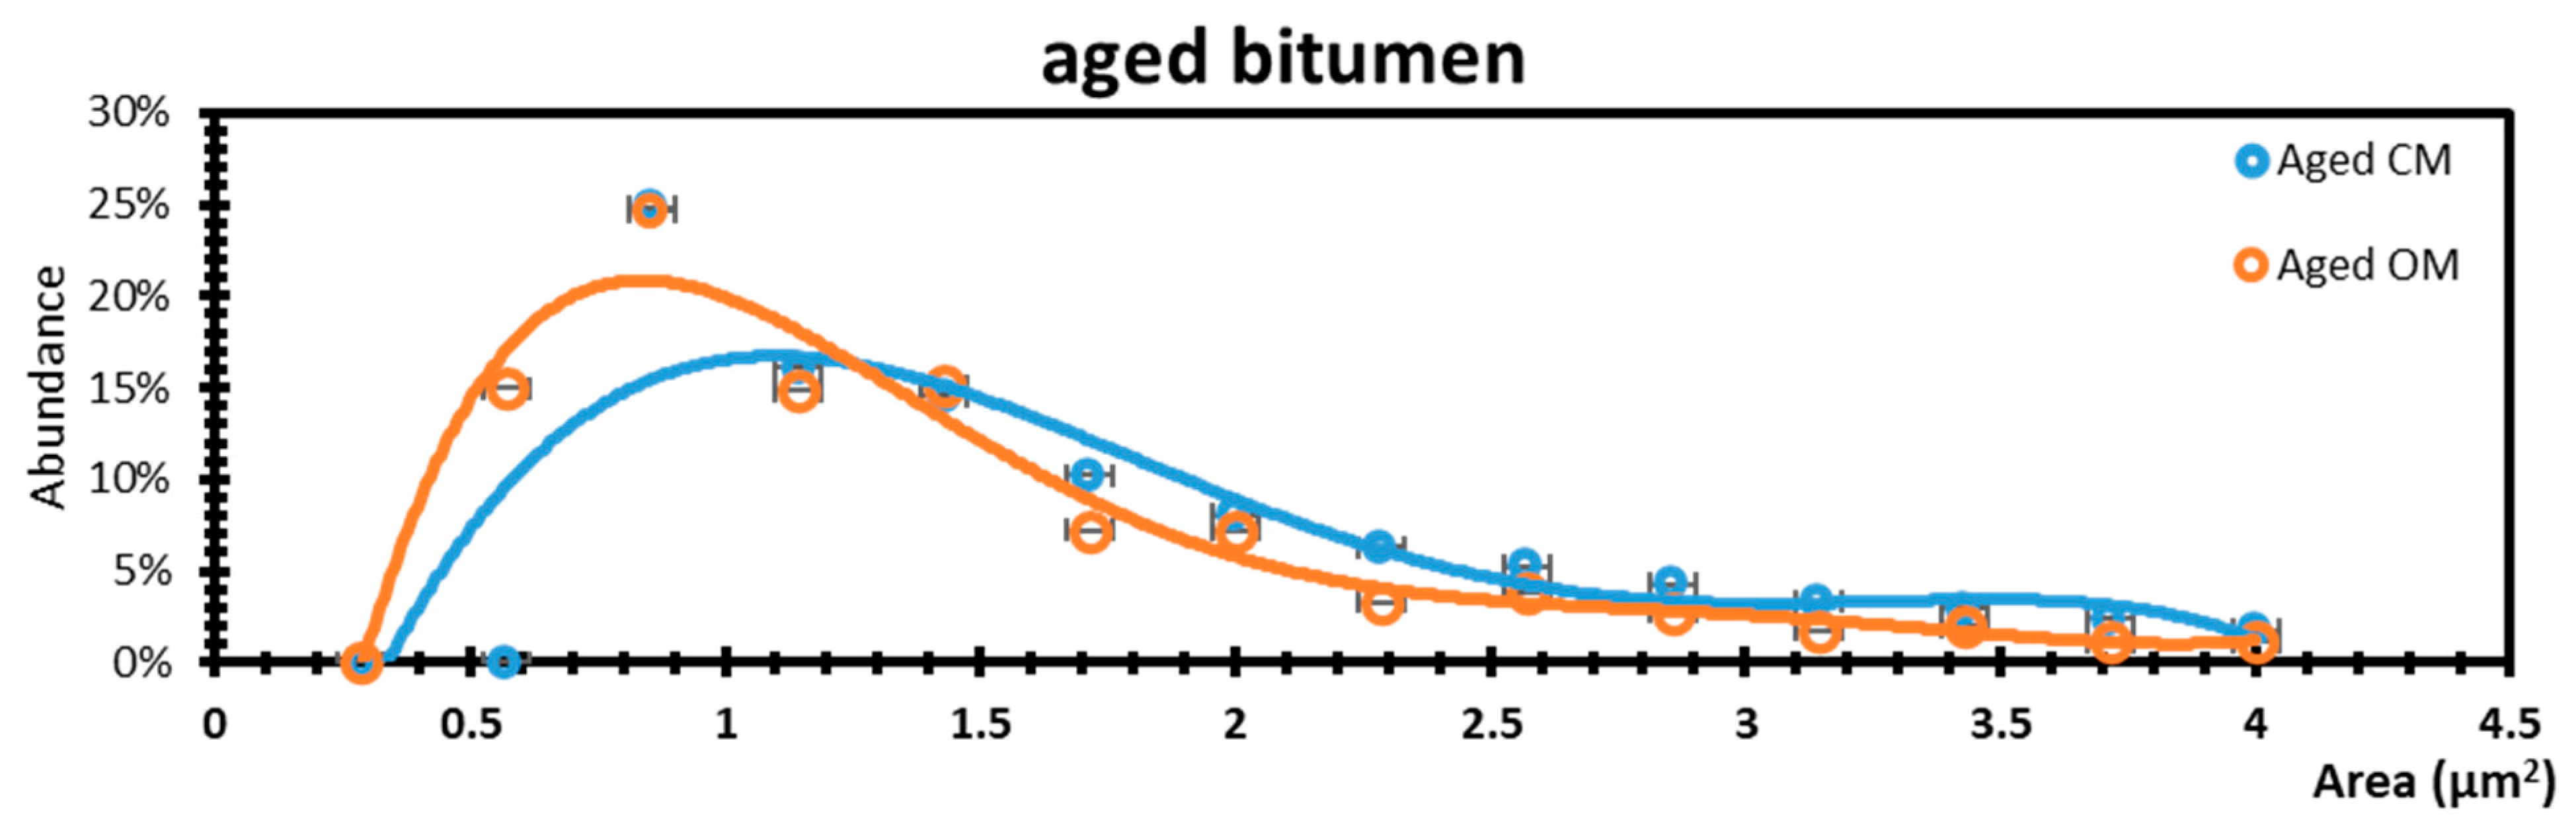
Figure 5.
Bitumen visualization: The same AFM image analyzed using the ImageJ program with three different types of color contrasts to determine the asphaltene size.
Figure 5.
Bitumen visualization: The same AFM image analyzed using the ImageJ program with three different types of color contrasts to determine the asphaltene size.
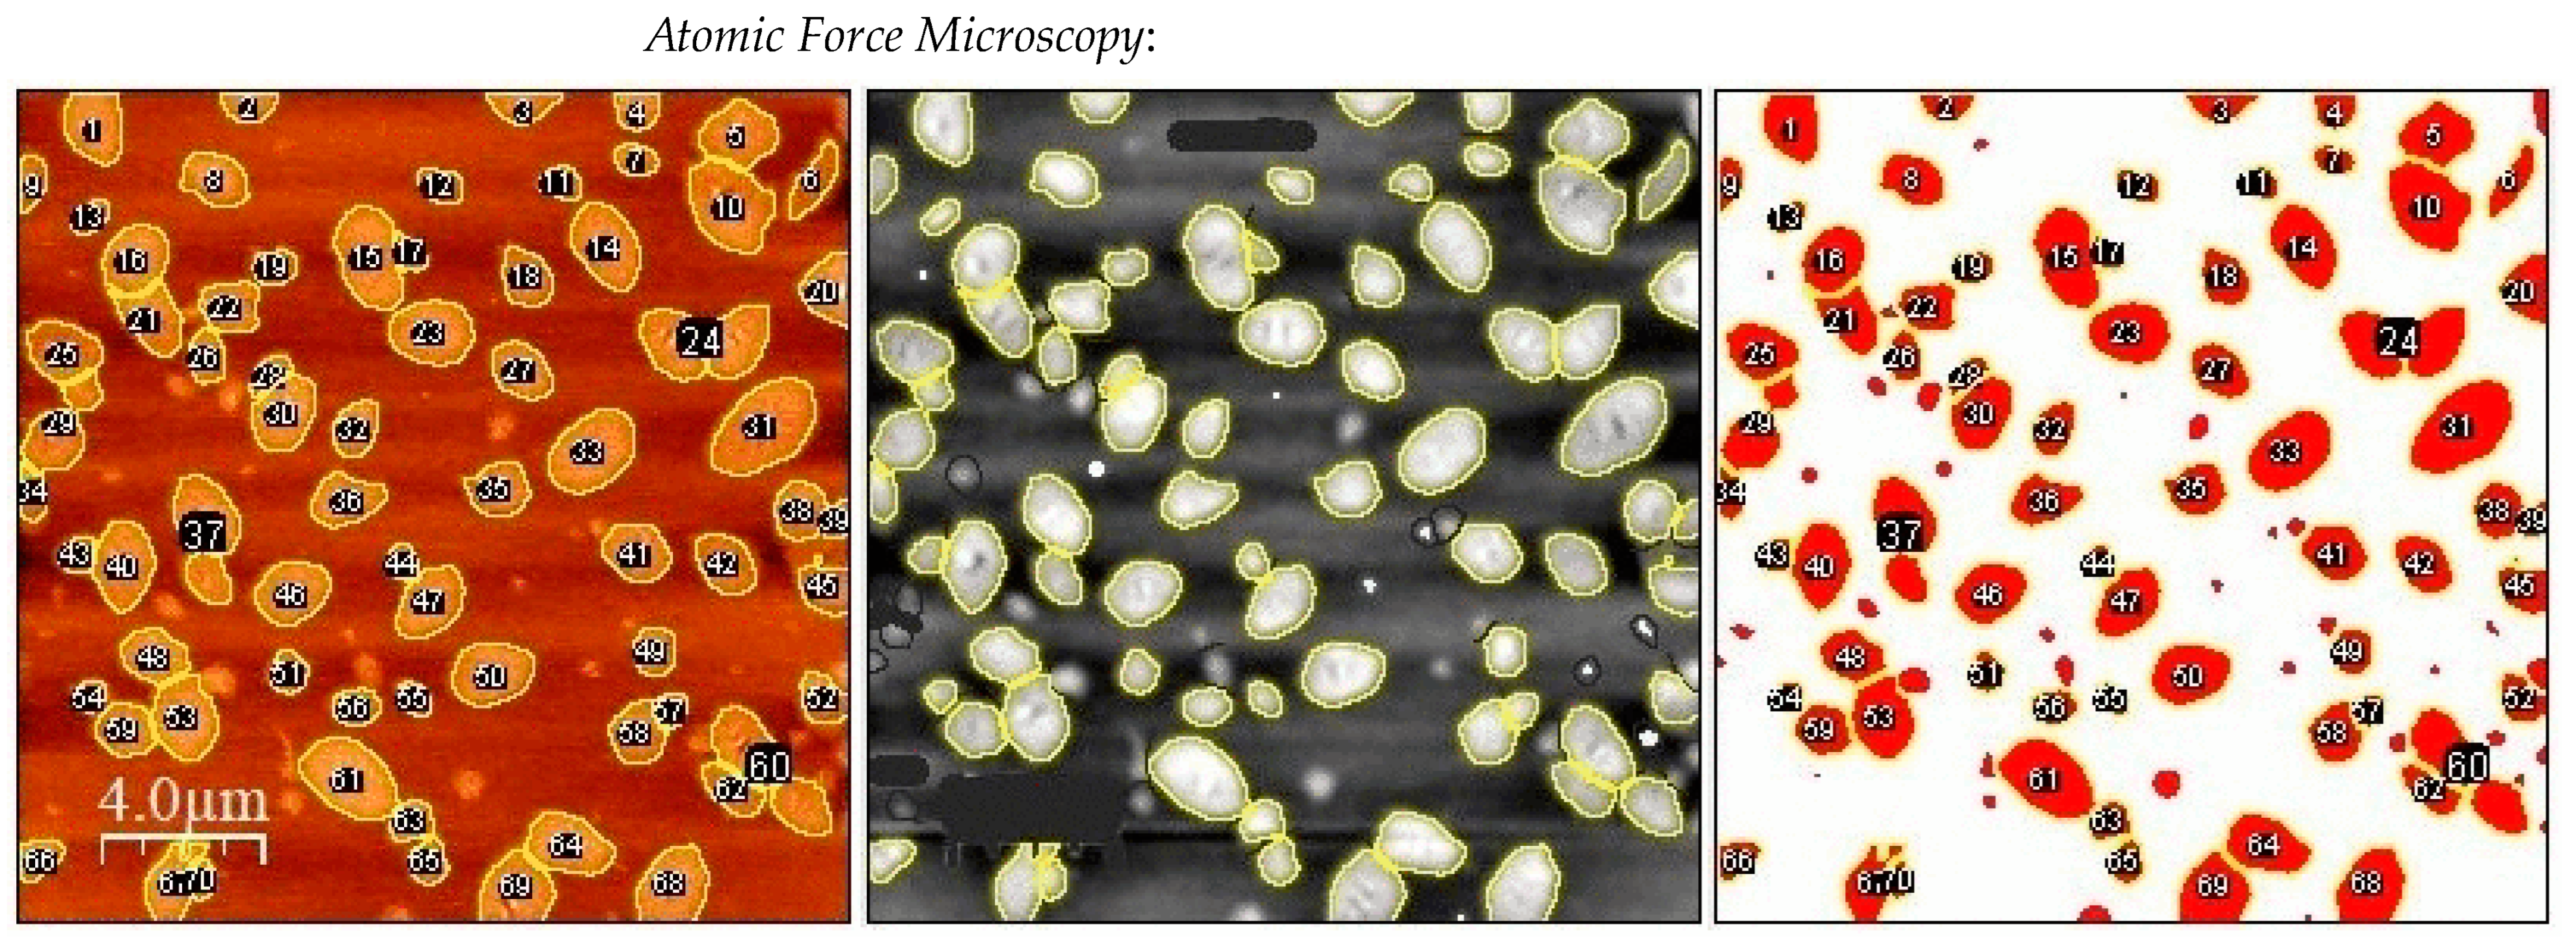
Figure 6.
Bitumen visualization by optical microscopy with Koehler Type Illumination Halogen 6 V 20 W for transmitted polarized light, equipped with 20×.
Figure 6.
Bitumen visualization by optical microscopy with Koehler Type Illumination Halogen 6 V 20 W for transmitted polarized light, equipped with 20×.
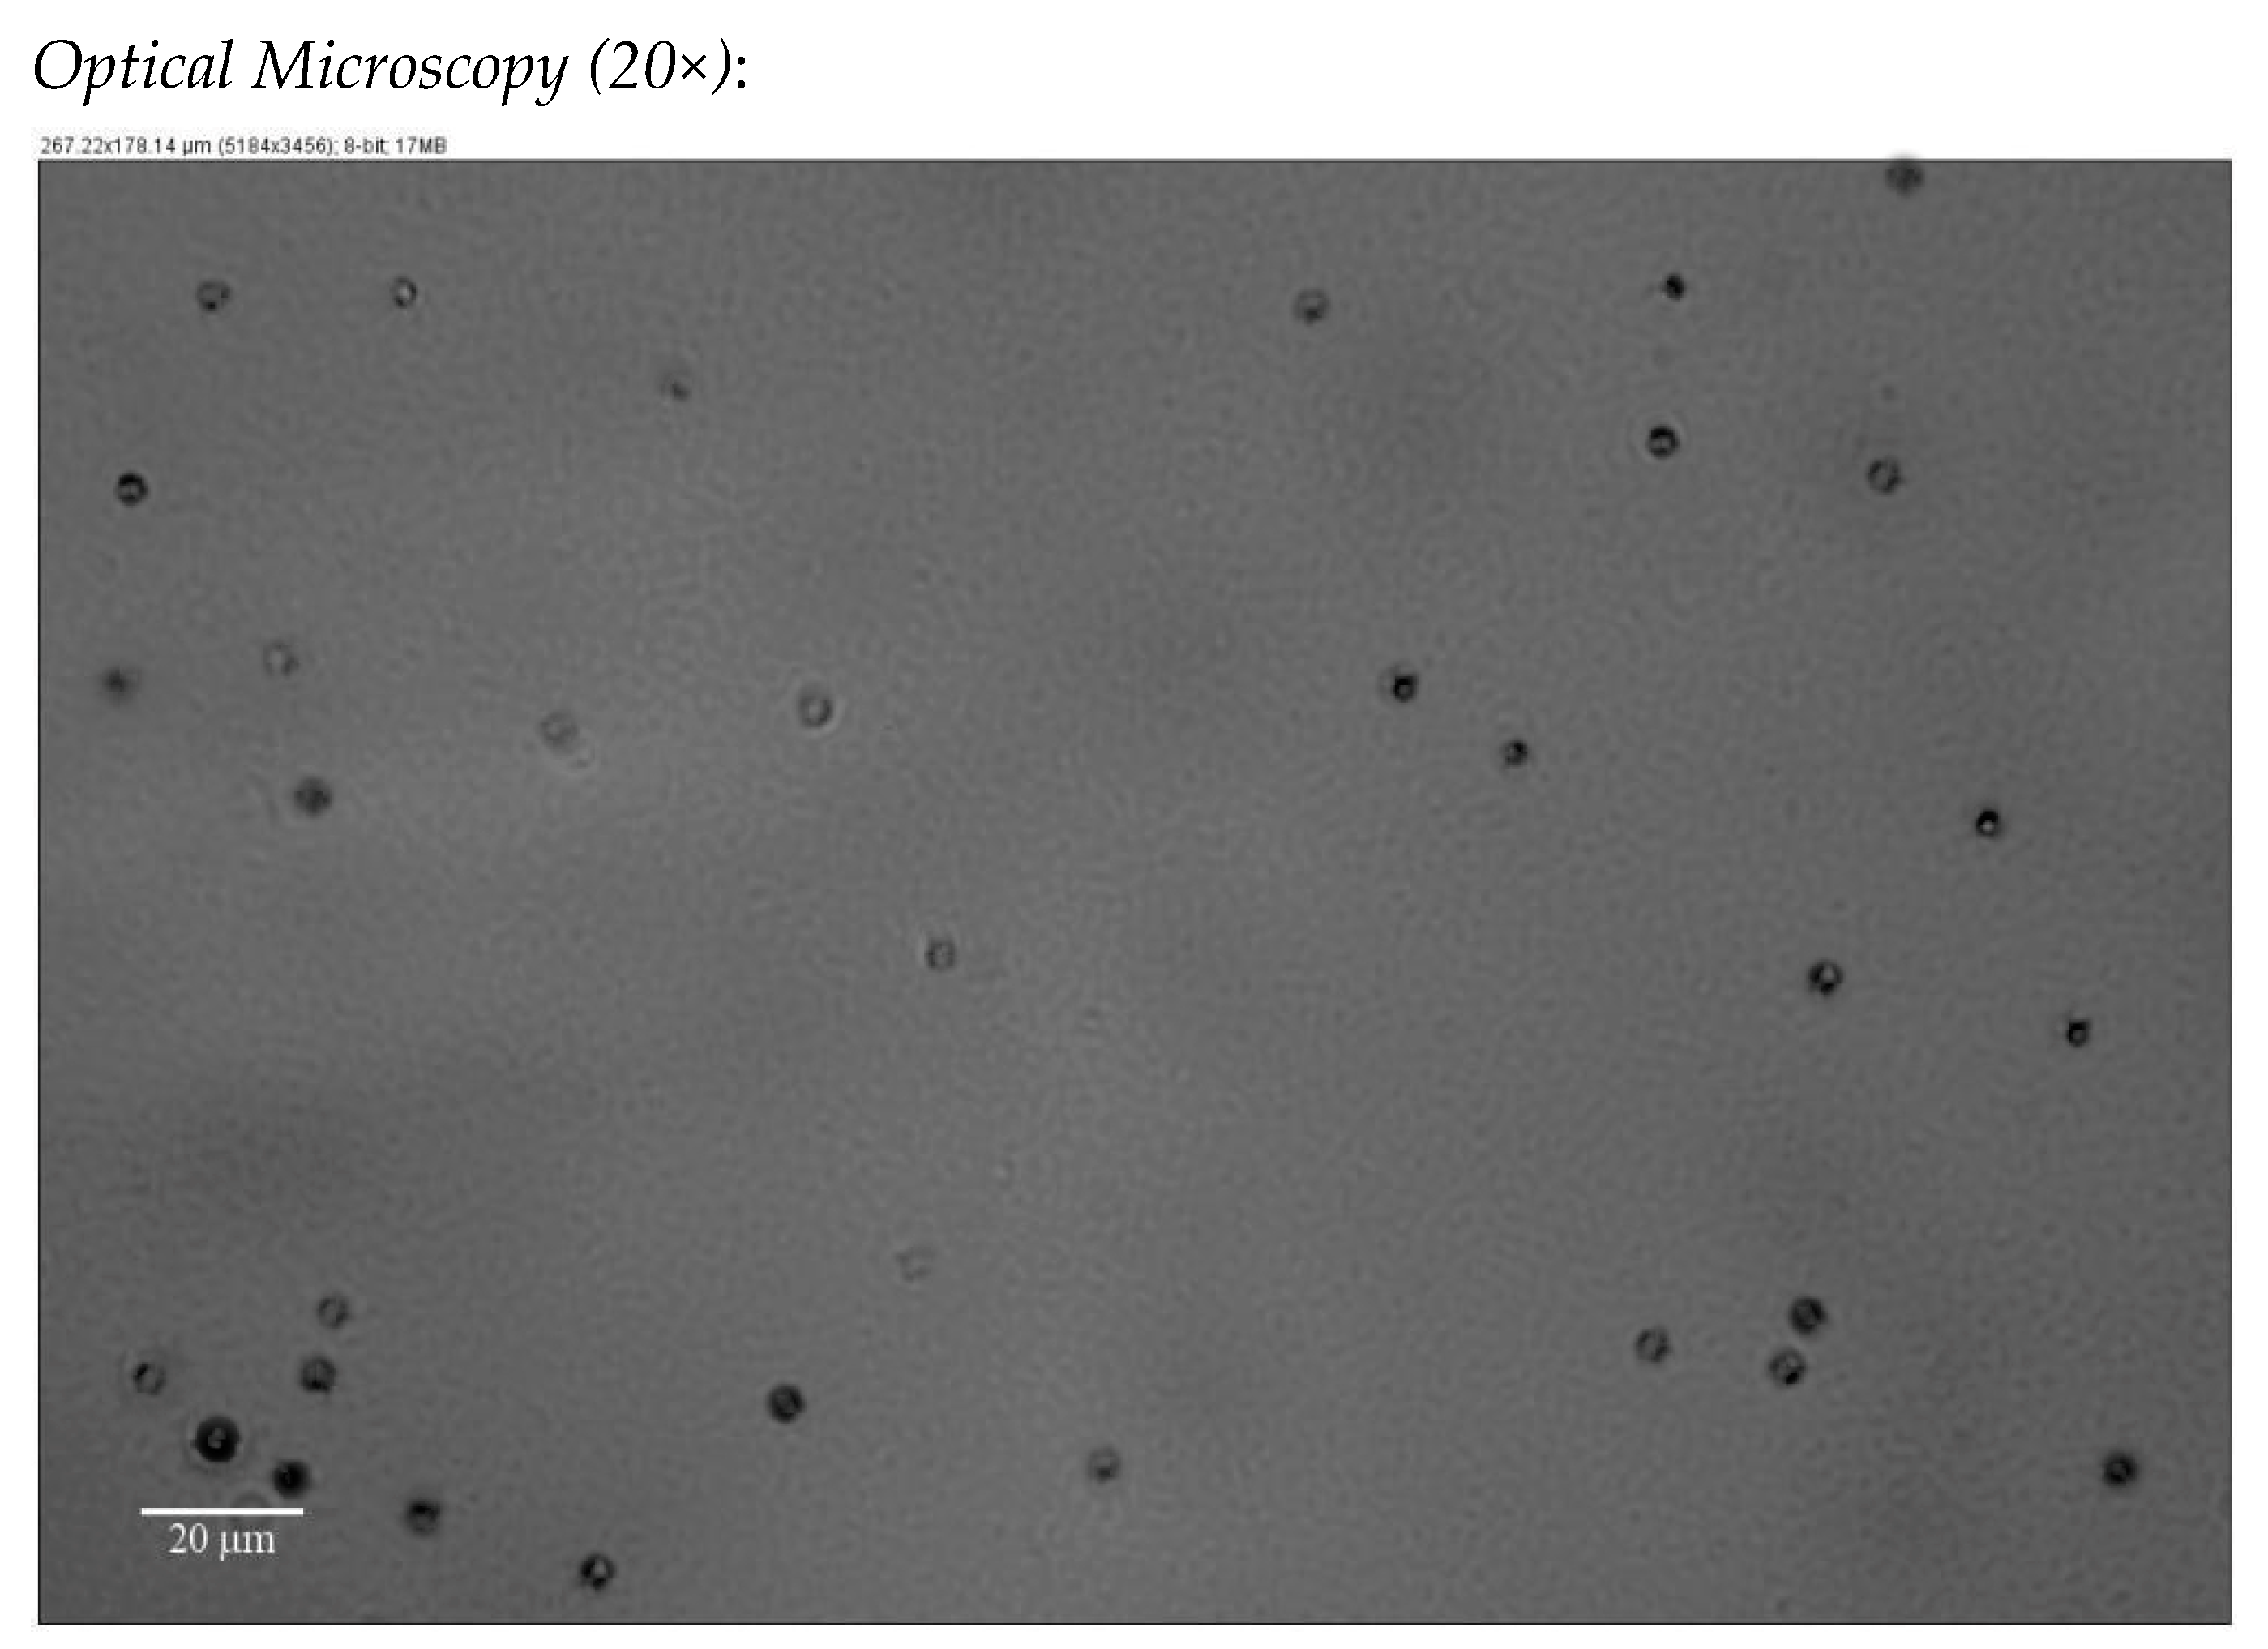
Figure 7.
Bitumen visualization: (a) bitumen was visualized in situ using confocal microscopy emission 555 nm at 569. (b) Bitumen visualization in transmission. Red color indicates the exited at 555 nm and the fluorescence emissions was assessed at 569 nm. (c) Meged. (a–c) Scale bar = 20 μm. Equipped with 40×.
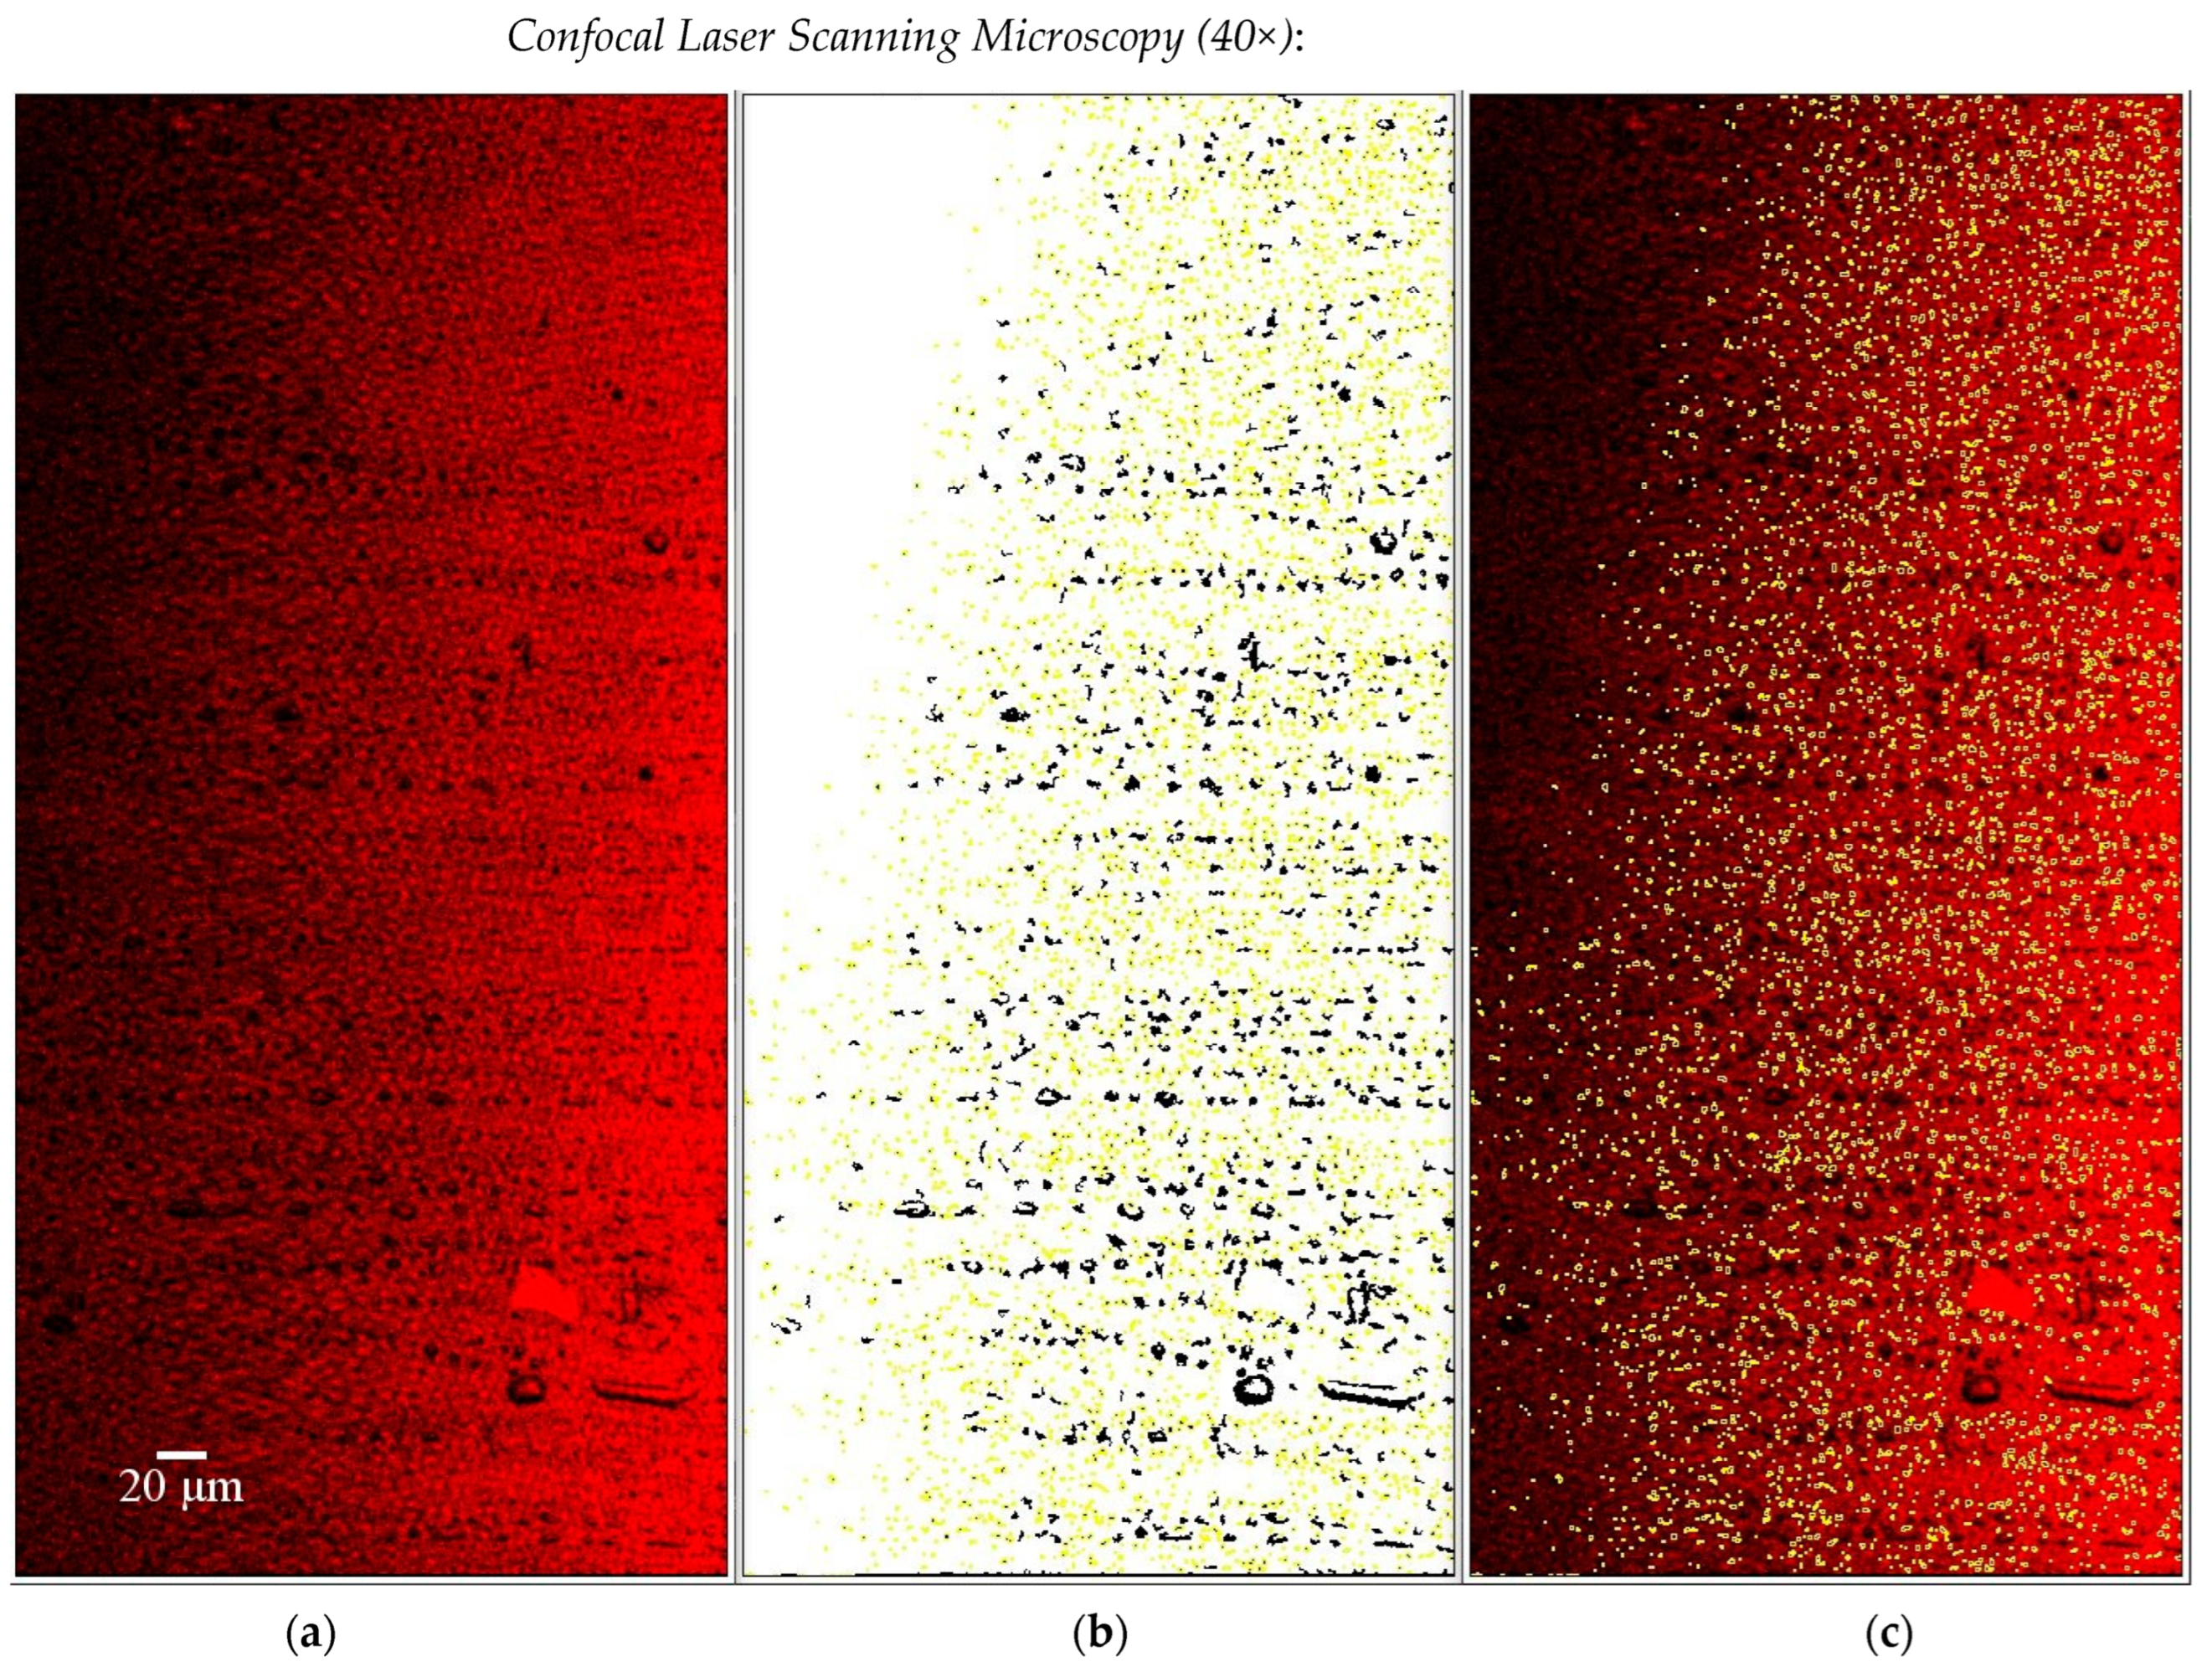
Figure 8.
Size distributions in virgin and aged bitumen as probed by optical microscopy.

Disclaimer/Publisher’s Note: The statements, opinions and data contained in all publications are solely those of the individual author(s) and contributor(s) and not of MDPI and/or the editor(s). MDPI and/or the editor(s) disclaim responsibility for any injury to people or property resulting from any ideas, methods, instructions or products referred to in the content. |
© 2024 by the authors. Licensee MDPI, Basel, Switzerland. This article is an open access article distributed under the terms and conditions of the Creative Commons Attribution (CC BY) license (https://creativecommons.org/licenses/by/4.0/).
Share and Cite
MDPI and ACS Style
Calandra, P.; Abe, A.A.; Scavo, A.; Bruno, L.; Rossi, C.O.; Caputo, P. Novel Microscopic Approach to Particle Size Evaluation in Colloidal Systems. Appl. Sci. 2024, 14, 3567. https://doi.org/10.3390/app14093567
AMA Style
Calandra P, Abe AA, Scavo A, Bruno L, Rossi CO, Caputo P. Novel Microscopic Approach to Particle Size Evaluation in Colloidal Systems. Applied Sciences. 2024; 14(9):3567. https://doi.org/10.3390/app14093567
Chicago/Turabian StyleCalandra, Pietro, Abraham A. Abe, Antonio Scavo, Leonardo Bruno, Cesare Oliviero Rossi, and Paolino Caputo. 2024. "Novel Microscopic Approach to Particle Size Evaluation in Colloidal Systems" Applied Sciences 14, no. 9: 3567. https://doi.org/10.3390/app14093567
Note that from the first issue of 2016, this journal uses article numbers instead of page numbers. See further details here.