
Numerical Analysis of Mice Carotid Arteries’ Response Emphasizing the Importance of Material Law Constants’ Validation

Department of Mechanics of Materials and Structures, Faculty of Civil and Environmental Engineering and BioTechMed Center, Gdańsk University of Technology, Narutowicza 11/12, 80-233 Gdańsk, Poland
*
Author to whom correspondence should be addressed.
Appl. Sci. 2024, 14(9), 3571; https://doi.org/10.3390/app14093571
Submission received: 12 March 2024
/
Revised: 11 April 2024
/
Accepted: 22 April 2024
/
Published: 24 April 2024
(This article belongs to the Section Biomedical Engineering)
Abstract
:In this paper, a detailed validation of the passive material properties of mice carotid arteries and constants of the Fung and Holzapfel hyperelastic material laws is conducted by means of static nonlinear FEM analyses. The response of the carotid arteries in an inflation test is studied here for the following mouse models: wild-type, mdx, sgcd−/−, Eln+/+, Eln+/−, Fbln5+/+, and Fbln5−/−. All FEM computations are conducted on models that have been preliminarily checked for their reliability. The results of the calculations, namely, the relation between the internal pressure and the artery outer diameter, are verified against experimental responses and the applicability of the laws is assessed. New sets of Holzapfel constitutive relation constants are proposed for Eln+/+ and Fbln5−/− mice. Finally, the problem of carotid artery buckling is also discussed. The buckling pressures of the arteries are predicted using FEM models and nonlinear static analyses. These values are compared with the reference experimental results, which allow for further validation of the constitutive relations. The research emphasizes that computations and numerical methods enable an accurate description of bioengineering processes and behaviors but only if the models used are appropriately validated.
1. Introduction
The appropriate response analysis of biomedical materials, modeling of medical phenomena, description of flow in the arteries, or optimization of treatment techniques, together with imaging of biological tissues, internal organs, or blood vessels, are some examples of the current research topics under consideration [1,2,3,4,5,6]. Problems of a similar kind are often identified or determined by medics and doctors and investigated with the aid of medical testing devices or laboratory apparatus. However, the processes ruling the medical phenomena may be described with equations of, e.g., mechanics, dynamics, fluid flow, etc. In the majority of cases, the numerical methods are the most efficient ways allowing one to obtain the solutions of the equations in the course of a computational analysis. Such an analysis enables a deep insight into the mechanics of the medical problem, which is driven by many parameters that often may not be straightforwardly identified in standard medical diagnostic tests. That is why the importance of numerical methods and computational analyses in the field of biomedical engineering has increased strongly in recent years. In effect, testing with the aid of numerical analyses seems to be the future of advanced health assessment and clinical diagnosis.
Bioengineering analyses are becoming more and more popular, because they open up huge opportunities to diagnose and describe bioprocesses occurring in live organisms. Computational methods allow for a reduction in the number of experiments conducted in laboratories. Moreover, numerical calculations enable almost unlimited insight into the physics and essence of the cases studied, even extending the quality of data collected during standard medical examinations. Nevertheless, this is only possible if the computer models are reliable. When computations are conducted, it is very important to validate the modeling approach, and that is why some experiments, but to a limited extent, are necessary. These problems are strongly underlined in this article.
The amount of results in these fields is vast, since whenever a computational analysis is started, a lot of data need to be collected to appropriately define the equations of the problem. One of the issues that is currently the attention of the researchers is the appropriate definition of biomaterial stiffness, through a specific and carefully chosen constitutive relation. Some papers in which the material law is an important contribution to the discussion are, for example, [7,8,9,10,11,12,13,14]. From many materials available for testing, mice are chosen as the research object because their parts are easily obtainable, and the analysis of their behavior enables the formulation of new approaches and the development of modern procedures for the purpose of the bioengineering field.
Here, attention is focused on the response of mice carotid arteries and the process of the appropriate choice and definition of material laws describing the relation between stress and strain in the artery. These problems are important when the mechanical behavior of a body is studied. In this context, some selected recent papers describing or related to mouse arteries’ mechanics are mentioned. The important actual achievements in this field can be found in the following: Kim J. et al. [14]; Cavinato C. et al. [15]; Patel M. et al. [16]; Eberth J.F. et al. [17]; Bellini C. et al. [18]; Luetkemeyer C.M. et al. [19]; Amin M. et al. [20]; Wan W. et al. [21]; Badel P. et al. [22]; Gleason R.L. et al. [23]; Dye W.W. et al. [24]; and Guo X. and Kassab G.S. [25].
The common feature of the above-mentioned articles is the experimental identification of the mechanical properties of mouse arteries, which has been carried out by inflating the artery attached to cannulas by knots, according to multiple pressure protocols. The preconditioning of the artery is performed before the main test is started. The material law constants are then fitted to the biaxial experimental data gathered during the experiments. The most popular constitutive relations used in the published research are the Four-Fiber model and the Fung and Holzapfel hyperelastic laws.
One may say that quite a lot of different constants and material models are available for the purpose of analysis of mice arteries’ response (12 papers have been referenced above). However, almost none of them have been tested for applicability to a modern 3D computational analysis. We would like to emphasize that material properties identification only makes sense if the law can be effectively and accurately used in further analyses; otherwise, the process is meaningless. The validation has been carried out by Badel P. et al. [22], but the authors of work [22] did not say what type of mouse was tested. Thus, the usefulness of the set of Holzapfel constants from Badel P. et al. [22] is rather low. Computational validation is also mentioned in Patel M. et al. [16]. Nevertheless, if a finite element analysis (FEA) validation is performed, then all the details about the computational model used for this purpose should be given. This is not available in Patel M. et al. [16]. Similarly, it is said in Kim J. et al. [14] that a preliminary model in the COMSOL software has been developed to validate the identified material parameters. Unfortunately, no details of the calculations are given, and thus it is impossible to verify the applicability of the presented constants. Therefore, an important research gap has been identified here.
The validity of a constitutive relation is crucial when speaking about a reliable computational model. Thus, our aim is to perform a detailed validation of the passive material properties and constants of the Fung and Holzapfel material laws that have already been published, by means of static nonlinear FEM analysis. The applicability of the laws to a 3D analysis, which is a modern way of diagnostics and health monitoring, is also assessed. The constants are taken from the following selected works: Kim J. et al. [14], Luetkemeyer C.M. et al. [19], Badel P. et al. [22], and Gleason R.L. et al. [23]. Problems of a loss of stability of the arteries in the form of buckling, discussed in Luetkemeyer C.M. et al. [19], are considered here as well, because an appropriately validated law should also enable the description of other specific mechanical phenomena.
In addition, in this paper, we also propose to establish new and accurate sets of constants for constitutive relations in the course of computations, instead of doing that only with the aid of experiments and some curve fitting techniques (for example, nonlinear regression [14,18,21,23]). This supplements the discussion on validation problems. Since a lot of constants and models are available, the existing data can be used as a starting point for a parametric analysis conducted in a FEM environment. Therefore, generally, whenever a new sample is tested, its response can be initially predicted using the laws that have already been determined. Then, the constants may be updated by means of, for example, computational FEM parametric analysis, to reach the objective (experimental response), without formal mathematical definition of the objective function. This process is very fast and easily available to FEM engineers.
2. Materials and Methods
2.1. Approach to Analysis
Validation is essential for numerical calculations. A model is called valid when there is an agreement between the measured response and the prediction of the numerical model [26]. The Finite Element Method (FEM) is used to perform a full validation of constants of some selected constitutive relations, which are available in the literature and were experimentally determined. The sets of constants under consideration are available in [14,19,22,23]. Computational 3D models of mouse carotid arteries are formulated in the Abaqus 2019 FEM environment to recreate the classical inflation test, and the numerical results are verified against the experimental data. The aim is to verify whether the laws with the already existing constant sets are able to recreate all the phenomena that are observed during such inflation and also the loss of stability if reported. Only then can the constitutive relation and the proposed model be called a valid one. The necessary details of the FEM method can be found, for example, in [27,28].
There are advantages of such a computational approach. Finite element analysis (FEA) is not restricted by the geometry of the domain nor its complexity. Therefore, FEM models are versatile, whereas analytical solutions of partial differential equations, still popular in the field of bioengineering analyses, can be obtained only for a limited number of cases with simple geometries and loading and boundary conditions. In consequence, many complex bioengineering behaviors may be studied in detail only with the aid of FEM, which enables improvement in the quality of data to be used for medical purposes. The application of FEM models can also facilitate the process of problem identification. Typically, experiments and medical examinations are conducted to address this issue. These can be effectively supplemented by calculations (see [29,30]). That is the reason why FEM analyses are preferred and promoted in this article. Nevertheless, it must be kept in mind that only validated models are reliable. Hence, the validation problems are strongly underlined here.
Moreover, it is emphasized here that although the issues related to mice arteries’ material laws are studied, a general problem is discussed. Hence, this is also a starting point for the reliable analysis of the human body’s response.
2.2. Material Laws Subjected to Validation
In this paper, two forms of the strain energy functions are used to describe the mechanical response of the arteries: the Fung proposal (for example, [31,32]) and the Holzapfel–Gasser–Ogden model (see [33,34]). Both are implemented in Abaqus 2019 [35].
The Fung strain energy potential is defined, assuming that the material is incompressible, in the following form:
where c is a material parameter and Q is defined as follows:
where is a dimensionless symmetric fourth-order tensor of anisotropic material constants (9 independent values for the orthotropic case) and formally in a general case is the modified Green strain tensor, is the distortional part of the right Cauchy–Green strain, is the right Cauchy–Green strain tensor, is the deformation gradient (resulting from multiplicative decomposition of into spherical (dilatational) and unimodular (distortional) parts ), is the volume change ( in this particular case), and is the identity tensor.
For the Holzapfel–Gasser–Ogden model (herein referred to as the Holzapfel law), the strain energy potential, for an incompressible material, is formulated as the following:
with the strain-like quantity being the following:
where , , and are material parameters; is the number of fiber families ( here); and is a factor describing the fibers’ distribution randomness (fibers are perfectly aligned for , while the material becomes isotropic and the fibers are randomly distributed for ). From the formal point of view and in a general case, is the first deviatoric strain invariant, are the deviatoric stretches (in this particular case, ), are the principal stretches, and , , is another invariant representing the fiber orientation (pseudo-invariant of , i.e., the distortional part of the right Cauchy–Green strain and , and is the set of unit vectors defining the directions of the fibers in the reference configuration). The operator stands for the Macauley bracket and is defined as .
2.3. Geometrical Properties of the Artery
Generally speaking, it is reported that a mouse carotid artery is a vessel of almost cylindrical shape with no branches [23], despite the fact that geometrical properties of the artery are a little more complicated, as documented, for example, in [24,36]. So, the aforementioned complexity is omitted in most of the papers that deal with the mechanical response of carotid arteries. In effect, specific and simplified models that treat the artery as a 2D thick-walled cylinder are used in many papers, to establish constants of some hyperelastic stress–strain constitutive relations (see, for example, [17,19,21,22,23]). The results presented in the previously mentioned articles do not indicate that the accuracy of the analysis is significantly affected, in the case when the artery is treated as a perfect cylindrical vessel. In this paper, we validate the constants of hyperelastic material laws, that have been determined under this assumption. Therefore, in view of the above, we also treat the carotid artery as a perfect cylindrical vessel.
Geometrical dimensions of the arteries in an unloaded state without applied axial stretch are well described in the analyzed papers and are taken from there. Typically, the external diameter of the carotid artery ranges from 340 μm to 450 μm, while the ratio between the inner and outer diameter of the artery is close to 0.7. Averaged values of the artery diameter and wall thickness are given for each mouse model under consideration [14,22,23] or individual values are presented for all arteries analyzed, as in [19]. The mean values of the geometrical parameters of the arteries reported in the aforementioned articles are shown in Table 1.
The length of the carotid artery also needs to be specified when creating a 3D numerical model. The inflation of carotid arteries is the most common way to establish their mechanical properties. Therefore, the length of the artery in such a test is used in the analysis here.
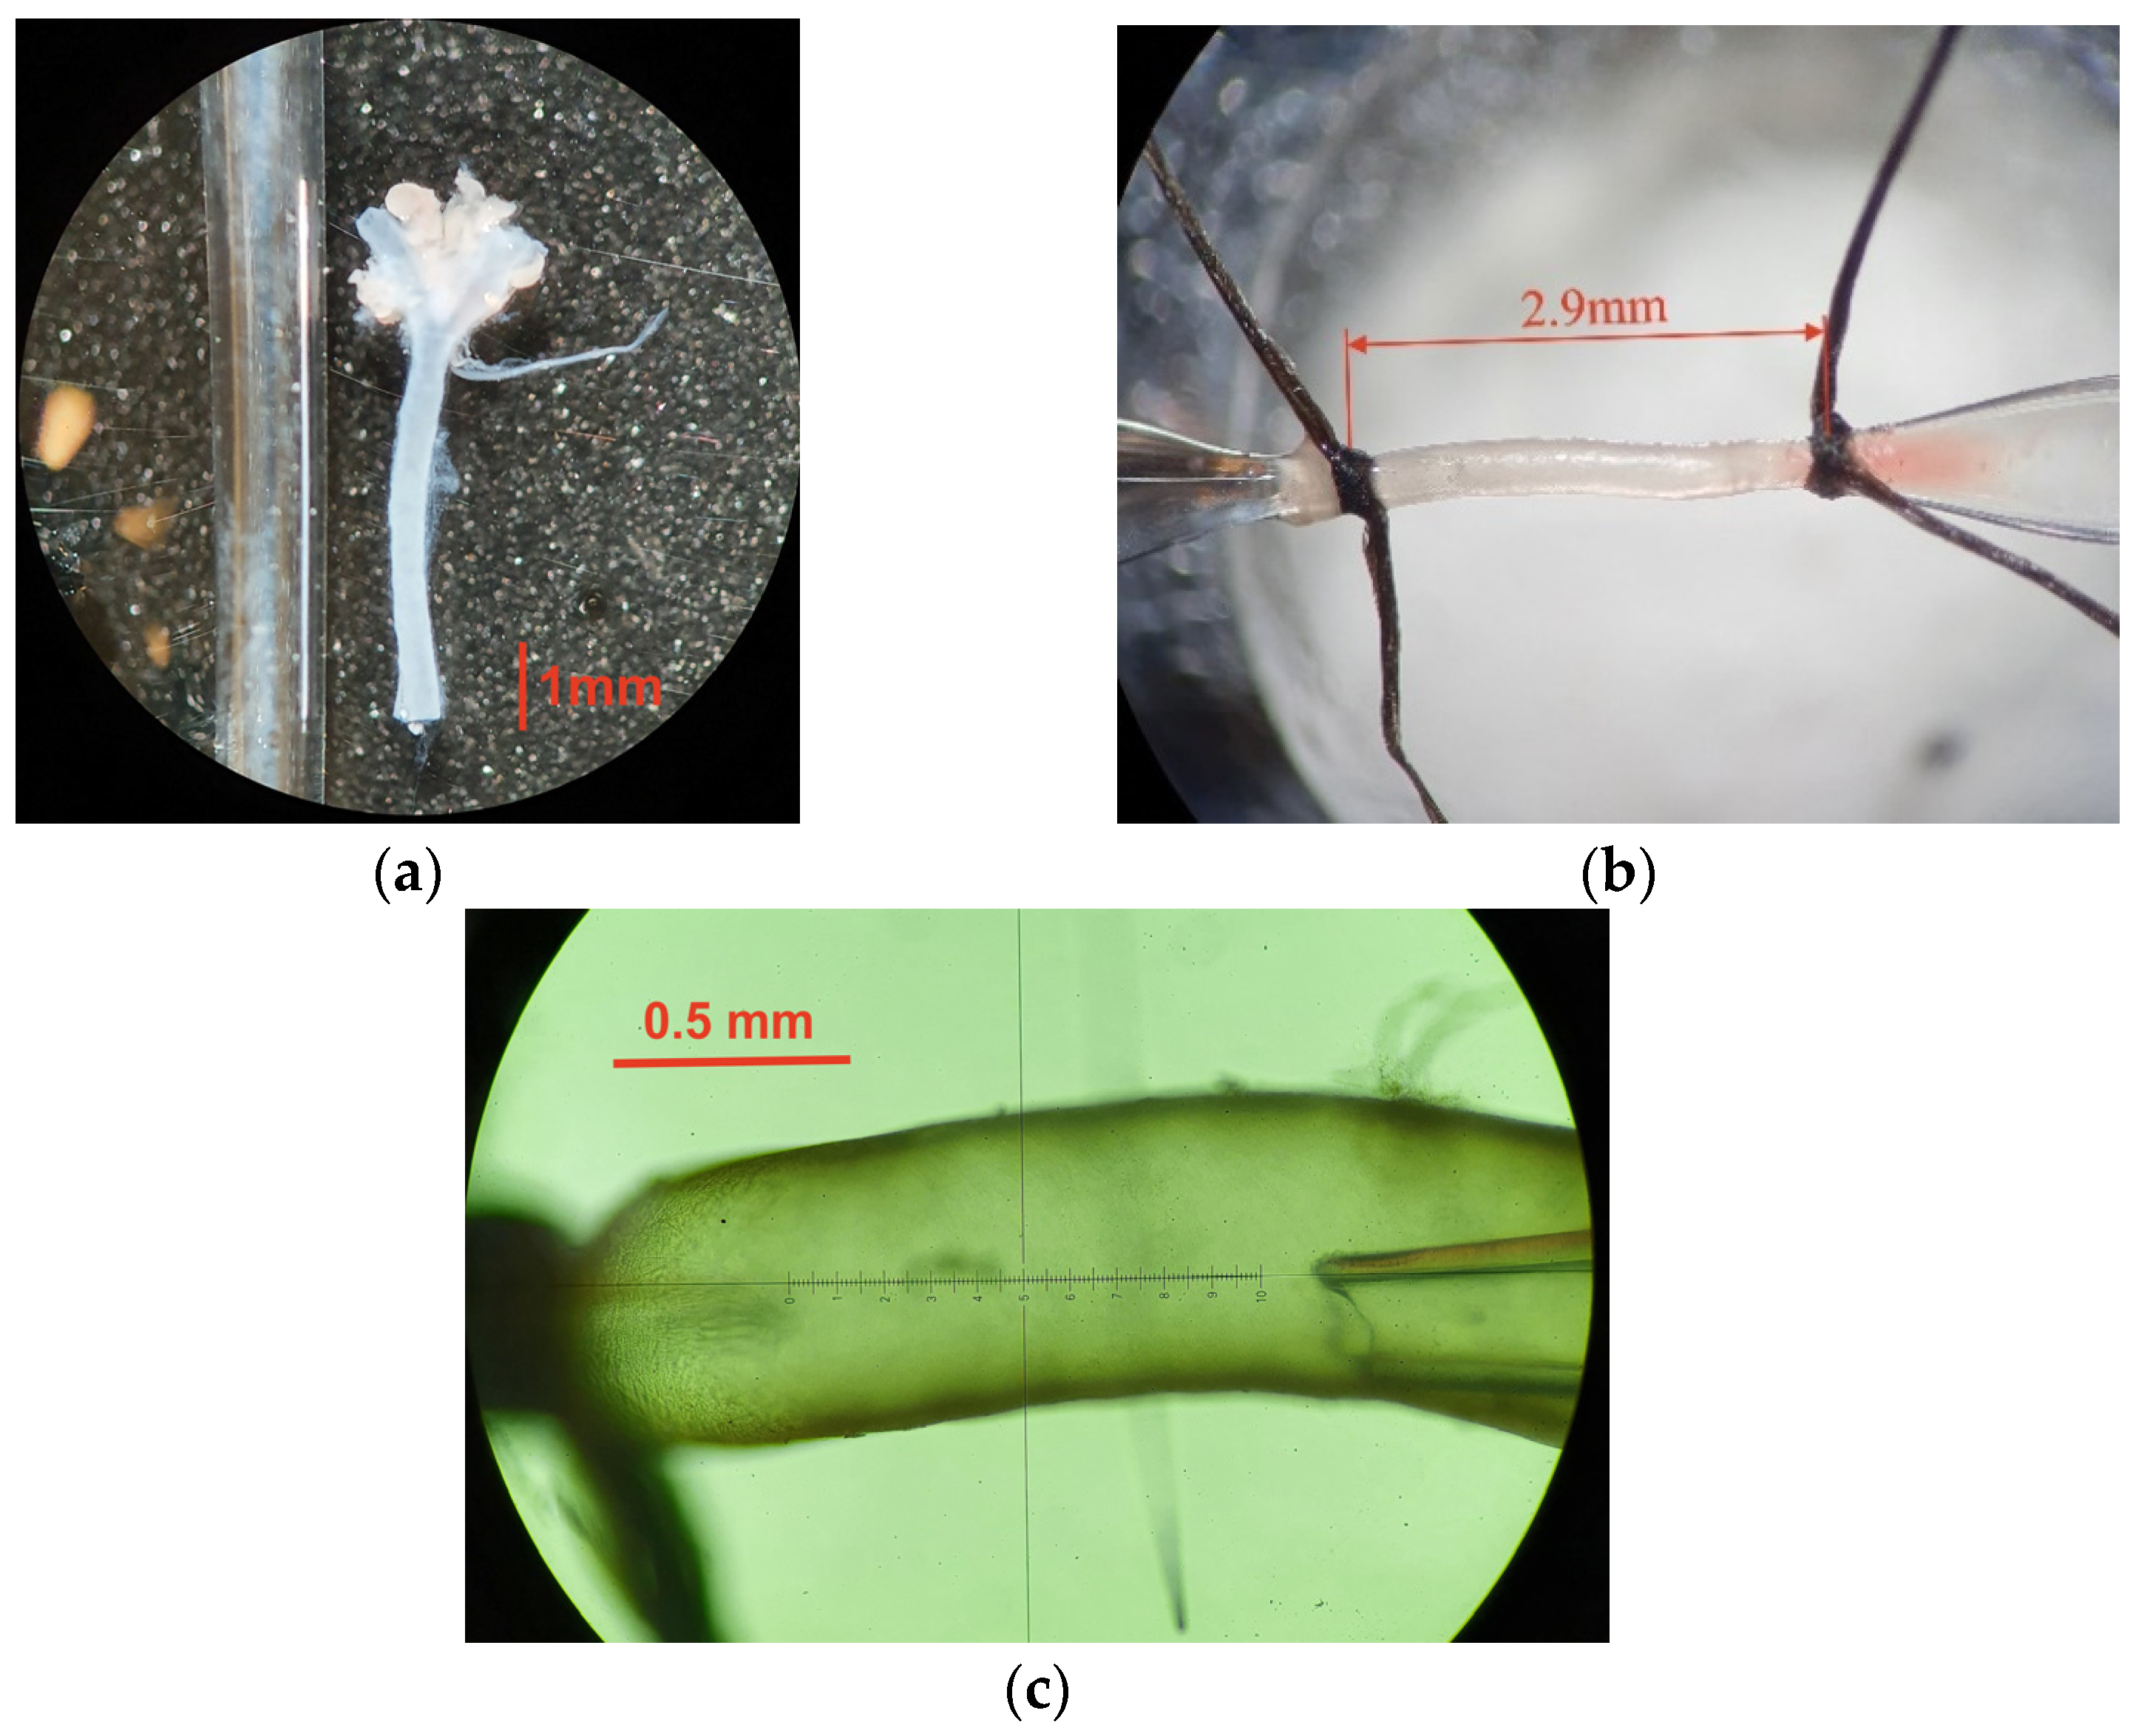
Some interesting recommendations on the lengths of the carotid arteries, with regard to inflation tests, can be found, for example, in [19,20]. As mentioned in [20], the lengths of extracted carotid arteries specimens vary from 3 mm for a 3-day-old mouse newborn to 6 mm for a mouse whose age is more than 30 days. However, when an artery is mounted on the cannulas in the myograph, the testing length (see Figure 1), namely, the distance between the knots, is smaller, for example, 1.65 mm for a 3-day-old mouse (see [20]), which is 55% of the total length of the extracted specimen. It is reported in [19] that testing lengths of carotid arteries in the buckling analyses were typically equal to 3.05 mm for 2-to-3-month-old mice. The total length of the extracted artery has not been specified in [19]. Nevertheless, if it is assumed to be 6 mm (as described in [20] for mice which are more than 30 days old), then the ratio between the testing length and total artery length is 51%, so almost the same as in [20]. It is worth mentioning that in most of the published works that aim to identify the constants of some hyperelastic material laws, the length of the carotid artery is not given. That is because the response of an inflated mouse carotid artery can be described using the model of an axisymmetric cylinder subjected to internal pressure, which is quite often chosen. This analytical model does not require definition of the exact length of the artery, but it rather needs information on the amount of the applied longitudinal stretch (see, for example, [14,21,23]). However, the length parameter cannot be omitted in the analyses conducted here, because a more detailed 3D FEM model is employed that also accounts for buckling.
Some preliminary tests were ordered and performed by the Medical University of Gdańsk to take a look at the arteries’ response during inflation and buckling problems. The carotid arteries (CB57BL/6 mice) extracted by the researchers from the Medical University of Gdańsk were typically from 5 mm to 6 mm long; refer to Figure 1a. These were tested similarly, as described in [20], for different pressure protocols with preconditioning. When the arteries were attached to the DMT myograph cannulas by knots, as shown in Figure 1b, the distance between the knots ranged from 2.7 mm to 3.3 mm and was very close to the reference values [19,20]. Buckling of the arteries has been observed, as, for example, shown in Figure 1c.
In view of the above, the length of 3.05 mm is adopted for our FEA. It is a typical testing length of the carotid artery during inflation testing. Such length is sufficient to assure that the response of the artery is not influenced by the model boundary conditions, and thus the artery response in the mid-zone (far from the knot/model boundaries) resembles the ideal case of the thick-walled cylinder subjected to internal pressure. Hence, the validation of material law constants established in such tests will be possible. Moreover, the length is the same as in the arteries buckling analysis from [19], so direct comparison of the actual FEM estimations and the results from [19] is enabled, as the most important parameters of the buckling analysis are the same.
2.4. The Computational Domain and Meshing
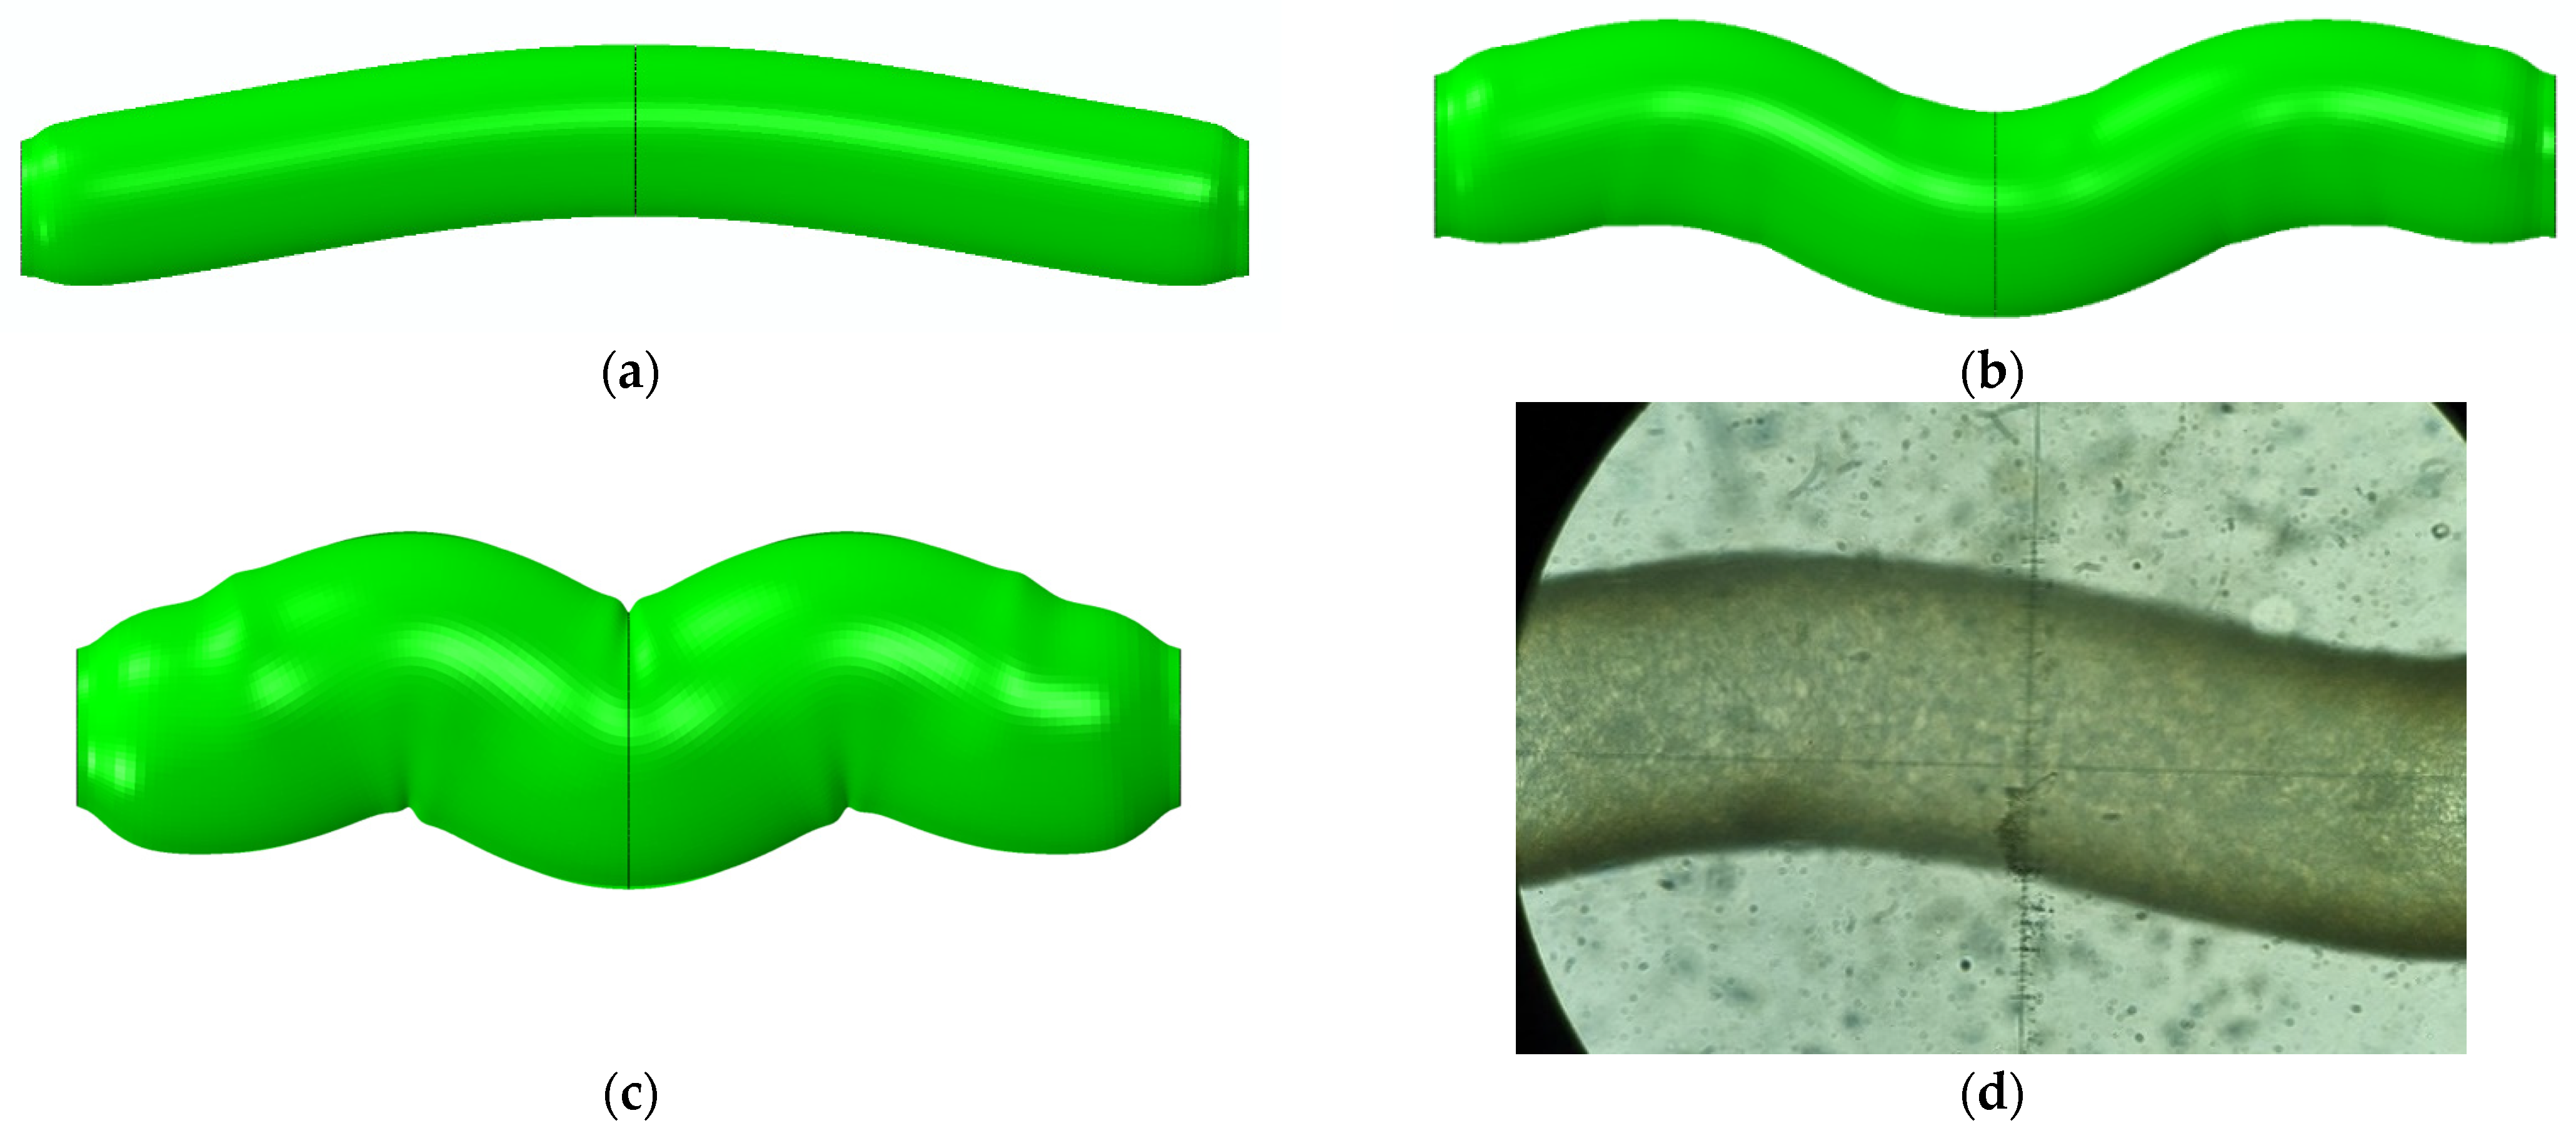
The computational domain is thus built using the dimensions described above. Two different variants of models are created. The first is shown in Figure 2a and represents 1/8 of the artery with the appropriate boundary conditions assigned. This model is used to estimate the response during the inflation test, especially when no loss of stability was observed, assuming that the artery is an ideal cylinder with no imperfections.
The second model is specifically used to study the loss of stability phenomenon of the arteries subjected to the increase in the internal pressure and assess the abilities of the analyzed material laws to capture this particular response. It is presented in Figure 2b. The model recreates the half of the artery fixed to the cannula; hence, only symmetry in the longitudinal direction (parallel to the axis of the cylinder) is included in the computations. Also, a geometrical imperfection is introduced into the domain at the beginning of the analysis when buckling is studied. In most cases, the artery is naturally curved (see also Figure 1) and, therefore, it usually loses its stability in such a way that one global half-wave deformation pattern is visible, as reported, for example, in [19] or observed in the preliminary experimental tests performed by the Medical University of Gdańsk, as shown in Figure 1c. Therefore, an imperfection of a similar kind is introduced to the second model, as presented in Figure 2. The size of imperfection will influence the response of the system. Since the arteries are biological material, it is not possible to give strict guidelines on the exact value of the imperfection. However, our preliminary analyses and the work conducted by [19] suggest that the imperfection is usually clearly noticeable, while its size can range from 5% to even 10% of the diameter of the artery. For this reason, in the current analysis, we introduce an additional curvature of the artery described by the sagitta, which is approximately 5% of the outer diameter of the artery.
A mesh independence study was carried out to ensure that the models are appropriately built and that the results may be used for the verification of the applicability of the material laws. Different mesh sizes and finite elements (with linear or quadratic shape functions with full or reduced integration) were studied, namely, p-refinement and h-refinement checks were conducted. Finally, the analysis was performed with the aid of a 3D continuum, 8-nodal, hybrid solid finite element, denoted as C3D8H in Abaqus. Its response during calculations turned out, in the course of the necessary checks, to be almost free of locking, although the full integration scheme is used to integrate the polynomial terms in an element’s stiffness matrix in such a situation. Furthermore, the C3D8H element allows for an efficient solution of the nonlinear problem under consideration. Thus, owing also to the mesh convergence problems discussed above, the accuracy given by the C3D8H elements is assessed as sufficient. The mesh of each model is created, assuming that 10 elements are generated in the cylinder thickness direction, 80 along the entire circumference and 80 along the domain. The mesh is therefore denoted as 10 × 80 × 80. The details of the mesh are shown in Figure 2. The results of mesh independence checks will be shown in the subsequent chapter.
The material constants determined for the Fung or Holzapfel hyperelastic laws from [14,19,22,23] are analyzed. Only 3D models are created in this paper, although two-dimensional (2D) axisymmetric laws (assuming no shear) and constants of the Fung law are given in [19,23], because by default the Fung or Holzapfel laws in Abaqus are defined for the 3D case. In addition, 3D models allow for the investigation of other effects, such as the buckling of arteries, which is described in [19]. It is important to mention that the modification of the Fung law from the 2D case to the 3D one is straightforward. The 2D constants have to be linked with the axes of the user-defined local (material) coordinate system of the artery, without any additional calculations or transformations. It is assumed in the computations presented here that the 1st material axis runs in the through-the-thickness direction, the 2nd axis is parallel to the circumference of the cylinder, while the 3rd one is parallel to the longitudinal axis of the cylinder. It is also not a problem that no constants related to shear are given for a 2D Fung law [19,23] (no-shear assumption). These are required for a 3D case, and, for example, in Abaqus, they are denoted as b1212, b1313, and b2323. There is a certain degree of arbitrariness when choosing the amount of these parameters. Generally, it can be said that a value enabling a stable and convergent solution can be taken as the input data for shear constants. It is justified by the fact that the shear terms will affect the response of the model only in the close vicinity of the boundary conditions, as it is, by assumption [19,23], an axisymmetric inflation problem. If the artery is sufficiently long, the shear terms will not influence the change of the diameter at the artery mid-span and its behavior far from the boundary conditions will resemble the one for the thick-walled 2D cylinder. The Holzapfel constants available in [14,22] are given for the 3D case and therefore no additional conversion has to be conducted. The material properties of all carotid arteries used for validation purposes (necessary model input data) are collected in Appendix A in Table A1, Table A2, Table A3, Table A4, Table A5, Table A6, Table A7 and Table A8. It has to be mentioned here that the data in Table A1, Table A2, Table A3, Table A4, Table A5, Table A6, Table A7 and Table A8 have been taken directly from the reference papers without any modifications.
2.5. The Analysis and Validation
Nonlinear static calculations are performed for the problems defined above. The Newton–Raphson method is used to solve the nonlinear equilibrium equations. Therefore, the result is obtained as a series of subsequent increments, with iterations to obtain equilibrium within each increment. Material and geometrical nonlinearities are included in the calculations. All analyses are conducted in two stages. First, each cylinder is stretched along its axis. Then, it is loaded with internal pressure. Such a sequence of computational steps enables the efficient recreation of the conditions that the artery is subjected to. The values of the longitudinal axial stretches assigned to the computational model are taken from the literature [19,23]. It is worth mentioning that various stretches of mice carotid arteries have been measured experimentally for different mouse models and are available in the literature. In [23], one may find that the in vivo stretches λzin-vivo range from 1.71 to 1.84 for the wild-type, mdx, and sgcd−/− mice and are rather high. In [19], the λzin-vivo stretches, resulting from image artery analysis, are noticeably lower and lie between 1.04 and 1.53 (for Eln+/+, Eln+/−, Fbln5+/+, and Fbln5−/− models); thus, some of them are very small. The longitudinal stretch will affect the mechanical response of the artery. If a higher initial longitudinal stretch is applied, then a larger initial reduction in the external diameter of the carotid artery will be observed. The initial longitudinal stretch also influences buckling pressures. If the carotid artery is subjected to a greater initial stretch, then buckling pressure loads will also become greater, due to an additional pretension effect. Therefore, characteristic initial stretch values are assigned for each individual mouse model under consideration, in accordance with the values recommended in the reference paper [19,23] to appropriately reflect the mechanical behavior of the artery and to compare the current results with the reference values.
The results of the current FEM nonlinear static analysis are compared with the experimental values collected in the reference articles, and the validation of the constitutive laws is conducted. To make this process as simple and reliable as possible, raw data coming from the measurement devices are analyzed. Especially, information is studied and compared about the change in the external diameter artery of the artery under increasing pressure. A set of constants is treated as perfectly valid when the root mean square error (RMSE) between the FEM predictions and the experimental response is less than 20 μm. This threshold value is proposed because it is 5% of a typical outer diameter of the mouse carotid artery, which we find to be approximately 400 μm according to the works [19,23]. Moreover, the RMSE is normalized by the mean observation value and thus the nRMSE parameter is introduced to ease the process of the FEM estimations’ accuracy analysis. Therefore, not only the average difference between values predicted by the FEM model and the observed experimental ones is measured (RMSE, which unit in this case is [μm]), but its non-dimensional variant (nRMSE) is added. The nRMSE enables the fast assessment of the correctness of results.
In the case of the buckling analysis, the buckling pressures are derived from equilibrium paths. The pressure value at the moment when the lateral displacement of the deformed artery axis equals the radius of the unloaded artery is also checked, since it has been reported and used in [19] to determine experimental buckling pressures and is a good reference for the calculations performed here.
2.6. New Constants Sets Proposals
When the published laws’ parameters seem to be ineffective, some corrections are proposed, enabling a better description of the artery response. A parametric FEM analysis is conducted in order to find new and more appropriate constants of the law. The parametric analysis is completed when the RMSE between the FEM estimation and the experimental curve is less than 20 μm, as noted in the previous subchapter.
If the Holzapfel law is applied, the concept presented in [22] is used to define the material properties of the artery. Namely, it is assumed that the artery is built of two layers, media and adventitia, having the same thickness and the same material constants except for the fiber angles, which are different. Such an approach seems to be reasonable and has physiological reasoning.
3. Results
3.1. Necessary Model Checks
Some necessary model checks and preliminary calculations were performed before the validation of the material laws’ constants was conducted. A mesh independence study was carried out first to prove that the computations are not affected by any numerical issues. The response of the first model has been studied for the mesh built of 10 × 80 × 80 and 20 × 160 × 160 (number of elements along through-the-thickness × circumferential × longitudinal directions) C3D8H elements; thus, the h-refinement was conducted. The P-refinement has also been checked in relation to the 10 × 80 × 80 mesh and, therefore, a 5 × 40 × 40 mesh of high-order C3D20H elements was also built. The FEM responses obtained for the above-mentioned mesh variants were almost identical. The nRMSE calculated for the fine mesh of C3D8H elements (the coarse mesh response was assumed to be the reference) was lower than 0.5%. A similar value was obtained when the accuracy of the C3D20H mesh was analyzed in the course of the p-convergence analysis. In view of that, C3D8H elements and the 10 × 80 × 80 mesh are used in further calculations. Such a combination of the element type and its size allows for a stable and efficient simulation of the considered problem.
Additionally, it has been checked whether the length of the artery in the computational simulation affects model response. As mentioned earlier in Section 2, when the arteries are attached to myograph cannulas by knots, the distance between the knots may be various and typically ranges from 2.7 to 3.3 mm. Therefore, another preliminary analysis was conducted, in which three different artery lengths were considered, 2.7 mm, 3.0 mm, and 3.3 mm, using the Fung law and material constants from [19]. The change in artery length in the range of ±10%, for these geometrical proportions, has almost no important impact on the results. Thus, the FEM estimation can be compared with the reference experimental results of carotid artery inflation for the material law validation purposes, no matter what artery length is chosen. However, the length of the artery may affect the buckling behavior. So, the artery model is assumed to be 3.05 mm long, due to this phenomenon, as it has already been described in Section 3.2.
3.2. Validation of Selected Material Laws
The applicability of the material constants of the Fung and Holzapfel constitutive relations available in [14,19,22,23] will be verified. The change in artery diameter under increasing internal pressure is checked, as this is a typical response monitored during experimental mechanical testing of mouse carotid arteries. The first model, described in detail in Section 2, is used for this purpose. It allows one to compare the current FEM results with the ones obtained in 2D axisymmetric analytical calculations available in the literature. It needs to be emphasized that at this stage of the analysis, all the material law parameters are taken directly from the reference papers without any modifications. These constants (necessary model input data) are collected in Table A1, Table A2, Table A3, Table A4, Table A5, Table A6, Table A7 and Table A8.
3.2.1. Fung Law for Wild-Type, Sgcd−/−, and Mdx Mice
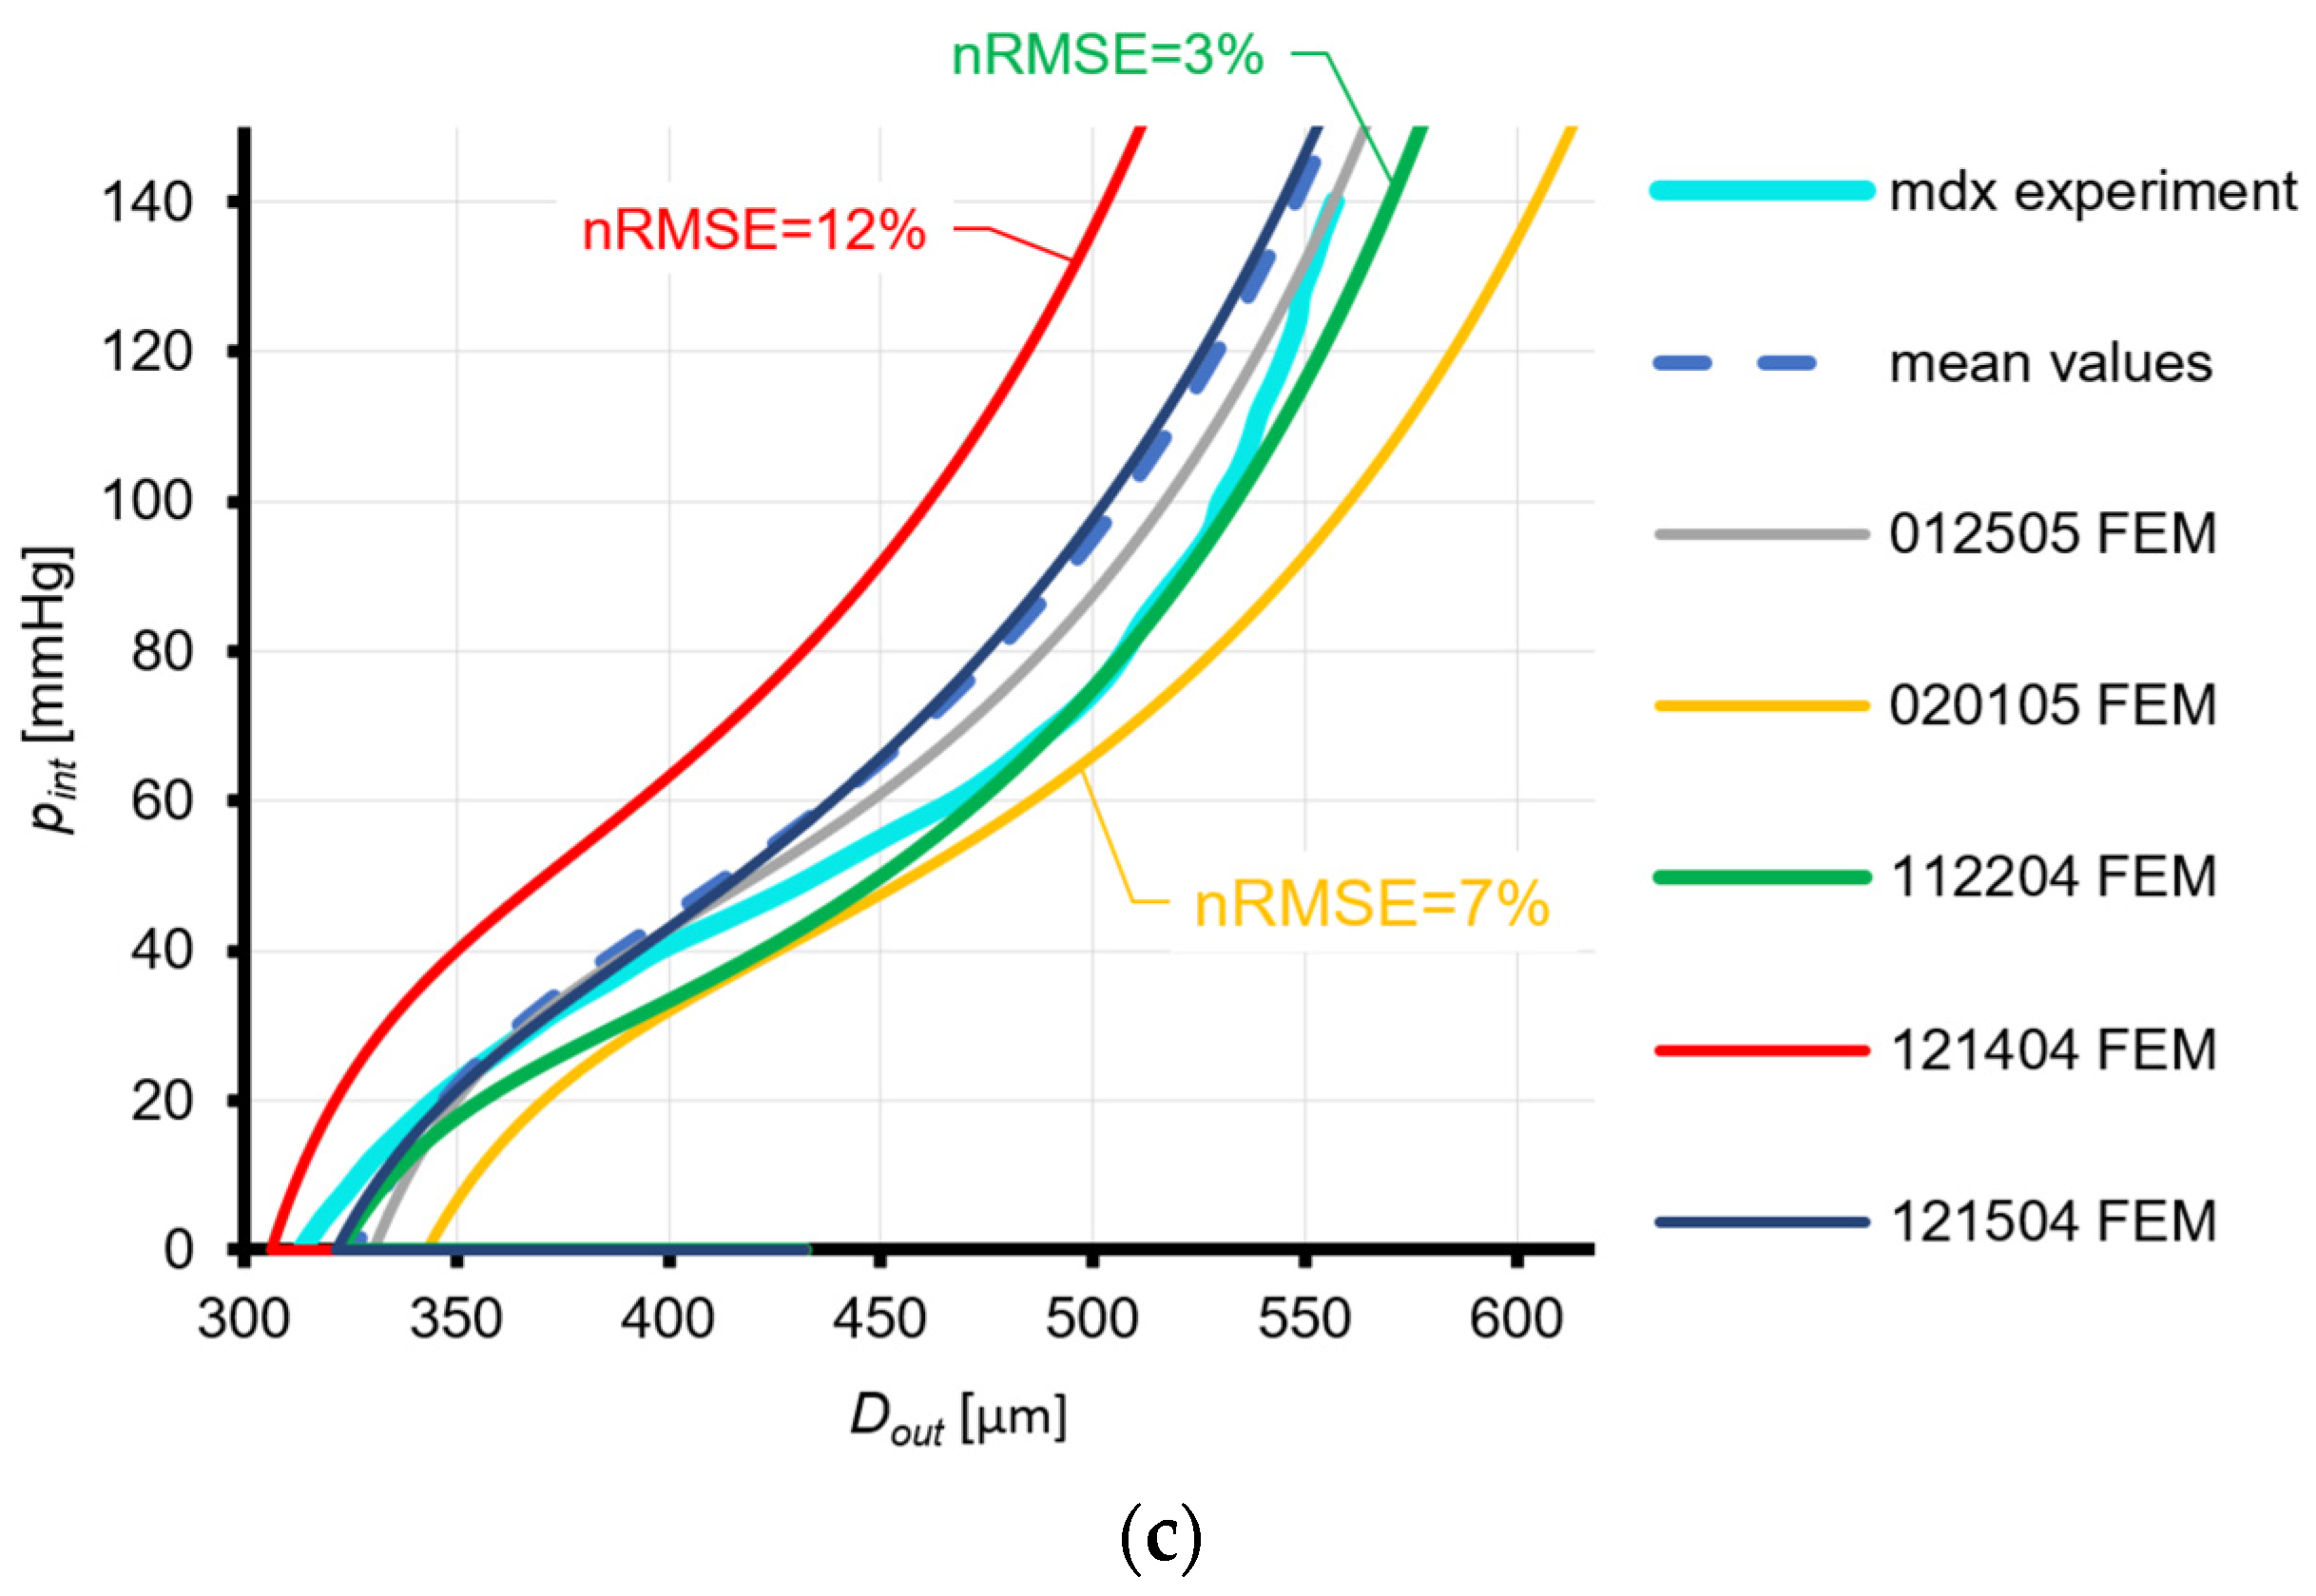
The Fung law constants from the article [23] for the wild-type, sgcd−/−, and mdx mice, which were fitted to the experimental data from [24], are first verified. Nonlinear static analyses are performed for every set of the Fung constants from [23] at a high amount of longitudinal stretch, equal to 1.95, like in [24]. The change in internal pressure (pint) as a function of the outer diameter (Dout) of the artery during the FEM analysis is presented in Figure 3 for wild-type, sgcd−/−, and mdx mice. In the picture, each set of constants used in the computational analysis is numbered exactly as it is in [23], namely, with a six-digit code or with the phrase mean (for the averaged set of constants). Moreover, representative values of nRMSE are also presented in Figure 3.
A detailed discussion of these results will be provided in Section 4.1.1.
3.2.2. Fung Law for Eln+/−, Eln+/+, FBln5−/−, and Fbln5+/+ Mice and Holzapfel Law for Eln+/+ Mice
The parameters of the Fung constitutive relation for mice of Eln+/−, Eln+/+, Fbln5−/−, and Fbln5+/+ types (derived from experimental data and presented in [19]) are subjected to validation in the next step. Furthermore, the parameters of the Holzapfel law from article [14] for the Eln+/+ mice are also checked, although they have been proposed for the aorta and not for the carotid artery. The analysis is conducted using the first FEM model, in the same way as for the wild-type, mdx, or sgcd−/− mice, as described in the preceding paragraphs. Hence, the change in internal pressure (pint) as a function of the outer diameter of the artery (Dout) is checked for FEM estimations. The results are presented in Figure 4 for the Eln+/−, Eln+/+, Fbln5−/−, and Fbln5+/+ mice. Moreover, representative values of nRMSE are also presented in Figure 4.
The results shown here will be discussed in detail in Section 4.1.2.
3.3. Proposals of New Constants Sets
It is evident from Figure 3 and Figure 4 that the accuracy of the predicted responses of mouse carotid arteries is insufficient for some material law constants sets, which were taken directly from the literature (for example, the Eln+/+ mouse model). Therefore, some new constants sets are proposed for selected mouse models, Eln+/+ and Fbln5−/− here. This is performed to better represent the behavior of the mice carotid artery, as a part of the extended analysis of the problems addressed in this paper.
A parametric FEM analysis is conducted to find some new parameters of the law. The constitutive relation for the mouse carotid aorta taken from article [14] is the starting point for the current analysis. The parameters of the law C10, k1, and k2 are modified until the predicted pint-Dout relation is close to the experimental response.
3.3.1. Eln+/+ Mice
The Eln+/+ model is chosen for the analysis, as the FEM predictions from Figure 4b seem to be inaccurate. The geometry and initial stretch of the third specimen from [19] are used in further computations. Two sets of new Holzapfel constants for the Eln+/+ mouse model were determined in the course of the parametric analysis. The first, the “A” set is characterized with the following parameters: C10A = 19 kPa, k1A = 3 kPa, and k2A = 0.53; while the second, denoted as “B”, has the following parameters: C10B = 12 kPa, k1B = 10 kPa, and k2B = 0.23; and the fiber distribution angles are, in both cases, γmedia = 30° and γadventitia = 75°. The comparison of the predictions of the Eln+/+ carotid artery FEM response and the experimental one from [19] is shown in Figure 5a.
3.3.2. Fbln5−/− Mice
Additionally, it is checked whether it is possible to formulate new Holzapfel constitutive law parameters for the Fbln5−/− mouse model, the one which showed good agreement with the experimental results for most of the analyzed sets of constants, as shown in Figure 4c. The geometry and stretch of the carotid in this analysis are the same as for the first specimen from [19]. Two new sets of the Holzapfel law parameters for the Fbln5−/− mice were devised in the course of the parametric analysis. These are consequently denoted as the “C” set, which is characterized with the following parameters: C10C = 15 kPa, k1C = 8 kPa, and k2C = 0.7; and the “D” set, defined by C10D = 10 kPa, k1D = 15 kPa, and k2D = 0.42; and the fiber distribution angles are, for both cases, γmedia = 30° and γadventitia = 75°. The comparison of the estimations of the Fbln5−/− carotid artery FEM response and the experimental behavior available in [19] is shown in Figure 5b.
The aforesaid results will be further discussed in detail in Section 4.2.
3.4. Buckling Analysis
An appropriately validated law should also enable the description of other mechanical phenomena, more complex than simple inflation. Therefore, additional analyses are performed to check whether the selected material laws are capable of predicting mouse carotid artery loss of stability in the form of buckling. FEM simulations are conducted with the aid of the second computational model to study this aspect and the results are verified against the experimental data collected from [19]. The Fung and Holzapfel constitutive relations for the Eln+/+ and Fbln5−/− mouse models are used for this purpose. The maximum horizontal displacement of the artery (uA) axis is monitored to determine buckling pressures. The analysis is carried out for three different initial axial stretches λz, which are 1.0, 1.2, and 1.4, similarly as in the article [19].
3.4.1. Eln+/+ Mice
The analysis of the Eln+/+ mouse artery buckling is conducted for the geometry and using the Fung constants of the fifth specimen from [19], as this turned out to be the most accurate description presented in [19] for the Eln+/+ artery. This behavior is reviewed by additional calculations performed for the aforementioned geometry of the artery but using the Holzapfel constitutive relation with the “B” set of constants, described in Section 3.3.1, which proved to be very accurate. The response of the artery axis, defined as the relation between the internal pressure pint and the displacement uA, is shown for the Eln+/+ FEM analyses in Figure 6a. The buckling modes that were observed during the analysis and some reference experimental comparisons are shown in Figure 7.
The buckling pressures are collected in Table 2, namely, the experimental values pexp from [19], the FEM values derived from the current analysis of post-buckling response pbuck,FEM, and the FEM values puA,FEM for the pressure at uA = Dout/2. The pexp, according to [19], is the pressure value at which the maximum lateral displacement of the carotid artery axis is equal to the radius of the unloaded artery. Thus, a direct comparison of pexp and puA,FEM is possible. Consequently, a relative error is calculated between the FEM estimations and experimental values for every stretch level and constitutive relation under consideration. The pbuck,FEM is determined in a typical way, like in [37,38], by finding the intersection point of a curve tangent to the post-buckling response and the second one tangent to the initial response (before buckling occurs). This value is also introduced here, because it is the theoretical moment when the phenomenon is initiated and may be a reference in further studies.
Further discussion of the results of Eln+/+ mouse model arteries’ buckling will be provided in Section 4.3.1.
3.4.2. Fbln5−/− Mice
A similar analysis of buckling is performed for the carotid artery of the Fbln5−/− mice. The geometry and the Fung law constants of the first specimen from [19] are used here. These allowed for the most accurate FEM predictions of the Fbln5−/− artery response during inflation, so they will be further validated. The buckling of the Fbln5−/− mice arteries is also checked using the Holzapfel constitutive relation with the new “C” set of constants, described in Section 3.3.2. This particular set of constitutive relation parameters seems to be very accurate. The response of the artery axis, defined as the relation between the pressure pint and the displacement uA, is shown for the Fbln5−/− FEM analyses in Figure 6b, while the corresponding buckling pressures and the relative errors are collected in Table 3. The buckling modes that were observed during the analysis are similar to the ones observed for the Eln+/+ mouse model, as shown in Figure 7.
4. Discussion
4.1. Validation of Selected Material Laws
4.1.1. Fung Law for Wild-Type, Sgcd−/−, and Mdx Mice
The constants of the constitutive relation proposed in [23] for wild-type mice seem to be the least accurate of the three mouse models considered. The predicted shapes of the pint-Dout curves in the FEM simulations are not exactly correlated with the experimental data from [24]. The experimental pint-Dout response presents a noticeable inflection point for the internal pressure close to 50 mmHg, whereas the inflection point for the FEM estimations is rather hardly noticeable or occurs at very low pint values. To assess the computational response of wild-type mice arteries from the quantitative point of view, the predictions of RMSE/nRMSE between the FEM results and the experimental measurement are calculated. The lowest RMSE/nRMSE is obtained for the 102704 wild-type mouse specimen and equals 19 μm/4%. Therefore, this set of constants is a reasonable approximation of the experiment, although the shape of the pint-Dout is not perfect. As mentioned in Section 2.6, we propose a threshold value for acceptable accuracy at the level of ~20 μm, being 5% of a typical outer diameter of the mouse carotid artery, which we find to be approximately 400 μm [19,23]. The FEM response predicted employing the mean data set (RMSE = 29.7 μm/nRMSE = 6%), and the one for the specimen 110304 (RMSE = 26.2 μm/nRMSE = 5%) is a bit less accurate than the preceding one. The Fung constants sets denoted as 012705 and 011305 have poor accuracy, because the RMSE/nRMSE values are 46.2 μm/9% and 49.2 μm/9%, respectively. The Fung law for specimen 110104 is inaccurate, since the RMSE = 101.8 μm/nRMSE = 20% and this is large compared to the measured diameter of the artery.
On the other hand, the results of the sgcd−/− FEM analyses quite well resemble the experimental behavior from [24] when speaking about the shape of the pint-Dout response. The square errors for the mean set of Fung law constants (RMSE = 10.2 μm/nRMSE = 2%) and for the specimens 122104 (RMSE = 13.1 μm/nRMSE = 3%) and 120304 (11.2 μm/nRMSE = 2%) are low. Therefore, these constants have been successfully validated. The calculations performed for the combination of the Fung law parameters denoted with numbers 011704 and 012005 are also quite close to the experimental data. The RMSE/nRMSE for these sets are 27.3 μm/6% and 29.3 μm/6%. Nevertheless, the accuracy of the constitutive laws, denoted as 011905 and 011405, is rather poor, since the RMSE/nRMSE equals 47 μm/10% for both of them.
Validation of the mdx mice Fung constitutive relation parameters from [23] is also quite successful. The slope of the pressure–diameter curve is reasonably appropriate for almost all of the material law sets presented in [23] under consideration here. The quantitative analysis of the FEM results against the experimental ones indicates that the accuracy of the Fung laws denoted as 112204 and 012205 in [23] is very good, with the RMSE/nRMSE values being 11.9 μm/3% and 12 μm/3%, respectively. It is still accurate for the averaged mdx Fung constants (RMSE = 18.9 μm/nRMSE = 4%) and the 121504 mice (RMSE = 20.1 μm/nRMSE = 4%), whereas the prediction becomes slightly less precise for the specimen 020105 (RMSE = 30.6 μm/nRMSE = 7%). The Fung law denoted with the number 121404 is rather inaccurate, because of the quite low RMSE/nRMSE value, which is almost 58 μm/12%.
It is also worth mentioning that not only the response during carotid artery pressurization is correctly recreated for the successfully validated laws from [23]. The effect of the diameter change during the initial stretching is also accurately captured in FEM computations, which means that the law provides a good correlation with the experimental data for different loading conditions.
However, one must keep in mind that the experiments from [24] have been carried out to the pressure level of 140 mmHg and this is the validity range of the laws. It is noticeable in Figure 3 that in most cases, the slope of the pint-Dout relation near the 140 mmHg pressure level should be steeper, and thus the computational prediction for higher values of pint would be inaccurate.
4.1.2. Fung Law for Eln+/−, Eln+/+, FBln5−/−, and Fbln5+/+ Mice and Holzapfel Law for Eln+/+ Mice
At first, it has to be emphasized that some of the Fung constants sets from [19] did not allow for a solution to be obtained. The calculations were terminated for Eln+/− 4 and Fbln5−/− 3 at an internal pressure close to 65 mmHg, due to convergence errors and some unphysical behavior. It was not possible to launch calculations for the laws Fbln5+/+ 6 and Fbln5+/+ 8. That is because the stiffness matrices defined for the Fung orthotropic hyperelastic model, based exactly on the data from [19], are not positive definite and, therefore, are numerically instable [39,40]. Nevertheless, the remaining calculations were successful. These can be divided into two groups to some extent.
It is observed for the Eln+/− and Fbln5−/− FEM results that almost all of the pint-Dout curves have reasonable shapes, close to the experimental one. The predicted pressure–diameter relations from the quantitative point of view are also quite precise. Very low RMSE/nRMSE values are achieved for the following: Eln+/− 1 (14.8 μm/3%), Fbln5−/− 1 (3.1 μm/1%), Fbln5−/− 4 (11.1 μm/2%), and Fbln5−/− 6 (14.1 μm/3%). The accuracy is close to the defined earlier threshold value of 20 μm and thus is considered acceptable for Eln+/− 2 (RMSE = 24.4 μm/nRMSE = 5%), Eln+/− 5 (RMSE = 29.3 μm/nRMSE = 6%), Eln+/− 6 (RMSE = 23.4 μm/nRMSE = 5%), Fbln5−/− 2 (RMSE = 24.4 μm/nRMSE = 5%), Fbln5−/− 5 (RMSE = 22.3 μm/nRMSE = 5%), and Fbln5−/− 7 (RMSE = 22.2 μm/nRMSE = 5%). The FEM estimations are not precise for the Fbln5−/− mean set, Eln+/− mean set, and Eln+/− 3, because in these cases, the RMSE/nRMSE values are higher and range from 41.5 μm/7% to 71.0 μm/14%.
On the other hand, the Eln+/+ and Fbln5+/+ Fung law parameters are not as good as the previous ones. The Eln+/+ constitutive relation constants are the least accurate. The shapes of FEM estimations for Eln+/+ mice do not resemble the experiment well. Especially the carotid artery diameter after stretching and the slopes in the low-pressure zone are poorly predicted. The lowest RMSE/nRMSE is calculated for the Eln+/+ 5 case and equals 27.1 μm/5%. The other ones are much higher. For example, the RMSE/nRMSE for Eln+/+ 1 is 71.8 μm/13%, whereas it equals 89.8 μm/16% for the Eln+/+ mean set. Both the third and seventh constitutive relations parameters, in the case of Fbln5+/+, have similar, reasonable accuracy (RMSE/nRMSE being ~19 μm/4%) and a quite satisfying shape of the pint-Dout function, although the slope in the high-pressure zone (from 140 mmHg) should be steeper. However, the remaining ones are less accurate, as the RMSE/nRMSE values are 32.7 μm/6% for the Fbln5+/+ 2, 35.5 μm/7% for the Fbln5+/+ 4, 60.2 μm/11% for the Fbln5+/+ 1, 67.7 μm/13% for the Fbln5+/+ 5 and 140.5 μm/26% for the Fbln5+/+ mean set of constants. The incorrect prediction of the external diameter of the artery during stretching was the main problem regarding the accuracy of FEM results obtained with the aid of the Fbln5+/+ Fung law constants sets.
Another conclusion can also be formulated here. It is noticeable that all of the pint-Dout curves, calculated with the aid of the mean sets of constitutive relations parameters and mean initial stretch values, have good shapes but are shifted too much from the reference result. This is mainly due to an inaccurate carotid artery response description during initial loading in the axial direction. Therefore, averaging of material constants for specimens with quite scattered initial stretch values, as conducted in [19], seems to be ineffective.
The attempt to use the Holzapfel law from [14], which has been determined for the Eln+/+ mouse aorta to model the response of the carotid artery, is also not fully successful. The inflection of this pressure–diameter relation occurs at very low pressure, and the response in the high-pressure zone is too stiff. The RMSE for this case is quite high and equals 49.2 μm.
A set of constants of the Holzapfel constitutive relation is also presented in [22]. Unfortunately, the authors of this paper did not say which type of mouse was tested. For this reason, it is rather difficult to use them in other analyses. However, the concept of defining the carotid artery properties by creating two layers of the hyperelastic anisotropic Holzapfel material with different fiber family angles (representing media and adventitia) is interesting. It is an improvement of the standard approach [34] and describes the mechanics of the artery in more detail. No modifications in the Abaqus code need to be introduced in order to define properties of such an artery.
4.1.3. Summary of Validation
As a result of computational verification of the Fung law constants proposed in [23] against the data presented in [24], we recommend the use of the following sets of constants in the FEM analysis of mouse carotid arteries: 102704 for the wild-type, the mean one for the sgcd−/−, and 112204 for the mdx.
Some conclusions can be drawn after validation of the Fung law constants presented in [19]. The best accuracy of the FEM estimates of the carotid artery response has been obtained for the Fbln5−/− first set and Eln+/− first set. The results obtained using the set of constants denoted as Fbln5+/+ 7 are also quantitatively and qualitatively satisfactory. Therefore, the use of these three constitutive relations is recommended in computational analyses of mice carotid arteries of such types. On the other hand, the FEM response estimations for the Eln+/+ mice, using the sets proposed in [19], are rather inaccurate and, hence, we do not recommend using them. For this reason, new ones have been proposed and will be discussed in the next chapter.
It is worth mentioning that various mouse models allow for significant insight into problematics of human diseases [41,42]. Currently, many issues related to bioengineering are diagnosed and analyzed by means of experiments, with the significant support of numerical computations. These tests are often carried out on mice [43,44], also using the carotid arteries as the main testing object [16,19,45]. However, such computational analyses are only reliable if the used models are valid. That is the reason why these problems need to be underlined.
4.2. Proposals of New Constants Sets
It is required to assign the fiber family distribution angle γ [34], through the appropriate definition of the set of unit vectors aα, when defining the Holzapfel constitutive relation parameters. The orientation of fibers in the mouse carotid arteries is still under investigation. For example, it is reported in [21] that under physiological pressures, most of the fibers in the adventitia layer are parallel to the carotid axis, but almost the same amount of fibers have an orientation ranging from approximately 45° to 90° (with respect to the circumferential direction). In the media layer, the diagonal direction is the one with the highest number of fibers, but similarly as before, other fiber distributions are also observed in this layer. After the averaging of the fiber distribution angles in the through-the-thickness direction, the authors of [21] determined two leading directions of the fibers, which are the axial and the diagonal ones. On the other hand, the authors of [14] have investigated the distributions of fibers in the aorta of newborn Eln+/+ mice. It is reported in [14] that the fiber family angle for the entire thickness of the aorta wall in the unloaded state lies somewhere between 38° and 46° (with respect to the circumferential direction).
Therefore, in this paper, similarly to articles [14,22], fixed fiber angles are used in calculations, together with the alignment parameter κ, equaling 0. It is assumed that the initial fiber angle for media is 30° and 75° for the adventitia (with respect to the circumferential direction). This allows for taking into account the information that the fibers in the axial direction are important in the adventitia and the diagonal directions are pronounced in the media layer. At the same time, the fibers are not perfectly aligned with the axis of the cylinder or diagonal direction, which is in accordance with [21]. The mean unloaded distribution in the through-the-thickness direction is approximately 55° for such a definition of fiber families in media and adventitia; thus, diagonal directions are also preferred in the analysis in an averaged sense. This corresponds to some extent with the work conducted by [14,21]. For this reason, such a combination of fiber angles’ distribution in the media and adventitia is justified.
4.2.1. Eln+/+ Mouse Model
The shape of both FEM curves in Figure 5a is very good and enables the appropriate description of the change in the diameter of the artery at every pressure level. The RMSE/nRMSE values calculated for the proposed laws are 9.7 μm/2% for the Holzapfel “A” and 7.6 μm/1% for the Holzapfel “B” set. These are very low and indicate that the new constants sets have high precision, as opposed to the Fung law from [19]—refer to the results presented in Section 3.2.
4.2.2. Fbln5−/− Mouse Model
The shape of the new FEM curves for the Fbln5−/− mouse model from Figure 5b, resulting from the application of the new law parameters, is appropriate and allows for an accurate description of the artery response. The RMSE/nRMSE values calculated for the newly established Holzapfel law parameters are 4.8 μm/1% for set “C” and 4.0 μm/1% for set “D”. These are very low and indicate that the new constants sets are precise.
4.2.3. Summary
The concept presented in [22] to build the mouse carotid artery from two load-bearing layers (media and adventitia) has been validated. It has been assumed in the computational FEM model that each layer is endowed with a different fiber family angle definition, but the parameters C10, k1, and k2 are the same for both of them. Moreover, this particular model has been successfully used to propose some new sets of the Holzapfel law constants for Eln+/+ and Fbln5−/− mice models. These are collected in Table 4.
4.3. Buckling
An extended discussion on buckling problems is initiated, since an appropriately validated material law and reliable numerical model should allow for the description not only of static inflation but also of other more complex mechanical phenomena.
4.3.1. Eln+/+ Mouse Model
The FEM calculations reveal that all the laws analyzed for the Eln+/+ mice are capable of predicting buckling.
The loss of stability of the arteries, which have been initially stretched before inflation, typically has the form of a single half-wave mode, as shown in Figure 7a. In such a case, additional prestress forces are introduced to the analyzed system before the inflation process is started. In effect, the relatively soft carotid artery becomes stiffer and buckles globally due to increasing pressure. This behavior is in accordance with the research from [19] and our preliminary experimental observations conducted on stretched mouse carotid arteries, as shown in Figure 1c. However, when there is no initial stretch (λz = 1.0) and the Fung law is used, a slightly different response is observed and the artery deforms in such a way that three half-waves are observed along the carotid artery, as presented in Figure 7b. When the analysis is started and the internal pressure is increased, the artery is also compressed in the longitudinal direction, as it is tied tightly to the cannulas and no stretch has been applied. In consequence, due to the low stiffness of the material, local buckling along the artery in the form of wrinkles is observed at low internal pressure values. As internal pressure is increased and also due to the fact that the artery is slightly curved, the artery finally experiences a form of deformation which resembles a three half-wave mode but which is mainly caused by the initial aforementioned local buckling. This has been observed in the FEM analysis. The deformations of the artery shortly before their rapid growth is started are shown in Figure 7c. The deformations in Figure 7c have been multiplied by a scale factor of 4 to better depict the local buckling waves and the process of the artery final shape formation. Although such a deformation has not been reported in [19], we claim that it may occur and, in addition, we observed a similar one during the preliminary testing of the CB57BL/6 mice carotid arteries that were not initially stretched. This is depicted in Figure 7d.
Comparison of the values of pexp and puA,FEM for the Eln+/+ mouse model indicates that the FEM predictions underestimate the buckling pressures rather noticeably for λz being 1.0 or 1.2, when the Fung law is used, since the relative errors calculated between these values are 29.9% and 42.3%, respectively. This FEM response is similar to the one determined in analytical calculations presented in [19]. The FEM analysis with the Fung law is accurate when the initial stretch is 1.4, because the relative error is only 6.7%. This prediction is also better than the one calculated analytically and presented in [19], which overestimated the buckling pressure by ~17%. In the case of the application of the proposed set of constants of the Holzapfel law, the actual computational results seem to be more accurate than the ones obtained with the help of the Fung law. The buckling pressure is overestimated by 14.9%, when the artery is not initially stretched (λz = 0). The relative error in the buckling analysis of the carotid artery when the longitudinal stretch is λz = 1.2 is even lower and equals only 6.3%. The FEM result is almost the same as the experimental measurement for the case of initial stretch of 1.4. This suggests that the Holzapfel constitutive relation may be a better choice than the Fung law, when the buckling of the carotid arteries is to be analyzed. Furthermore, the analysis proves that the new set of Holzapfel constants for the Eln+/+ mice is effective for the description of complex responses of the carotid artery subjected to a change in internal pressure.
4.3.2. Fbln5−/− Mouse Model
Buckling has not been observed, in the course of the FEM simulations, for the Fbln5−/− Fung law, when the initial stretch was 1.4, although very high internal pressure (400 mmHg) was applied. The authors of [19] also failed to estimate a reasonable value of buckling pressure for λz = 1.4 (it is greater than 600 mmHg). Buckling occurred in the remaining cases. Similarly, as for the Eln+/+ mouse, the Fbln5−/− arteries buckle in the FEM analysis in the form shown in Figure 7b for the Fung law and λz = 1.0 and as presented in Figure 7a for the remaining cases of initial longitudinal stretch.
The accuracy of the FEM analyses for λz = 1.0 for both laws is rather low, as the relative errors between the calculations and the experimental value are 43.1% and 41.4% for the Fung and Holzapfel laws, respectively. The FEM results resemble the experiment for the carotid artery stretched at the beginning of the test to 1.2 quite precisely for the Fung law (the error is 8.7%), while the response calculated with the help of the Holzapfel law is slightly overestimated (the error yields ~18.3%). There is a significant difference between the buckling pressure estimations between the Fung and Holzapfel laws for the higher stretch, 1.4 here. The Fung material law does not allow the artery to buckle, whereas the Holzapfel law does, and the difference between the experimental reference value and the FEM estimation is actually not so big. It must be emphasized that according to [19], 9 out of 10 tested Fbln5−/− carotid arteries, which were stretched initially to 1.4, did not buckle. The maximum pressure during the test for this case was 200 mmHg. Therefore, the experimental buckling pressure for this artery was determined by the linear extrapolation of the results for lower stretch ratios. For this reason, this experimental reference may be treated as uncertain and is additionally marked with * in Table 3. In view of this, we claim that it is possible that the artery stretched to λz = 1.4 would still buckle, as observed in FEM analysis when the Holzapfel law was used. These results suggest that the sets of constants of the Holzapfel constitutive relation proposed in Section 3.3 allow for a better estimation of Fbln5−/− carotid artery buckling response compared to the predictions of buckling performed with the aid of the Fung law and the constants available in [19].
4.3.3. Summary of Buckling Analysis
The computational analysis of Eln+/+ and Fbln5−/− reveals that both analyzed material laws are capable of buckling predictions, while FEM can be efficiently used to simulate this phenomenon.
The Holzapfel law and the used constant sets seem promising regarding the analysis of buckling, as acceptable accuracy has been achieved in five out of six analyzed cases (Eln+/+ with all the analyzed λz values and Fbln5−/− with λz = 1.2 and λz = 1.4). The accuracy of critical buckling pressures’ estimation, when the Fung law was used, was acceptable only in two out of six analyzed cases (Eln+/+ with λz = 1.4 and Fbln5−/− with λz = 1.2).
The results of the buckling analysis are especially important for arteries which have higher stretches, because the real (in vivo) λz is rather high, as reported in [19,23]. It is worth mentioning that for the highest analyzed stretch value λz = 1.4, the Holzapfel law was able to detect buckling for both mouse models under consideration (Eln+/+ and Fbln5−/−), while the Fung law prediction was successful only for the Fbln5−/− model.
Therefore, the Holzapfel constitutive relation, in the version studied in this paper (the carotid artery is built of two layers of Holzapfel material), appears to be better suited for the analysis of artery buckling.
5. Conclusions
More than 70 nonlinear, static analyses have been conducted, on reliable FEM models, to verify whether the constants of the Fung or Holzapfel laws, available in the literature, are capable of describing the change in the carotid artery outer diameter, while it is subjected to increasing internal pressure during static inflation.
It turned out in the course of the calculations that a set of constants enabling the reasonable description of the carotid artery response is available for almost every mouse model under consideration (wild-type, mdx, sgcd−/−, Eln+/+, Eln−/−, Fbln5+/+, and Fbln5−/−). However, many of the constitutive relation parameter sets did not allow us to estimate the behavior of the artery with a good accuracy.
A total number of 53 different material law constants sets were analyzed. The RMSE/nRMSE values between the FEM estimations and the experimental response were kept within reasonable limits for only 13 of them.
In effect, some recommendations on the constants that seem to be accurate are provided. We suggest the use of the following sets of the Fung constants from [23]: 102704 for wild-type, mean for sgcd−/−, and 112204 for mdx. Similarly, the following Fung law constants sets from [19] are positively validated: Eln+/− 1, Fbln5−/− 1, and Fbln5+/+ 3; while the Eln+/+ seems to be imprecise.
It has been proven that valid Holzapfel law parameters can be efficiently determined with the aid of parametric FEM analysis. New constant sets for Eln+/+ and Fbln5−/− mice have been proposed.
The modeling of a mouse carotid artery, as a domain made of two layers of Holzapfel material, is efficient, has physical reasoning, and improves the accuracy of the artery response description.
The buckling of carotid arteries still requires investigation. This phenomenon can be effectively recreated and studied with the aid of nonlinear static FEM analysis. The results presented here indicate that the Holzapfel law seems to be better suited for the description of loss of stability.
The constant sets that have been successfully validated or proposed can be now used in further studies. It is possible to apply them not only in static analyses but also in others, like, for instance, in Fluid–Structure Interaction (FSI) calculations.
The main advantage of the approach presented in this paper is its versatility. Computational 3D analysis is a modern way of diagnostics and health monitoring. It allows for a reduction in the number of experiments conducted in laboratories. The obtained FEM results enable detailed insight into the physics and essence of the studied problems.
Author Contributions
Conceptualization, B.S., J.C. and K.W.; methodology, B.S., J.C. and K.W.; validation, B.S. and J.C.; formal analysis, B.S. and J.C.; investigation, B.S.; resources, K.W.; data curation, B.S.; writing—original draft preparation, B.S.; writing—review and editing, B.S.; visualization, B.S.; supervision, J.C. and K.W.; project administration, B.S.; funding acquisition, B.S. All authors have read and agreed to the published version of the manuscript.
Funding
These studies have received financial support from Gdańsk University of Technology by the DEC-4/2020/IDUB/I.3.3 grant under the Argentum Triggering Research Grants—‘Excellence Initiative—Research University’ program.
Institutional Review Board Statement
Animal study protocols were ordered and conducted at the Medical University of Gdańsk.
Informed Consent Statement
Not applicable.
Data Availability Statement
The raw data supporting the conclusions of this article will be made available by the authors on request.
Acknowledgments
Computations were carried out using the computers of the Centre of Informatics Tricity Academic Supercomputer & Network.
Conflicts of Interest
The authors declare no conflicts of interest.
Appendix A
The material properties of all the carotid arteries used for validation purposes (necessary model input data) are collected in Table A1, Table A2, Table A3, Table A4, Table A5, Table A6, Table A7 and Table A8. The data in Table A1, Table A2, Table A3, Table A4, Table A5, Table A6, Table A7 and Table A8 have been taken directly from the reference papers without any modifications.

Table A1.
Fung orthotropic constants for the wild-type mice [23].
Table A1.
Fung orthotropic constants for the wild-type mice [23].
| Designation Number | b1111 | b1122 | b2222 | b1133 | b2233 | b3333 | c [kPa] |
|---|---|---|---|---|---|---|---|
| 11305 | 1.032 | 0.018 | 0.250 | 0.185 | 0.019 | 0.308 | 202 |
| 12705 | 0.474 | 0.041 | 0.113 | 0.149 | 0.044 | 0.234 | 400 |
| 102704 | 0.873 | 0.000 | 0.182 | 0.208 | 0.022 | 0.341 | 171 |
| 110104 | 0.130 | 0.000 | 0.099 | 0.000 | 0.007 | 0.184 | 232 |
| 110304 | 1.339 | 0.189 | 0.282 | 0.284 | 0.071 | 0.384 | 110 |
| 110504 | 0.662 | 0.074 | 0.224 | 0.114 | 0.033 | 0.197 | 303 |
| mean | 0.752 | 0.054 | 0.192 | 0.157 | 0.033 | 0.275 | 236 |
Table A2.
Fung orthotropic constants for the mdx mice [23].
Table A2.
Fung orthotropic constants for the mdx mice [23].
| Designation Number | b1111 | b1122 | b2222 | b1133 | b2233 | b3333 | c [kPa] |
|---|---|---|---|---|---|---|---|
| 12505 | 5.381 | 0.437 | 0.551 | 1.233 | 0.216 | 1.038 | 33 |
| 20105 | 3.940 | 0.000 | 0.340 | 0.895 | 0.059 | 0.845 | 49 |
| 112204 | 3.039 | 0.268 | 0.543 | 0.637 | 0.140 | 0.793 | 41 |
| 121404 | 2.111 | 0.000 | 0.594 | 0.387 | 0.137 | 0.939 | 31 |
| 121504 | 1.708 | 0.241 | 0.445 | 0.416 | 0.154 | 0.702 | 67 |
| 12505 | 5.381 | 0.437 | 0.551 | 1.233 | 0.216 | 1.038 | 33 |
| mean | 3.236 | 0.189 | 0.494 | 0.714 | 0.141 | 0.864 | 44 |
Table A3.
Fung orthotropic constants for the sgcd−/− mice [23].
Table A3.
Fung orthotropic constants for the sgcd−/− mice [23].
| Designation Number | b1111 | b1122 | b2222 | b1133 | b2233 | b3333 | c [kPa] |
|---|---|---|---|---|---|---|---|
| 011405 | 3.638 | 0.075 | 0.253 | 0.993 | 0.088 | 0.994 | 42 |
| 011905 | 1.946 | 0.000 | 0.226 | 0.554 | 0.080 | 0.642 | 67 |
| 012005 | 0.482 | 0.000 | 0.391 | 0.079 | 0.056 | 0.476 | 102 |
| 111704 | 2.211 | 0.207 | 0.401 | 0.511 | 0.128 | 0.623 | 82 |
| 120304 | 1.665 | 0.116 | 0.344 | 0.385 | 0.099 | 0.494 | 97 |
| 122104 | 1.943 | 0.119 | 0.302 | 0.473 | 0.089 | 0.757 | 63 |
| mean | 1.981 | 0.086 | 0.319 | 0.499 | 0.09 | 0.664 | 76 |
Table A4.
Fung orthotropic constants for the Eln+/+ mice [19].
Table A4.
Fung orthotropic constants for the Eln+/+ mice [19].
| Designation Number | b1111 | b1122 | b2222 | b1133 | b2233 | b3333 | c [kPa] |
|---|---|---|---|---|---|---|---|
| Eln+/+ - 1 | 0.338 | 0.030 | 0.090 | 0.000 | 0.056 | 0.148 | 323 |
| Eln+/+ - 2 | 0.249 | 0.000 | 0.197 | 0.027 | 0.109 | 0.387 | 125 |
| Eln+/+ - 3 | 1.269 | 0.000 | 0.467 | 0.523 | 0.270 | 0.557 | 59 |
| Eln+/+ - 4 | 4.908 | 0.000 | 0.421 | 1.171 | 0.272 | 1.052 | 26 |
| Eln+/+ - 5 | 0.168 | 0.111 | 0.170 | 0.000 | 0.068 | 0.118 | 328 |
| Eln+/+ - 6 | 2.522 | 0.000 | 0.636 | 0.140 | 0.130 | 0.579 | 38 |
| Eln+/+ - 7 | 0.376 | 0.000 | 0.135 | 0.179 | 0.091 | 0.383 | 252 |
| mean | 1.404 | 0.020 | 0.302 | 0.292 | 0.143 | 0.461 | 165 |
Table A5.
Fung orthotropic constants for the Eln+/− mice [19].
Table A5.
Fung orthotropic constants for the Eln+/− mice [19].
| Designation Number | b1111 | b1122 | b2222 | b1133 | b2233 | b3333 | c [kPa] |
|---|---|---|---|---|---|---|---|
| Eln+/− - 1 | 0.515 | 0.000 | 0.107 | 0.213 | 0.074 | 0.306 | 180 |
| Eln+/− - 2 | 3.49 | 0.000 | 0.330 | 0.793 | 0.126 | 0.99 | 31 |
| Eln+/− - 3 | 0.439 | 0.041 | 0.156 | 0.000 | 0.085 | 0.19 | 125 |
| Eln+/− - 4 | 4.436 | 0.000 | 0.380 | 1.299 | 0.231 | 1.142 | 32 |
| Eln+/− - 5 | 3.359 | 0.000 | 0.353 | 0.990 | 0.083 | 1.117 | 48 |
| Eln+/− - 6 | 1.937 | 0.000 | 0.442 | 0.620 | 0.177 | 0.862 | 41 |
| mean | 2.363 | 0.007 | 0.295 | 0.653 | 0.129 | 0.768 | 76 |
Table A6.
Fung orthotropic constants for the Fbln5+/+ mice [19].
Table A6.
Fung orthotropic constants for the Fbln5+/+ mice [19].
| Designation Number | b1111 | b1122 | b2222 | b1133 | b2233 | b3333 | c [kPa] |
|---|---|---|---|---|---|---|---|
| Fbln5+/+ - 1 | 1.076 | 0.000 | 0.213 | 0.396 | 0.132 | 0.559 | 88 |
| Fbln5+/+ - 2 | 4.455 | 0.000 | 0.360 | 1.488 | 0.160 | 1.367 | 39 |
| Fbln5+/+ - 3 | 0.148 | 0.000 | 0.093 | 0.055 | 0.061 | 0.164 | 490 |
| Fbln5+/+ - 4 | 0.045 | 0.000 | 0.031 | 0.052 | 0.035 | 0.137 | 737 |
| Fbln5+/+ - 5 | 4.639 | 0.023 | 0.218 | 0.203 | 0.000 | 1.186 | 27 |
| Fbln5+/+ - 6 | 1.061 | 0.000 | 0.086 | 0.719 | 0.136 | 0.632 | 171 |
| Fbln5+/+ - 7 | 2.547 | 0.000 | 0.181 | 1.036 | 0.196 | 0.819 | 117 |
| Fbln5+/+ - 8 | 5.052 | 0.000 | 0.185 | 2.624 | 0.402 | 1.955 | 50 |
| mean | 2.378 | 0.003 | 0.171 | 0.822 | 0.140 | 0.852 | 215 |
Table A7.
Fung orthotropic constants for the Fbln5−/− mice [19].
Table A7.
Fung orthotropic constants for the Fbln5−/− mice [19].
| Designation Number | b1111 | b1122 | b2222 | b1133 | b2233 | b3333 | c [kPa] |
|---|---|---|---|---|---|---|---|
| Fbln5−/− - 1 | 7.860 | 0.000 | 0.971 | 3.796 | 0.505 | 3.877 | 25 |
| Fbln5−/− - 2 | 3.964 | 0.692 | 1.192 | 2.627 | 0.555 | 2.724 | 34 |
| Fbln5−/− - 3 | 21.41 | 0.000 | 0.446 | 9.765 | 0.491 | 7.595 | 11 |
| Fbln5−/− - 4 | 17.325 | 0.612 | 2.258 | 3.797 | 0.000 | 4.247 | 9 |
| Fbln5−/− - 5 | 1.338 | 0.353 | 0.604 | 0.552 | 0.285 | 0.830 | 161 |
| Fbln5−/− - 6 | 1.605 | 0.0000 | 0.598 | 0.239 | 0.029 | 1.912 | 45 |
| Fbln5−/− - 7 | 8.528 | 0.146 | 0.956 | 3.095 | 0.265 | 3.366 | 19 |
| mean | 8.861 | 0.258 | 1.003 | 3.410 | 0.304 | 3.507 | 43 |
References
- Mojarab, A.; Kamali, R. Design, Optimization and Numerical Simulation of a MicroFlow Sensor in the Realistic Model of Human Aorta. Flow Meas. Instrum. 2020, 74, 101791. [Google Scholar] [CrossRef]
- Pasta, S.; Catalano, C.; Cannata, S.; Guccione, J.M.; Gandolfo, C. Numerical Simulation of Transcatheter Mitral Valve Replacement: The Dynamic Implication of LVOT Obstruction in the Valve-in-Ring Case. J. Biomech. 2022, 144, 111337. [Google Scholar] [CrossRef] [PubMed]
- Uesaka, K.; Oka, H.; Kato, R.; Kanie, K.; Kojima, T.; Tsugawa, H.; Toda, Y.; Horinouchi, T. Bioinformatics in Bioscience and Bioengineering: Recent Advances, Applications, and Perspectives. J. Biosci. Bioeng. 2022, 134, 363–373. [Google Scholar] [CrossRef] [PubMed]
- Heydarian, A.; Darvishi, P.; Mortazavi, H.; Mortazavy Beni, H. Experimental and Numerical Responses of Fibroblast and Epithelial Cells to the Frequency of Electric Toothbrush. J. Mech. Behav. Biomed. Mater. 2023, 140, 105697. [Google Scholar] [CrossRef]
- Knutsen, A.K.; Vidhate, S.; McIlvain, G.; Luster, J.; Galindo, E.J.; Johnson, C.L.; Pham, D.L.; Butman, J.A.; Mejia-Alvarez, R.; Tartis, M.; et al. Characterization of Material Properties and Deformation in the ANGUS Phantom during Mild Head Impacts Using MRI. J. Mech. Behav. Biomed. Mater. 2023, 138, 105586. [Google Scholar] [CrossRef]
- Mondal, S.; MacManus, D.B.; Bonatti, A.F.; De Maria, C.; Dalgarno, K.; Chatzinikolaidou, M.; De Acutis, A.; Vozzi, G.; Fiorilli, S.; Vitale-Brovarone, C.; et al. A Computational Analysis of a Novel Therapeutic Approach Combining an Advanced Medicinal Therapeutic Device and a Fracture Fixation Assembly for the Treatment of Osteoporotic Fractures: Effects of Physiological Loading, Interface Conditions, and Fracture. Med. Eng. Phys. 2023, 114, 103967. [Google Scholar] [CrossRef] [PubMed]
- Motchon, Y.D.; Sack, K.L.; Sirry, M.S.; Kruger, M.; Pauwels, E.; Van Loo, D.; De Muynck, A.; Van Hoorebeke, L.; Davies, N.H.; Franz, T. Effect of Biomaterial Stiffness on Cardiac Mechanics in a Biventricular Infarcted Rat Heart Model with Microstructural Representation of in Situ Intramyocardial Injectate. Int. J. Numer. Methods Biomed. Eng. 2023, 39, e3693. [Google Scholar] [CrossRef] [PubMed]
- Fan, Y.; Ronan, W.; Teh, I.; Schneider, J.E.; Varela, C.E.; Whyte, W.; McHugh, P.; Leen, S.; Roche, E. A Comparison of Two Quasi-static Computational Models for Assessment of Intra-myocardial Injection as a Therapeutic Strategy for Heart Failure. Int. J. Numer. Methods Biomed. Eng. 2019, 35, e3213. [Google Scholar] [CrossRef] [PubMed]
- Ortún-Terrazas, J.; Cegoñino, J.; Santana-Penín, U.; Santana-Mora, U.; Pérez del Palomar, A. A Porous Fibrous Hyperelastic Damage Model for Human Periodontal Ligament: Application of a Microcomputerized Tomography Finite Element Model. Int. J. Numer. Methods Biomed. Eng. 2019, 35, e3176. [Google Scholar] [CrossRef]
- Wang, X.; Chen, J.; Dong, X.; Guan, Y.; Kang, Y. Design and Mechanical Properties Analysis of Heterogeneous Porous Scaffolds Based on Bone Slice Images. Int. J. Numer. Methods Biomed. Eng. 2023, 39, e3673. [Google Scholar] [CrossRef]
- Johnston, R.D.; Ghasemi, M.; Lally, C. Inverse Material Parameter Estimation of Patient-specific Finite Element Models at the Carotid Bifurcation: The Impact of Excluding the Zero-pressure Configuration and Residual Stress. Int. J. Numer. Methods Biomed. Eng. 2023, 39, e3663. [Google Scholar] [CrossRef] [PubMed]
- Xu, D.; Harvey, T.; Begiristain, E.; Domínguez, C.; Sánchez-Abella, L.; Browne, M.; Cook, R.B. Measuring the Elastic Modulus of Soft Biomaterials Using Nanoindentation. J. Mech. Behav. Biomed. Mater. 2022, 133, 105329. [Google Scholar] [CrossRef]
- Weizel, A.; Distler, T.; Detsch, R.; Boccaccini, A.R.; Bräuer, L.; Paulsen, F.; Seitz, H.; Budday, S. Hyperelastic Parameter Identification of Human Articular Cartilage and Substitute Materials. J. Mech. Behav. Biomed. Mater. 2022, 133, 105292. [Google Scholar] [CrossRef] [PubMed]
- Kim, J.; Cocciolone, A.J.; Staiculescu, M.C.; Mecham, R.P.; Wagenseil, J.E. Passive Biaxial Mechanical Behavior of Newborn Mouse Aorta with and without Elastin. J. Mech. Behav. Biomed. Mater. 2022, 126, 105021. [Google Scholar] [CrossRef] [PubMed]
- Cavinato, C.; Murtada, S.-I.; Rojas, A.; Humphrey, J.D. Evolving Structure-Function Relations during Aortic Maturation and Aging Revealed by Multiphoton Microscopy. Mech. Ageing Dev. 2021, 196, 111471. [Google Scholar] [CrossRef]
- Patel, M.; Savvopoulos, F.; Berggren, C.C.; Aslanidou, L.; Timmins, L.H.; de Silva, R.; Pedrigi, R.M.; Krams, R. Considerations for Analysis of Endothelial Shear Stress and Strain in FSI Models of Atherosclerosis. J. Biomech. 2021, 128, 110720. [Google Scholar] [CrossRef]
- Eberth, J.F.; Taucer, A.I.; Wilson, E.; Humphrey, J.D. Mechanics of Carotid Arteries in a Mouse Model of Marfan Syndrome. Ann. Biomed. Eng. 2009, 37, 1093–1104. [Google Scholar] [CrossRef] [PubMed]
- Bellini, C.; Bersi, M.R.; Caulk, A.W.; Ferruzzi, J.; Milewicz, D.M.; Ramirez, F.; Rifkin, D.B.; Tellides, G.; Yanagisawa, H.; Humphrey, J.D. Comparison of 10 Murine Models Reveals a Distinct Biomechanical Phenotype in Thoracic Aortic Aneurysms. J. R. Soc. Interface 2017, 14, 20161036. [Google Scholar] [CrossRef]
- Luetkemeyer, C.M.; James, R.H.; Devarakonda, S.T.; Le, V.P.; Liu, Q.; Han, H.-C.; Wagenseil, J.E. Critical Buckling Pressure in Mouse Carotid Arteries with Altered Elastic Fibers. J. Mech. Behav. Biomed. Mater. 2015, 46, 69–82. [Google Scholar] [CrossRef]
- Amin, M.; Le, V.P.; Wagenseil, J.E. Mechanical Testing of Mouse Carotid Arteries: From Newborn to Adult. J. Vis. Exp. 2012, 60, e3733. [Google Scholar] [CrossRef]
- Wan, W.; Dixon, J.B.; Gleason, R.L. Constitutive Modeling of Mouse Carotid Arteries Using Experimentally Measured Microstructural Parameters. Biophys. J. 2012, 102, 2916–2925. [Google Scholar] [CrossRef]
- Badel, P.; Avril, S.; Lessner, S.; Sutton, M. Mechanical Identification of Layer-Specific Properties of Mouse Carotid Arteries Using 3D-DIC and a Hyperelastic Anisotropic Constitutive Model. Comput. Methods Biomech. Biomed. Eng. 2012, 15, 37–48. [Google Scholar] [CrossRef] [PubMed]
- Gleason, R.L.; Dye, W.W.; Wilson, E.; Humphrey, J.D. Quantification of the Mechanical Behavior of Carotid Arteries from Wild-Type, Dystrophin-Deficient, and Sarcoglycan-δ Knockout Mice. J. Biomech. 2008, 41, 3213–3218. [Google Scholar] [CrossRef]
- Dye, W.W.; Gleason, R.L.; Wilson, E.; Humphrey, J.D. Altered Biomechanical Properties of Carotid Arteries in Two Mouse Models of Muscular Dystrophy. J. Appl. Physiol. 2007, 103, 664–672. [Google Scholar] [CrossRef]
- Guo, X.; Kassab, G.S. Variation of Mechanical Properties along the Length of the Aorta in C57bl/6 Mice. Am. J. Physiol. Circ. Physiol. 2003, 285, H2614–H2622. [Google Scholar] [CrossRef]
- Vargas-Vargas, H.; Sáez-Landete, J.; Siegmann, P.; Camacho-Bello, C. Validation of Solid Mechanics Models Using Modern Computation Techniques of Zernike Moments. Mech. Syst. Signal Process. 2022, 173, 109019. [Google Scholar] [CrossRef]
- Larson, M.G.; Bengzon, F. The Finite Element Method: Theory, Implementation, and Applications; Texts in Computational Science and Engineering; Springer: Berlin/Heidelberg, Germany, 2013; Volume 10, ISBN 978-3-642-33286-9. [Google Scholar]
- Zienkiewicz, O.C.; Taylor, R.L.; Zhu, J.Z. The Finite Element Method: Its Basis and Fundamentals; Elsevier: Amsterdam, The Netherlands, 2013; ISBN 9781856176330. [Google Scholar]
- Luczkiewicz, P.; Daszkiewicz, K.; Witkowski, W.; Chróścielewski, J.; Ferenc, T.; Baczkowski, B. The Influence of a Change in the Meniscus Cross-Sectional Shape on the Medio-Lateral Translation of the Knee Joint and Meniscal Extrusion. PLoS ONE 2018, 13, e0193020. [Google Scholar] [CrossRef]
- Nowak, M.; Divo, E.; Adamczyk, W.P. Multiscale Model for Blood Flow after a Bileaflet Artificial Aortic Valve Implantation. Comput. Biol. Med. 2023, 158, 106805. [Google Scholar] [CrossRef]
- Chuong, C.J.; Fung, Y.C. On Residual Stresses in Arteries. J. Biomech. Eng. 1986, 108, 189–192. [Google Scholar] [CrossRef] [PubMed]
- Fung, Y.C.; Fronek, K.; Patitucci, P. Pseudoelasticity of Arteries and the Choice of Its Mathematical Expression. Am. J. Physiol. Circ. Physiol. 1979, 237, H620–H631. [Google Scholar] [CrossRef]
- Holzapfel, G.A.; Gasser, T.C.; Ogden, R.W. A New Constitutive Framework for Arterial Wall Mechanics and a Comparative Study of Material Models. J. Elast. Phys. Sci. Solids 2000, 61, 1–48. [Google Scholar] [CrossRef]
- Gasser, T.C.; Ogden, R.W.; Holzapfel, G.A. Hyperelastic Modelling of Arterial Layers with Distributed Collagen Fibre Orientations. J. R. Soc. Interface 2006, 3, 15–35. [Google Scholar] [CrossRef] [PubMed]
- Abaqus 2019 Documentation; Dassault Systèmes: Providence, RI, USA, 2019.
- Sutton, M.A.; Ke, X.; Lessner, S.M.; Goldbach, M.; Yost, M.; Zhao, F.; Schreier, H.W. Strain Field Measurements on Mouse Carotid Arteries Using Microscopic Three-Dimensional Digital Image Correlation. J. Biomed. Mater. Res. Part A 2008, 84A, 178–190. [Google Scholar] [CrossRef] [PubMed]
- Teter, A.; Kolakowski, Z. On Using Load-Axial Shortening Plots to Determine the Approximate Buckling Load of Short, Real Angle Columns under Compression. Compos. Struct. 2019, 212, 175–183. [Google Scholar] [CrossRef]
- Rozylo, P.; Teter, A.; Debski, H.; Wysmulski, P.; Falkowicz, K. Experimental and Numerical Study of the Buckling of Composite Profiles with Open Cross Section under Axial Compression. Appl. Compos. Mater. 2017, 24, 1251–1264. [Google Scholar] [CrossRef]
- Sun, W.; Sacks, M.S. Finite Element Implementation of a Generalized Fung-Elastic Constitutive Model for Planar Soft Tissues. Biomech. Model. Mechanobiol. 2005, 4, 190–199. [Google Scholar] [CrossRef] [PubMed]
- Bhat, S.K.; Yamada, H. Mechanical Characterization of Dissected and Dilated Human Ascending Aorta Using Fung-Type Hyperelastic Models with Pre-Identified Initial Tangent Moduli for Low-Stress Distensibility. J. Mech. Behav. Biomed. Mater. 2022, 125, 104959. [Google Scholar] [CrossRef] [PubMed]
- Rivera, C.P.; Li, L.; Cai, S.; Pei, N.; McAlear, G.E.; Bollavaram, K.; Ariyo, O.V.; Omojola, V.O.; Song, H.; Alfonso, A.L.; et al. Age-Dependent Characterization of Carotid and Cerebral Artery Geometries in a Transgenic Mouse Model of Sickle Cell Anemia Using Ultrasound and Microcomputed Tomography. Blood Cells Mol. Dis. 2020, 85, 102486. [Google Scholar] [CrossRef]
- Chan, J.M.; Park, S.-J.; Ng, M.; Chen, W.C.; Garnell, J.; Bhakoo, K. Predictive Mouse Model Reflects Distinct Stages of Human Atheroma in a Single Carotid Artery. Transl. Res. 2022, 240, 33–49. [Google Scholar] [CrossRef]
- Das Neves Borges, P.; Forte, A.E.; Vincent, T.L.; Dini, D.; Marenzana, M. Rapid, Automated Imaging of Mouse Articular Cartilage by MicroCT for Early Detection of Osteoarthritis and Finite Element Modelling of Joint Mechanics. Osteoarthr. Cartil. 2014, 22, 1419–1428. [Google Scholar] [CrossRef]
- Niestrawska, J.A.; Spronck, B.; Cavinato, C.; Humphrey, J.D. Tempol Improves Aortic Mechanics in a Mouse Model of Hypertension. J. Biomech. 2024, 162, 111911. [Google Scholar] [CrossRef] [PubMed]
- Riou, L.M.; Broisat, A.; Ghezzi, C.; Finet, G.; Rioufol, G.; Gharib, A.M.; Pettigrew, R.I.; Ohayon, J. Effects of Mechanical Properties and Atherosclerotic Artery Size on Biomechanical Plaque Disruption—Mouse vs. Human. J. Biomech. 2014, 47, 765–772. [Google Scholar] [CrossRef] [PubMed]
- Saba, L.; Sanfilippo, R.; Suri, J.S.; Cademartiri, F.; Corrias, G.; Mannelli, L.; Zucca, S.; Senis, I.; Montisci, R.; Wintermark, M. Does Carotid Artery Tortuosity Play a Role in Stroke? Can. Assoc. Radiol. J. 2021, 72, 789–796. [Google Scholar] [CrossRef] [PubMed]
Figure 1.
Carotid artery of a CB57BL/6 mouse: (a) extracted from the animal (a glass pipe with a diameter of 1.2 mm is shown on the left as a reference); (b) attached to the DMT myograph cannulas by knots (unloaded state) with the testing length shown; (c) typical buckling deformation observed in the tests.

Figure 2.
Computational domain: (a) the 1st model, representing 1/8 of the artery; (b) the 2nd model, representing 1/2 of the artery with geometrical imperfection in the form of additional curvature with a sagitta of 5% of the artery diameter, which is marked with red color.
Figure 2.
Computational domain: (a) the 1st model, representing 1/8 of the artery; (b) the 2nd model, representing 1/2 of the artery with geometrical imperfection in the form of additional curvature with a sagitta of 5% of the artery diameter, which is marked with red color.

Figure 3.
The relation between the internal pressure (pint) and the carotid artery outer diameter (Dout) calculated using the Fung law constants defined following [23] and experimental results from [23] for (a) wild-type; (b) sgcd−/−; and (c) mdx mice.


Figure 4.
The relation between the internal pressure (pint) and the carotid artery outer diameter (Dout) calculated using the Fung law constants defined following [19] and experimental results from [19] for (a) Eln+/−; (b) Eln+/+; (c) Fbln5−/−; and (d) Fbln5+/+ mice.
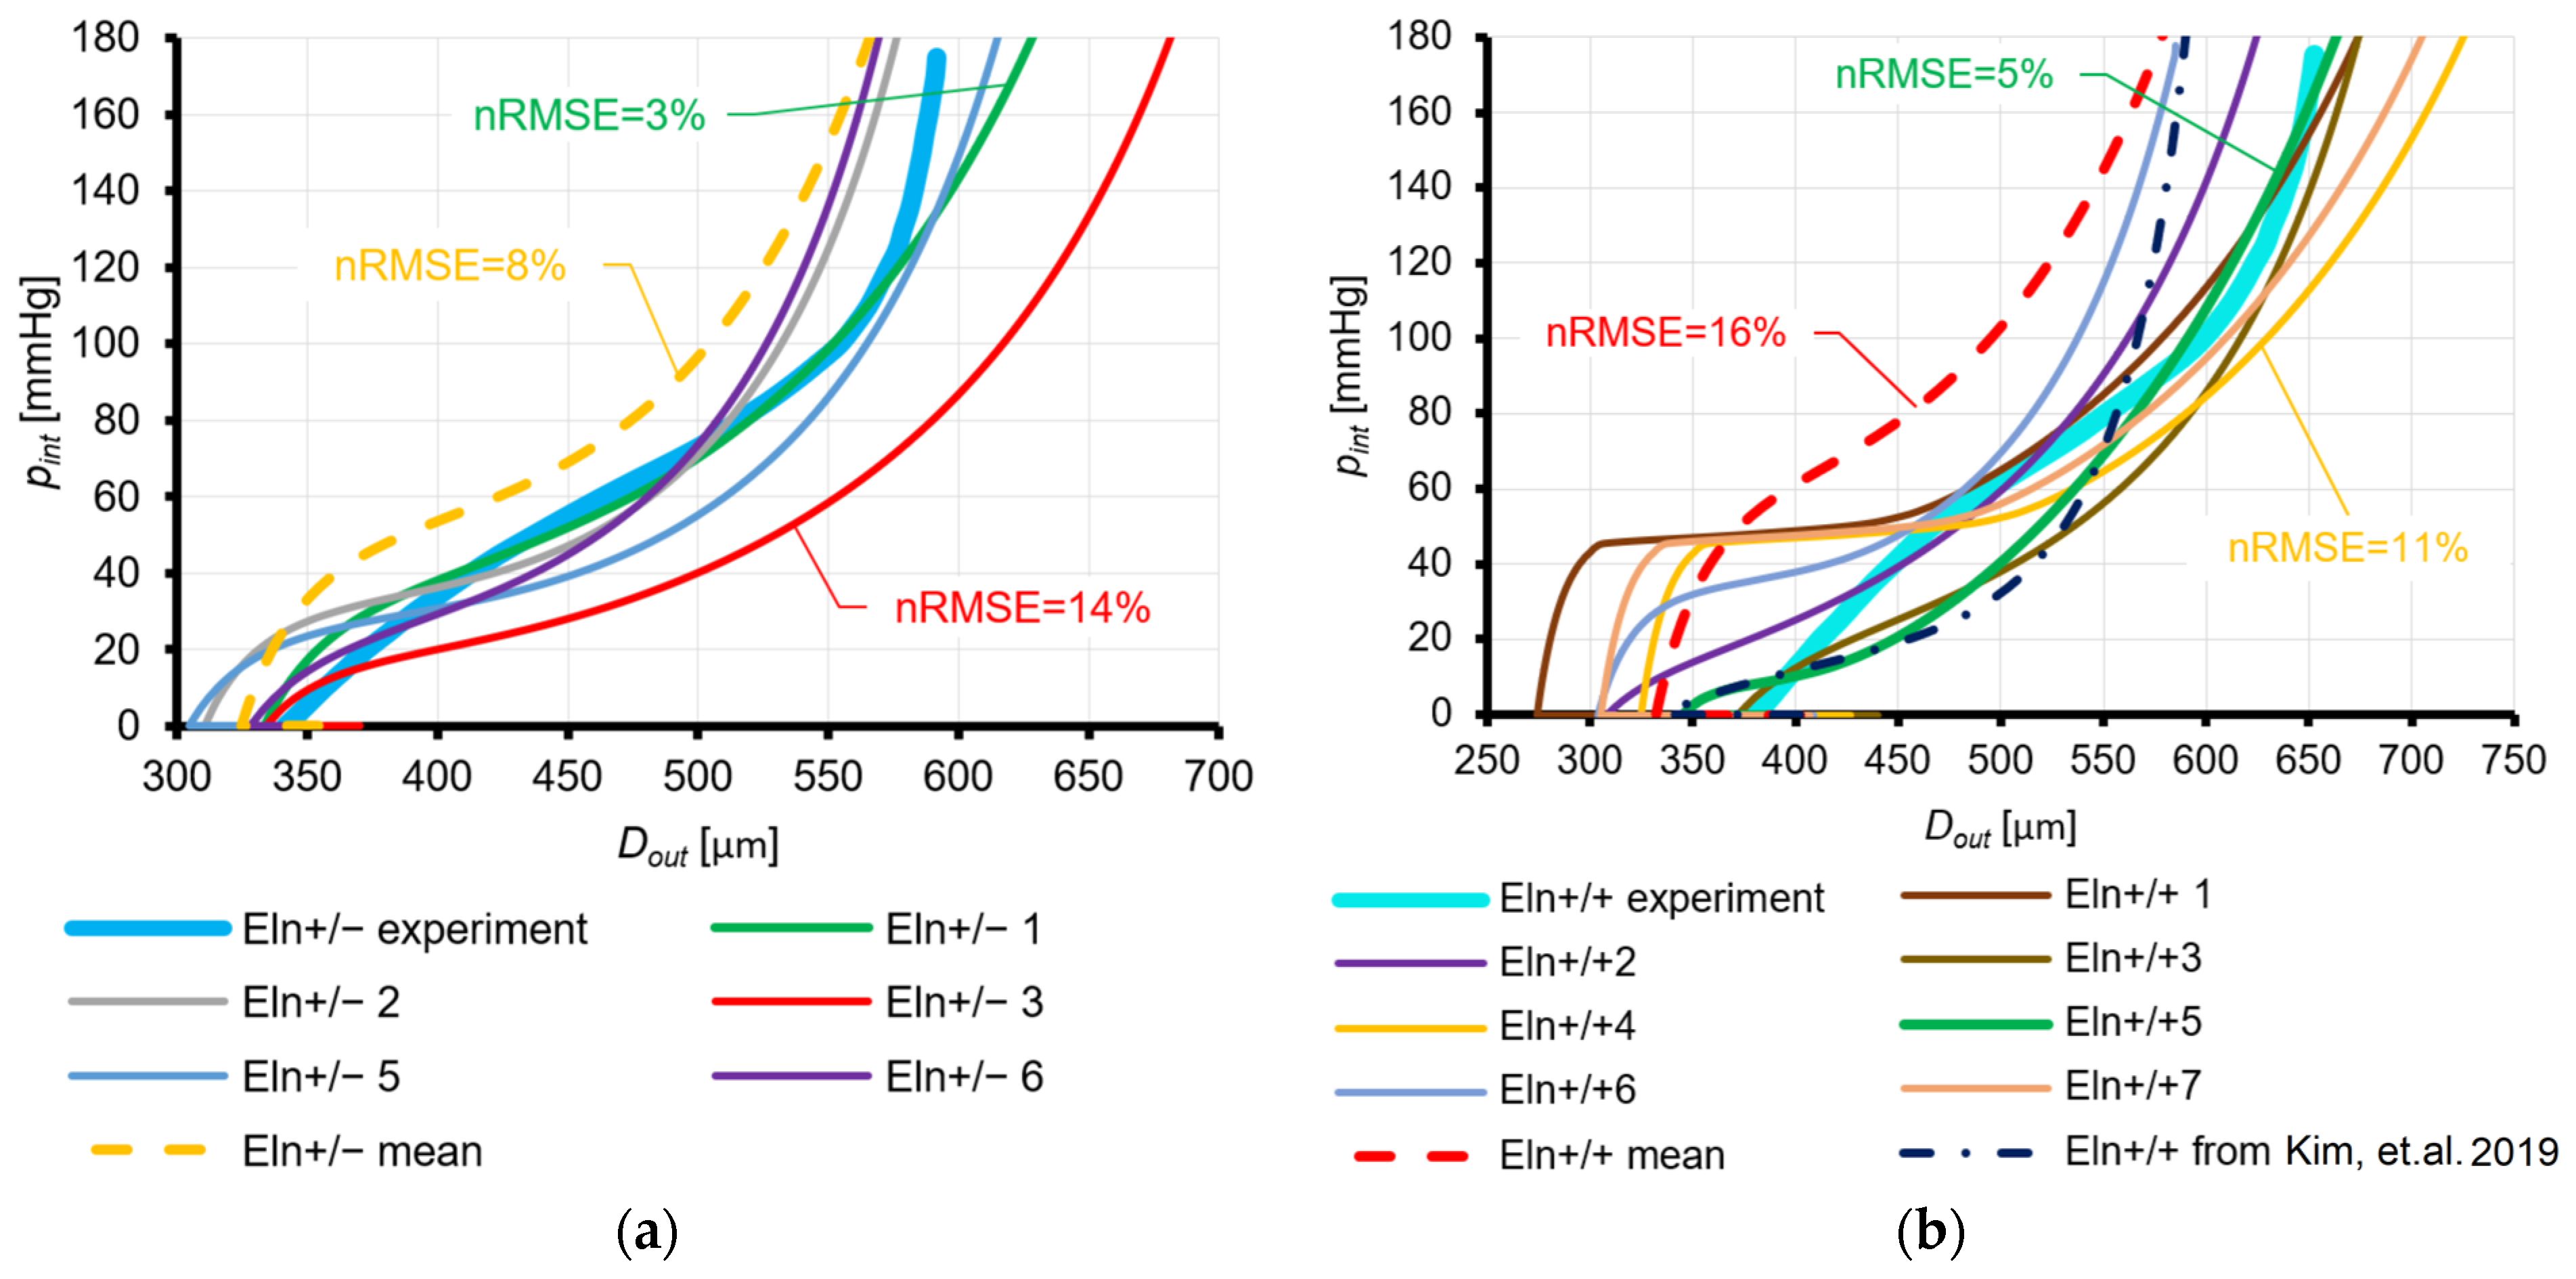
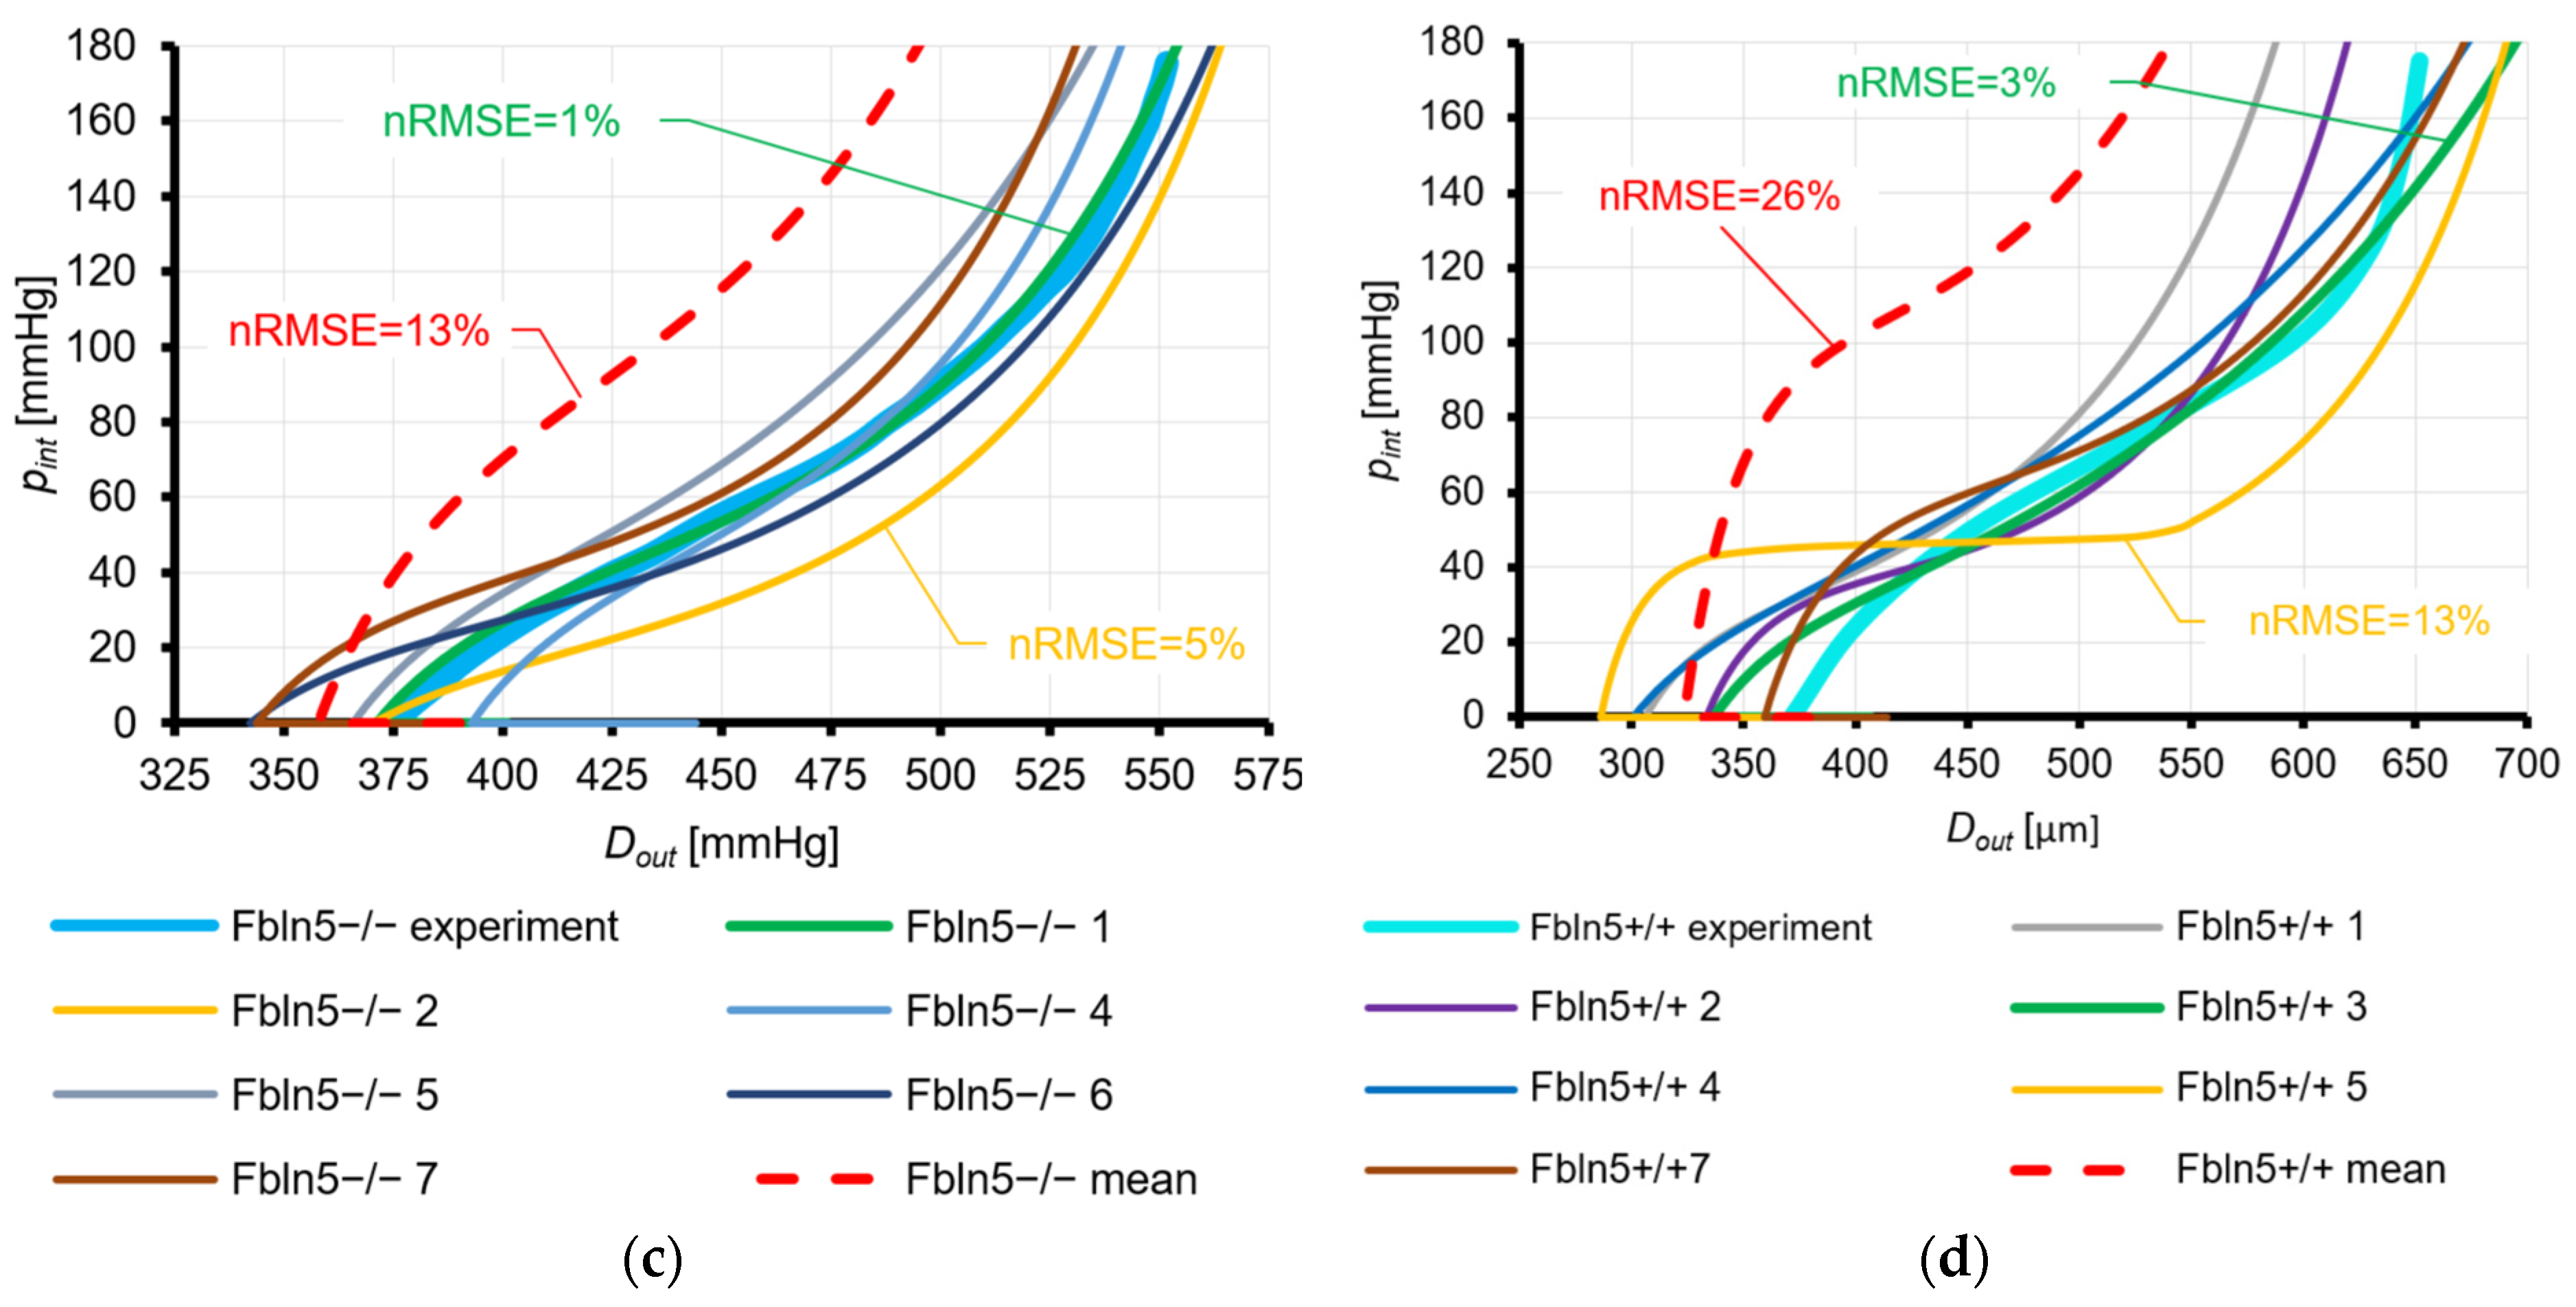
Figure 5.
The relation between the internal pressure (pint) and the carotid artery outer diameter (Dout): (a) the Eln+/+ mice experimental reference [19] and FEM estimations for the proposed Holzapfel constitutive relation constants sets “A” and “B”; (b) the Fbln5−/− mice experimental reference [19] and FEM estimations for the proposed Holzapfel constitutive relation constants sets “C” and “D”.
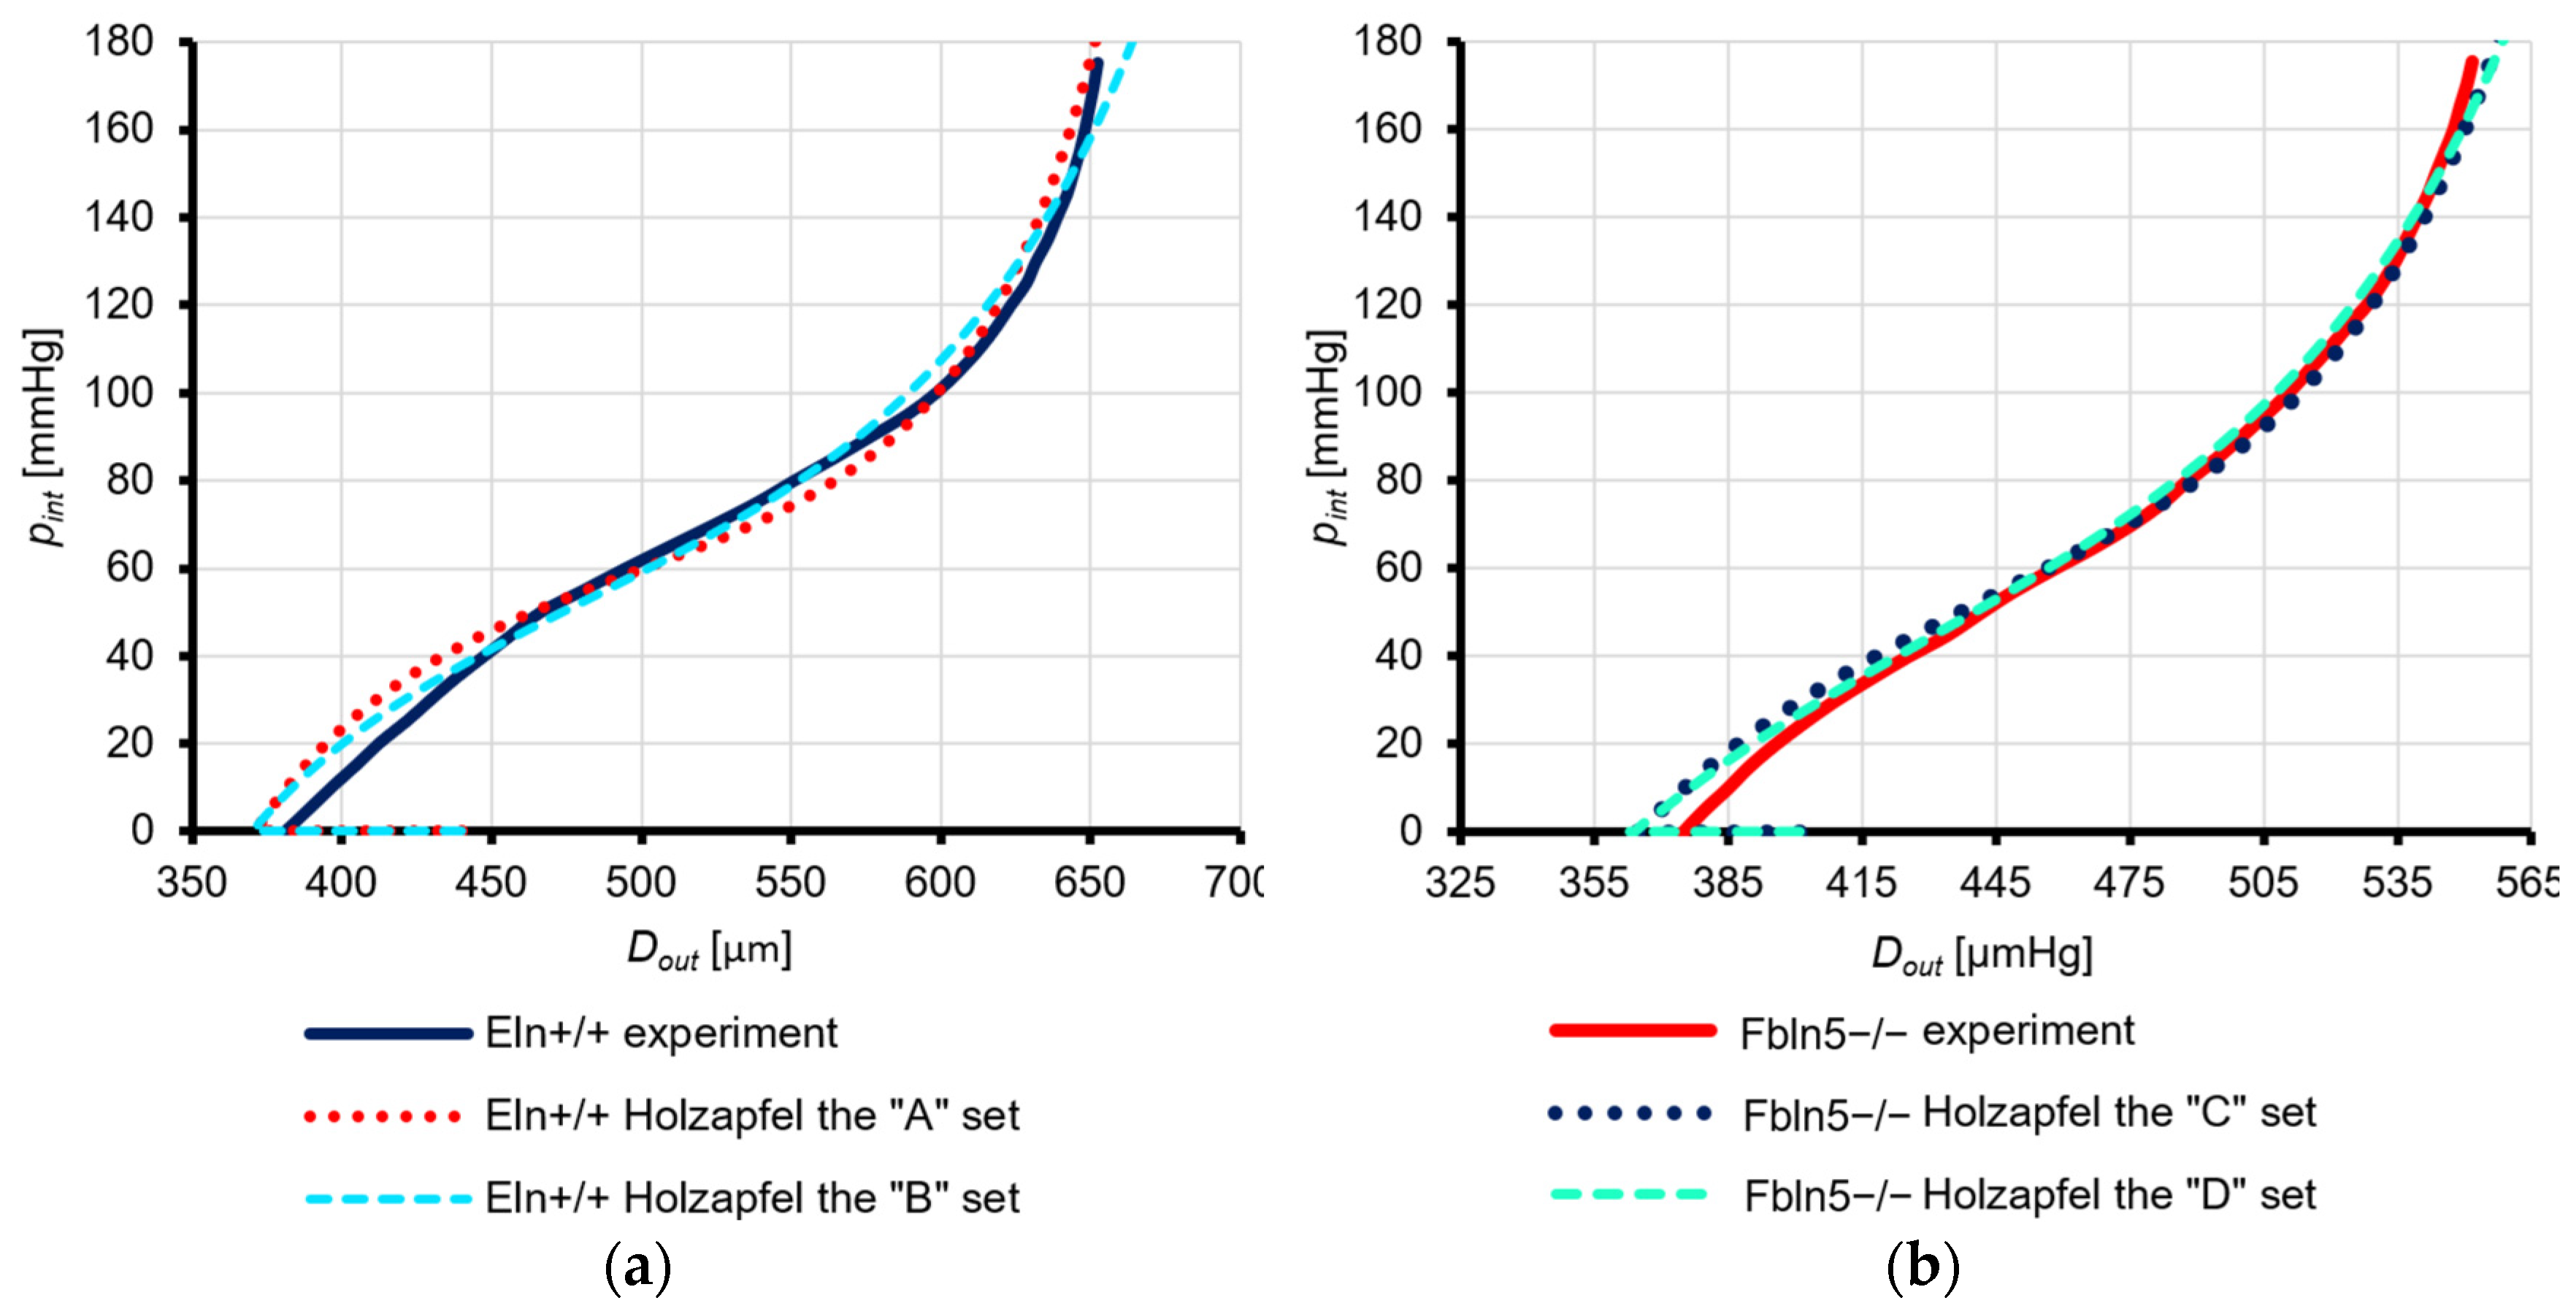
Figure 6.
The relation between the internal pressure (pint) and the horizontal displacement of the carotid artery (uA) for the Fung and the Holzapfel material laws and for different stretches: (a) Eln+/+ mouse model; (b) Fbln5−/− mouse model.
Figure 6.
The relation between the internal pressure (pint) and the horizontal displacement of the carotid artery (uA) for the Fung and the Holzapfel material laws and for different stretches: (a) Eln+/+ mouse model; (b) Fbln5−/− mouse model.
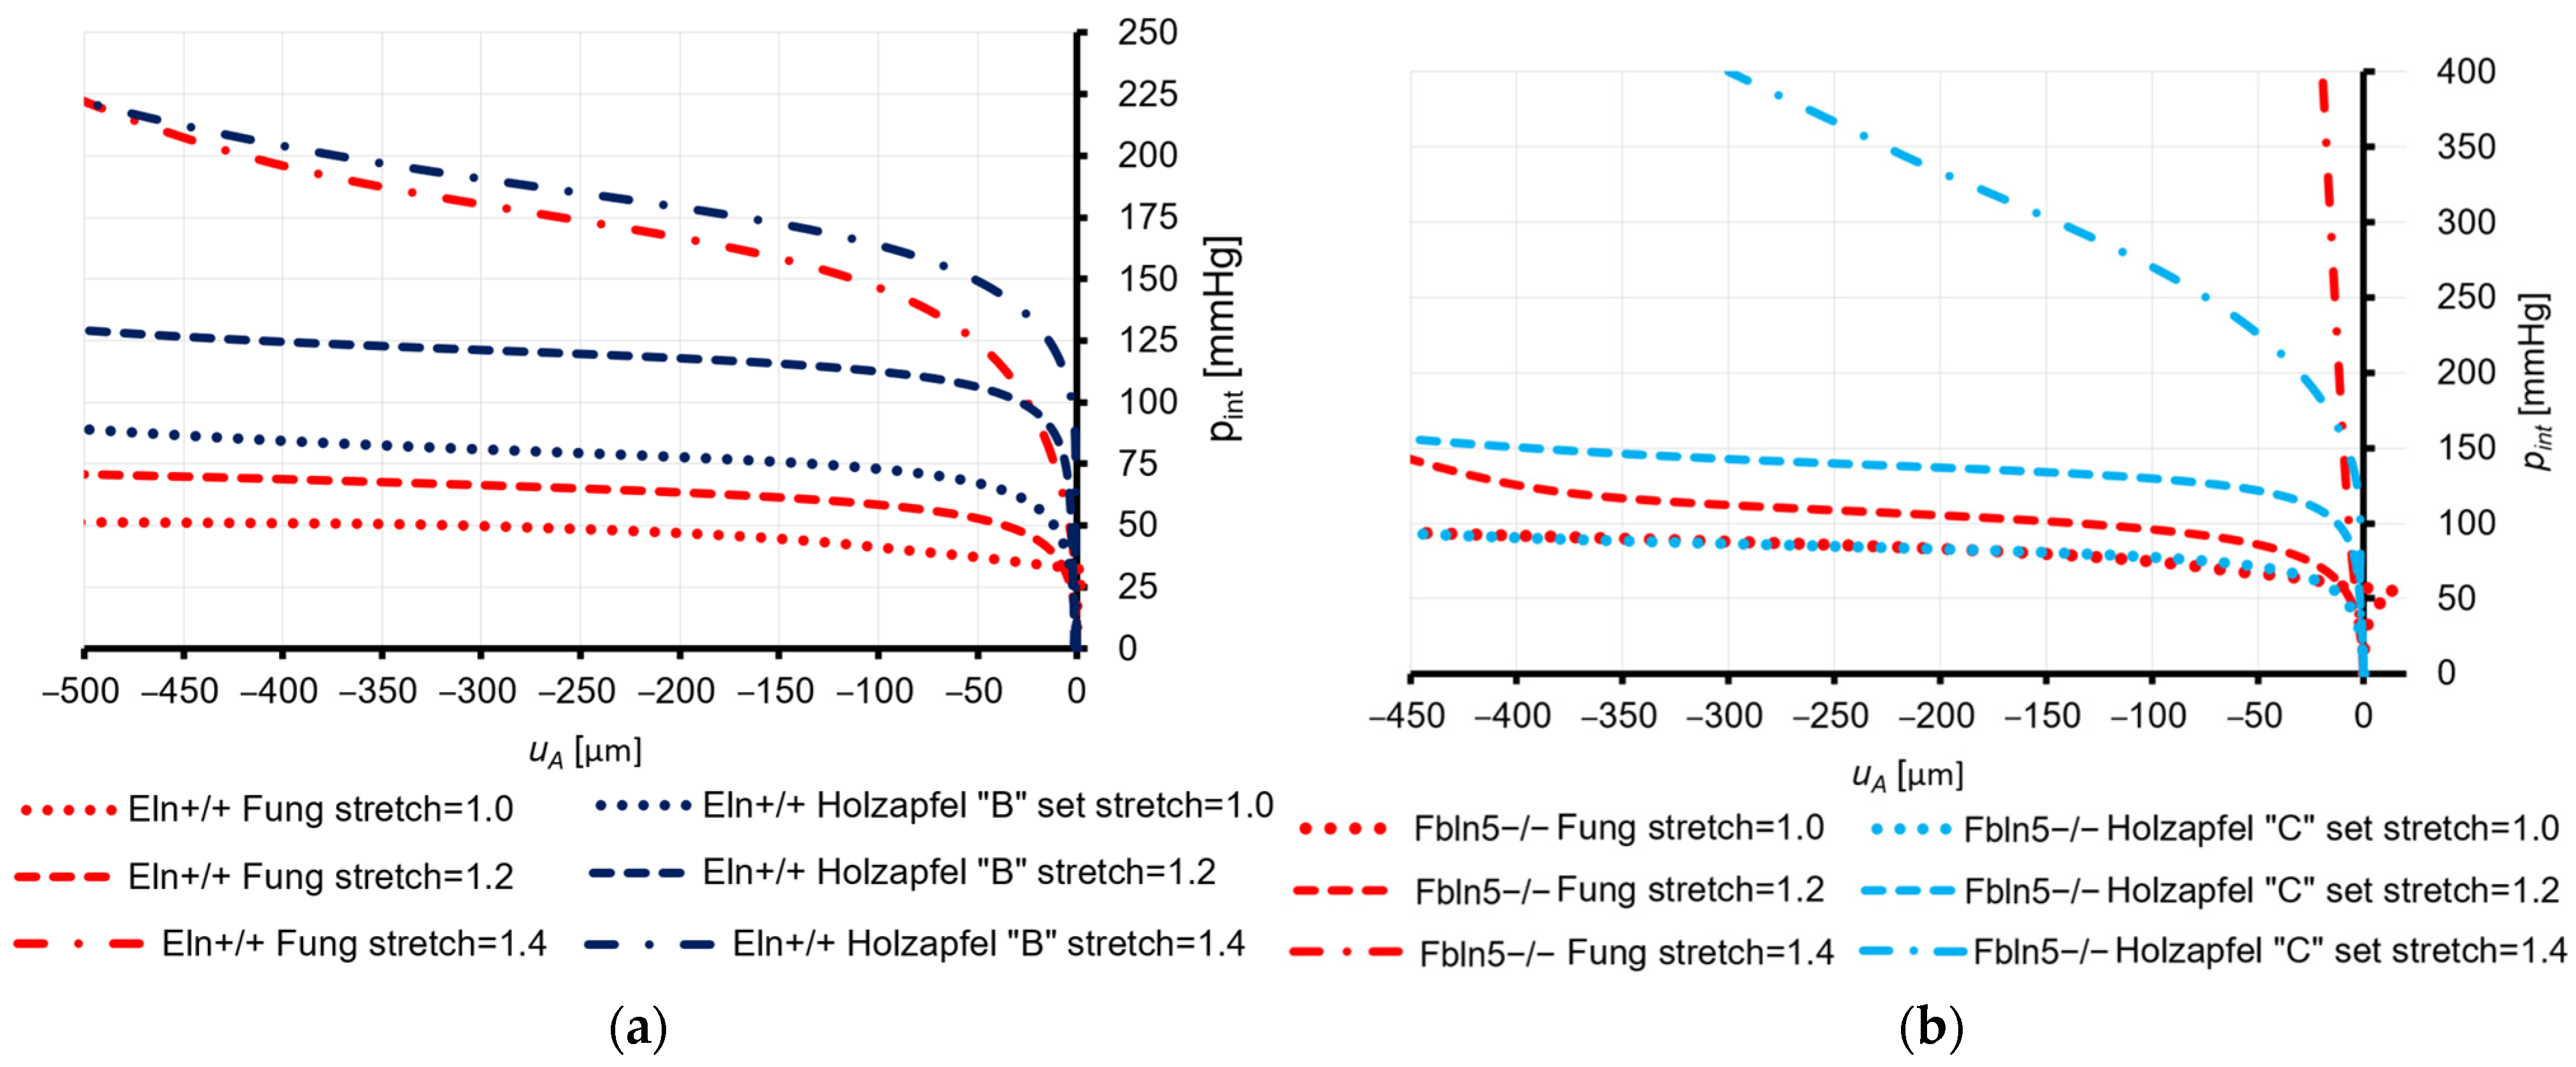
Figure 7.
Buckling of the mouse artery: (a) predicted in the FEM analysis of Eln+/+ mice, for λz = 1.2, using the Holzapfel constants set “B”, at the moment when uA = Dout/2; (b) predicted in the FEM analysis of Eln+/+ mice, for λz = 1.0, using the Fung law constants set, at the moment when uA = Dout/2; (c) local buckling predicted in the FEM analysis of Eln+/+ mice, for λz = 1.0, using the Fung law constants set, deformations are scaled 4×; (d) three half-wave deformation pattern observed in tests carried out on CB57BL/6 mice.

Table 1.
Geometrical parameters of arteries reported in the reference articles.
| Reference Paper | Mouse Model | Outer Carotid Diameter [μm] | Carotid Wall Thickness [μm] | Inner to Outer Diameter Ratio |
|---|---|---|---|---|
| [19] | Eln+/+ | 402 | 58.5 | 0.71 |
| Eln+/− | 354 | 55 | 0.69 | |
| Fbln5+/+ | 379 | 59 | 0.69 | |
| Fbln5−/− | 390 | 57 | 0.71 | |
| [22] | unknown | 343 | 71.2 | 0.58 |
| [23] | wild-type | 424 | 63.3 | 0.70 |
| mdx | 432 | 63.6 | 0.71 | |
| sgcd−/− | 416 | 62.9 | 0.70 |
Table 2.
Comparison of the buckling pressures for the Eln+/+ mice determined experimentally by [19] and in FEM calculations.
Table 2.
Comparison of the buckling pressures for the Eln+/+ mice determined experimentally by [19] and in FEM calculations.
| Stretch | Experiment from [19] | FEM Predictions | |||||
|---|---|---|---|---|---|---|---|
| Analysis of the Post-Buckling Response | The Pressure at uA = Dout/2 | ||||||
| Fung Constants from [19] | Holzapfel, Set “B” | Fung Constants from [19] | Holzapfel, Set “B” | ||||
| λz | pexp [mmHg] | pbuck,FEM [mmHg] | pbuck,FEM [mmHg] | puA,FEM [mmHg] | Relative Error [%] | puA,FEM [mmHg] | Relative Error [%] |
| 1.0 | 67 | 40 | 71 | 47 | 29.9 | 77 | 14.9 |
| 1.2 | 111 | 61 | 107 | 64 | 42.3 | 118 | 6.3 |
| 1.4 | 180 | 142 | 152 | 168 | 6.7 | 181 | 0.6 |
Table 3.
Comparison of the buckling pressures for the Fbln5−/− mice determined experimentally by [19] and in FEM calculations.
Table 3.
Comparison of the buckling pressures for the Fbln5−/− mice determined experimentally by [19] and in FEM calculations.
| Stretch | Experiment from [19] | FEM Predictions | |||||
|---|---|---|---|---|---|---|---|
| Analysis of the Post-Buckling Response | The Pressure at uA = Dout/2 | ||||||
| Fung Constants from [19] | Holzapfel, Set “B” | Fung Constants from [19] | Holzapfel, Set “B” | ||||
| λz | pexp [mmHg] | pbuck,FEM [mmHg] | pbuck,FEM [mmHg] | puA,FEM [mmHg] | Relative Error [%] | puA,FEM [mmHg] | Relative Error [%] |
| 1.0 | 58 | 52 | 81 | 83 | 43.1 | 82 | 41.4 |
| 1.2 | 115 | 135 | 135 | 105 | 8.7 | 136 | 18.3 |
| 1.4 | 227 * | >400 | 205 | >400 | >100 | 330 | 45.4 |
* pexp was determined in [19] by linear extrapolation of results for lower stretch ratios.
Table 4.
New sets of the Holzapfel law constants for the Eln+/+ and Fbln5−/− mice.
| Carotid Artery Type | Set | C10 [kPa] | k1 [kPa] | k2 [kPa] | γmedia [°] | γadventitia [°] |
|---|---|---|---|---|---|---|
| Eln+/+ | A | 19 | 3 | 0.53 | 30 | 75 |
| B | 12 | 10 | 0.23 | 30 | 75 | |
| Fbln5−/− | C | 15 | 8 | 0.7 | 30 | 75 |
| D | 10 | 15 | 0.42 | 30 | 75 |
Disclaimer/Publisher’s Note: The statements, opinions and data contained in all publications are solely those of the individual author(s) and contributor(s) and not of MDPI and/or the editor(s). MDPI and/or the editor(s) disclaim responsibility for any injury to people or property resulting from any ideas, methods, instructions or products referred to in the content. |
© 2024 by the authors. Licensee MDPI, Basel, Switzerland. This article is an open access article distributed under the terms and conditions of the Creative Commons Attribution (CC BY) license (https://creativecommons.org/licenses/by/4.0/).
Share and Cite
MDPI and ACS Style
Sobczyk, B.; Chróścielewski, J.; Wilde, K. Numerical Analysis of Mice Carotid Arteries’ Response Emphasizing the Importance of Material Law Constants’ Validation. Appl. Sci. 2024, 14, 3571. https://doi.org/10.3390/app14093571
AMA Style
Sobczyk B, Chróścielewski J, Wilde K. Numerical Analysis of Mice Carotid Arteries’ Response Emphasizing the Importance of Material Law Constants’ Validation. Applied Sciences. 2024; 14(9):3571. https://doi.org/10.3390/app14093571
Chicago/Turabian StyleSobczyk, Bartosz, Jacek Chróścielewski, and Krzysztof Wilde. 2024. "Numerical Analysis of Mice Carotid Arteries’ Response Emphasizing the Importance of Material Law Constants’ Validation" Applied Sciences 14, no. 9: 3571. https://doi.org/10.3390/app14093571
Note that from the first issue of 2016, this journal uses article numbers instead of page numbers. See further details here.