

Remote Sensing and Machine Learning for Safer Railways: A Review


Transportation, Logistics, & Finance, College of Business, North Dakota State University, P.O. Box 6050, Fargo, ND 58108-6050, USA
*
Author to whom correspondence should be addressed.
Appl. Sci. 2024, 14(9), 3573; https://doi.org/10.3390/app14093573
Submission received: 20 March 2024
/
Revised: 19 April 2024
/
Accepted: 22 April 2024
/
Published: 24 April 2024
(This article belongs to the Special Issue Application of New Technology and New Ideas in Intelligent Transportation System)
Abstract
:Regular railway inspections are crucial for maintaining their safety and efficiency. However, traditional inspection methods are complex and expensive. Consequently, there has been a significant shift toward combining remote sensing (RS) and machine learning (ML) techniques to enhance the efficiency and accuracy of railway defect monitoring while reducing costs. The advantages of RS-ML techniques include their ability to automate and refine inspection processes and address challenges such as image quality and methodological limitations. However, the integration of RS and ML in railway monitoring is an emerging field, with diverse methodologies and outcomes that the research has not yet synthesized. To fill this gap, this study conducted a systematic literature review (SLR) to consolidate the existing research on RS-ML applications in railway inspection. The SLR meticulously compiled and analyzed relevant studies, evaluating the evolution of research trends, methodological approaches, and the geographic distribution of contributions. The findings showed a notable increase in relevant research activity over the last five years, highlighting the growing interest in this realm. The key methodological patterns emphasize the predominance of approaches based on convolutional neural networks, a variant of artificial neural networks, in achieving high levels of precision. These findings serve as a foundational resource for academics, researchers, and practitioners in the fields of computer science, engineering, and transportation to help guide future research directions and foster the development of more efficient, accurate, and cost-effective railway inspection methods.
1. Introduction
The condition assessment of vast linear transportation structures like roads and railways pose challenges due to the associated costs and time requirements. However, regularly monitoring these structures is necessary for ensuring the safety, efficiency, and reliability of the supply chains that depend on them. Conventional methods of condition monitoring focus on human observation and historical incident data analysis. However, in recent years, remote sensing (RS) has gained prominence, especially in the realm of rail defect detection. RS involves capturing data about an object without direct contact, offering an effective approach for enhancing inspection and maintenance without disrupting operations [1].
The recent literature in RS of transportation infrastructure has explored various techniques, including the spectral image differencing procedure (SIDP) [2], linear charge-coupled devices (CCDs) [3], 3D laser cameras [4], LiDAR [5], multi-temporal interferometric synthetic aperture radar (MT-InSAR) [6], and drone-based monitoring [7]. With advancements in machine learning (ML), organizations can now process and analyze captured data more accurately and promptly [8]. Hence, the combination of RS and ML techniques promise to revolutionize railway condition monitoring. ML is a branch of artificial intelligence (AI) that enable computers to learn from data without explicit programming [9]. Greater volumes of training data enhance ML efficacy. Moreover, the data analyzed for ML applications can manifest in diverse forms, including texts and captured images.
While the literature has addressed numerous methods for rail inspection, there is a notable gap in comprehensive literature reviews specifically examining the convergence of RS and ML methods in this realm. This study aimed to fill that void by conducting a systematic literature review (SLR) on rail infrastructure monitoring that integrates RS and ML techniques. The SLR analyzed the employed methods, results, and challenges addressed and provided a descriptive analysis of pertinent publications. The review scrutinized technical aspects such as the model architecture, accuracy, datasets, and learning rates of the ML algorithms. The study consolidated and unveiled relationships between these varied studies, comparing different approaches, providing topic classifications, and presenting distribution maps by year, journal, and country, thereby paving the way for future research directions.
The research questions associated with the SLR were as follows:
- What is the current state of the art that combines RS and ML methods to monitor the condition of the railways?
- What are the advantages and disadvantages of these methods, and how will they benefit future researchers?
- What are the different applications of these methods in railway monitoring?
This SLR serves as an effective tool to map, evaluate, and summarize the disparate literature, thus enhancing conceptual development within the field. The structure of the remaining publication is as follows: Section 2 presents the SLR method, which followed the PRISMA guidelines [10]. Section 3 presents a descriptive analysis of the review. Section 4 discusses the results. Section 5 concludes the review and offers insights for future research directions.
2. Research Method
The choice of the SLR method for this study stemmed from its rigorous and structured approach [10], which is essential for synthesizing the existing literature in a field as complex and varied as railway infrastructure monitoring using RS and ML technologies. SLRs are particularly suited for areas with diverse methodologies and findings, as they provide a comprehensive overview of the state of the research and can identify gaps and suggest areas for future investigation. This method ensures a transparent, reproducible research process, enhancing the credibility and reliability of the findings by minimizing bias through predefined inclusion and exclusion criteria. Central to the SLR methodology, the authors implemented several steps to thoroughly examine the relevant literature by formulating the review questions, searching for publications, evaluating and refining the publications selected, analyzing and synthesizing the findings, and reporting the outcomes.
Following the establishment of the main objective, the authors formulated the final research questions as outlined in the introduction section. The publication search phase used specific inclusion and exclusion criteria. Initially, the search examined general publications related to RS, transportation infrastructure, and ML, in addition to SLR publications on other topics. After reviewing the initial set of publications, the authors narrowed the search to focus solely on publications relating to both RS and ML in the context of rail infrastructure. The inclusion criteria were peer-reviewed journal publications encompassing all three aspects—RS, ML, and railway infrastructure inspection. That is, the authors excluded any publication that lacked all three elements.
The initial search utilized Google Scholar for its strength in locating academic literature from multiple databases, including Scopus, IEEE, and Web of Science. The search encompassed entering the specific phrases shown in Table 1. The number of records initially identified was 2151, but further screening of the titles and abstracts yielded 42 publications, as summarized in Table 1. Further scrutiny of each publication yielded 10 relevant publications after excluding 32, of which, 29 did not fit the topic scope and 3 were not from journals.
Subsequently, the authors applied the snowball technique to explore the cited works of the 10 relevant publications, which uncovered an additional 113 relevant publications. Careful examination of these included adding short summaries or review points gleaned from each. The authors then established a table to catalog all the methods used, including the main features of their methods, as discussed later in the results section. This scrutiny removed 68 publications from the 113, resulting in 45 that were relevant. Of the excluded publications, 28 were out of scope, 2 were duplicates, 5 lacked ML content, 12 did not focus on railway infrastructure, and 21 were not journal publications. The 10 initial publications selected plus the 45 screened from the snowball procedure resulted in a final tally of 55 relevant publications for further analysis.
3. Descriptive Analysis
The subsections that follow discuss the citation relationship network of the relevant publications and provide their distribution by year, journal, author country, and method.
3.1. Literature Network
This literature review aimed to acquire insights into the existing scholarly works. The authors discovered a cluster of interconnected research that formed a cohesive body of related works within the realm of RS-ML railway inspection. Figure 1 illustrates this relationship by using the 2024 version of an online tool called Litmaps [11].
The connecting lines trace the citations in the selected body of literature. The horizontal axis represents the publication date. Hence, lines leading from the left of an article connect to its references. The vertical axis encodes the number of citations, with larger circles representing a higher number of citations. The clustering of most publications suggests a close interrelation, indicating shared concepts and common methodologies within the field. However, certain publications, such as [12,13,14], stand out as outliers because of their more distant or divergent research focus compared with the closely connected majority.
The network diagram helps to visualize the interconnections and thematic concentrations within the existing research. This type of mapping facilitates the identification of key research clusters and outlier studies, illustrating how different methodologies and findings relate to one another. It also helps to pinpoint influential studies and emerging trends to provide a clearer picture of the research landscape. Furthermore, this visualization helps to enhance our understanding of how the field evolved by illustrating how newer methodologies built upon or diverged from established practices. These insights can help to inform future research directions and potential areas for innovation.
3.2. Distribution by Year
Figure 2 illustrates the chronological order of the reviewed publications. Most publications appeared recently, from 2017 onward. Notably, 2021 and 2022 accounted for 27% and 25% of the publications, respectively. In 2019 and 2018, there were eight and four publications, respectively. There was only one relevant publication per year from 2010 to 2016. This pattern suggests that the combined use of RS and ML in railway condition monitoring is at the forefront of current research. Traditional ML algorithms such as support vector machines (SVMs), logistic regression, naïve Bayes, random forest, and gradient boosting gave way to deep learning architectures that utilize large multi-layer artificial neural networks (ANNs), including variants like convolution neural networks (CNNs) that researchers optimized for machine vision [15].
3.3. Distribution by Journal
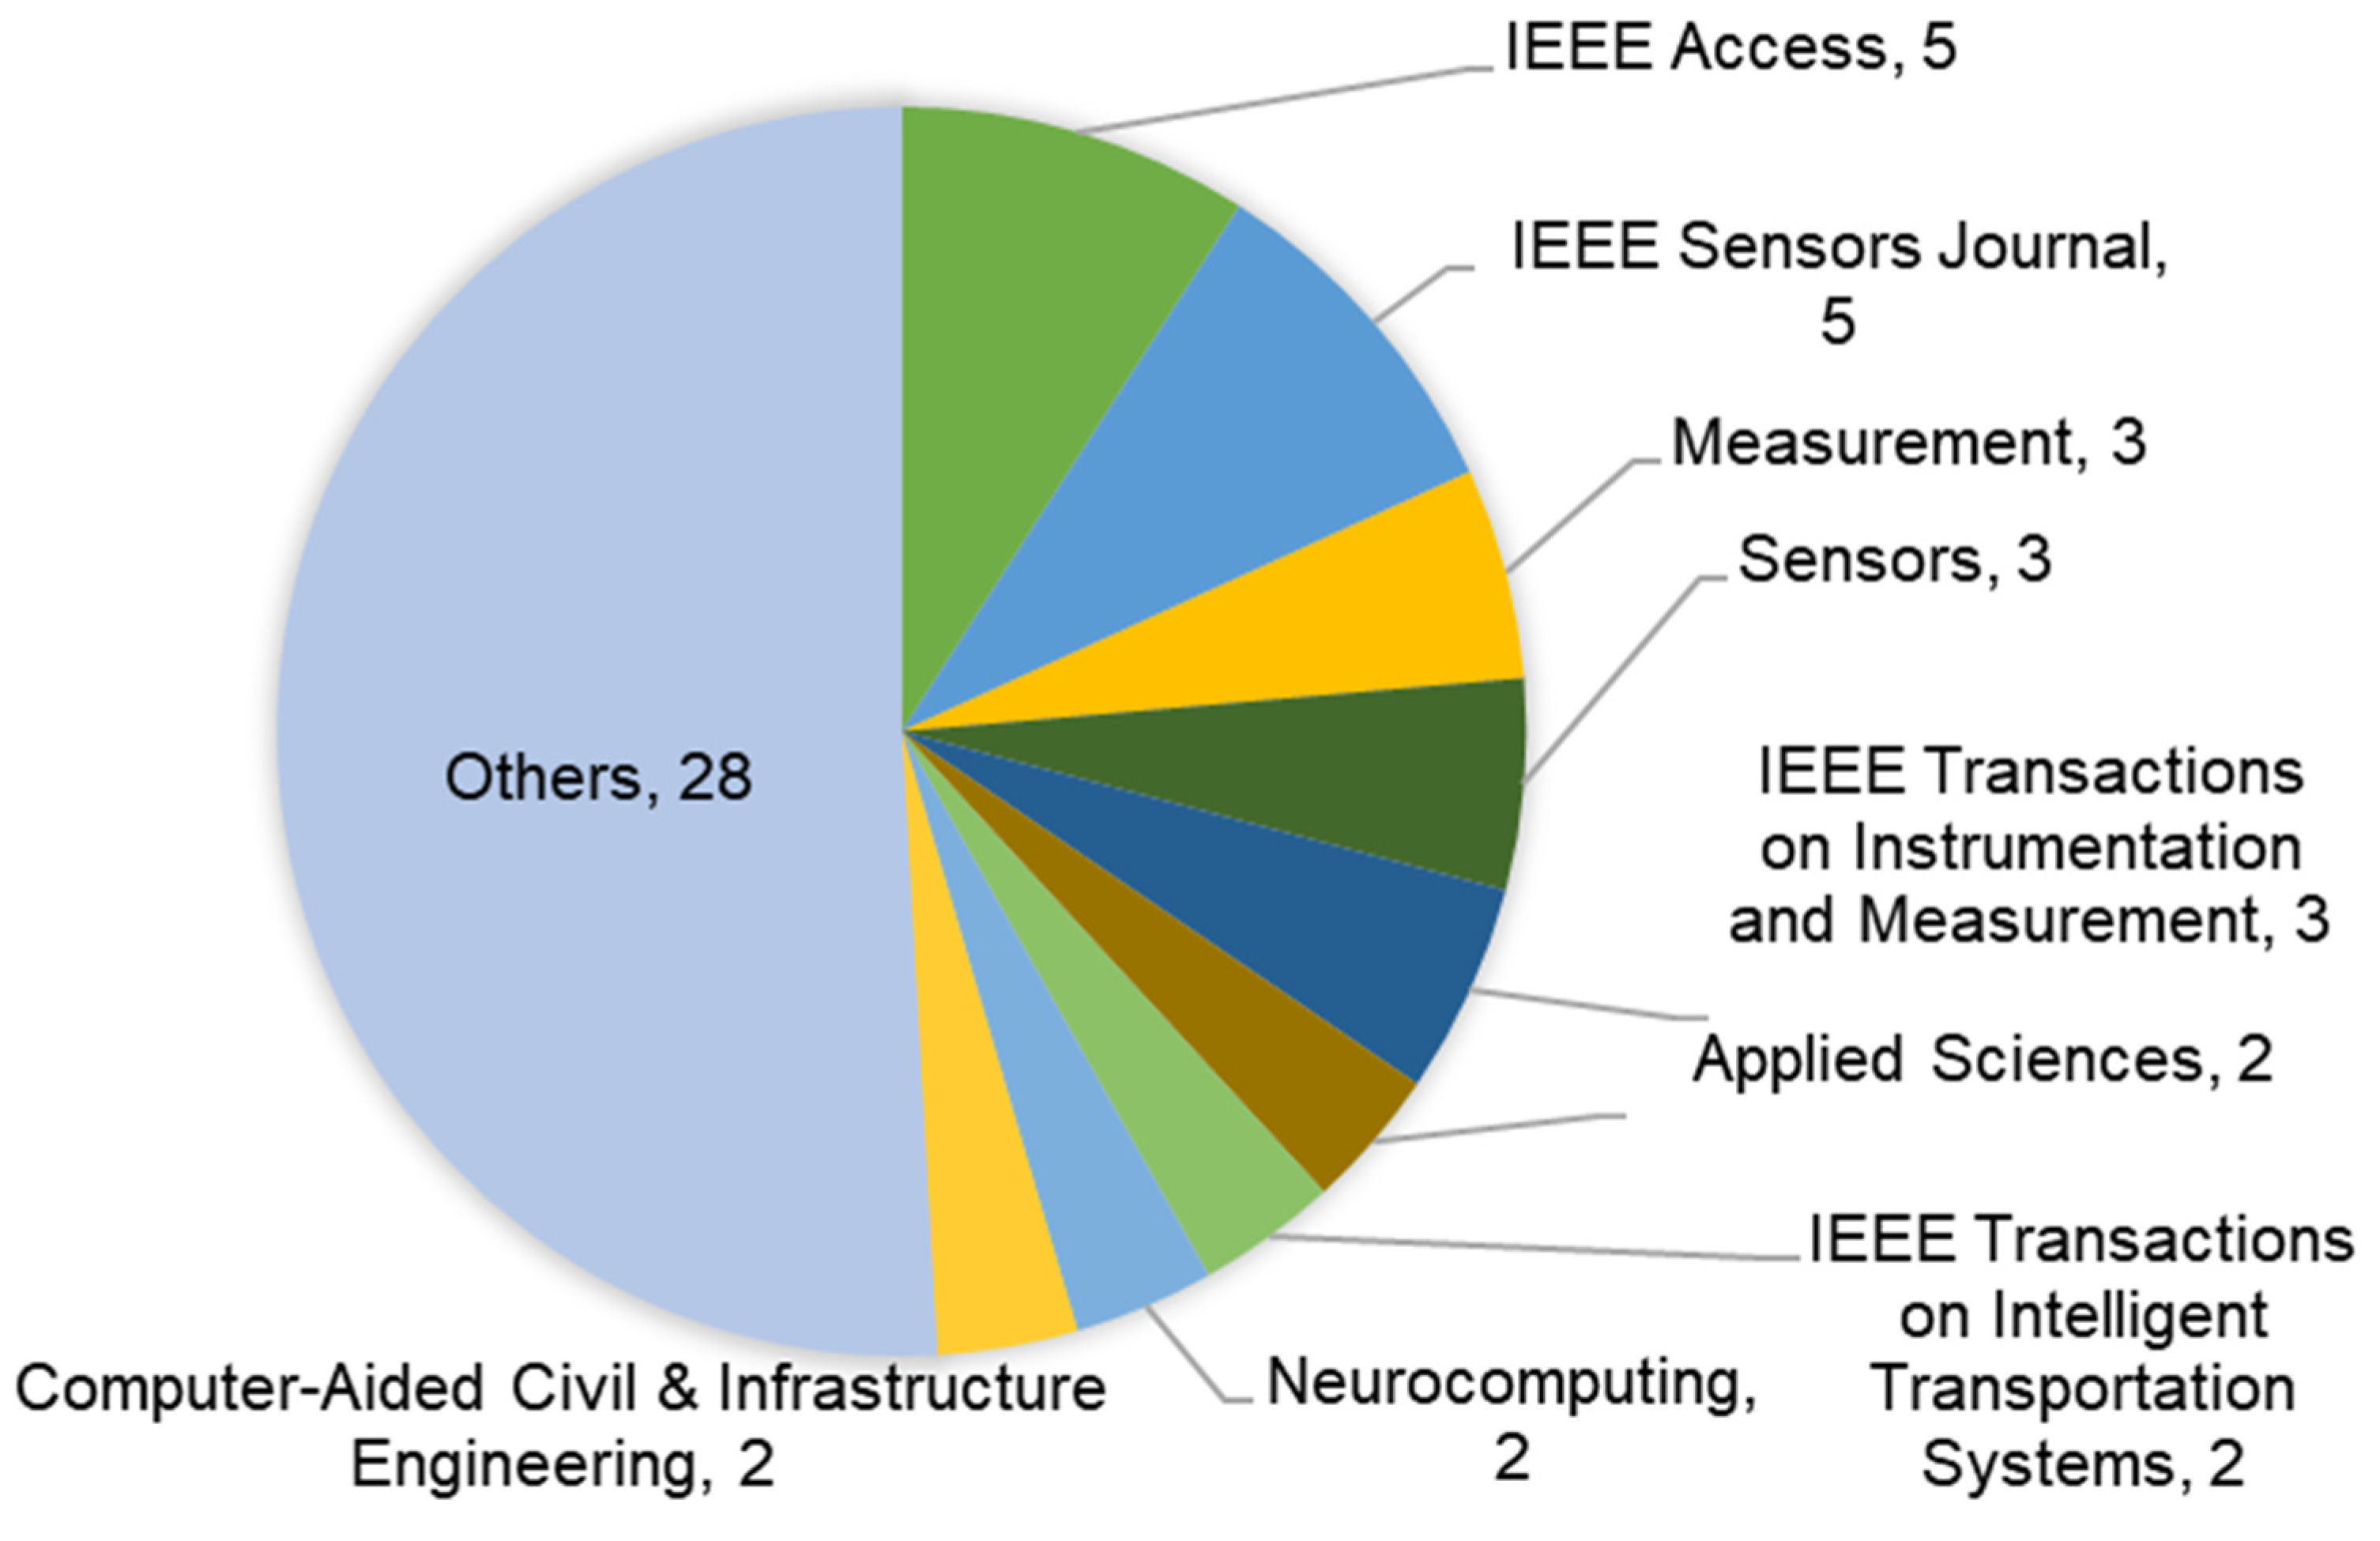
Figure 3 provides a distribution view of the relevant publications across various journals. The set of 55 reviewed publications were distributed across 40 different journals.
IEEE Access and IEEE Sensors Journal contained most of the reviewed publications, with five appearing in each. Following closely were the journals Measurement and Sensors, each containing three of the reviewed publications. Additionally, Applied Sciences, IEEE Transactions on Intelligent Transportation Systems, and Neurocomputing each contained two of the reviewed publications. The remaining journals, collectively labeled “Others”, contained one of the reviewed publications each. In summary, the diverse array of journals approached the topic from various perspectives, including computer science, engineering, and transportation.
3.4. Distribution by Author Country
Figure 4 shows the country of origin for the authors of the reviewed publications. To create this figure, the review identified the country of every author, based on their affiliations, and tallied their representation in the reviewed corpus of literature.
China dominated with 167 authors, followed by the United States with 26 and Sweden with 19. The Netherlands and Brazil were close behind, each with authors contributing to 11 and 8 publications, respectively. Authors from the other 13 countries represented only 18% of the total authorship. China and the United States alone accounted for 68% of the authorship with China dominating at 60%.
3.5. Methods Reported
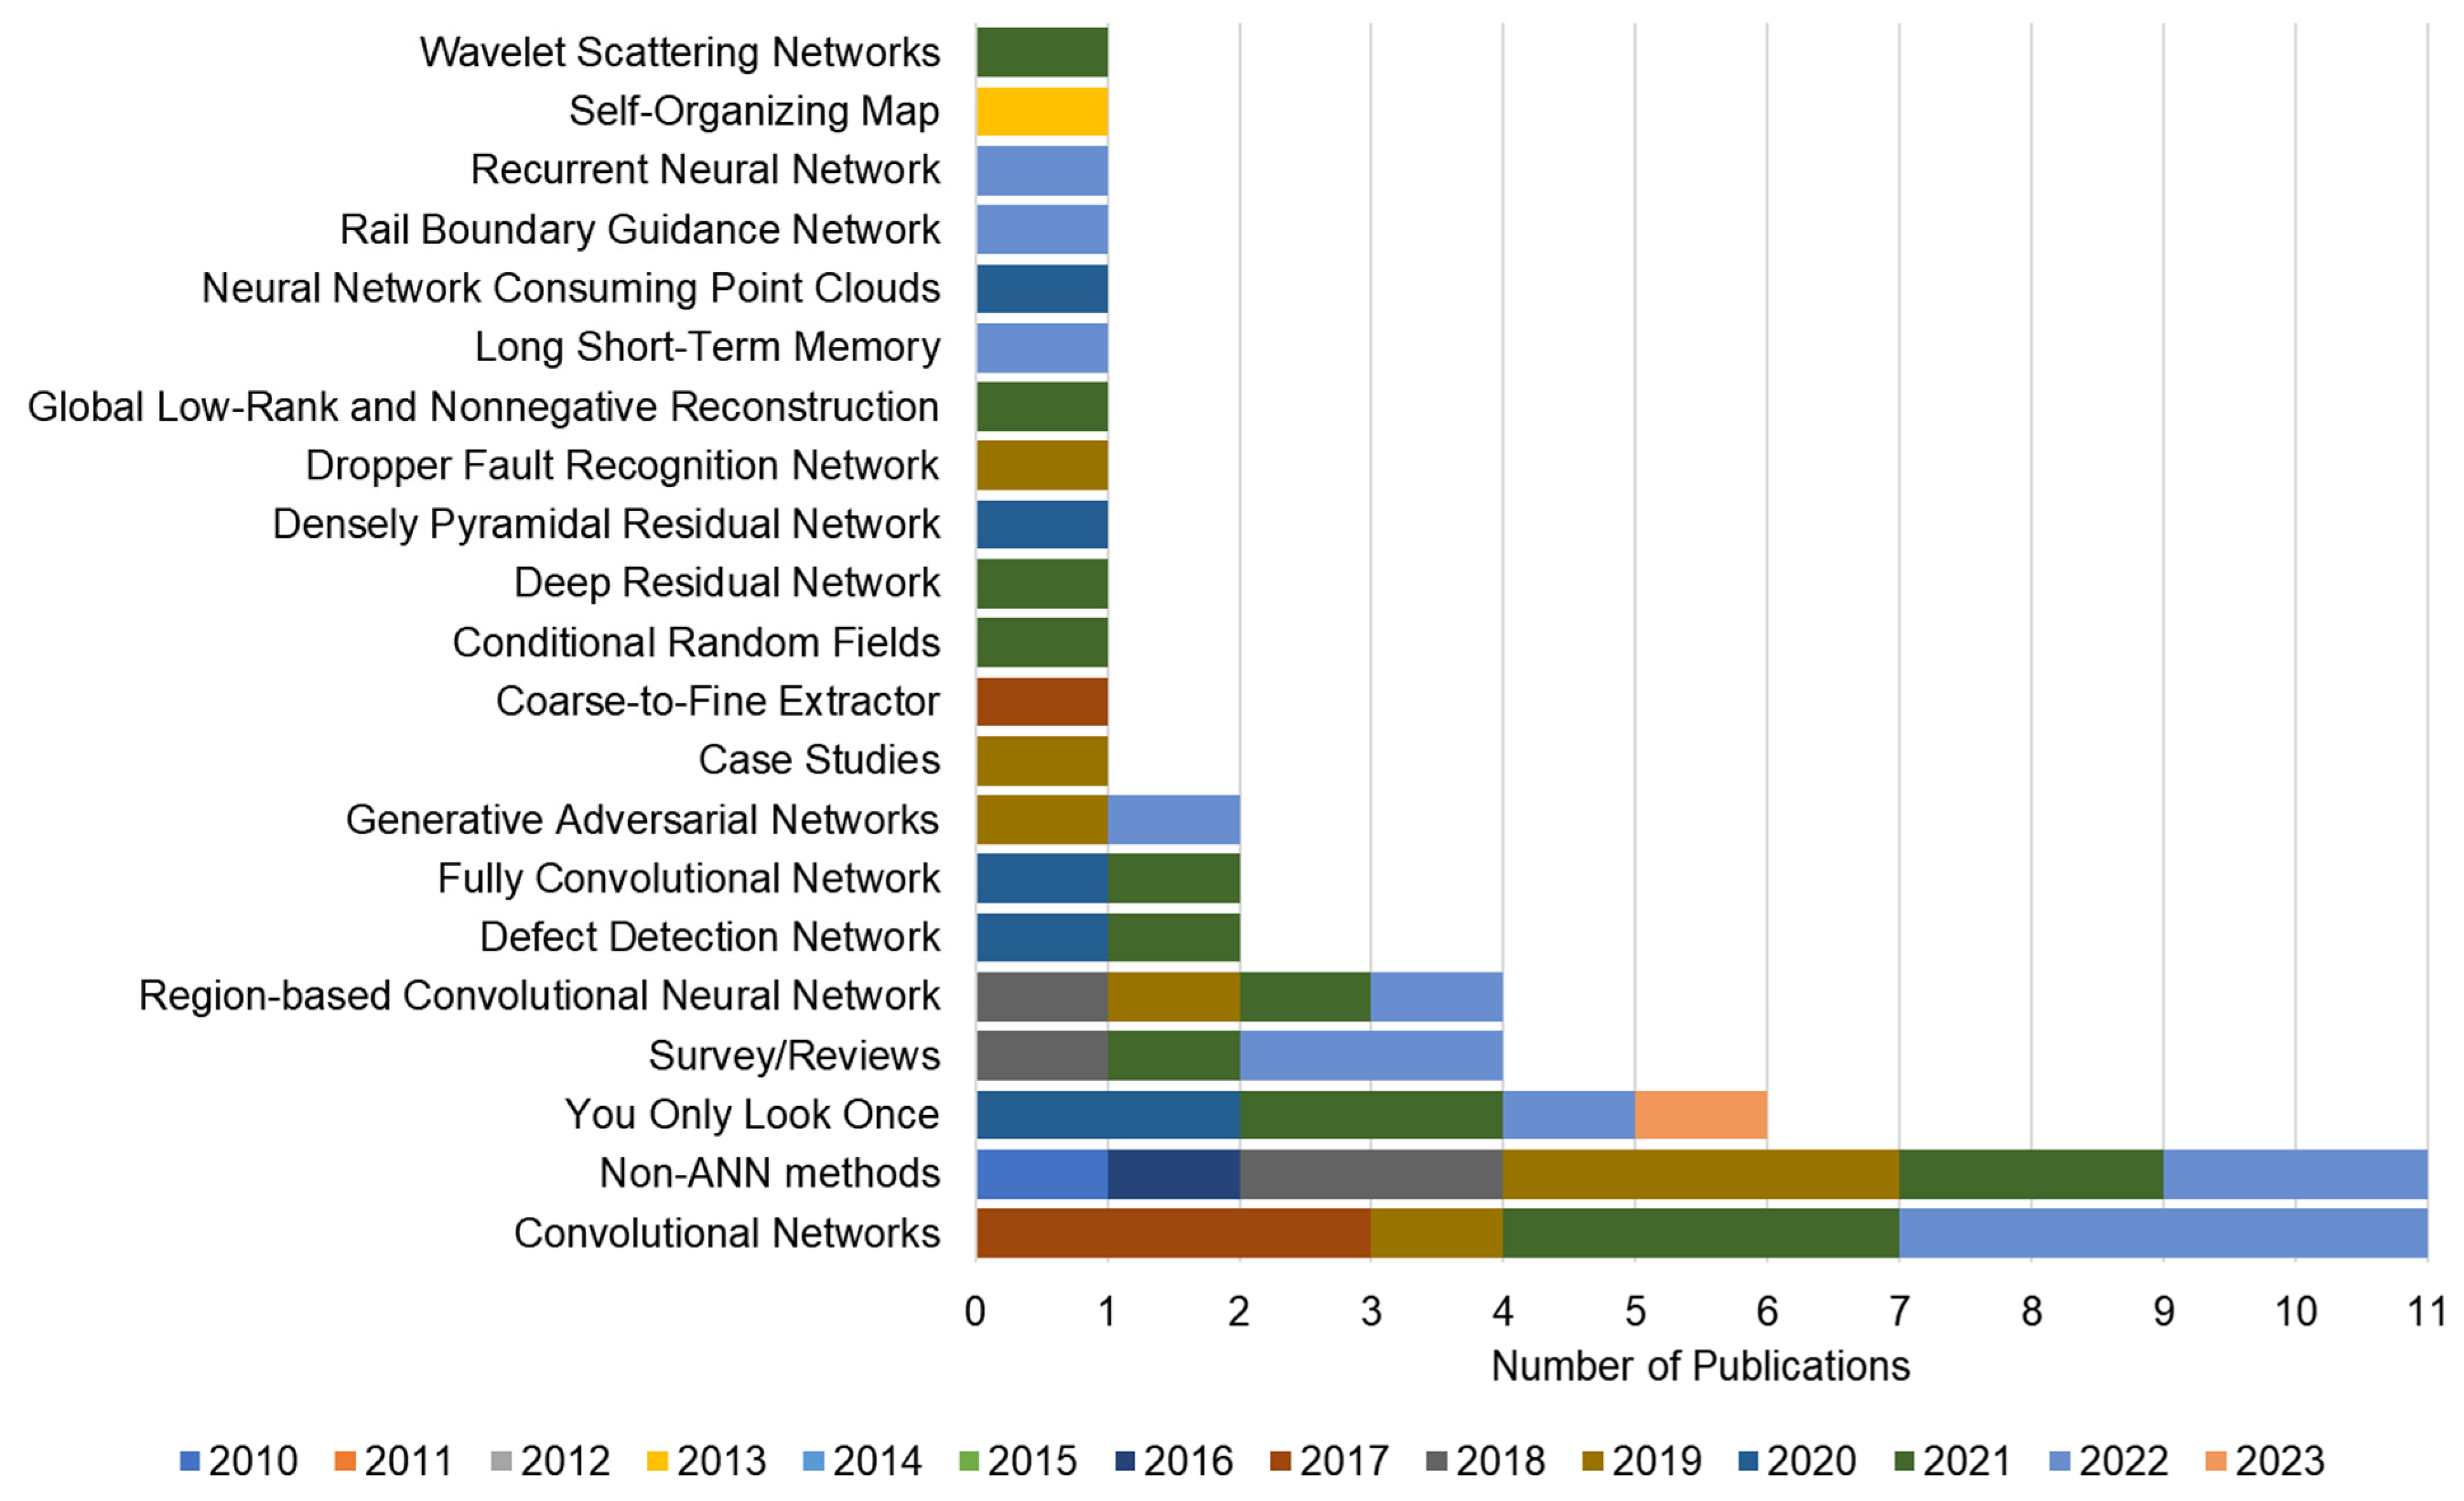
When broadly categorized, ML models are either supervised or unsupervised, with the former requiring labeled data to train the models. The types of supervised ML models include naïve Bayes (NB), decision tree (DT), logistic regression (LR), artificial neural network (ANN), and others [16]. There are also several types of unsupervised ML models that seek to identify data clusters that have similar characteristics [17]. The authors meticulously counted the type of methods used in each of the selected publications to gain insights into their approaches. Table 2 summarizes the dominant methods reported in the final batch of relevant articles reviewed, considering that some studies employed multiple methods. Figure 5 shows how the methods were distributed based on their frequency of appearance and the year of the publication. Figure 6 shows how the publications were distributed by year and split by the methods used.
Based on the studies that disclosed details of the datasets used, they varied widely in size, source, and quality, reflecting the diversity of RS and ML applications in railway inspection. The majority of studies employed publicly available datasets, which included high-resolution images and sensor data from real-world railway environments, while others generated synthetic datasets to train and validate their models. A further assessment of the details of these datasets can influence the generalizability and reliability of the research outcomes. This diversity in data sources highlights the adaptability of RS and ML techniques across different contexts and conditions, enhancing the understanding of their potential limitations and strengths.
Most of the models used are a variant of ANNs as indicated Table 2. The entry “Y” and “N” in the “ANN” column indicates yes and no, respectively, if the model is a variant of ANN. A notable 20% of the methods used are outside the ANN domain. CNN methods emerged as the most frequently employed, featured in 11 different studies. Eleven articles utilized non-ANN methods, encompassing memory-based anomaly detection, big data analytics (BDA), and others. Six publications applied an ANN variant called You Only Look Once (YOLO). This method differs from the traditional two-step object detection techniques that first propose regions of an image and then classify their contents. Instead, YOLO frames object detection as a single regression problem straight from image pixels to bounding box coordinates for evaluating the probabilities of object presence.
Four publications utilized surveys and reviews. The other publications used a variety of other statistical methods. Table 3 defines the acronyms for the parameters reported in Table 4, which provides some details about the architectures of the ANN model variants, the images analyzed, and the metrics of their effectiveness.
4. Discussion
Table 4 includes an outline of the parameters for each of the ANN methods used, showcasing the variation in the number and type of architectures across different approaches. CNN emerged as the dominant method utilized in the body of publications analyzed. CNNs distinguish themselves through a multi-layer, multi-resolution approach that loosely simulates the visual neural system of the human brain. Research has demonstrated that CNNs perform better than traditional ML techniques in machine vision applications [66]. However, the use of CNN and traditional ML approaches vary based on the specific task [67]. The following subsections expand on the methodological patterns observed, propose a classification of the railway condition monitoring applications reviewed, provide some case studies along with challenges encountered, explore future directions, and discuss the limitations of the study.
4.1. Methodological Patterns
This section examines the various models and algorithms documented in the reviewed literature, with a focus on their practical implications and limitations in real-world railway inspection scenarios. The effectiveness of each model, using CNNs, YOLO, or GANs, depended on its applicability in different railway monitoring conditions. Hence, they differed in specific strengths, such as high accuracy or real-time processing capabilities, and limitations, such as high computational demands or sensitivity to data quality. The authors noted several commonalities among the methods. Noteworthy machine vision models included versions of YOLO, Faster R-CNN, Mask R-CNN, ResNet, VGGNet, and others. Most of the reviewed studies utilized image datasets comprising hundreds or thousands of images for training and testing the deep learning models. Some studies incorporated video footage converted into images, with image resolutions varying from 256 × 256 pixels to 4096 × 2160 pixels.
Some studies discussed the effectiveness of transfer learning in enhancing accuracy by utilizing pre-trained models like ImageNet [52]. Moreover, models underwent fine-tuning to set parameters such as learning rate, number of epochs, batch size, dropout rate, momentum, decay rate, and regularization techniques. Mean Average Precision (mAP) and accuracy emerged as the most common evaluation metrics, with some studies incorporating Intersection over Union (IoU) and F1-scores to assess performance. It is noteworthy that most models achieved high accuracy levels, surpassing 90%. Another notable trend in the reviewed methods was that both non-ANN and ANN-based methods required pre-processing steps, such as noise removal, contrast enhancement, and converting RGB to greyscale. These studies used statistical methods like edge detection, Haar transform, SVM, kNN, random forest, and frequency-resolved optical gating (FROG) to identify defects based on real-world image datasets. Some of the studies compared multiple methods.
4.2. Application Classification
Table 5 categorizes the publications based on their application objective. The category of track defect detection included subcategories such as assessing rail surface deterioration and detecting rail cracks. It is evident that a majority of the studies focused on defect detection on the rail tracks or their fasteners.
4.3. Challenges Reported
Some publications discussed difficulties with their chosen methods, while others grappled with issues related to the quality of the captured images. For instance, Hashmi et al. (2022) used three deep learning models: convolutional 1D (Conv1D), convolutional 2D (Conv2D), and long short-term memory (LSTM) [20]. Notably, the training time for Conv2D exceeded the duration required by the other models. Sener et al. (2022) disclosed that one disadvantage of their approach was that it requires preprocessing to normalize the images before training the model [22]. Wang et al. (2021) found that blurred images can severely decrease detection accuracy [74]. Kangwei et al. (2019) reported that a general disadvantage of ML methods is oscillations in the training convergence, which require an optimized learning rate that the model cannot establish itself [53]. Chandran et al. (2021) described the need for continuous calibration of the data collection system to compensate for distance variations between the sensor and the object [35]. Zhang et al. (2022) emphasized the difficulty of pixel-level labeling of faults to train the network [68].
4.4. Future Directions
RS-ML-based railway inspection research pushes the boundaries of the current applied methods. It inspires researchers to develop new models and algorithms. For instance, Yang et al. (2022) modified a CNN model to work with fewer training images and to provide a more precise segmentation [75]. Chen et al. (2022) improved the Mask R-CNN model [50]. Chen et al. (2021)’s study was inspired by three backbone network structures [40]. Therefore, the new models may lead to the development of more robust and adaptable systems capable of handling complex, real-world scenarios in railway inspection and beyond.
Regarding the efficiency and discriminative capabilities of different ML models, GANs can be more robust through the generation of high-quality synthetic data, enhancing model training where real-world datasets are incomplete or biased. While GANs are invaluable for data augmentation and simulation, their performance in direct defect detection tasks is not necessarily superior to task-specific models like CNNs or YOLO. These models, particularly CNNs and fully convolutional networks, leverage the spatial hierarchy in images, making them more efficient for the high-precision localization required in railway inspection. In contrast, YOLO’s integrated approach to bounding box prediction and class probability makes it exceptionally fast and suitable for real-time applications, though sometimes at the cost of precision when compared to CNNs.
The objective of most of the reviewed publications was to ensure railway safety and reliability. Using RS-ML methods in railway inspection can enhance public safety by ensuring more reliable and frequent inspections, potentially reducing the risk of accidents. These methods also offer the potential for cost reductions in maintenance and repair, passing on the savings to both service providers and users [36]. Moreover, the ability of these technologies to pinpoint defects more accurately and quickly than traditional methods could lead to longer-lasting infrastructure, reducing the environmental impact through the less frequent need for raw materials and construction activities [43].
4.5. Limitations
The authors acknowledge the limitations of this review, including the possibility that the chosen keywords may not have captured all the relevant publications. The dynamic nature of research means that new related studies might emerge during the writing and analysis phases of the present study. For instance, this work began in 2023, with 2022 being the previous full year for comparative analysis. Therefore, the authors encourage researchers in related fields to conduct further searches to ensure a comprehensive understanding.
5. Conclusions
This publication offers a thorough overview of previous research on RS-ML-based railway inspection, providing insights into the various methodologies used and their pros and cons for academics and practitioners. The study aids future researchers in fields such as computer science, engineering, and transportation in evaluating methods and finding relevant literature. The study analyzes research from different angles, including a descriptive analysis of publication trends by year, journal, country, and methods while examining the interconnections between studies through a visual map. The study also reviewed the applied methods in RS-ML-based railway inspection, categorizing them, detailing significant ANN studies, and focusing on their methodologies, datasets, and performance metrics. The review identified patterns in methodologies and discussed the benefits and drawbacks of RS-ML-based railway inspection. Most of the reviewed studies aimed to enhance safety, reduce costs, or improve railway inspection quality. Noting the experimental nature of most of the research, the authors propose future research avenues, such as investigating diverse geographical locations and the unique defects associated with them, like objects, vegetation, and rust.
Author Contributions
Conceptualization, W.H., R.B. and T.A.; methodology, W.H., R.B. and T.A.; software, W.H. and R.B.; validation, W.H., R.B. and T.A.; formal analysis, W.H. and R.B.; investigation, W.H. and R.B.; resources, R.B.; data curation, W.H. and R.B.; writing—original draft preparation, W.H. and R.B.; writing—review and editing, W.H., R.B. and T.A.; visualization, W.H., R.B. and T.A.; supervision, R.B.; project administration, R.B.; funding acquisition, R.B. All authors have read and agreed to the published version of the manuscript.
Funding
This research received no external funding.
Institutional Review Board Statement
Not applicable.
Informed Consent Statement
Not applicable.
Data Availability Statement
Not applicable.
Conflicts of Interest
The authors declare no conflicts of interest.
References
- Aleissaee, A.A.; Kumar, A.; Anwer, R.M.; Khan, S.; Cholakkal, H.; Xia, G.-S.; Khan, F.S. Transformers in Remote Sensing: A Survey. Remote Sens. 2023, 15, 1860. [Google Scholar] [CrossRef]
- Deutschl, E.; Gasser, C.; Niel, A.; Werschonig, J. Defect detection on rail surfaces by a vision based system. In Proceedings of the IEEE Intelligent Vehicles Symposium, Parma, Italy, 14–17 June 2004. [Google Scholar] [CrossRef]
- Peng, J.-P.; Wang, L.; Gao, X.-R.; Wang, Z.-Y.; Zhao, Q.-K. Dynamic detection technology for the irregularity state of railway track based on linear array CCD. In Proceedings of the AOMATT 2008—4th International Symposium on Advanced Optical Manufacturing, Chengdu, China, 19–21 November 2008. [Google Scholar]
- Santur, Y.; Karaköse, M.; Akin, E. A new rail inspection method based on deep learning using laser cameras. In Proceedings of the International Artificial Intelligence and Data Processing Symposium (IDAP), Malatya, Turkey, 16–17 September 2017. [Google Scholar]
- Gargoum, S.; El-Basyouny, K. Transportation Infrastructure Asset Management using LiDAR Remote Sensing Technology. Int. J. Trend Res. Dev. IJTRD 2018, 143, 143–152. [Google Scholar]
- Hu, F.; van Leijen, F.J.; Chang, L.; Wu, J.; Hanssen, R.F. Monitoring Deformation along Railway Systems Combining Multi-Temporal InSAR and LiDAR Data. Remote Sens. 2019, 11, 2298. [Google Scholar] [CrossRef]
- Askarzadeh, T.; Bridgelall, R.; Tolliver, D.D. Systematic Literature Review of Drone Utility in Railway Condition Monitoring. J. Transp. Eng. Part A Syst. 2023, 149, 04023041. [Google Scholar] [CrossRef]
- Hodge, V.J.; O’Keefe, S.; Weeks, M.; Moulds, A. Wireless Sensor Networks for Condition Monitoring in the Railway Industry: A Survey. IEEE Trans. Intell. Transp. Syst. 2015, 16, 1088–1106. [Google Scholar] [CrossRef]
- Geng, Y.-A.; Liu, M.; Li, Q.; He, R. Introduction of Machine Learning. In Applications of Machine Learning in Wireless Communications; He, R., Ding, Z., Eds.; IET Digital Library: Augsburg, Germany, 2019; pp. 1–65. [Google Scholar]
- Page, M.J.; McKenzie, J.E.; Bossuyt, P.M.; Boutron, I.; Hoffmann, T.C.; Mulrow, C.D.; Shamseer, L.; Tetzlaff, J.M.; Akl, E.A.; Brennan, S.E.; et al. The PRISMA 2020 statement: An updated guideline for reporting systematic reviews. Syst. Rev. 2021, 10, 89. [Google Scholar] [CrossRef] [PubMed]
- Litmaps. Litmaps. Available online: https://www.litmaps.com/ (accessed on 23 January 2024).
- Salehi, M.; Wang, Y. Rail Network Detection from Aerial Imagery using Deep Learning. Computer Science, Mathematics, 2017. Available online: https://cs231n.stanford.edu/reports/2017/posters/564.pdf (accessed on 23 January 2024).
- Otero, L.D.; Moyou, M.; Peter, A.; Otero, C.E. Towards a Remote Sensing System for Railroad Bridge Inspections: A Concrete Crack Detection Component. In Proceedings of the IEEE SoutheastCon, St. Petersburg, FL, USA, 19–22 April 2018. [Google Scholar]
- Yella, S.; Nyberg, R.G.; Payvar, B.; Dougherty, M.; Gupta, N.K. Machine Vision Approach for Automating Vegetation Detection on Railway Tracks. J. Intell. Syst. 2013, 22, 179–196. [Google Scholar] [CrossRef]
- Mukhamediev, R.I.; Symagulov, A.; Kuchin, Y.; Yakunin, K.; Yelis, M. From Classical Machine Learning to Deep Neural Networks: A Simplified Scientometric Review. Appl. Sci. 2021, 11, 5541. [Google Scholar] [CrossRef]
- James, G.; Witten, D.; Hastie, T.; Tibshirani, R. An Introduction to Statistical Learning; Springer: New York, NY, USA, 2013. [Google Scholar]
- Bridgelall, R. Applying unsupervised machine learning to counterterrorism. J. Comput. Soc. Sci. 2022, 5, 1099–1128. [Google Scholar] [CrossRef]
- Zhang, Z.; Liang, M.; Wang, Z. A Deep Extractor for Visual Rail Surface Inspection. IEEE Access 2021, 9, 21798–21809. [Google Scholar] [CrossRef]
- Guo, B.; Geng, G.; Zhu, L.; Shi, H.; Yu, Z. High-Speed Railway Intruding Object Image Generating with Generative Adversarial Networks. Sensors 2019, 19, 3075. [Google Scholar] [CrossRef] [PubMed]
- Alam Hashmi, M.S.; Ibrahim, M.; Bajwa, I.S.; Siddiqui, H.-U.; Rustam, F.; Lee, E.; Ashraf, I. Railway Track Inspection Using Deep Learning Based on Audio to Spectrogram Conversion: An on-the-Fly Approach. Sensors 2022, 22, 1983. [Google Scholar] [CrossRef] [PubMed]
- Chandran, P.; Asber, J.; Thiery, F.; Odelius, J.; Rantatalo, M. An Investigation of Railway Fastener Detection Using Image Processing and Augmented Deep Learning. Sustainability 2021, 13, 12051. [Google Scholar] [CrossRef]
- Şener, A.; Ergen, B.; Toğaçar, M. Fault Detection from Images of Railroad Lines Using the Deep Learning Model Built with the Tensorflow Library. Turk. J. Sci. Technol. 2022, 17, 47–53. [Google Scholar] [CrossRef]
- Gibert, X.; Patel, V.M.; Chellappa, R. Deep Multitask Learning for Railway Track Inspection. IEEE Trans. Intell. Transp. Syst. 2016, 18, 153–164. [Google Scholar] [CrossRef]
- Jamshidi, A.; Faghih-Roohi, S.; Hajizadeh, S.; N’unez, A.; Babuska, R.; Dollevoet, R.; Li, Z.; De Schutter, B. A Big Data Analysis Approach for Rail Failure Risk Assessment. Risk Anal. 2017, 37, 1495–1507. [Google Scholar] [CrossRef] [PubMed]
- Liu, J.; Teng, Y.; Ni, X.; Liua, H. A Fastener Inspection Method Based on Defective Sample Generation and Deep Convolutional Neural Network. IEEE Sens. J. 2021, 21, 12179–12188. [Google Scholar] [CrossRef]
- Passos, R.A.d.S.L.; Ferreira, M.P.; Silva, B.-H.d.A.e.; Lopes, L.A.S.; Ribeiro, H.; dos Santos, R.P. An in-depth assessment of convolutional neural networks for rail surface defect detection. Res. Soc. Dev. 2022, 11, e12211830252. [Google Scholar] [CrossRef]
- Ye, W.; Deng, S.; Ren, J.; Xu, X.; Zhang, K.; Du, W. Deep learning-based fast detection of apparent concrete crack in slab tracks with dilated convolution. Constr. Build. Mater. 2022, 329, 127157. [Google Scholar] [CrossRef]
- Tong, L.; Wang, Z.; Jia, L.; Qin, Y.; Wei, Y.; Yang, H.; Geng, Y. Fully Decoupled Residual ConvNet for Real-Time Railway Scene Parsing of UAV Aerial Images. IEEE Trans. Intell. Transp. Syst. 2022, 23, 14806–14819. [Google Scholar] [CrossRef]
- Otero, L.D.; Peter, A.; Moyou, M. Rail Safety IDEA Program Remote Sensing with Mobile LiDAR and Imaging Sensors for Railroad Bridge Inspections Final Report for Rail Safety IDEA Project 26; TRB Innovations Deserving Exploratory Analysis Programs (IDEA); Transportation Research Board: Washington, DC, USA, 2016. [Google Scholar]
- Saha, S.; Karmakar, S.; Manna, D. Analysis of Railroad Track Crack Detection using Computer Vision. In Proceedings of the IEEE Interdisciplinary Research in Technology and Management (IRTM), Kolkata, India, 24–26 February 2022. [Google Scholar]
- Sánchez-Rodríguez, A.; Soilán, M.; Cabaleiro, M.; Arias, P. Automated Inspection of Railway Tunnels’ Power Line Using LiDAR Point Clouds. Remote Sens. 2019, 11, 2567. [Google Scholar] [CrossRef]
- Sysyn, M.; Gerber, U.; Nabochenko, O.; Gruen, D.; Kluge, F. Prediction of Rail Contact Fatigue on Crossings Using Image Processing and Machine Learning Methods. Urban Rail Transit 2019, 5, 123–132. [Google Scholar] [CrossRef]
- Zhang, X.; Gao, B.; Shi, Y.; Woo, W.L.; Li, H. Memory Linked Anomaly Metric Learning of Thermography Rail Defects Detection System. IEEE Sens. J. 2021, 21, 24720–24730. [Google Scholar] [CrossRef]
- Liu, J.; Huang, Y.; Zou, Q.; Tian, M.; Wang, S.; Zhao, X.; Dai, P.; Ren, S. Learning Visual Similarity for Inspecting Defective Railway Fasteners. IEEE Sens. J. 2019, 19, 6844–6857. [Google Scholar] [CrossRef]
- Chandran, P.; Thierry, F.; Odelius, J.; Famurewa, S.M.; Lind, H.; Rantatalo, M. Supervised Machine Learning Approach for Detecting Missing Clamps in Rail Fastening System from Differential Eddy Current Measurements. Appl. Sci. 2021, 11, 4018. [Google Scholar] [CrossRef]
- Zhang, H.; Jin, X.; Wu, Q.M.J.; Wang, Y.; He, Z.; Yang, Y. Automatic Visual Detection System of Railway Surface Defects with Curvature Filter and Improved Gaussian Mixture Model. IEEE Trans. Instrum. Meas. 2018, 67, 1593–1608. [Google Scholar] [CrossRef]
- Zachar, P.; Ostrowski, W.; Płatek-Żak, A.; Kurczyński, Z. The Influence of Point Cloud Accuracy from Image Matching on Automatic Preparation of Training Datasets for Object Detection in UAV Images. ISPRS Int. J. Geo-Inf. 2022, 11, 565. [Google Scholar] [CrossRef]
- Rizzo, P.; Cammarata, M.; Bartoli, I.; di Scalea, F.L.; Salamone, S.; Coccia, S.; Phillips, R. Ultrasonic Guided Waves-Based Monitoring of Rail Head: Laboratory and Field Tests. Adv. Civ. Eng. 2010, 2010, 291293. [Google Scholar] [CrossRef]
- He, D.; Zou, Z.; Chen, Y.; Liu, B.; Yao, X.; Shan, S. Obstacle detection of rail transit based on deep learning. Measurement 2021, 176, 109241. [Google Scholar] [CrossRef]
- Chen, Z.; Wang, Q.; Yang, K.; Yu, T.; Yao, J.; Liu, Y.; Wang, P.; He, Q. Deep Learning for the Detection and Recognition of Rail Defects in Ultrasound B-Scan Images. Transp. Res. Rec. J. Transp. Res. Board 2021, 2675, 888–901. [Google Scholar] [CrossRef]
- Sharma, R.; Patel, K.; Shah, S.; Aibin, M. Aerial Footage Analysis Using Computer Vision for Efficient Detection of Points of Interest Near Railway Tracks. Aerospace 2022, 9, 370. [Google Scholar] [CrossRef]
- Wei, X.; Wei, D.; Suo, D.; Jia, L.; Li, Y. Multi-Target Defect Identification for Railway Track Line Based on Image Processing and Improved YOLOv3 Model. IEEE Access 2020, 8, 61973–61988. [Google Scholar] [CrossRef]
- Cao, Y.; Chen, Z.; Wen, T.; Roberts, C.; Sun, Y.; Su, S. Rail fastener detection of heavy railway based on deep learning. High-Speed Railw. 2022, 1, 63–69. [Google Scholar] [CrossRef]
- Qi, H.; Xu, T.; Wang, G.; Cheng, Y.; Chen, C. MYOLOv3-Tiny: A new convolutional neural network architecture for real-time detection of track fasteners. Comput. Ind. 2020, 123, 103303. [Google Scholar] [CrossRef]
- Zhao, Y.; Liu, Z.; Yi, D.; Yu, X.; Sha, X.; Li, L.; Sun, H.; Zhan, Z.; Li, W.J. A Review on Rail Defect Detection Systems Based on Wireless Sensors. Sensors 2022, 22, 6409. [Google Scholar] [CrossRef] [PubMed]
- Kou, L. A Review of Research on Detection and Evaluation of the Rail Surface Defects. Acta Polytech. Hung. 2022, 19, 167–186. [Google Scholar] [CrossRef]
- Ghofrani, F.; He, Q.; Goverde, R.M.; Liu, X. Recent applications of big data analytics in railway transportation systems: A survey. Transp. Res. Part C Emerg. Technol. 2018, 90, 226–246. [Google Scholar] [CrossRef]
- Gong, W.; Akbar, M.F.; Jawad, G.N.; Mohamed, M.F.P.; Ab Wahab, M.N. Nondestructive Testing Technologies for Rail Inspection: A Review. Coatings 2022, 12, 1790. [Google Scholar] [CrossRef]
- Kang, G.; Gao, S.; Yu, L.; Zhang, D. Deep Architecture for High-Speed Railway Insulator Surface Defect Detection: Denoising Autoencoder with Multitask Learning. IEEE Trans. Instrum. Meas. 2019, 68, 2679–2690. [Google Scholar] [CrossRef]
- Chen, Z.; Wang, Q.; Yu, T.; Zhang, M.; Liu, Q.; Yao, J.; Wu, Y.; Wang, P.; He, Q. Foreign object detection for railway ballastless trackbeds: A semisupervised learning method. Measurement 2022, 190, 110757. [Google Scholar] [CrossRef]
- Guo, F.; Qian, Y.; Wu, Y.; Leng, Z.; Yu, H. Automatic railroad track components inspection using real-time instance segmentation. Comput. Civ. Infrastruct. Eng. 2021, 36, 362–377. [Google Scholar] [CrossRef]
- Wei, X.; Yang, Z.; Liu, Y.; Wei, D.; Jia, L.; Li, Y. Railway track fastener defect detection based on image processing and deep learning techniques: A comparative study. Eng. Appl. Artif. Intell. 2019, 80, 66–81. [Google Scholar] [CrossRef]
- Kangwei, W.; Xin, Z.; Qiushi, H.; Yan, W.; Yi, S. Application of improved least-square generative adversarial networks for rail crack detection by AE technique. Neurocomputing 2019, 332, 236–248. [Google Scholar]
- Yang, H.; Li, X.; Guo, Y.; Jia, L. RT-GAN: GAN Based Architecture for Precise Segmentation of Railway Tracks. Appl. Sci. 2022, 12, 12044. [Google Scholar] [CrossRef]
- Liu, J.; Teng, Y.; Shi, B.; Ni, X.; Xiao, W.; Wang, C.; Liu, H. A hierarchical learning approach for railway fastener detection using imbalanced samples. Measurement 2021, 186, 110240. [Google Scholar] [CrossRef]
- Kim, H.; Lee, S.; Han, S. Railroad Surface Defect Segmentation Using a Modified Fully Convolutional Network. KSII Trans. Internet Inf. Syst. 2020, 14, 4763–4775. [Google Scholar] [CrossRef]
- Bojarczak, P.; Lesiak, P. UAVs in rail damage image diagnostics supported by deep-learning networks. Open Eng. 2021, 11, 339–348. [Google Scholar] [CrossRef]
- Gan, J.; Li, Q.; Wang, J.; Yu, H. A Hierarchical Extractor-Based Visual Rail Surface Inspection System. IEEE Sens. J. 2017, 17, 7935–7944. [Google Scholar] [CrossRef]
- Wu, Y.; Qin, Y.; Wang, Z.; Ma, X.; Cao, Z. Densely pyramidal residual network for UAV-based railway images dehazing. Neurocomputing 2020, 371, 124–136. [Google Scholar] [CrossRef]
- Niu, M.; Song, K.; Huang, L.; Wang, Q.; Yan, Y.; Meng, Q. Unsupervised Saliency Detection of Rail Surface Defects using Stereoscopic Images. IEEE Trans. Ind. Inform. 2021, 17, 2271–2281. [Google Scholar] [CrossRef]
- Cui, H.; Li, J.; Hu, Q.; Mao, Q. Real-Time Inspection System for Ballast Railway Fasteners Based on Point Cloud Deep Learning. IEEE Access 2019, 8, 61604–61614. [Google Scholar] [CrossRef]
- Wu, Y.; Qin, Y.; Qian, Y.; Guo, F.; Wang, Z.; Jia, L. Hybrid deep learning architecture for rail surface segmentation and surface defect detection. Comput. Civ. Infrastruct. Eng. 2022, 37, 227–244. [Google Scholar] [CrossRef]
- Jin, Y. Wavelet Scattering and Neural Networks for Railhead Defect Identification. Materials 2021, 14, 1957. [Google Scholar] [CrossRef] [PubMed]
- BNSF. Rail Talk. 27 March 2019. Available online: https://www.bnsf.com/news-media/railtalk/innovation/artificial-intelligence.html (accessed on 23 January 2023).
- Liu, S.; Yu, L.; Zhang, D. An Efficient Method for High-Speed Railway Dropper Fault Detection Based on Depthwise Separable Convolution. IEEE Access 2019, 7, 135678–135688. [Google Scholar] [CrossRef]
- Indolia, S.; Goswami, A.K.; Mishra, S.; Asopa, P. Conceptual Understanding of Convolutional Neural Network- A Deep Learning Approach. Procedia Comput. Sci. 2018, 132, 679–688. [Google Scholar] [CrossRef]
- Keeling, R.; Chhatwal, R.; Huber-Fliflet, N.; Zhang, J.; Wei, F.; Zhao, H.; Shi, Y.; Qin, H. Empirical Comparisons of CNN with Other Learning Algorithms for Text Classification in Legal Document Review. In Proceedings of the 2019 IEEE International Conference on Big Data (Big Data), Los Angeles, CA, USA, 9–12 December 2019. [Google Scholar]
- Zhang, D.; Song, K.; Xu, J.; Dong, H.; Yan, Y. An image-level weakly supervised segmentation method for No-service rail surface defect with size prior. Mech. Syst. Signal Process. 2022, 165, 108334. [Google Scholar] [CrossRef]
- Lu, J.; Liang, B.; Lei, Q.; Li, X.; Liu, J.; Liu, J.; Xu, J.; Wang, W. SCueU-Net: Efficient Damage Detection Method for Railway Rail. IEEE Access 2020, 8, 125109–125120. [Google Scholar] [CrossRef]
- Chandran, P.; Thiery, F.; Odelius, J.; Lind, H.; Rantatalo, M. Unsupervised Machine Learning for Missing Clamp Detection from an In-Service Train Using Differential Eddy Current Sensor. Sustainability 2022, 14, 1035. [Google Scholar] [CrossRef]
- Franca, A.S.; Vassallo, R.F. A Method of Classifying Railway Sleepers and Surface Defects in Real Environment. IEEE Sens. J. 2021, 21, 11301–11309. [Google Scholar] [CrossRef]
- Aytekin, C.; Rezaeitabar, Y.; Dogru, S.; Ulusoy, I. Railway Fastener Inspection by Real-Time Machine Vision. IEEE Trans. Syst. Man Cybern. Syst. 2015, 45, 1101–1107. [Google Scholar] [CrossRef]
- Chen, J.; Liu, Z.; Wang, H.; Nunez, A.; Han, Z. Automatic Defect Detection of Fasteners on the Catenary Support Device Using Deep Convolutional Neural Network. IEEE Trans. Instrum. Meas. 2018, 67, 257–269. [Google Scholar] [CrossRef]
- Wang, W.; Hu, W.; Wang, W.; Xu, X.; Wang, M.; Shi, Y.; Qiu, S.; Tutumluer, E. Automated crack severity level detection and classification for ballastless track slab using deep convolutional neural network. Autom. Constr. 2021, 124, 103484. [Google Scholar] [CrossRef]
- Yang, H.; Wang, Y.; Hu, J.; He, J.; Yao, Z.; Bi, Q. Segmentation of Track Surface Defects Based on Machine Vision and Neural Networks. IEEE Sens. J. 2022, 22, 1571–1582. [Google Scholar] [CrossRef]
Figure 1.
Citation mapping.

Figure 2.
The number of publications by year.

Figure 3.
Proportion of publications by journal.

Figure 4.
The number of publications by country.

Figure 5.
Distribution of methods by publication year.

Figure 6.
Distribution of publication year split by methods.


Table 1.
Initial search phrases used to search Google Scholar.
| Search Phrases | Publications | |
|---|---|---|
| 1 | “Colin Brooks” as an author in Google Scholar | 4 |
| 2 | “human eye” railway inspection ML | 1 |
| 3 | allintitle: comparative assessment Convolutional Neural Network | 2 |
| 4 | allintitle: deep learning rail detection | 4 |
| 5 | allintitle: deep learning railroad detection | 1 |
| 6 | allintitle: Deep Networks rail | 1 |
| 7 | allintitle: Generative Adversarial Networks rail | 2 |
| 8 | allintitle: Generative Adversarial Networks railway | 1 |
| 9 | allintitle: learning rail detection aerial | 1 |
| 10 | allintitle: learning rail detection UAV | 1 |
| 11 | allintitle: ML RS | 2 |
| 12 | allintitle: ML transportation infrastructure | 1 |
| 13 | allintitle: multispectral transportation | 2 |
| 14 | allintitle: rail RS | 1 |
| 15 | allintitle: rail sensors | 2 |
| 16 | allintitle: railroad crack detection | 1 |
| 17 | allintitle: railroad imaging | 1 |
| 18 | allintitle: railroad RS | 3 |
| 19 | allintitle: railway LiDAR | 1 |
| 20 | allintitle: RS transportation | 4 |
| 21 | allintitle: RS transportation infrastructure (since 2015) | 3 |
| 22 | allintitle: RS transportation infrastructure (since 2018) | 2 |
| 23 | RS transportation | 1 |
Table 2.
Methods used by each publication.
| Research Method | ANN | Relevant Publication(s) |
|---|---|---|
| Convolutional Networks | Y | Zhang et al. (2021) [18], Guo et al. (2019) [19], Hashmi et al. (2022) [20], Chandran et al. (2021) [21], Salehi et al. (2017) [12], Şener et al. (2022) [22], Gibert et al. (2017) [23], Jamshidi et al. (2017) [24], Liu et al. (2021) [25], Passos et al. (2022) [26], Ye et al. (2022) [27], Tong et al. (2022) [28] |
| Non-ANN Methods | N | Otero et al. (2018) [13], Otero et al. (2016) [29], Saha et al. (2022) [30], Sánchez-Rodríguez et al. (2019) [31], Sysyn et al. (2019) [32], Zhang et al. (2021) [33], Liu et al. (2019) [34], Chandran et al. (2021) [35], Zhang et al. (2018) [36], Zachar et al. (2022) [37], Rizzo et al. (2010) [38] |
| You Only Look Once (YOLO) | Y | He et al. (2021) [39], Chen et al. (2021) [40], Sharma et al. (2022) [41], Wei et al. (2020) [42], Cao et al. (2023) [43], Qi et al. (2020) [44] |
| Survey/Reviews | N | Zhao et al. (2022) [45], Kou (2021) [46], Ghofrani et al. (2018) [47], Gong et al. (2022) [48] |
| Region-Based Convolutional Neural Network (R-CNN) | Y | Kang et al. (2018) [49], Chen et al. (2022) [50], Guo et al. (2021) [51], Wei et al. (2019) [52] |
| Generative Adversarial Networks (GAN) | N | Wang et al. (2019) [53], Yang et al. (2022) [54] |
| Defect Detection Network (DDNet) | N | Wei et al. (2020) [42], Liu et al. (2021) [55] |
| Fully Convolutional Network (FCN) | Y | Kim et al. (2020) [56], Bojarczak et al. (2021) [57] |
| Recurrent Neural Network (RNN) | Y | Hashmi et al. (2022) [20] |
| Coarse-To-Fine-Extractor (CFE) | N | Gan et al. (2017) [58] |
| Conditional Random Fields (CRF) | N | Zhang et al. (2021) [18] |
| Deep Residual Network (ResNet-50) | Y | Chandran et al. (2021) [21] |
| Densely Pyramidal Residual Network (DPRnet) | Y | Wu et al. (2020) [59] |
| Global Low-Rank and Non-negative Reconstruction (GLRNNR) | N | Niu et al. (2021) [60] |
| Long Short-term Memory (LSTM) | Y | Hashmi et al. (2022) [20] |
| Neural Network that Directly Consumes Point Clouds (PointNet++) | Y | Cui et al. (2020) [61] |
| Rail Boundary Guidance Network (RBGNet) | N | Wu et al. (2022) [62] |
| Self-Organizing Map (SOM) | N | Yella et al. (2013) [14] |
| Wavelet Scattering Networks (WSNs) | N | Jin (2021) [63] |
| Case Studies | N | BNSF (2019) [64] |
| Dropper Fault Recognition Network (DFRN) | N | Liu et al. (2019) [65] |
Table 3.
Acronyms used in model development and image processing.
| Model Training and Measures | Image Processing | ||
|---|---|---|---|
| Acronym | Meaning | Acronym | Meaning |
| Conv. | Convolution | RES | Resolution |
| WD | Weight decay | fps | Frames per Second |
| LR | Learning rate | bbox | Bounding Box |
| mAP | Mean Average Precision | ROI | Region of Interest |
| MAE | Mean Absolute Error | BCE | Binary Cross-Entropy |
| IoU | Intersection over Union | SIFT | Scale-Invariant Feature Transform |
| rIoU | Relative Intersection over Union | SVM | Support Vector Machine |
| mIoU | Mean Intersection over Union | RSDD | Remote Sensing Data Deconvolution |
Table 4.
Overview of parameters for the ANN variant methods.
| Title | Method(s) | Architecture | Images | Metrics |
|---|---|---|---|---|
| A Big Data Analysis Approach for Rail Failure Risk Assessment [24] | Deep Convolution Neural Network (DCNN) | 13 layers, 3 convolutional layers. Fully connected network. ReLU activation, max-pooling, dropout. | Images: 300,000 RES: 375 × 275 pixels | Accuracy: 96.9% |
| A Deep Extractor for Visual Rail Surface Inspection [18] | biFCN/ CRF-RNN | 1 × 1 convolutional layer, 5 × 5 two stacked, 3 × 3 convolutional layer. Momentum: 0.9; weight: 0.0005; LR: 0.0001 then reduced by 0.1. | Type I: 67 images Type II: 128 images | Accuracy: Type I = 91.59% Type II = 89.24% |
| A Hierarchical Extractor-Based Visual Rail Surface Inspection System Surface Inspection System [58] | CFE | Four major stages: pre-process, coarse extractor, fine extractor, post-process. | Type I: 67 images Type II: 128 images RES 1024 pixels | 100% inspection rate |
| Aerial Footage Analysis Using Computer Vision for Efficient Detection of Points of Interest Near Railway Tracks [41] | YOLOv5 | 26 layers including backbone (CSPDarknet), neck (PANet), and head (YOLO). WD: 0.0005; detection threshold: 0.7; momentum: 0.937; LR: 0.1. | Images: 5465 RES: 4K | 74.1% precision mAP @ 0.5 of 70.7% |
| An Investigation of Railway Fastener Detection Using Image Processing and Augmented Deep Learning [21] | CNN and ResNet-50 | 7 layers: 3 convolution, 3 pooling, 1 dense. ResNet-50: 5 stages. LR = 0.01. | Images: 3000 RES: 2000 × 2048 | Accuracy: 98% and 94% |
| Application of Improved Least- square Generative Adversarial Networks for Rail Crack Detection by AE Technique [53] | Least-Square Generative Adversarial Networks (LSGANs) | 3 fully connected layers. A 6-layer autoencoder. Optimal regularization (weighting): λ1: 0.1; λ2: 0.9. Minibatch sizes = 50, 100, and 200; Iterative epochs: 500; Dropout rate: 0.8; LR: 0.01, 0.001, and 0.0001. | Images: 3000 500 iteration cycles | Eliminates both statistical and mechanical noise |
| Automatic Railway Track Components Inspection Using Real-Time Instance Segmentation [51] | YOLACT and Mask R-CNN | ResNet-50: 50 layers. ResNet-101: 101 layers. Feature extractor Feature pyramid network (FPN), Prediction head (generating anchors), Protonate (k prototype masks). WD: 5 × 10⁻⁴, LR: 10−3. | Images: 1000 RES: 1920 × 1080 Reshaped: 512 × 512 | 59.9 bbox mAP, and 63.6 mask mAP |
| Deep Learning for the Detection and Recognition of Rail Defects in Ultrasound B-Scan Images [40] | YOLO-V3 | 85 layers: YOLO-Rail + min: 17, YOLO UAV + min: 39, YOLO-Apple + min: 29. Decay: 0.0005; Momentum: 0.949; Initial LR: 0.001. | Images: 4529 RES: 1920 × 860 Reshaped: 608 × 608 | 87.41% precision IoU: 75.33% Threshold: 0.75 |
| Deep Multitask Learning for Railway Track Inspection [23] | DCNN | 9 convolutional layers. WD: 5 × 10⁻⁵. LR: initial 0.01, decaying by 0.5 every 30,000 iterations. | Images: 176 RES: 2 × 2048 | Accuracy: 95.02% |
| Densely pyramidal residual network for UAV-based railway images dehazing [59] | DPRnet | 2 pooling layers. Pyramid pooling: 1/2 and 1/4; Optimization method: Adam. | Images: 13,000 RES: 512 × 512 | Structural similarity index (SSM): Test I: 93.36% Test II: 91.06% |
| Fault Detection from Images of Railway Lines Using the Deep Learning Model Built with the TensorFlow Library [22] | New CNN (ESA) | 24 layers, including 5 convolutional and 5 fully connected pooling. Input: 300 × 300 pixels; Activation: SoftMax. | Images: 383 RES: not fixed | Accuracy: 92.21% |
| Fully Decoupled Residual ConvNet for Real-Time Railway Scene Parsing of UAV Aerial Images [28] | Deep Fully Decoupled Residual Convolutional Network (FDRNet) | 19 layers: 14 encoder, 5 decoder. WD: 2e−4; Inputs: 256 × 256, 128 × 128, 64 × 64, 128 × 128, 256 × 256, 512 × 512; Initial LR: 5e−4. | Images: 3000 RES: 512 × 216 | rIoU: 80.99 mIoU: 58.82 fps: 90.1 |
| High-Speed Railway Intruding Object Image Generating with Generative Adversarial Networks [19] | Improved conditional deep convolutional generative adversarial network (C-DCGAN) | Generator: 12 layers; Multi-scale: 15 layers; LR: 0.0002. | Images: 2529 RES: 512 × 512 | mAP: 0.69 |
| Hybrid Deep Learning Architecture for Rail Surface Segmentation and Surface Defect Detection [62] | A novel FCN named RBGNet | 3 convolutional layers: U1, U2, and U3, followed by three ReLU layers. Kernel size: 3; Iterations: 20 epochs; WD: 0.0005. LR: Initial 5 × 10⁻⁵, decay 0.1 each iteration. | Images: 600 RES: 3840 × 2160 RES: 1920 × 1080, 30 fps | RBGNet, BCE, IoU, and SSIM F-measure: 0.967 MAE: 0.013. |
| Multi-Target Defect Identification for Railway Track Line Based on Image Processing and Improved YOLOv3 Model [42] | YOLOv3; TLMDDNet | 21 layers. LR, momentum, WD regularization, and others follow YOLOv3. | Images: 1278 RES (fasteners): 128 × 256 RES (track): 48 × 480 | Accuracy: 96.26% |
| Obstacle Detection of Rail Transit Based on Deep Learning [39] | Improved-YOLOv4 | 3 pooling layers. Kernel sizes of 5 × 5, 9 × 9, 13 × 13. Improved-YOLOv4: more parameters than YOLOv4. Stage 1 LR: 0.001; minimum LR: 0.0001. Stage 2 LR: 0.0005 and 0.00005. | Images: 6000 RES: 416 × 416 | +ROI mAP: 93.00% |
| Rail Fastener Detection of Heavy Railway Based on Deep Learning [43] | YOLOv5 | 2 layers for each transformer encoder. Number of cluster centers, size of the model input image, threshold of the aspect ratio of this dataset, number of KMEANS iterations. | Images: 3408 RES: 512 × 512 | 0.991 mAP @ 0.5 |
| Wavelet Scattering and Neural Networks for Railhead Defect Identification [63] | WSNs | 2 layers | Type I Images: 67 Type II Images: 128 RES1: 1000 × 160 RES2: 1250 × 55 | Accuracy: Type I: 99.80% Type II: 99.44% |
| Rail Network Detection from Aerial Imagery using Deep Learning [12] | CNN (ConvNets) and Deconvolutional Neural Networks (DeConvNets) | 61 layers in 4 different levels: 16 + 13 + 23 + 9. 4 different process levels: (1) Aerial classifying images; (2) segment rail tracks on aerial images; (3) coarse-level image segmentation; (4) segment rail tracks at individual pixel level. LR: 0.96 decay with step size 1000. | Images: 78,000 RES: (1) 256 × 256 × 3 (2) 60 m × 60 m (3) 256 × 256 (4) 30 m × 30 m | Accuracy: 98% |
| Railway Track Fastener Defect Detection Based on Image Processing and Deep Learning Techniques: A Comparative Study [52] | VGG-16 CNN/DCNN/R-CNN | 14 convolution layers, 3 fully connected. Kernel size: 3 × 3. Transfer learning: initialize weight values with pre-trained weights from ImageNet. Fine-tuning: use weights of conv5 and fully connected layers. | Images: 1058 RES: 32 × 64, 64 × 128, 128 × 256, 256 × 512 | Accuracy: Dense SIFT+SVM: 99.26% CNN: 97.14% Faster R-CNN: 97.90% |
| Railway Track Inspection Using Deep Learning Based on Audio to Spectrogram Conversion: An on-the-Fly Approach [20] | 2 × CNN, RNN, LSTM | LSTM Activation: hyperbolic tangent, ReLU, and SoftMax. Dropout rate: 0.2. Conv1D: kernel: 4; Activation: hyperbolic tangent, ReLU, SoftMax; Dropout: 0.1; Filters: 16–128. Conv2D: kernel: 3 × 3 and 5 × 5; Activation: Hyperbolic tangent, ReLU, SoftMax; Dropout: 0.2. | Images: 720 | Accuracy: 99.7% Precision: 99.5% |
| Real-Time Inspection System for Ballast Railway Fasteners Based on Point Cloud Deep Learning [61] | PointNet++ | Epoch: 500; Batch size: 32; Training time: 51 h; LR: default with default decay rate. | Images: 1500 | Accuracy: 99.7% |
| UAVs in Rail Damage Image Diagnostics Supported by Deep-Learning Networks [57] | FCN-8 (Fully Convolutional Network) | 33 layers: 15 convolution, 13 ReLU, 5 pooling. | Images: 250 RES: 4096 × 2160 | Efficiency: 81% |
| Unsupervised Saliency Detection of Rail Surface Defects Using Stereoscopic Images [60] | GLRNNR | GLRNNR decomposition with the a priori boundary and non-negative coefficient constraint. | Images: 113 RES: 256 × 512 | F-measure: Type I: 83.53 Type II = 87.16 |
Table 5.
Application method categories.
| Objective | Publications |
|---|---|
| Track Defect Detection | Saha et al. (2022) [30], ŞENER et al. (2022) [22], Sysyn et al. (2019) [32], Wu et al. (2022) [62], Chen et al. (2021) [40], Niu et al. (2020) [60], Gibert et al. (2016) [23], Zhang et al. (2021) [33], Jamshidi et al. (2017) [24], Guo et al. (2021) [51], Gan et al. (2017) [58], Bojarczak et al. (2021) [57], Wang et al. (2019) [53], Hashmi et al. (2022) [20], Wei et al. (2020) [42], Rizzo et al. (2010) [38], Passos et al. (2022) [26], Zhang et al. (2022) [68], Wu et al. (2020) [59], Jin (2021) [63], Zhang et al. (2021) [18], Zhang et al. (2018) [36], Lu et al. (2020) [69], Chandran et al. (2022) [70] |
| Fastener Inspection | Cao et al. (2023) [43], Wei et al. (2019) [52], Qi et al. (2020) [44], Liu et al. (2019) [34], Franca et al. (2020) [71], Chandran et al. (2021) [21], Chandran et al. (2021) [35], Cui et al. (2019) [61], Liu et al. (2021) [55], Liu et al. (2021) [25], Aytekin et al. (2015) [72]. |
| Object Detection | He et al. (2021) [39], Sharma et al. (2022) [41], Yella et al. (2013) [14], Guo et al. (2019) [19], Chen et al. (2022) [50], Zachar et al. (2022) [37] |
| Surrounding Inspection | Sánchez-Rodríguez et al. (2019) [31], Kang et al. (2018) [49], Liu et al. (2019) [65], Chen et al. (2017) [73] |
| Defect Segmentation | Salehi et al. (2017) [12], Tong et al. (2021) [28], Kim et al. (2020) [56], Yang et al. (2022) [54] |
| Concrete Inspection | Otero et al. (2016) [29], Ye et al. (2022) [27], Wang et al. (2021) [74] |
Disclaimer/Publisher’s Note: The statements, opinions and data contained in all publications are solely those of the individual author(s) and contributor(s) and not of MDPI and/or the editor(s). MDPI and/or the editor(s) disclaim responsibility for any injury to people or property resulting from any ideas, methods, instructions or products referred to in the content. |
© 2024 by the authors. Licensee MDPI, Basel, Switzerland. This article is an open access article distributed under the terms and conditions of the Creative Commons Attribution (CC BY) license (https://creativecommons.org/licenses/by/4.0/).
Share and Cite
MDPI and ACS Style
Helmi, W.; Bridgelall, R.; Askarzadeh, T. Remote Sensing and Machine Learning for Safer Railways: A Review. Appl. Sci. 2024, 14, 3573. https://doi.org/10.3390/app14093573
AMA Style
Helmi W, Bridgelall R, Askarzadeh T. Remote Sensing and Machine Learning for Safer Railways: A Review. Applied Sciences. 2024; 14(9):3573. https://doi.org/10.3390/app14093573
Chicago/Turabian StyleHelmi, Wesam, Raj Bridgelall, and Taraneh Askarzadeh. 2024. "Remote Sensing and Machine Learning for Safer Railways: A Review" Applied Sciences 14, no. 9: 3573. https://doi.org/10.3390/app14093573
Note that from the first issue of 2016, this journal uses article numbers instead of page numbers. See further details here.