1. Introduction
Petrochemical-based polymers are known to negatively affect the environment [
1], leading to increasing public awareness towards the promotion of “green” products. Hence, environmental rules are continuously legislated by governments [
2], while authorities encourage environmental investments in the polymers sector. Among those eco-friendly solutions suggested for the promotion of “green” materials, attention has shifted to polymer composites based on lignocellulosic fibers’ use as reinforcing agents [
3,
4,
5,
6,
7], which may attribute significant economic benefits, with the ability to play a major role in the automotive and packaging industry, transportations, construction, etc. [
8,
9,
10,
11,
12,
13]. It is well known that the preference for green composites over neat polymers arises from their environmental sustainability, improved performance, cost-effectiveness, and potential for weight reduction [
14,
15,
16,
17,
18]. Though, a great deal of technical challenges need to be solved, such as fiber–matrix adhesion, the raise of mechanical performance, poor flammability resistance, and moisture-uptake control [
15,
16,
17,
18]. Thereafter, there is a demand for the enhancement of the overall performance of natural polymer composites and therefore of the quality of the lignocellulosic fibers used, aiming toward the intensification of their applicability and adaptability in more applications [
16].
Natural fibers can lead to composites with low densities and high specific strengths [
19]. Furthermore, they possess a great variety of advantages over synthetic fibers, such as that they are low-cost, neutral to CO
2 emissions, biodegradable, have acceptable properties in terms of insulating properties and mechanical performance, are easy to handle and process, and come without health risks. Moreover, they are environmentally friendly, with a low density and high toughness, contributing to waste reduction, increasing energy efficiency, and promoting sustainability [
16,
20,
21]. Though, a series of disadvantages characterize lignocellulosic fibers, such as low strength, high moisture content, limited processing temperatures, low durability, low fire resistance, quality and price variability, and, foremost, incompatibility with hydrophobic polymer matrices [
12,
16,
17,
18].
A great variety of lignocellulosic fibers is available for further use in composite polymers. The quality of natural fibers, and therefore the properties they provide to polymer composites, depend on different factors, reported in detail by Dittenber et al. [
21]. In brief, the main factors that affect the fibers’ quality when referred to polymer composite manufacture are the species of the plant, the crop location, the local climate, the fibers’ ripeness during harvesting, the fiber-extraction methods, the storage conditions, and the age of the fiber [
22,
23]. Furthermore, the quality of the fibers is greatly affected by the harvesting process, since cell-wall thickness, adherence with the surrounding structure, and the coarseness of fibers vary accordingly to the fiber-production stage in which reaping has been performed. Moreover, Meshram et al. [
24] have reported that is quite difficult to define a lignocellulosic fiber’s quality.
Nonetheless, although the abovementioned factors affecting fibers’ quality are difficult to examine, the composition of natural fibers can be investigated, leading to the estimation of a series of respective polymer composites’ properties, such as thermal and mechanical properties [
16,
25]. Lignocellulosic fibers are mainly composed of three components: cellulose, hemicellulose, and lignin [
26]. Cellulose is a non-branched macromolecule which contains chains of different lengths of one–four linked β-d-anhydroglucopyranose units [
27]. On the contrary, lignin is a branched structure, serving as the matrix material in which cellulose is embedded, along with hemicellulose [
28].
Each component provides to the system totally different properties. More specifically, cellulose has a crystalline structure compared to the other constituents of natural fibers and offers both strength and stiffness to the fibers via linkages (e.g., hydrogen bonds) [
18,
29,
30,
31]. Furthermore, increasing the crystallinity of cellulose leads to decreased elongation, lower water intake and fewer sites available to chemically react with other materials, since tightly packed structures reduce reactive sites’ accessibility [
32]. On the contrary, hemicellulose has an amorphous structure and among all the fiber’s constituents exhibits the greatest sensitivity to thermal effects [
18,
33,
34]. The presence of hemicellulose in lignocellulosic fibers increases the hydrophilic nature of the fibers [
18,
25], leading to moisture absorption, while it is responsible for biodegradation processes and for reduced thermal stability, leading to thermal degradation at high temperatures [
18,
29,
30,
31]. Lignin, on the other hand, is the most hydrophobic of all the fiber’s elements/components, and it likewise exhibits an amorphous structure [
35], leading to greater elongation loss and increased thermal stability of natural fibers [
18,
25].
According to Meshram et al. [
24], it is quite difficult to objectively define the concept of quality regarding natural fibers employed in specific applications, leading to a perpetual search of the adequate raw materials for each target utilization. Furthermore, the lack of standardized methods for the determination of the characteristics of natural fibers prevents the suitable parameter selection from being studied in order to achieve an estimation of certain properties, used for further exploitation in the lignocellulosic-polymer-composites industry.
The aim of this study is to establish an alternative standardized procedure, which will be capable of providing a comparative prediction or/and estimation of the performance assessment of the lignocellulosic-based polymer composites, based on the study of individual plant fibers. It is known that various wet-chemical analytical methods are employed for determining the chemical composition of lignocellulosic fibers, but they are time-consuming and expensive, preventing them from being applied in commercial applications. Furthermore, NIR (Near-Infrared reflectance) Spectroscopy is also a useful tool for extracting chemical information about fibers, but that technique is not commercially friendly [
36]. So, this study deals with an alternative standardized method for fibers’ analysis based on Scanning Electron Microscopy (SEM), X-ray diffraction (XRD), and Thermogravimetric analysis (TGA), and the way these procedures can optimize the fiber-selection process for various applications as alternative routes toward more commercially friendly methods.
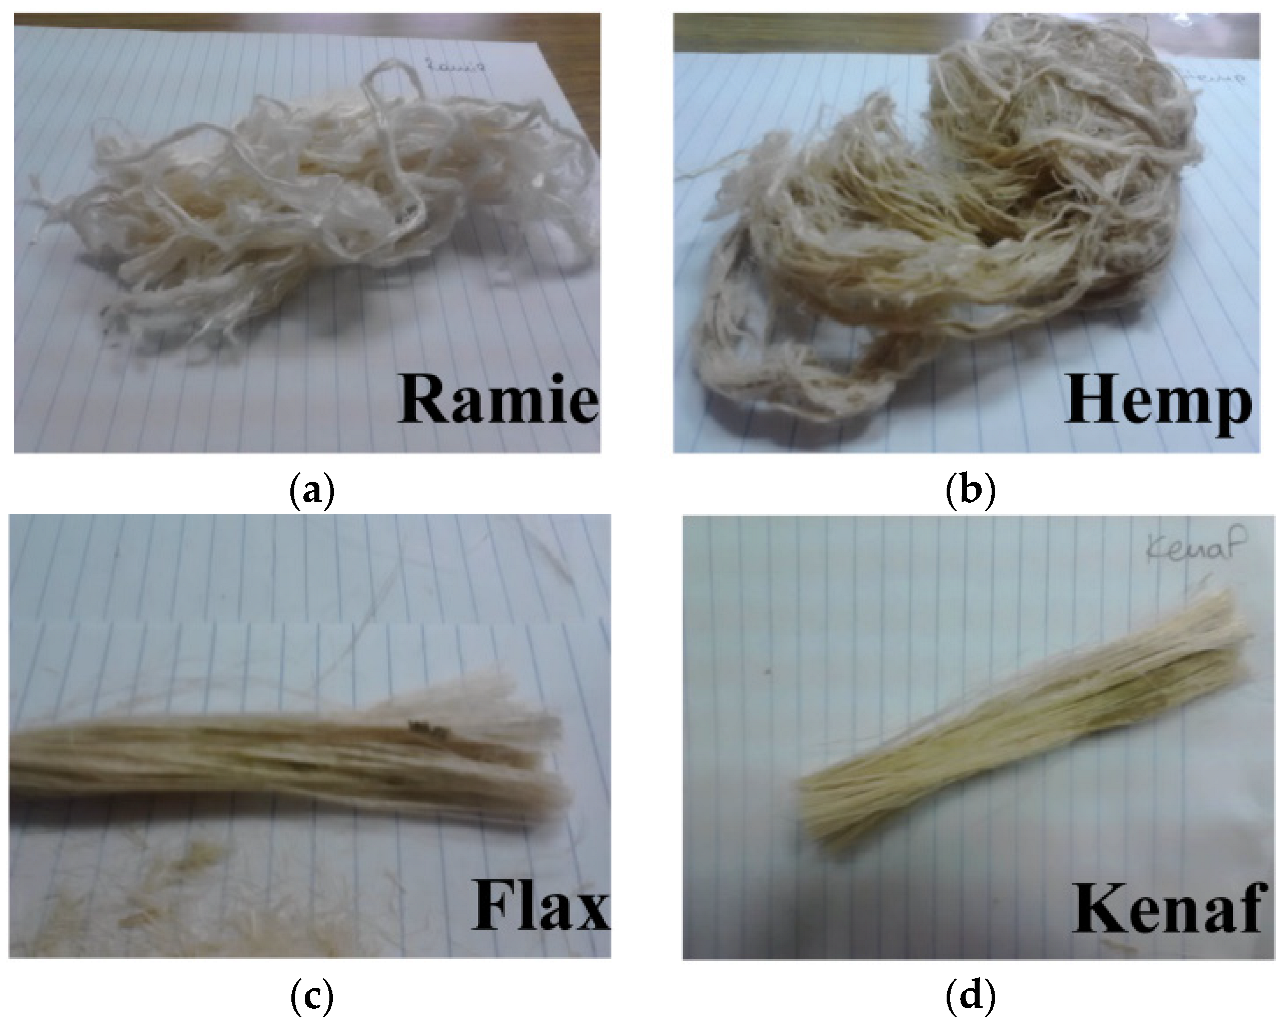
Bast fibers—fibers collected from the stem of the plant—used in the present study are from hemp, kenaf, ramie, and flax. In the literature, their physical and mechanical properties dramatically vary over a large range of values, since inherent variability, as well as the factors mentioned above, lead to an enormous heterogeneity of reported values.
Table 1 presents an overview of some of the characteristics of the fibers studied according to a series of studies. These fibers differ in terms of their structure, the number of main building blocks, the content of cellulose and other constituents, water content, etc.
It is worth noting that it is well known that the mechanical performance of plant-fiber-based composites is governed by the efficiency of the stress transfer between the fibers and the polymer matrix through the interface, but the hydrophilic nature of plant fibers, combined with the hydrophobic polymer matrices, end up in ineffective interfacial adhesion [
16]. Although, no treatment is applied to natural fibers in present study, since the degree of crystallinity of the fibers can be altered [
37], and fibers may be separated into microfibrils, leading to misleading outcomes since the chemical variety involved in the process may affect the fibers in different ways. So, in order to ensure an objective study, without evolving any other factor alteration, natural fibers were used in the current study without any extra pretreatment, no chemical modification, and no coupling agents. So, this study deals with a lignocellulosic-based composite, where fibers and polymer matrices do not exhibit strong interactions; but since the purpose of the article is a comparative study, the materials studied serve that purpose without any interference with the conditions.
Table 1.
Overview of reported properties of the four studied lignocellulosic fibers.
Table 1.
Overview of reported properties of the four studied lignocellulosic fibers.
| Fiber Type | Diameter (μm) | Moisture Content (wt. %) | Cellulose (wt. %) | Hemicellulose (wt. %) | Lignin (wt. %) | Pectin (wt. %) | Waxes (wt. %) | Tensile Strength (MPa) | Young Modulus (GPa) | Elongation (%) | Refs. |
|---|
| kenaf | 65–71 | 6–12 | 31–72 | 8–21.5 | 8–21.5 | 3–5 | 0.8 | 223–930 | 14.5–53 | 1.5–2.7 | [5,12,16,33,38,39,40] |
| hemp | 25–500 | 6.2–12 | 68–74.4 | 15–22.4 | 3.7–10 | 0.9 | 0.8 | 270–900 | 23.5–90 | 1–4 | [5,16,38,39,40,41,42] |
| ramie | 20–80 | 7.5–17 | 68.6–85 | 13.1–16.7 | 0.5–0.7 | 1.9 | 0.3 | 220–1000 | 24.5–128 | 1.2–4 | [18,38,39,40,41,43] |
| flax | 12–600 | 3.9–12 | 62–72 | 18.6–20.6 | 2–5 | 2.3 | 1.5–3.3 | 343–2000 | 27–103 | 1.2–3.3 | [5,38,39,40,41,42,43] |
3. Results and Discussion
3.1. SEM of Natural Fibers
SEM is an excellent technique for performing a macroscopic analysis of a fiber’s morphology by examining the fiber’s size and shape, the degree of its surface roughness, and the existence of any surface-lump materials (e.g., wax or other impurities [
48]).
The fibers’ sizes and shapes constitute the most significant factor related to composite materials, with the effective surface area being inversely dependent on the fibers’ dimensions. Thinner fibers expose more effective surface areas than thicker ones, providing greater surface area for contact with the polymer matrix and consequently positively influencing the mechanical properties [
49]. Furthermore, the inverse correlation between fibers’ diameters and their tensile strength is widely accepted, as a consequence of the fibers’ heterogeneous microstructure [
50,
51]. The main mechanism which is responsible for this correlation lies in the statistical distribution of irregularities throughout the fibers’ three spatial dimensions. In the case of small diameters, the density of any defects, flows, or irregularities is smaller in comparison with bigger diameters, with this fact applying both to the surface and to the volume of the fiber. Consequently, thicker fibers tend to be less homogeneous than thinner ones, with a higher density of irregularities, leading to weaker points and stress raisers, capable of leading to premature failure in comparison with thinner fibers.
Moreover, the surface morphology of the fibers plays a vital role in the performance of the final composites. The surface properties of each natural fiber influence the interactions between the polymer matrix and fibers, since wettability is greatly dependent on the morphology of the fibers’ surface layer [
52]. Roughness on the fiber surface can provide mechanical anchoring to the polymer composite matrix, leading to improved mechanical properties when compared to composites based on fibers with smoother surfaces [
49]. The mechanism which leads to that superiority in terms of mechanical properties deals with the increase in specific surface area in the case of grid-like, rough surfaces. In that case, an increased number of hydroxyl groups in the cellulose molecules is exposed, which in turn creates the appropriate conditions for the enhancement of fiber–matrix adhesion through hydrogen bonding [
53].
According to the fibers’ surface topography, shown in
Figure 2, it is evident that all the studied fibers differentiate in terms of all the aforementioned specific surface characteristics, implying the existence of differences on the level of interfacial adhesion that each fiber may exhibit in the matrix, when used as reinforcements. The micrographs of all fibers were taken with 350× [(2a)—ramie, (2b)—hemp, (2c)—flax, (2d)—kenaf], 900× [(2e)—ramie, (2f)—hemp, (2g)—flax, (2h)—kenaf], and 2000× [(2i)—ramie, (2j)—hemp, (2k)—flax, (2l)—kenaf] times magnifications.
In the case of kenaf, its appearance is quite jagged and irregular, since its fibers are mostly composed of connected elementary fibers, forming bundles. Hemp partially exhibits the same behavior, since along with the individual fibers, some bundles are also observed. This may imply some kind of pretreatment to achieve hemp fibers’ separation. Hemp fibers, also, exhibit a slightly segmented appearance, with less-grooved surfaces than those of kenaf.
According to SEM microphotographs, flax is the fiber which exhibits the greater lump-material content, since a great number of deposited substances are observed on its surface (
Figure 2i). On the other hand, ramie is distinguished for its increased level of smoothness, with a uniform and plain texture, implying a pretreatment process which has led to the removal of any substances on its surface, as has been already mentioned during the fibers’ macroscopic examination (
Figure 2c).
The obtained SEM images were post-processed with ImageJ 1.50 software, in order to determine the diameters of the fibers, by randomly measuring at least fifty individual fibers of each kind. Although the studied fibers exhibit both irregular shapes and variable dimensions, an assumption is made for reasons of simplification, considering all fibers as cylinders with circular cross sections. The results of the respective measurements are exhibited in
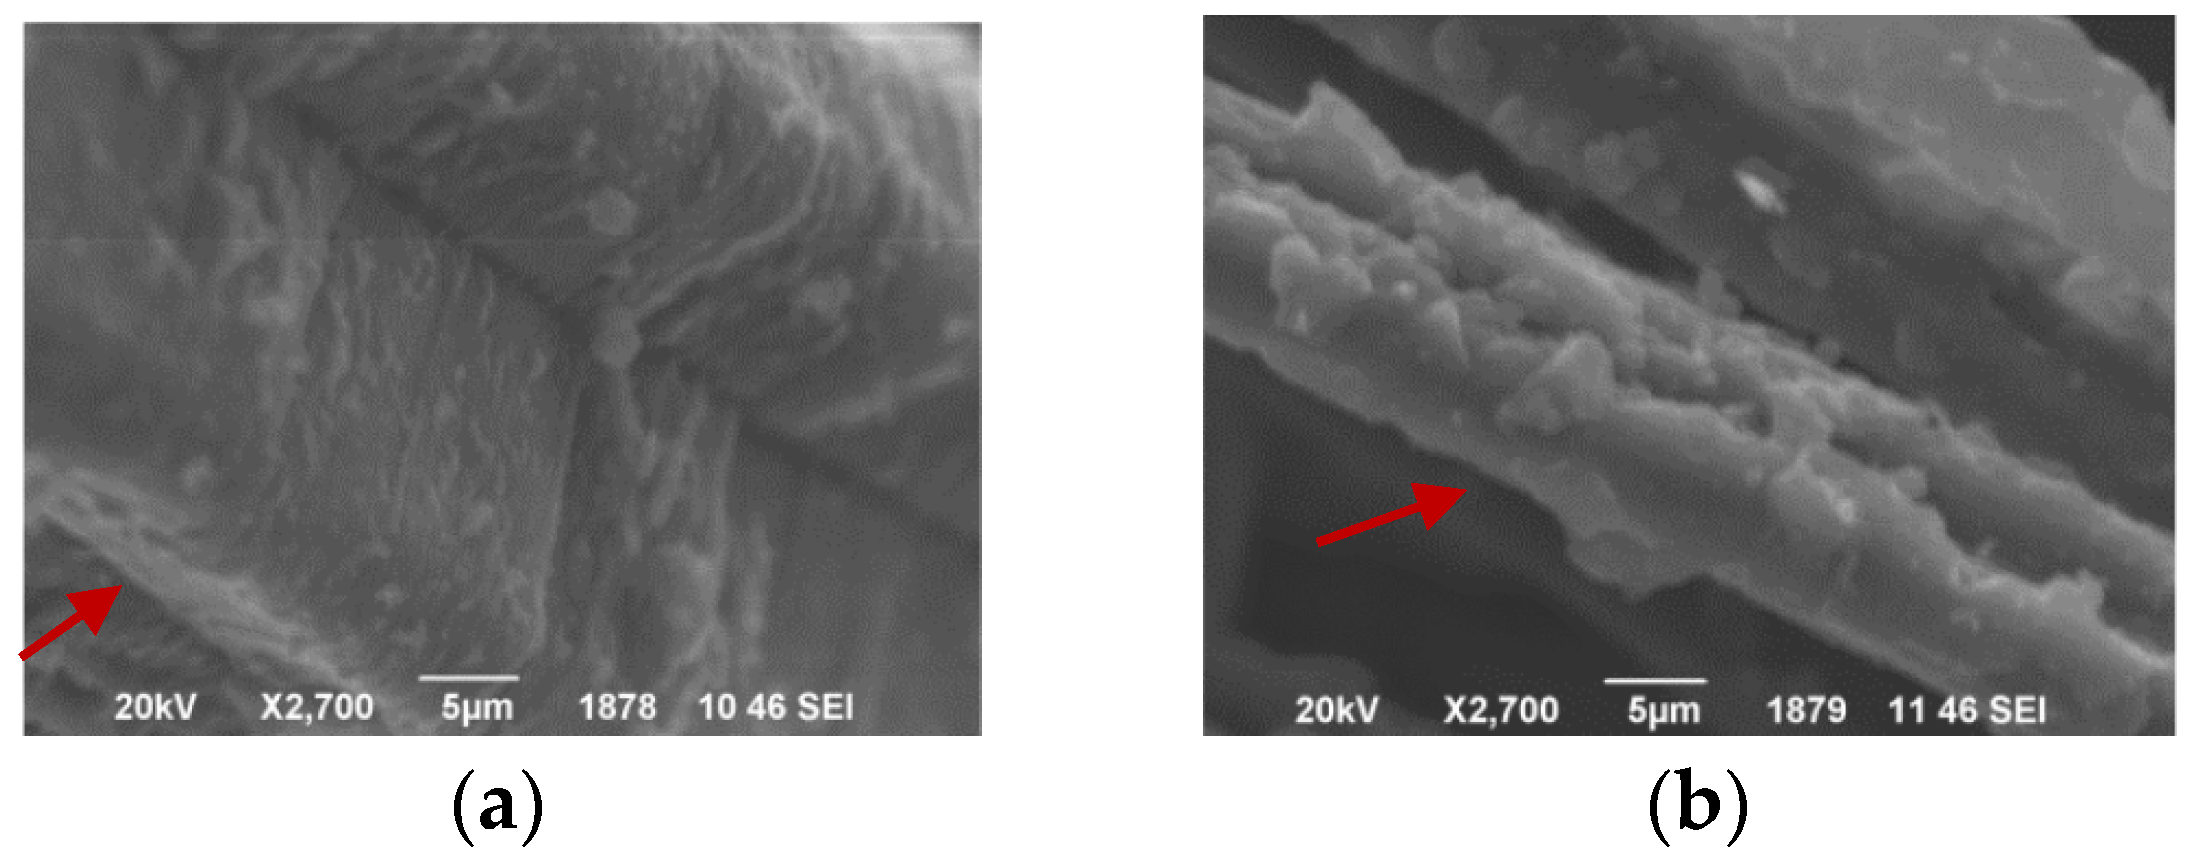
Table 3. It is obvious that the greater mean value of fiber diameter is exhibited by kenaf, following hemp, then ramie, and lastly, flax.
The great differentiation between kenaf and flax, which are the fibers exhibiting the greater and the lower diameter values, is more than obvious in
Figure 3, where both SEM micrographs have been obtained under the same magnification of 2700×.
It is of great importance that kenaf and hemp are characterized by the presence of both individual fibers and formed bundles, explaining the corresponding greater values of the standard deviation of the mean fiber diameters. The co-existence of attached and individual fibers is clearly observed in
Figure 4.
So, the overall conclusion concerning the studied natural fibers by means of SEM is summarized in the following sentences.
The roughness of the fibers follows the trend “kenaf” > “flax” > “hemp” > “ramie”;
The amount of surface impurities on the fibers follows the trend “flax” > “kenaf” > “hemp” > “ramie”;
Fiber diameter follows the trend “kenaf” > “hemp” > “ramie” > “flax”.
3.2. XRD of Natural Fibers
The XRD measurements of natural fibers were performed in order to estimate the fibers’ crystalline index. All XRD diffractograms were subjected to baseline-correction, and subsequently to peak separation using a Gaussian deconvolution process. The curve-fitting was set, assuming a broad band as the amorphous contribution.
The crystallinity index (Cr.I.) of the fibers is calculated by Equation (1), according to Hermans et al. [
54].
where Cr.I. stands for the crystalline index, A
cryst corresponds to the sum of the bands’ areas assigned to crystalline contributions, and A
total stands for the total area of the diffractograms.
XRD is a prominent method for the indirect determination of the crystallinity of natural fibers, or, to be more specific, for the ascertainment of the fraction of crystalline cellulose within the entire natural fiber’s content. It is of great importance to mention that among fiber components, hemicellulose and lignin are non-crystalline [
55], while only cellulose is crystalline. Consequently, a fiber’s crystallinity refers henceforth to the mass fraction of crystalline cellulose within the fiber.
The Cr.I. is used to describe the relative amount of crystalline material in lignocellulosic fibers. Its calculation is necessary, since cellulosic content is greatly linked to respective mechanical performance. In particular, the fibers’ stiffness rises and their flexibility is decreased by increasing the ratio of crystalline to amorphous material percentages [
56].
The X-ray-diffractometry profiles of the studied natural fibers are shown in
Figure 5. A series of peaks is observed, which are displayed in
Table 4, with their intensities and their widths varying, as shown in
Figure 5. The main contributors to the observable diffraction pattern are three peaks with (1
0), (110), and (200) Miller indices, with the first two peaks being overlapped. Those peaks are observed from the lowest angle in the aforementioned order. Furthermore, the contribution of the diffraction peak with a (102) Miller reflection is obvious, although seen as a shoulder due to extensive overlapping with the (200) diffraction peak. The (102) diffraction peak, which is scarcely reported, is detected on randomly oriented powder samples of I
β cellulose [
57].
There are various methods which may be implemented for the calculation of cellulose crystallinity. The Segal peak height method [
58] is the most common method, though it has been proved to poorly achieve a reliable calculation of crystalline contribution, leading to great errors [
59,
60]. According to Terinte et al. [
61], the peak-fitting method is consistent enough. Consequently, peak deconvolution was used for the thorough examination of natural fibers’ diffraction bands and the establishment of both the crystalline and amorphous phases. The diffractograms are shown in
Figure 6, and they are deconvoluted with Gaussian-profiled peaks, while a wide Gaussian peak is set between the cellulose (200) diffraction peak and the (1
0) and (110) diffraction peaks, assigned to the amorphous contribution [
62].
After the deconvolution of XRD patterns and the calculation of the crystallinity index of the fibers according to Equation (1), a comparison was performed and tabulated in
Table 5, where it becomes obvious that ramie and hemp exhibit greater amounts of crystallinity, and therefore greater amounts of cellulose, while the crystallinity index of flax is decreased compared to the aforementioned fibers, and kenaf has the lowest crystallinity index when compared to the rest of the fibers.
3.3. TGA of Natural Fibers
TGA was employed in order to study the thermal stability and degradation profiles of natural fibers (
Figure 7a), as well as the mass loss of fibers (%) at the processing temperature of the composites (
Figure 7b). It is obvious that all the fibers have a highly similar weight-loss behavior, justifying the need to determine the distinct contribution of each particular component to the thermal performance/behavior of the natural fibers. So, the degradation curves of the fibers are characterized by three distinctive zones. Zone I corresponds to temperatures lower than 200 °C and is mainly attributed to the moisture loss of the fibers [
63,
64,
65,
66]. Zone II is the region between 200 °C and 500 °C, and its main characteristic are demonstrated by two peaks; one around 300 °C, which corresponds to hemicellulose and pectin content, and another sharper peak which corresponds to the degradation of cellulosic content [
63,
65,
67]. At higher temperatures, and over the broad temperature range of Zone III, the thermal degradation of lignin takes place [
68].
The processing temperature of composites is considered to be of great importance for the manufacturing of reliable composites. Components of natural fibers start to degrade at relatively low temperatures, where mechanical and thermal properties drastically change [
69,
70]. The thermal degradation of fibers inside the polymer matrix results in volatile production, leading to porous composites with lower densities and inferior mechanical properties. Therefore, in order to ensure the integrity of the natural composites, it is important to verify that the plant fibers of the composite materials can withstand the heat required during the manufacturing process [
71].
The processing temperature of the present study’s HDPE_xx_fiber composites must be noticeably well above the melting temperature of HDPE at 134 °C, as already stated, but also low enough to avoid any thermal degradation to the fibers, which may lead to negative effects on the major properties of the composites [
70]; this is why composite preparation was performed at 190 °C. In
Figure 7b, apart from the mass loss of all the fibers at low temperatures—which correlates to moisture content—the TGA curves of all the studied fibers at the processing temperature of composites are also displayed, where it is more than evident that the fibers’ behavior differs radically. It is obvious that at 190 °C, the fiber with the least thermal degradation is ramie, while the fiber with the greatest thermal impact is kenaf, having lost almost 5.5% of its initial mass.
The dTG curves of all studied fibers are exhibited in
Figure 7c, where differences for the samples are attributed to content variations. According to the TGA curve of
Figure 7a, mass loss in Zone I is due to the evaporation of absorbed water, while in Zone II there is a shoulder caused by overlapped peaks, mainly caused by hemicellulose, and a sharp peak representing the decomposition of cellulose. Finally, in Zone III, the pyrolysis of lignin is displayed as one long tailing [
72]. It is well known that the thermal decomposition of lignin occurs in a wide range of temperatures, since it is a complex process, involving simultaneous reactions, where according to Purnama et al. [
73], lignin may start its thermal degradation at around 200 °C to up to 400–450 °C, producing char residue, and may continue with a second thermal-decomposition step above 450 °C, attributed to the formation of oxidized char residue.
In
Figure 7d, the fibers’ mass loss at the processing temperature is presented, where it can be clearly seen that at 190 °C ramie had lost 3.1% of its initial mass, hemp had lost 3.5% of its mass, flax had lost 4.4%, and kenaf displays the greatest mass loss, which is of 5.5%.
Furthermore, mass loss at low temperatures is correlated to the fibers’ moisture content, so according to
Figure 7d, the moisture content of fibers follows the trend “ramie” < “hemp” < “flax” < “kenaf”. In general, moisture-absorption capacity is determined by both the content of voids and the non-crystalline regions of the fiber [
58]. Moisture uptake is responsible for the swelling of the fiber, and as a consequence for the loss of the dimensional stability (deformation), leading to negative outcomes in terms of physical and mechanical properties. This very reason is the main concern for the utilization of natural fibers in composite applications, since it leads to the deterioration of the overall fiber performance [
59].
3.4. Scanning Electron Microscopy (SEM) of Composites
SEM is employed for the evaluation of the extent of interfacial adhesion between fibers and the matrix, while these observations support the results obtained from the mechanical tests.
Figure 8 displays the SEM microphotographs of the composites’ fractured surfaces.
As clearly seen in the SEM microphotographs of the composites, pull-out fibers and fiber–matrix debonding can be observed. The fibers have been detached from the polymer matrix during deformation, due to the insufficient interfacial adhesion between the fibers and the polymer matrix. This poor interfacial adhesion between fibers and matrices leads to the low wettability of fibers in the polymer matrix and to the impaired mechanical properties of manufactured composites [
12], since no effective load transfer takes place. In general, when interface adhesion is poor, the capabilities of polymer-reinforcing agents cannot be exploited to the full extent.
3.5. Thermogravimetric Analysis of Composites
The thermal stability of lignocellulosic-based polymer composites is crucial; since it helps in predicting the durability and performance of the composite material under certain temperature conditions, it guides the selection of appropriate manufacturing processes and it helps in determining the composites’ appropriateness for certain applications.
Figure 9 presents the TGA (
Figure 9a) and dTG curves (
Figure 9b) of HDPE and its hemp-based polymer composites. A gradual shift of curves toward lower temperatures upon fiber-content increase is obvious, and is associated with the fact that incorporated fibers have a distinct contribution to TGA profiles, since they thermally degrade at lower temperatures when compared to HDPE.
The same behavior occurs in all fiber-based studied composites (
Figure 10), where all the TGA curves of studied composites lie in the region between that of HDPE and the corresponding fiber.
In general, the thermal degradation of fiber-based composites takes place in three steps, as seen in
Figure 9b. The first one occurs at up to approximately 150 °C, and it is attributed to water loss. Furthermore, a distinct weight-loss curve appears at the region of 150–400 °C, which corresponds to thermal decomposition of the fibers’ components, while the third degradation step in the 400–580 °C region is mainly due to the degradation of C-C bonds in the main chain of HDPE [
74].
The main thermal parameters of all the composites are presented in
Table 6 and in
Figure 11. T2% and T5% stand for the temperatures where 2% and 5% of the initial mass has been lost, respectively, while T
d,max refers to the decomposition temperature where the maximum mass loss is observed.
It is well known that the thermal performance of each composite depends on the corresponding fiber’s chemical composition [
16] and mainly on (a) the hemicellulose content of the fiber, since hemicellulose is responsible for mass loss at relatively low temperatures, exhibiting the least thermal resistance among all the fibers’ components and (b) on the cellulose content, since it enhances the thermal stability of the composites. Therefore, fibers with a higher hemicellulose content, which means a lower cellulosic content and a lower % cellulose crystallinity, are susceptible to thermal degradation at low temperatures.
As is obvious from
Figure 9 and
Figure 10, the incorporation of lignocellulosic fibers negatively influences thermal stability of the matrix, since, while the mass loss of HDPE begins at 415 °C, all fiber-based composites start losing weight almost immediately upon heating, due to the evaporation of water. Therefore, according to
Table 6 and
Figure 11a, the T2% values of all composites are lower than the corresponding values of HDPE, and thermal stability is decreased upon increasing filler content. Furthermore, the thermal superiority of ramie- and hemp-based composites is obvious in
Figure 11a, due to the fact that corresponding fibers exhibit higher crystallinity indexes and less moisture absorption, more crystalline regions, and higher cellulosic contents. Therefore, the T2% values of ramie- and hemp-based composites are higher than the corresponding T2% values of flax-based composites, while the T2% values of kenaf-based composites exhibit the lowest values.
Furthermore, the T
d,max values of all composites are presented in
Figure 11, where once more it can be observed that ramie- and hemp-based composites improve the corresponding parameter when compared to the rest of the composites, but also when compared to neat HDPE, with the exemption of the HDPE_30_hemp sample, where the T
d,max value is significantly reduced, probably due to the poor dispersion of fibers within the polymer matrix, which can create regions of stress concentration and accelerate thermal degradation.
3.6. Mechanical Properties of Composites
The mechanical performance of composites depends on a series of key parameters, such as the (1) particle size, (2) volume fraction, (3) orientation of the filler, (4) mechanical characteristics of both the filler and the matrix, (5) filler–matrix adherence, (6) degree of filler dispersion, etc. [
12]
It is well known that the adhesion strength at the interface of composites’ components determines the load transfer between them, which is a crucial parameter for composite strength and toughness. On the contrary, Young’s modulus is not affected by adhesion quality, because debonding is not observed for small displacements [
75]. So, since no treatment is applied to the natural fibers in the present study, it is expected that the strength and toughness of composites will be inferior to the corresponding ones of neat HDPE, while the elastic modulus values of the composites are expected to demonstrate an improved behavior compared to that of the neat polymer. The mechanical properties of HDPE_xx_fiber composites are presented in
Table 7 and
Figure 12.
Figure 12a displays the Young ‘s modulus of HDPE and its composites. The introduction of different kinds of fibers in HDPE leads to a gradual increase in the elastic modulus in almost every studied composite, which is in all cases higher than that of neat HDPE. More specifically, for 10, 20, and 30 wt.% of ramie fibers, Young’s modulus was found to be 79, 94, and 89% higher than that of the neat matrix, with the HDPE_30_ramie being the only composite that displays a slight decrease compared to its 20 wt.% corresponding composite. A gradual increase in terms of the elastic modulus was observed for 10, 20, and 30 mass% of hemp fibers (23, 78 and 96%) and of flax fibers (66, 87 and 104%). Regarding the kenaf fibers, the same increasing trend is observed in terms of the elastic modulus, too, but to a lower extent, since the corresponding composites were found to be 6, 16, and 46% higher than that of neat HDPE. This is due to the fact that kenaf exhibits the lowest cellulose crystallinity (63%) compared to the rest of the fibers, as shown by the XRD deconvolution method, and also kenaf fibers possess a greater diameter compared to the rest of the fibers, as shown by the SEM microphotographs. However, in all cases, stiffer composites are prepared when compared to the neat HDPE.
The elongation at break of all the samples is displayed in
Figure 12b, where it is obvious that a premature fracture of all the composites has taken place, since although HDPE’s value is 716.7% ± 24.8%, all the composites’ values range from 1.7% to 5.5%. So, the mechanical behavior of the material has been totally altered, since fracturing has taken place without significant plastic deformation or elongation, known as brittle fracturing.
The tensile stress at break of all composites (
Figure 12c) is lower than the corresponding stress of neat HDPE due to the microstructure of the composites, since inadequate interfacial bonding is achieved [
75], and structural irregularities may have been introduced during processing. More specifically, due to poor matrix–fiber adhesion, as indicated by the SEM microphotographs, the stress transfer at the polymer–fiber interphase is inefficient, while voids and fiber agglomerates promote the premature failure of composites when compared to the neat matrix. However, with the increase in fiber content, there are three different behaviors observed in the studied composites. Hemp-based composites become stronger, flax-based composites exhibit minute strength alteration, and ramie and kenaf composites become less strong. Generally, parameters affecting the strength of composites are related to filler–matrix interfacial adhesion, filler size, and filler loading, while the interplay between the abovementioned three factors can lead to various trends when referring to the effect of filler loading on the strength of composites [
75].
At low-weight percentages of lignocellulosic fibers, the HDPE_10_hemp composite displays a low-tensile stress-at-break value, probably due to the fact that hemp fibers, with diameters of 24.2 ± 11.1 μm, probably are not well distributed and form agglomerations, while as the weight percentage of fibers increases, a better distribution of fibers may be achieved, with a more interconnected fiber network, leading to enhanced load-bearing behavior.
Flax-based composites maintain approximately the same strength value upon filler increase, due to a combination of factors including the fibers’ diameter, dispersion degree inside the matrix, and fiber–matrix interaction. Fibers’ small diameters make a distinct contribution to the formation of a well-interconnected network at all filler contents, while the high impurity contents on the fibers’ surface may reinforce fiber–matrix interfacial bonding and a 4.4% mass loss of fibers at processing temperatures, which may have caused the formation of voids in the composite. Furthermore, Svab et al. [
76] have proposed that during the evaluation of tensile strength at break, small differences in respective values for low filler contents are related to the small impact of fibers on the matrix due to the small interfacial area, while for higher filler contents, an enlargement of the interfacial area and increased interfacial interactions between the matrix–filler are caused.
On the contrary, kenaf-based composite behavior may be associated with a variety of factors. The weak interfacial interaction of the matrix–fiber, as evidenced by the SEM microphotographs, leads to stress-concentration points or defects, reducing the strength. Furthermore, the elevated moisture content of fibers, as evidenced by TGA, may lead to the formation of big voids during processing, negatively affecting the mechanical properties of respective composites. The relatively low cellulose crystallinity, which is the component conferring strength to the fibers, and the greater diameter among the studied fibers, which has a negative effect on dispersion state, have resulted in composites where the reinforcing agents have difficulty in carrying loads as effectively as the rest of the composites.
Furthermore, ramie-based composites exhibit a different behavior, which is the result of different, and in some cases contradictory, mechanisms. At 10 wt.% of filler, ramie-based composites have a high value of tensile stress at break, because of their high cellulosic content and small fiber diameter, which form an interconnected network of well-dispersed fibers. Furthermore, ramie exhibits low mass loss at the processing temperature, which means that void formation is not intense. However, at 20 wt.% of ramie content, there is a decrease in the tensile stress at break, due to the smooth surface of the fibers, leading to weak adhesion between the matrix and the reinforcing agent. Finally, at 30 wt.% of ramie content, the composite’s tensile stress at break increases, probably due to well-dispersed fibers, which are responsible for an interconnected network, capable of efficiently carrying loads.
In general, HDPE has a ductile behavior, and since it is reinforced with lignocellulosic fibers that exhibit a brittle behavior, the respective composites are also brittle [
77]. The impact strength of the composites is a measure of the composites’ toughness, with the main factors controlling this property being the matrix and fiber properties, as well as matrix–fiber interface [
78]. When specimens are subjected to a force, they absorb the energy of the impact, and that energy is dissipated by certain mechanisms, which include fracture, delamination, and fiber pull-outs [
79]. The main failure mechanism in the studied composites is fiber pull-outs, since there is not significant interfacial adhesion between the fibers and the matrix. So, as seen in
Figure 12d, the introduction of different kinds of fibers in HDPE leads to a gradual decrease in the impact strength, which is in all cases significantly lower than that of neat HDPE. This may be due to the interfaces that act as stress-gathering points, from where cracks may initiate and propagate, and upon increasing filler content, the number of interfaces becomes high, progressively lowering the composites’ overall impact strength.
4. Conclusions
A standardized procedure is proposed in the present study, which will be able to provide comparative estimations of the performance of lignocellulosic-based polymer composites based on a thorough study of individual plant fibers. SEM microphotographs are employed in order to study the fibers’ morphology, size, surface roughness, and the existence of any surface-lump materials. Moreover, XRD is employed for the estimation of the crystalline index, which is an indirect way of comparatively estimating the amount of cellulose in each fiber. Furthermore, the TGA of fibers is mostly applied for the comparative estimation of moisture content and for the study of the fibers’ behavior at the processing temperature of respective composites, since the integrity of the natural composites is highly dependent on it.
Kenaf demonstrates the highest average fiber diameter, followed by hemp, then ramie, and finally flax, according to the SEM microphotographs. Flax stands out for having the highest lump-material content due to the numerous deposited substances observed on its surface, whereas ramie is notable for its enhanced smoothness, characterized by a uniform and plain texture. For kenaf, its visual appearance appears jagged and irregular due to its fibers primarily consisting of interconnected elementary fibers that form bundles. Correspondingly, hemp displays a partially similar characteristic, with fibers also exhibiting a slightly segmented appearance and surfaces that are less grooved compared to those of kenaf. According to XRD, ramie and kenaf demonstrate higher levels of crystallinity, implying greater cellulose contents, while kenaf possesses the lowest crystallinity index among the compared fibers. Moreover, according to the TGA, ramie has the lowest moisture content, followed by hemp, then flax, and finally kenaf, which has the highest moisture content among the studied fibers. Finally, ramie exhibits the lowest mass loss at the processing temperature of the corresponding composites, followed by hemp, flax, and kenaf, in increasing order of mass loss.
The subsequent study of the respective polymer composites of various filler contents (10, 20, and 30 wt.%) discusses aspects which are affected by the outcomes of the aforementioned characterization techniques. The thermal stability of polymer composites is studied by means of TGA, where composites whose fibers exhibit higher crystallinity indexes and less moisture absorption, namely ramie and hemp, present greater thermal stability. Moreover, the SEM of polymer composites allows for the study of the extent of interfacial adhesion, which at present study is poor for all fiber-based composites, leading to the low wettability of fibers and to impaired mechanical performance, because no chemical modification is performed in the materials, since the crystallinity of fibers should remain intact and with no crystallinity alterations that extra chemical steps could grant. Furthermore, each composite’s mechanical performance is multivariate, but it mainly depends on the particle size, volume fraction, filler–matrix adherence, and degree of filler dispersion. Fibers with smaller diameters and greater crystalline indexes, namely ramie–hemp–flax, present greater Young’s modulus values of the corresponding composites, while the interplay between the aforementioned factors leads to various trends when referring to the effect of filler content on the strength of composites.

 ,
, 
