
Phase Behavior and Rheological Properties of AES/CAPB/H2O Ternary System

School of Materials and Chemical Engineering, Hubei University of Technology, Wuhan 430068, China
*
Author to whom correspondence should be addressed.
Appl. Sci. 2024, 14(9), 3605; https://doi.org/10.3390/app14093605
Submission received: 24 March 2024
/
Revised: 17 April 2024
/
Accepted: 22 April 2024
/
Published: 24 April 2024
(This article belongs to the Section Chemical and Molecular Sciences)
Abstract
:Cleaning products are often formulated as mixtures of surfactants because the properties of surfactant mixtures are easier to adjust than those of a single surfactant. Therefore, it is of great significance to study the phase diagram of surfactant mixtures. In this paper, the phase behavior of the alkyl ethoxysulfate (AES)/cocamidopropyl betaine (CAPB)/H2O ternary system was investigated at room temperature using polarizing optical microscopy (POM) and small angle X-ray scattering (SAXS), and the identified phases of the samples with various compositions were used to construct the ternary phase diagram of the AES/CAPB/H2O system which contains normal micellar phase (L1), normal hexagonal phase (H1), lamella phase (Lα), and one transition region (L1 → H1). The viscosity distribution of the AES/CAPB/H2O system was determined by a Brookfield DV2T touch screen viscometer. In addition, the effects of the weight percentage of CAPB and salts on the viscosity and rheological properties of the AES/CAPB/H2O system were also investigated. This work not only enriches the phase diagram of surfactant systems, but also has important guiding significance for the design and development of cleaning products.
1. Introduction
Alkyl ethoxysulfate (AES), as an important anionic surfactant, has excellent foaming and cleaning abilities and is widely used in industrial cleaners, household cleaning products, and rinse-off personal care products, such as shampoo, body wash, and hand wash [1,2]. AES is usually produced by sulphation of primary alcohol ethoxylates (AEOs) using a sulfonating reagent (e.g., sulfur trioxide), followed by immediate neutralization with a base (e.g., NaOH) to obtain the sodium salt [3]. Most AES used in the cleaning field is derived from C12–14 linear fatty alcohols, typically containing 2–3 ethoxy (EO) polymer units [4]. The typical chemical structure of AES is shown in Figure 1.
Because the properties of surfactant mixtures are easier to adjust than that of a single surfactant, AES is often used in conjunction with other surfactants, such as linear alkylbenzene sulphonate (LAS) and cocamidopropyl betaine (CAPB), for manufacturing various cleaning products. Therefore, it is of great significance to investigate the phase behavior of surfactant mixtures [5,6,7,8]. The phases that have been reported mainly include normal micellar phase (L1) [6,7], normal micellar cubic phase (I1) [8,9], normal hexagonal phase (H1) [6,7], normal bicontinuous cubic phase (V1) [8], lamellar phase (Lα) [8,9,10], reverse micellar phase (L2) [11], reverse micellar cubic phase (I2) [8], reverse hexagonal phase (H2) [8,11], and reverse bicontinuous cubic phase (V2) [8]. Here, “normal” represents oil-in-water, and “reverse” represents water-in-oil. For example, the phase behavior of the AES/LAS/H2O system was investigated in depth at room temperature by Li’s group, and the results showed that the AES/LAS/H2O system exhibited a variety of self-assembly behaviors depending on the composition of AES/LAS/H2O, forming normal micellar phase and liquid crystal phases (e.g., normal hexagonal phase, lamellar phase, and normal cubic phase) [12]. Moreover, the micellar, hexagonal, and solid phases were observed in the AES/poly(vinyl alcohol)/H2O system, but the lamellar phase and the cubic phase were not observed [13].
Since phase behavior reflects the way surfactant molecules are aggregated, it is often closely related to physical properties including viscosity and rheological properties [11]. For normal liquid crystal phases (oil-in-water), hexagonal (H1) and cubic phases (I1 and V1) usually exhibit very high viscosities, while the viscosity of the lamellar phase is lower than them [14]. For the normal micellar phase, its viscosity is obviously lower than that of normal liquid crystal phases, usually less than 10 Pa∙s. Interestingly, even in the same surfactant mixture system, some surfactant mixtures exhibit viscous characteristics, while other surfactant mixtures exhibit both viscous and elastic characteristics depending on their different compositions [15,16]. Generally, in rheology, the viscosity level of material is represented by the loss modulus (G″), and the elasticity level of material is represented by the storage modulus (G′) [17]. Although most surfactant mixtures exhibit viscous characteristics when applied (G′ < G″), the fluid will form a gel-like state and exhibit elastic characteristics rather than viscous characteristics (G′ > G″) when there are strong interactions between surfactant molecules similar to cross-linking. Thus, the phase behavior and rheological properties of surfactant mixtures may differ for different types of surfactants or compositions.
Different from LAS (anionic surfactant) and poly(vinyl alcohol) (non-ionic surfactant), cocamidopropyl betaine (CAPB), made from dimethylaminopropylamine and coconut oil fatty acids (Figure 1), is a zwitterionic surfactant [18]. For example, TEGO® BETAIN F50, a concentrated cocamidopropyl betaine (active concentration up to about 38%) produced by Evonik, is often used in conjunction with various surfactants to make personal care products such as shampoo and shower gel [19]. As one of the most important zwitterionic surfactants, TEGO® BETAIN F50 has been widely used in cleaning products [20] and extensively studied in various surfactant systems [21,22]. The AES/CAPB system is one of the research hot spots in cleaning products, because both AES and CAPB are safe for use as cleaning products (including cosmetics) in their safety assessments and undergo rapid primary and ultimate biodegradation in the natural environment [23,24].
Compared with AES/Ethanol/H2O [10], AES/LAS/H2O [12], and AES/poly(vinyl alcohol)/H2O [13] systems, the anionic surfactant AES may interact more strongly with CAPB than with ethanol, LAS, or poly(vinyl alcohol) due to the cationic chemical structure (quaternary ammonium) in CAPB. However, as far as we know, although there have been some studies on the solubility limits of fatty acids [25] in the AES/CAPB systems, the synergistic growth of giant wormlike micelles [26] and the foam properties of the AES/CAPB systems [27], no report has been published on the phase behavior and rheological properties of the AES/CAPB/H2O quasi-ternary system (For the simplicity of presentation, it will be referred to as the AES/CAPB/H2O ternary system below).
In this work, the AES/CAPB/H2O ternary system is a typical normal (oil-in-water) system because the commercial materials AES and CAPB used in this system are both aqueous solutions, and the samples were prepared according to the weight percentage of each point in the AES/CAPB/H2O ternary phase diagram. The phase of each sample was preliminarily determined using polarizing optical microscopy (POM) and then identified using small angle X-ray scattering (SAXS). Finally, the identified phases were used to construct the phase diagram of the AES/CAPB/H2O system. In addition, the viscosity distribution of the AES/CAPB/H2O ternary system was investigated by a viscometer, and rheological properties were also studied with a rheometer. This work not only enriches the phase diagram of surfactant systems, but also has important guiding significance for the design and development of cleaning products.
2. Materials and Methods
2.1. Materials
Commercial 70 wt.% aqueous alkyl ethoxysulphates (AES, 2 EO), abbreviated as AES (70%), was obtained from Zanyu Technology Group Co., Ltd. (Hangzhou, China). Commercial concentrated cocamidopropyl betaine (CAPB)—TEGO® BETAIN F50 (38 wt.% aqueous solution), abbreviated as CAPB (38%), was obtained from Evonik Industries (Shanghai, China). All other chemicals were of analytical grade and used as received without further purification.
2.2. Sample Preparation for Phase Diagram
The samples were prepared according to the weight percentage as shown in Figure 2. For example, the component weight of sample β is 60 wt.% AES (70%), 10 wt.% CAPB (38%), and 30 wt.% H2O. Briefly, AES (70%), CAPB (38%), and H2O were mixed and stirred by an RW20 digital mechanical stirrer (IKA-Werke GmbH & Co. KG, Staufen, Germany) at 323.15 K (50 °C) for about 1 h to obtain homogeneous AES/CAPB/H2O samples and then stored in a sealed glass bottle at room temperature. High-viscosity samples were stored in sealed glass bottles at 50 °C to remove air bubbles and then left at room temperature for two weeks.
In this work, the ternary phase diagram of the AES/CAPB/H2O system was constructed based on the method reported by Li’s research group [12] with slight modifications (2.5 wt.% (half of 5 wt.%) was used as the interval to determine the boundary points, instead of 2 wt.%.). First, the composition interval was selected as 5 wt.% to determine the approximate range of various phases for a rough mapping. Then, the composition interval was narrowed to 2.5 wt.% to identify the boundary points in the transition region (including phase transition and viscosity transition). Finally, the identified boundary points of each phase were connected with modified Bezier lines (Origin Pro 2017) to obtain the boundaries of the phase diagram. In this work, the ternary phase diagram of the AES/CAPB/H2O system was constructed with 192 samples.
2.3. Polarizing Optical Microscopy
The liquid crystal phases of the samples were investigated with a Soptop BH200M microscope equipped with a polarizing optical system (Sunny Optical Technology (Group) Co., Ltd., Yuyao City, China). The POM textures were observed using polarized light through crossed polarizers at room temperature, recorded using a Murzider MSD-2000 digital camera (Murzider (Dongguan) Technology Co., Ltd., Dongguan, China) attached to a Soptop BH200M microscope, and used for preliminary classification of the liquid crystal phase.
2.4. Small Angle X-ray Scattering
The liquid crystal phases were further determined by small angle X-ray scattering (SAXS) on a Xenocs Xeuss 2.0 instrument (Xenocs SA, Grenoble, France) equipped with a Dectris Pilatus3 R 300k detector (pixel size 172 μm) and a Cu-Kα radiation source (Microfocus sealed tube source (30 W), wavelength = 1.54189 Å). The sample-detector distance was set as 538 mm, and the SAXS data were collected at an exposure time of 300 s at 298.15 K (25 °C) for all samples.
2.5. Viscosity and Rheological Measurements
The viscosities of the AES/CAPB/H2O samples were determined using a Brookfield DV2T touch screen viscometer (Brookfield, WI, USA) at 25 °C. Each sample was measured in triplicate, and results are expressed as means ± SD of three measurements. The rheological properties of the AES/CAPB/H2O samples were evaluated with a TA DHR-2 rheometer (TA Instruments, New Castle, DE, USA) at 25 °C.
3. Results and Discussion
3.1. Preliminary Identification of Phases
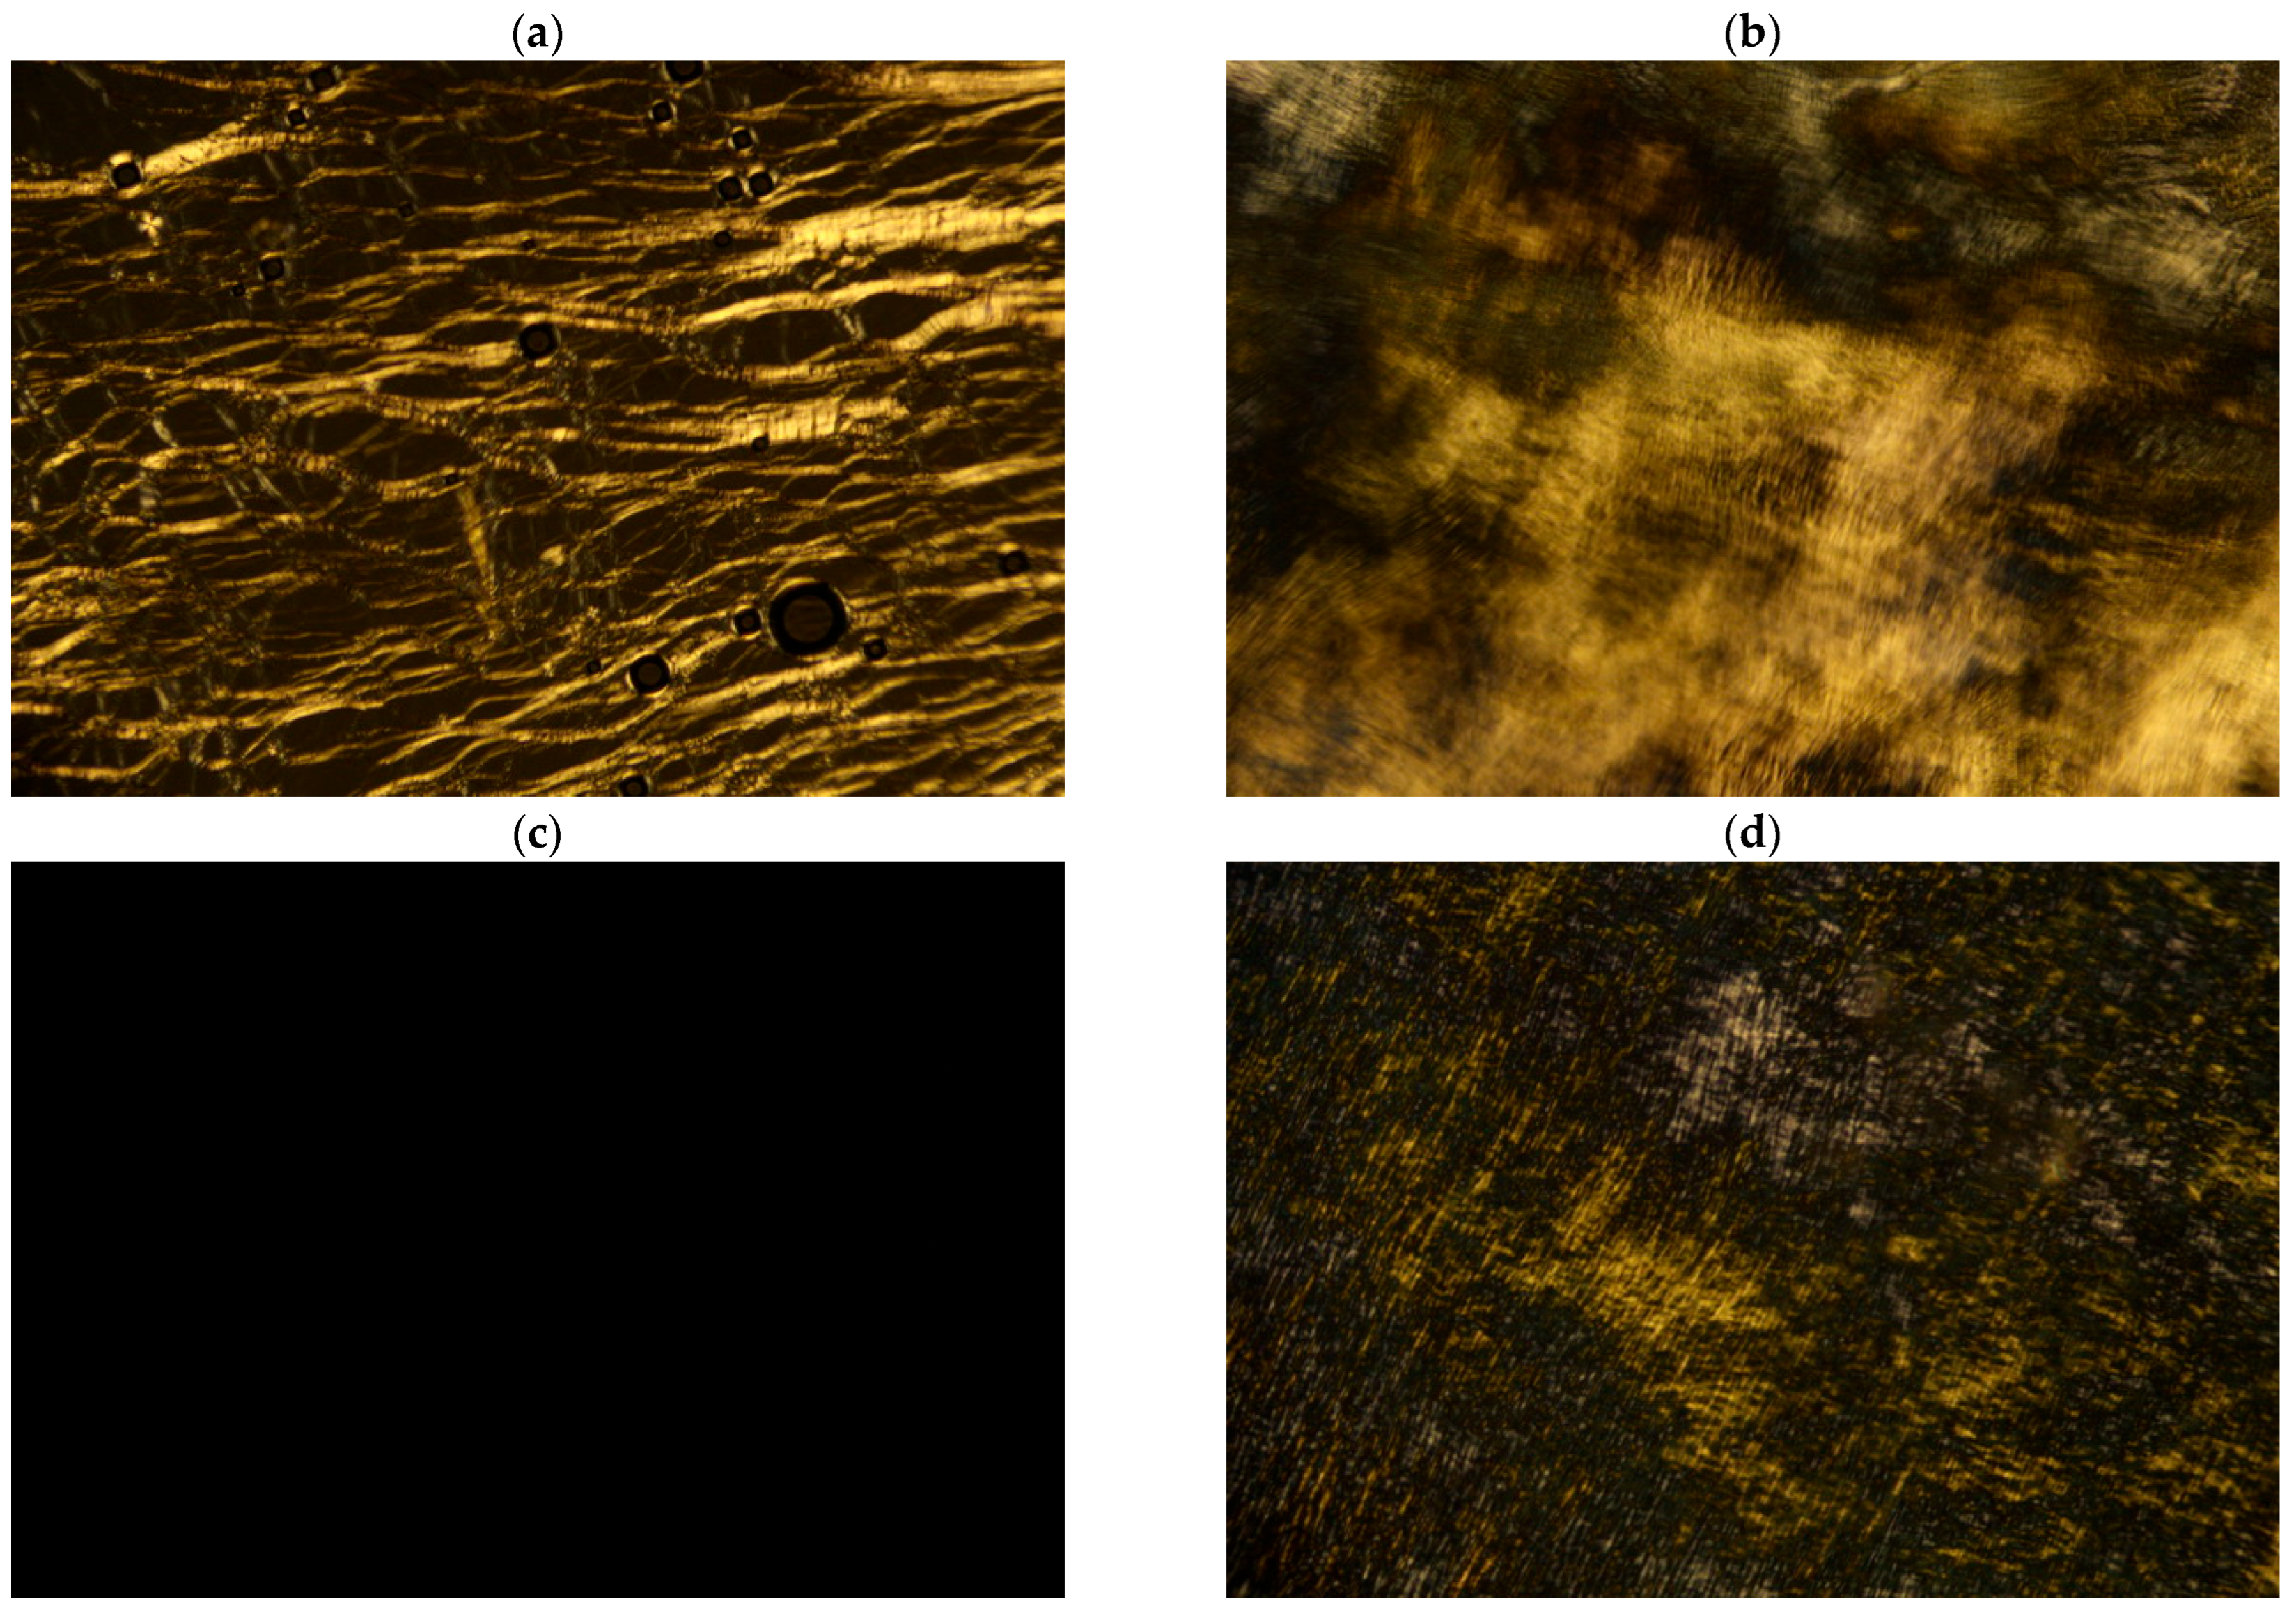
Polarizing optical microscopy (POM) is a simple and easy method to investigate the lyotropic liquid crystal phases of surfactant mixed systems, because different liquid crystal phases can show anisotropy (e.g., lamellar phase and hexagonal phase) or isotropy (e.g., micellar phase and cubic phase) under polarized light [28,29,30]. For example, the lamellar phase usually shows oily-streak POM texture, and the hexagonal phase usually shows irregular POM texture. Therefore, POM can be used to preliminarily determine the phase of each AES/CAPB/H2O sample.
Representative samples were selected to show the typical POM textures, with their corresponding components summarized in Table 1. As shown in Figure 3a, the bright oily-streaks texture was clearly observed for sample α. It indicates the formation of lamellar phase (Lα) in sample α [31]. When the proportion of AES (70%) decreased from 87.5 wt.% to 60 wt.%, the bright irregular non-geometrical texture corresponding to the hexagonal phase (H1) was observed (Figure 3b), indicating the occurrence of phase transition. The lamellar phase (sample α) has been transformed to the hexagonal phase (sample β). When the proportion of AES (70%) was further reduced to 12 wt.% (sample γ), a typical micellar solution (L1) was obtained, and a dark field was observed.
Interestingly, when the proportion of CAPB (38%) was increased from 10 wt.% (sample γ) to 20 wt.% (sample δ), the POM image also showed a dark field (Figure 3c), but the viscosity increased significantly from 0.02 Pa∙s (sample γ) to 29.88 Pa∙s (sample δ). The dark field means that sample δ is isotropic, which may be the micellar phase or the cubic phase. However, the cubic phase has been reported to be very viscous and stiff [8], usually with a viscosity higher than 200 Pa∙s [12], even reaching 103 Pa∙s [9,32]. Importantly, the cubic phase can be easily identified by small angle X-ray scattering spectra with a specific ratio of Bragg peaks, whereas the micellar phase usually only exhibits a signal broad scattering peak because the short-range order of their mesoscopic structure is not sufficient to define a crystal lattice [33]. Thus, small angle X-ray scattering can further identify whether the sample with the dark field belongs to the micellar phase or the cubic phase.
For sample ε with higher AES and CAPB concentrations than sample δ, some weak irregular textures were observed by POM (Figure 3d), and its viscosity further increased to 47.28 Pa∙s. Although the POM texture of sample ε showed some characteristics of hexagonal phase, its viscosity was significantly lower than the hexagonal phase (e.g., sample β). Therefore, in order to confirm their phases, all samples were further analyzed using small angle X-ray scattering.
3.2. Small Angle X-ray Scattering Measurement
Small angle X-ray scattering (SAXS) is an effective way to study the micro-structure of substances because it can obtain accurate structural information. Therefore, it is also widely used to identify the liquid crystalline phases of surfactant mixture systems [34,35]. The ratio of spacings between allowed (reciprocal) lattice Bragg reflections varies with liquid crystalline phases: For the lamellar phase, the ratio of spacings is 1:2:3:4…; For hexagonal phase, the ratio of spacings is …; For cubic phases, the typical ratio of spacings is ... (I1, V1) or …(V1) [33].
As can be seen from Figure 4a, three Bragg peaks were observed for sample α at q values of 0.1368 (q1), 0.2731 (q2), and 0.4099 (q3). The ratio of q values was calculated to be 1:2:3 (q1:q2:q3), which is the characteristic of the lamellar phase. For sample β (Figure 4b), the ratio of the observed three Bragg peak q values was 1:: (q1:q2:q3 = 0.1113:0.1921:0.2227), which is consistent with the characteristic of the hexagonal phase. Furthermore, well-defined scattering rings were observed in the two-dimensional SAXS patterns of sample α and β (Figure S1a,b). With the results of POM and SAXS, sample α and sample β could be identified as lamellar phase and hexagonal phase, respectively. The repeat distance (d) of the lamellar phase of sample α calculated by Equation (1) [7] was 4.59 nm, while the distance from the center of one cylinder to another in the hexagonal phase (dH) of sample β calculated by Equation (2) [7] was 6.52 nm.
For sample δ, only a single broad peak was observed with extremely low intensity (about 0.05, Figure 4c) in its SAXS spectrum, which is completely inconsistent with the characteristics of cubic phases but consistent with the micellar phase [36]. Additionally, only a diffuse scattering ring was observed in the two-dimensional SAXS pattern of sample δ (Figure S1c). Therefore, sample δ can be identified as a micellar phase (L1).
For sample ε, the SAXS spectrum indicates that it is inconsistent with the characteristic of the hexagonal phase (Figure 4d). Compared with sample δ (Figure 4c), besides the broad peak with very low intensity, a stronger peak was formed in sample ε. The two-dimensional SAXS pattern of sample ε also showed a red scattering ring overlapping with a weak diffuse green scattering ring (Figure S1d). It indicates that as the concentration increases (sample δ → ε), the order of their mesoscopic structure is significantly enhanced, but the liquid crystal phase has not yet been completely formed. Thus, based on the weak irregular textures of the POM image of sample ε (Figure 3d), it may be the transition phase from the L1 phase to the H1 phase.
3.3. Phase Behavior of AES/CAPB/H2O Ternary System
The single phases and transition region for the AES/CAPB/H2O system were identified through POM, viscosity, and SAXS and used to construct the ternary phase diagram of the AES/CAPB/H2O system at room temperature, as shown in Figure 5. Three single phases were observed: normal micellar phase (L1), normal hexagonal phase (H1), and lamellar phase (Lα). In addition, there is one transition region (L1 → H1) in the phase diagram.
As can be seen from Figure 5, the normal micellar phase (L1) almost occupies the left half of the phase diagram. When the proportion of AES (70%) is lower than 10 wt.% or the proportions of AES (70%) and CAPB (38%) are both low, the viscosity of the L1 phase is low (<10 Pa∙s), which may be ascribed to the high water content in both AES (70%) (water content: 30 wt.%) and CAPB (38%) (water content: 62 wt.%). When the proportion of AES (70%) ranges from 10 wt.% to 40 wt.%, the viscosity of the L1 phase is high (>10 Pa∙s), which may be attributed to the formation of worm-like micelles.
For liquid crystal phases, the H1 phase occupies a significantly larger area than the Lα phase. The combination of medium-high proportions of AES (70%) (45–95 wt.%) and low proportions of CAPB (38%) (0–20 wt.%) is easy to form the H1 phase, and the same is true for the combination of medium-high proportions of CAPB (38%) (60–90 wt.%) and low-medium proportions of AES (70%) (10–40 wt.%). Moreover, when the proportion of H2O is low, the Lα phase appears for a wide CAPB (38%) proportion range of 0–60 wt.%, along the AES/CAPB binary axis.
3.4. Viscosity Distribution of AES/CAPB/H2O Ternary System
To reveal the relationship between phases and viscosity, the viscosity distribution of the AES/CAPB/H2O system is shown in Figure 5. It can be seen that the whole phase diagram is divided into four color regions: (1) Green. Viscosity: <10 Pa∙s; (2) Yellow. Viscosity range: 10–100 Pa∙s; (3) Pink. Viscosity range: 100–200 Pa∙s; and (4) Blue. Viscosity: >200 Pa∙s.
Among all three phases, the L1 phase has the lowest viscosity and is partially below 10 Pa∙s, which means it has excellent fluidity. For the Lα phase, a part has a viscosity between 10 to 100 Pa∙s with good fluidity, while the part adjacent to the H1 phase has a viscosity above 200 Pa∙s with poor fluidity. In addition, the whole H1 phase has a very high viscosity greater than 200 Pa∙s with poor fluidity. Interestingly, there are only a few areas in the viscosity range of 100–200 Pa∙s (pink), located in the transition region (L1 → H1) adjacent to the H1 phase. This is mainly due to the rapid increase in viscosity during the transition from the L1 phase to the H1 phase. Therefore, the L1 phase may have good application potential due to its good fluidity and low concentration of active substances.
Viscosity has an important impact on many aspects of practical applications, such as energy consumption, the diffusion rate of additives, and user experience. Since there is a significant difference in the viscosity of sample γ and sample δ, the impact of CAPB (38%) proportion on the viscosity of the AES/CAPB/H2O system (12 wt.% AES (70%)) was further investigated as shown in Figure 6a. The viscosity of the AES/CAPB/H2O system showed an upward trend as the weight percentage of CAPB (38%) increased, but there was no significant change in the CAPB (38%) range of 8–12 wt.%.
Additionally, it is known that salts, such as sodium chloride, also have an impact on the viscosity of the AES system [37,38]. Based on the results in Figure 6a, the low viscosity sample (12 wt.% AES (70%); 9 wt.% CAPB (38%); 71 wt.% H2O) was chosen as a representative sample for investigating the effect of salt concentration on the viscosity of the AES/CAPB/H2O system, and 12 wt.% AES (70%) was used as a control sample (CAPB-free). Interestingly, it can be seen from Figure 6b that as the NaCl concentration increased, the viscosity of the control sample (CAPB-free) increased in the NaCl concentration range of 1–7 wt.% and then started to decrease, while the viscosity of the representative sample (with 9 wt.% CAPB (38%)) increased in the NaCl concentration range of 1–4 wt.% and then started to decrease. Moreover, it is worth pointing out that at low NaCl concentrations, the thickening effect of NaCl on the representative sample (with 9 wt.% CAPB (38%)) is significantly better than the control sample (CAPB-free). Therefore, salts and CAPB may have a synergistic effect on increasing the viscosity of the AES/CAPB/H2O system.
As a practical application, in addition to NaCl, disodium edetate dihydrate (EDTA-2Na) and citric acid are often added to the AES/CAPB/H2O system as chelating agents and pH adjusters, respectively. Thus, a basic formula (AES (70%): 12 wt.%, NaCl: 1.2 wt.%, EDTA-2Na: 0.10 wt.%, and citric acid: 0.15 wt.%) was adopted to further study the effect of the weight percentage of CAPB (38%) on the viscosity of the AES/CAPB/H2O system. Compared to the salt-free AES/CAPB/H2O system (Figure 6a), the salt-containing formula exhibited significantly higher viscosity in the CAPB (38%) range of 8–12 wt.%, with a sharp increase in viscosity at 10 wt.% CAPB (38%). The representative samples are summarized in Table 2. To reveal the reason for the sharp increase in viscosity, rheological measurements were further performed.
3.5. Rheological Properties
The variations in the viscosity (η) versus the shear rate () for the three samples in Table 2 were measured in the shear rate range of 0.01–100 s−1, as shown in Figure 7. It can be seen that the viscosity of all three samples decreased with increasing shear rate, exhibiting the characteristics of a shear-thinning fluid. Although the viscosities of the three samples were significantly different at low shear rates (sample 3 > sample 2 > sample 1), their viscosities were similar at high shear rates (100 s−1), and all decreased to around 1 Pa∙s. The data from the three samples were further fitted and analyzed using Cross-model Equation (3), and the obtained zero-shear-rate viscosity (η0) and R2 are summarized in Table 2.
In addition, when the shear rate was in the range of 0.01–1 s−1, the viscosities of both samples 1 and 2 decreased first (shear rate: 0.01–0.1 s−1) and then tended to a constant value (shear rate: 0.1–1 s−1). It indicates that the entanglement or multi-connected effect between the surfactant molecules in sample 1 and sample 2 is insufficient or uneven. Therefore, even at very low shear rates, part of the entangled or multi-connected structure is destroyed by shear, resulting in a certain degree of viscosity drop. The viscosity of sample 3 appears to be a constant value in the range of 0.01–1 s−1, which is similar to the first Newtonian zone of polymer fluids, indicating that the entanglement or multi-connected effect is strong enough to overcome the destructive effect of low shear (0.01–1 s−1).
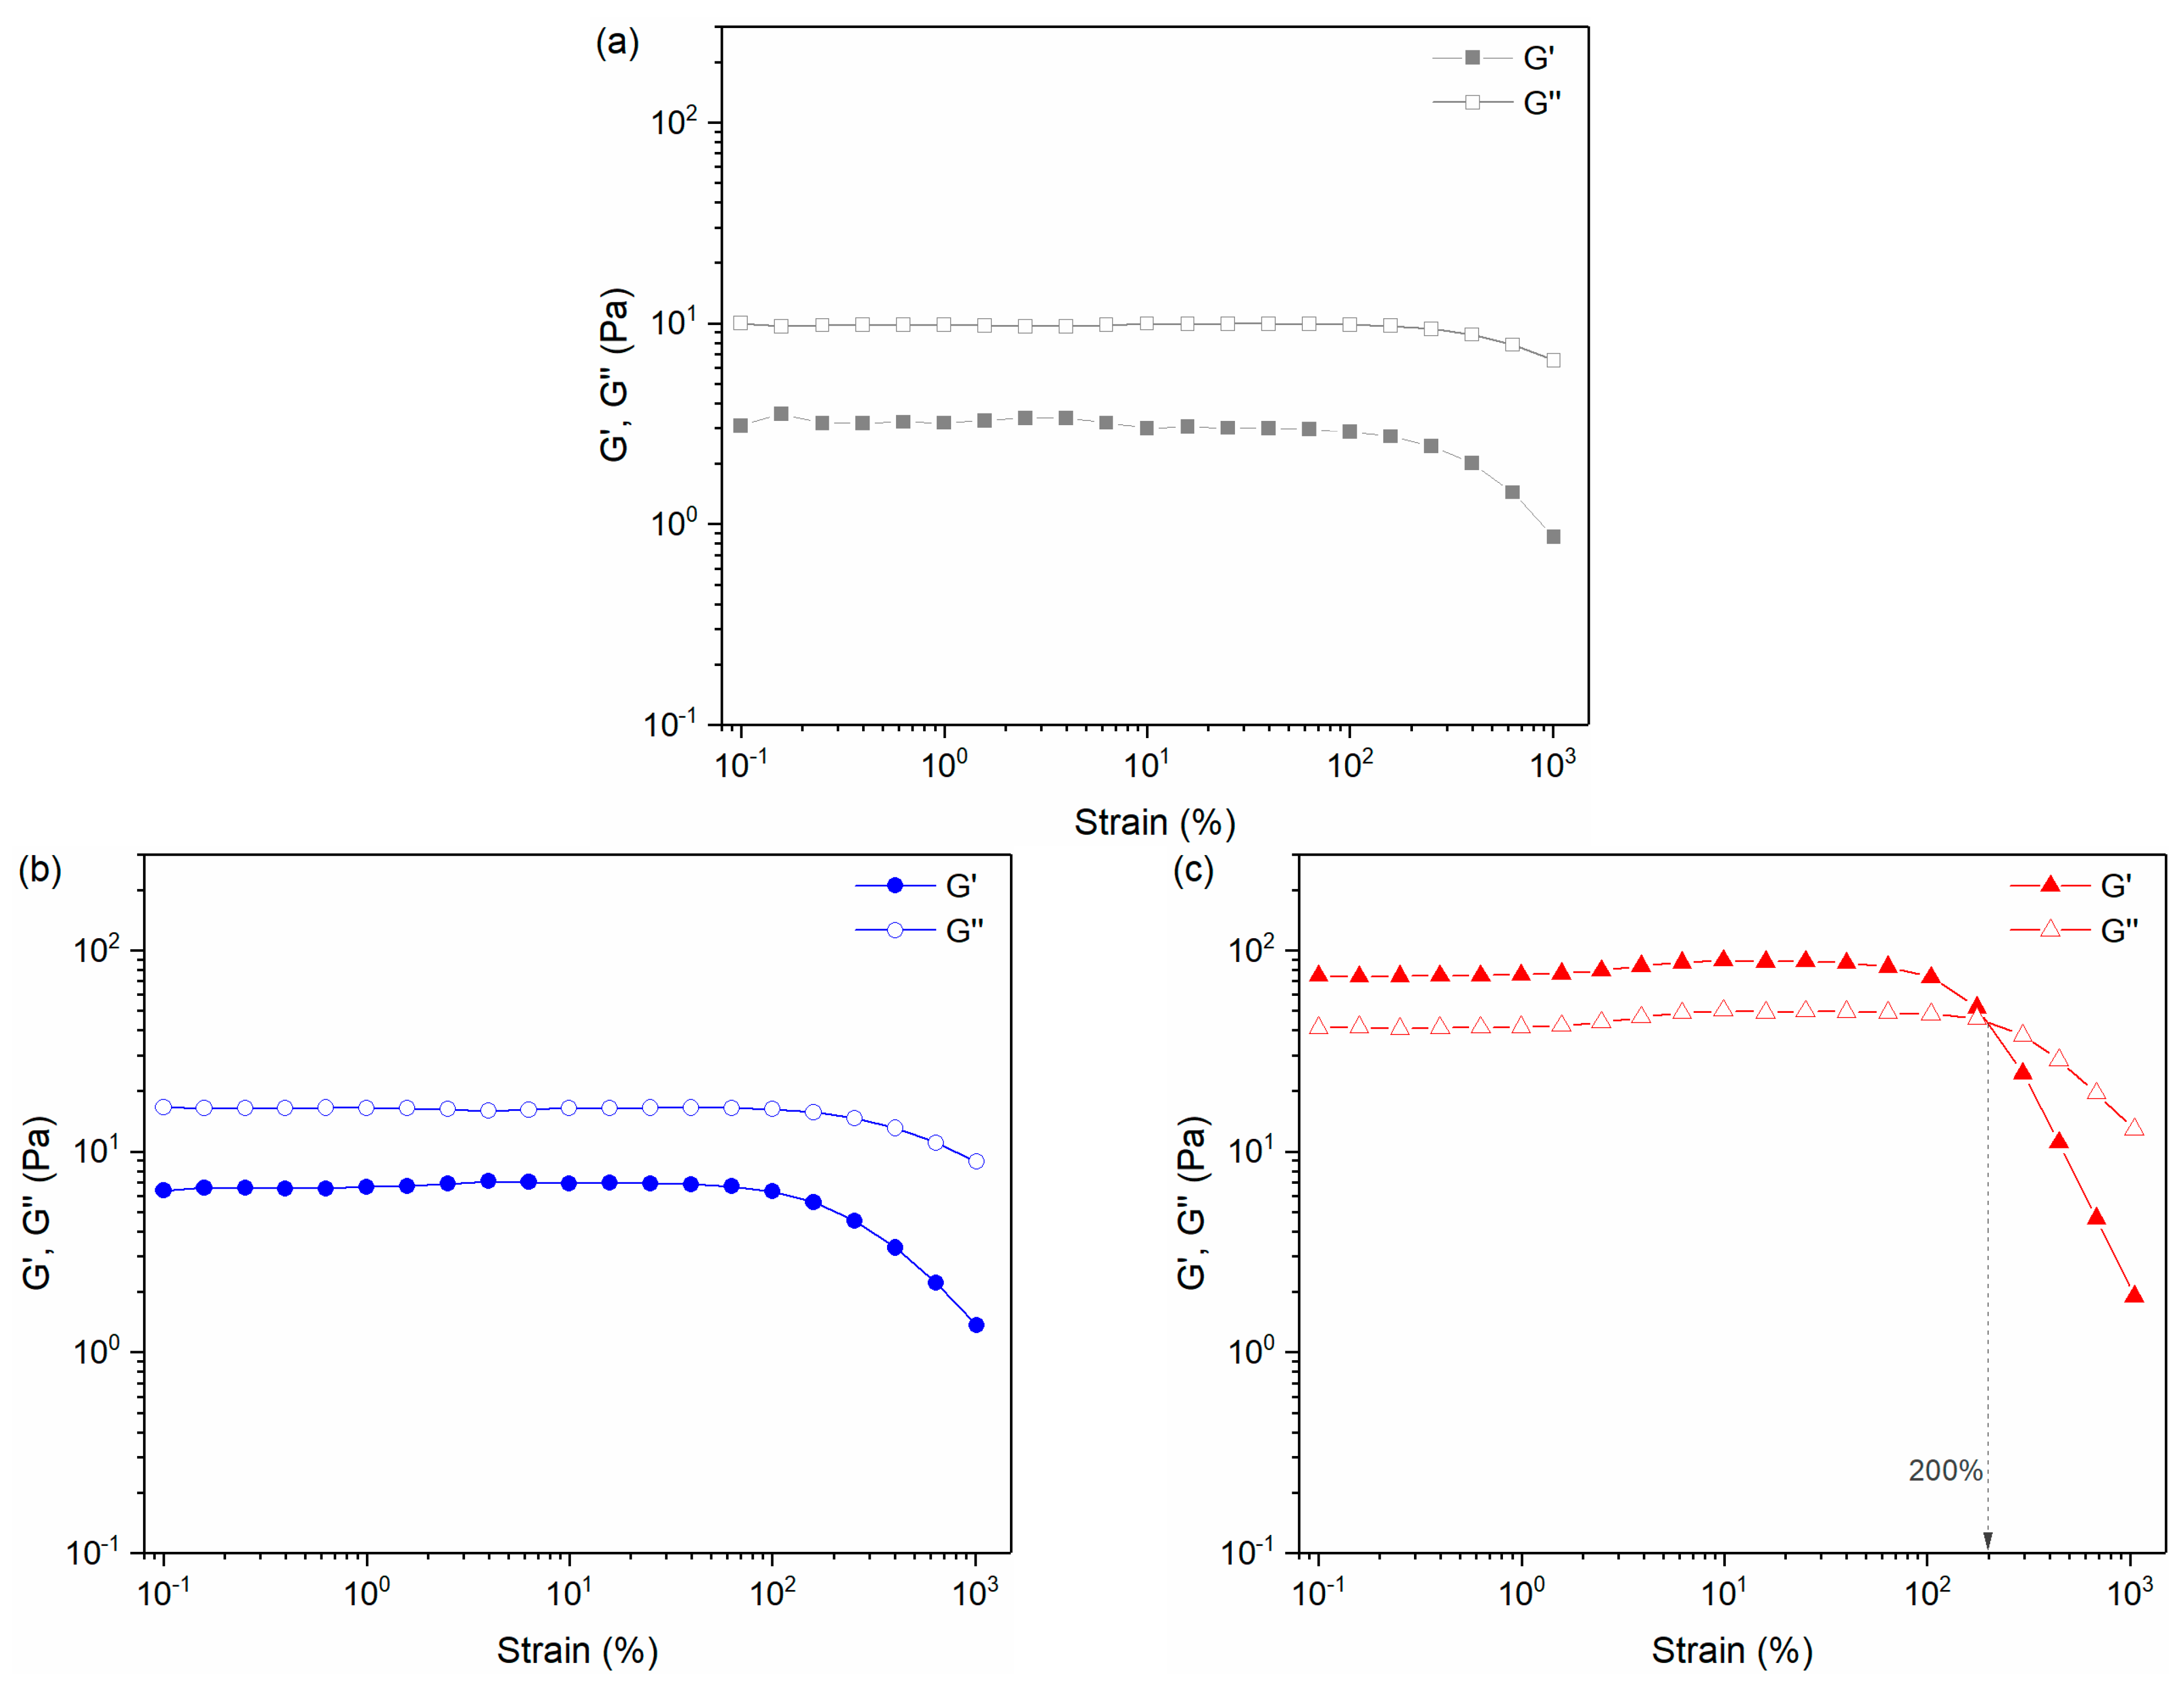
Strain sweep test was performed in the shear strain range of 0.1% to 1000% with a fixed frequency of 1 Hz to investigate the changing trends of elastic modulus (G′) and loss modulus (G″) with shear strain. As shown in Figure 8, with the increase in CAPB (38%) from 8 wt.% to 10 wt.%, both G′ and G″ increased (sample 3 > sample 2 > sample 1), and the G′ and G″ of sample 3 (10 wt.% CAPB (38%), Figure 8c) were much higher than that of sample 1 (8 wt.% CAPB (38%), Figure 8a) and sample 2 (9 wt.% CAPB (38%), Figure 8b). In addition, the G′ and G″ of the three samples all decreased under the high shear strain (>100%).
Interestingly, for sample 1 (Figure 8a) and sample 2 (Figure 8b), G′ was lower than G″ over all tested shear strain ranges, indicating a dominant role of viscosity. For sample 3 (Figure 8c), when the shear strain was less than 200%, G′ was greater than G″, and the elasticity dominated. It indicates that when CAPB (38%) reaches 10 wt.%, the entanglement or multi-connected effect of micelles is significantly enhanced to form a cross-linked structure, resulting in the formation of a gel-like state. This may be the reason for the sharp increase in viscosity when the proportion of CAPB (38%) reached 10 wt.%. When the shear strain was higher than 200%, G′ was lower than G″, and the viscosity dominated. This indicates that under the action of high shear strain, the entanglement or multi-connected effect of micelles in sample 3 is destroyed, resulting in the transition from a gel-like state to fluid.
4. Conclusions
In this work, the phase behavior of the AES/CAPB/H2O system was investigated, and three single phases (L1, H1, and Lα) and one transition region (L1 → H1) were observed. The left half of the phase diagram was almost occupied by the L1 phase, while in the right half of the phase diagram, the area occupied by the H1 phase was significantly larger than the Lα phase. The long and narrow L1 → H1 transition region was located between the L1 phase and the H1 phase. In terms of viscosity distribution, the H1 phase had the largest viscosity (>200 Pa∙s), followed by the Lα phases and the L1 → H1 transition region (10–200 Pa∙s), and the L1 phase had the smallest viscosity. Additionally, the viscosity results showed that CAPB and low concentrations of salts had a synergistic effect on the thickening of the AES/CAPB/H2O system. Rheological results revealed that in a salt-containing formula, a small change in the proportion of CAPB may cause the AES/CAPB/H2O system to transform from a fluid to a gel-like state. This work not only enriches the phase diagram of surfactant systems but also has important guiding significance for the design and development of cleaning products.
Supplementary Materials
The following supporting information can be downloaded at: https://www.mdpi.com/article/10.3390/app14093605/s1, Figure S1: the two-dimensional SAXS patterns of (a) sample α, (b) sample β, (c) sample δ and (d) sample ε at 25 °C.
Author Contributions
Conceptualization, G.Z.; methodology, X.W.; formal analysis, X.W. and G.Z.; investigation, X.W.; data curation, X.W. and P.W.; writing—original draft preparation, X.W.; writing—review and editing, G.Z. and P.W.; supervision, G.Z. All authors have read and agreed to the published version of the manuscript.
Funding
This research was funded by the Research Foundation of Hubei Provincial Key Laboratory of Green Materials for Light Industry and Collaborative Innovation Center of Green Light-weight Materials and Processing (201907B08).
Institutional Review Board Statement
Not applicable.
Informed Consent Statement
Not applicable.
Data Availability Statement
Data is contained within the article and Supplementary Materials.
Acknowledgments
Guangzhou KLD New Material Technology Co., Ltd. is greatly acknowledged for providing experimental materials.
Conflicts of Interest
The authors declare no conflicts of interest.
References
- Fernández-Ramos, C.; Ballesteros, O.; Zafra-Gómez, A.; Camino-Sánchez, F.J.; Blanc, R.; Navalón, A.; Pérez-Trujillo, J.P.; Vílchez, J.L. Evaluation of the levels of alcohol sulfates and ethoxysulfates in marine sediments near wastewater discharge points along the coast of Tenerife Island. Mar. Pollut. Bull. 2014, 79, 107–113. [Google Scholar] [CrossRef] [PubMed]
- Sasi, S.; Rayaroth, M.P.; Aravindakumar, C.T.; Aravind, U.K. Alcohol ethoxysulfates (AES) in environmental matrices. Environ. Sci. Pollut. Res. 2021, 28, 34167–34186. [Google Scholar] [CrossRef] [PubMed]
- Sibila, M.A.; Garrido, M.C.; Perales, J.A.; Quiroga, J.M. Ecotoxicity and biodegradability of an alkyl ethoxysulphate surfactant in coastal waters. Sci. Total Environ. 2008, 394, 265–274. [Google Scholar] [CrossRef] [PubMed]
- Topliceanu, S.; Almeida, M.; Oliveira, M.; Cogălniceanu, D.; Lopes, I. The Number of Ethylene Oxide Groups of Sulphate-Based Surfactants Influences the Cytotoxicity of Mixed Micelles to an Amphibian Cell Line. Appl. Sci. 2023, 13, 8745. [Google Scholar] [CrossRef]
- Acharya, D.P.; Varade, D.; Aramaki, K. Effect of temperature on the rheology of wormlike micelles in a mixed surfactant system. J. Colloid Interface Sci. 2007, 315, 330–336. [Google Scholar] [CrossRef] [PubMed]
- Savignano, L.; Fabozzi, A.; Vitiello, R.; Fornasier, M.; Murgia, S.; Guido, S.; Guida, V.; Paduano, L.; D’Errico, G. Effect of tail branching on the phase behavior and the rheological properties of amine oxide/ethoxysulfate surfactant mixtures. Colloids Surf. A Physicochem. Eng. Asp. 2021, 613, 126091. [Google Scholar] [CrossRef]
- Wang, Z.; Diao, Z.; Liu, F.; Li, G.; Zhang, G. Microstructure and rheological properties of liquid crystallines formed in Brij 97/water/IPM system. J. Colloid Interface Sci. 2006, 297, 813–818. [Google Scholar] [CrossRef]
- Alexandridis, P.; Olsson, U.; Lindman, B. A Record Nine Different Phases (Four Cubic, Two Hexagonal, and One Lamellar Lyotropic Liquid Crystalline and Two Micellar Solutions) in a Ternary Isothermal System of an Amphiphilic Block Copolymer and Selective Solvents (Water and Oil). Langmuir 1998, 14, 2627–2638. [Google Scholar] [CrossRef]
- Alam, M.M.; Ushiyama, K.; Aramaki, K. Phase Behavior, Formation, and Rheology of Cubic Phase and Related Gel Emulsion in Tween80/Water/Oil Systems. J. Oleo Sci. 2009, 58, 361–367. [Google Scholar] [CrossRef]
- Liu, Y.; Dang, L.; Tan, H.; Wei, H. Phase Behavior of Commercial AES/Ethanol/H2O Ternary System. J. Dispers. Sci. Technol. 2016, 37, 633–639. [Google Scholar] [CrossRef]
- Godoy, C.A.; Valiente, M.; Muñoz, W.; Bonilla, P.; Pons, R.; Montalvo, G. Microstructural and Viscoelastic Properties of Liquid Crystal Phases of Soybean Lecithin with Olive and Castor Oils at Low Water Contents. J. Chem. Eng. Data 2023, 68, 1534–1542. [Google Scholar] [CrossRef]
- Li, H.; Dang, L.; Yang, S.; Li, J.; Wei, H. The study of phase behavior and rheological properties of lyotropic liquid crystals in the LAS/AES/H2O system. Colloids Surf. A Physicochem. Eng. Asp. 2016, 495, 221–228. [Google Scholar] [CrossRef]
- Pan, Y.; Dang, L.; Wei, H. Phase Behavior and Rheological Properties of Poly(vinyl alcohol)/AES/Water System. J. Phys. Chem. B 2021, 125, 3230–3237. [Google Scholar] [CrossRef]
- Montalvo, G.; Valiente, M.; Rodenas, E. Rheological Properties of the L Phase and the Hexagonal, Lamellar, and Cubic Liquid Crystals of the CTAB/Benzyl Alcohol/Water System. Langmuir 1996, 12, 5202–5208. [Google Scholar] [CrossRef]
- Różańska, S. Rheology of wormlike micelles in mixed solutions of cocoamidopropyl betaine and sodium dodecylbenzenesulfonate. Colloids Surf. A Physicochem. Eng. Asp. 2015, 482, 394–402. [Google Scholar] [CrossRef]
- Yang, J. Viscoelastic wormlike micelles and their applications. Curr. Opin. Colloid Interface Sci. 2002, 7, 276–281. [Google Scholar] [CrossRef]
- Fundarò, S.P.; Salti, G.; Malgapo, D.M.H.; Innocenti, S. The Rheology and Physicochemical Characteristics of Hyaluronic Acid Fillers: Their Clinical Implications. Int. J. Mol. Sci. 2022, 23, 10518. [Google Scholar] [CrossRef]
- Wei, H.; Zhang, R.; Lei, Z.; Dang, L. Synergistic Effect of Cocamidopropyl Betaine and Sodium Lauroyl Sarcosinate. Trans. Tianjin Univ. 2021, 27, 366–376. [Google Scholar] [CrossRef]
- Stancheva, T.N.; Georgiev, M.T.; Radulova, G.M.; Danov, K.D.; Marinova, K.G. Rheology of saturated micellar networks: Wormlike micellar solutions vs. bicontinuous micellar phases. Colloids Surf. A Physicochem. Eng. Asp. 2022, 652, 129927. [Google Scholar] [CrossRef]
- Stanimirova, R.D.; Kralchevsky, P.A.; Danov, K.D.; Xu, H.; Ung, Y.W.; Petkov, J.T. Oil drop deposition on solid surfaces in mixed polymer-surfactant solutions in relation to hair- and skin-care applications. Colloids Surf. A Physicochem. Eng. Asp. 2019, 577, 53–61. [Google Scholar] [CrossRef]
- Yavrukova, V.I.; Radulova, G.M.; Danov, K.D.; Kralchevsky, P.A.; Xu, H.; Ung, Y.W.; Petkov, J.T. Rheology of mixed solutions of sulfonated methyl esters and betaine in relation to the growth of giant micelles and shampoo applications. Adv. Colloid Interface Sci. 2020, 275, 102062. [Google Scholar] [CrossRef]
- Anachkov, S.E.; Georgieva, G.S.; Abezgauz, L.; Danino, D.; Kralchevsky, P.A. Viscosity Peak due to Shape Transition from Wormlike to Disklike Micelles: Effect of Dodecanoic Acid. Langmuir 2018, 34, 4897–4907. [Google Scholar] [CrossRef]
- Burnett, C.L.; Bergfeld, W.F.; Belsito, D.V.; Hill, R.A.; Klaassen, C.D.; Liebler, D.; Marks, J.G.; Shank, R.C.; Slaga, T.J.; Snyder, P.W.; et al. Final Report of the Cosmetic Ingredient Review Expert Panel on the Safety Assessment of Cocamidopropyl betaine (CAPB). Int. J. Toxicol. 2012, 31, 77S–111S. [Google Scholar] [CrossRef]
- Cowan-Ellsberry, C.; Belanger, S.; Dorn, P.; Dyer, S.; McAvoy, D.; Sanderson, H.; Versteeg, D.; Ferrer, D.; Stanton, K. Environmental Safety of the Use of Major Surfactant Classes in North America. Crit. Rev. Environ. Sci. Technol. 2014, 44, 1893–1993. [Google Scholar] [CrossRef]
- Tzocheva, S.S.; Kralchevsky, P.A.; Danov, K.D.; Georgieva, G.S.; Post, A.J.; Ananthapadmanabhan, K.P. Solubility limits and phase diagrams for fatty acids in anionic (SLES) and zwitterionic (CAPB) micellar surfactant solutions. J. Colloid Interface Sci. 2012, 369, 274–286. [Google Scholar] [CrossRef]
- Georgieva, G.S.; Anachkov, S.E.; Lieberwirth, I.; Koynov, K.; Kralchevsky, P.A. Synergistic Growth of Giant Wormlike Micelles in Ternary Mixed Surfactant Solutions: Effect of Octanoic Acid. Langmuir 2016, 32, 12885–12893. [Google Scholar] [CrossRef]
- Mitrinova, Z.; Tcholakova, S.; Golemanov, K.; Denkov, N.; Vethamuthu, M.; Ananthapadmanabhan, K.P. Surface and foam properties of SLES+CAPB+fatty acid mixtures: Effect of pH for C12–C16 acids. Colloids Surf. A Physicochem. Eng. Asp. 2013, 438, 186–198. [Google Scholar] [CrossRef]
- Selivanova, N.; Gubaidullin, A.; Galyametdinov, Y. Structural transformations and phase transitions in hexagonal La-containing lyomesophases. Fluid Phase Equilibria 2023, 568, 113732. [Google Scholar] [CrossRef]
- Barai, M.; Manna, E.; Sultana, H.; Mandal, M.K.; Guchhait, K.C.; Manna, T.; Patra, A.; Chang, C.-H.; Moitra, P.; Ghosh, C.; et al. Micro-structural investigations on oppositely charged mixed surfactant gels with potential dermal applications. Sci. Rep. 2021, 11, 15527. [Google Scholar] [CrossRef]
- Li, X.; Hong, B.; Schwiedernoch, R.; Streiff, S.; Xu, Y. Self-assembly of Symmetric Double Chain Surfactants Derived from Internal Ketone in an Aqueous System. Ind. Eng. Chem. Res. 2022, 61, 7275–7283. [Google Scholar] [CrossRef]
- Boltenhagen, P.; Lavrentovich, O.; Kleman, M. Oily streaks and focal conic domains in Lα lyotropic liquid crystals. J. Phys. II France 1991, 1, 1233–1252. [Google Scholar]
- Rodríguez-Abreu, C.; García-Roman, M.; Kunieda, H. Rheology and Dynamics of Micellar Cubic Phases and Related Emulsions. Langmuir 2004, 20, 5235–5240. [Google Scholar] [CrossRef]
- Hyde, S.T. Identification of lyotropic liquid crystalline mesophases. In Handbook of Applied Surface and Colloid Chemistry; Wiley: New York, NY, USA, 2001; Volume 2, pp. 299–332. [Google Scholar]
- Dierking, I.; Al-Zangana, S. Lyotropic Liquid Crystal Phases from Anisotropic Nanomaterials. Nanomaterials 2017, 7, 305. [Google Scholar] [CrossRef]
- Wang, H.; Xu, J.; Sun, S.; Liu, Y.; Zhu, C.; Li, J.; Sun, J.; Wang, S.; Zhang, H. Characterization of Crystal Microstructure Based on Small Angle X-ray Scattering (SAXS) Technique. Molecules 2020, 25, 443. [Google Scholar] [CrossRef]
- Gupta, R.; Muralidhara, H.S.; Davis, H.T. Structure and Phase Behavior of Phospholipid-Based Micelles in Nonaqueous Media. Langmuir 2001, 17, 5176–5183. [Google Scholar] [CrossRef]
- Xiao, X.; Qi, J.; Zhou, J.; Sun, Y.; Huang, J.; Yan, Y. Enhanced salt thickening effect of the aqueous solution of peaked-distribution alcohol ether sulfates (AES). Colloids Surf. A Physicochem. Eng. Asp. 2022, 636, 128146. [Google Scholar] [CrossRef]
- Jin, P.; Wu, J.; Shi, R.; Dai, L.; Li, Y. Parabolic Viscosity Behavior of NaCl-Thickened Surfactant Systems upon Temperature Change. ACS Omega 2023, 8, 37511–37520. [Google Scholar] [CrossRef]
Figure 1.
Representative chemical structures of alkyl ethoxysulfate (AES, 2 EO) and cocamidopropyl betaine (CAPB).
Figure 1.
Representative chemical structures of alkyl ethoxysulfate (AES, 2 EO) and cocamidopropyl betaine (CAPB).
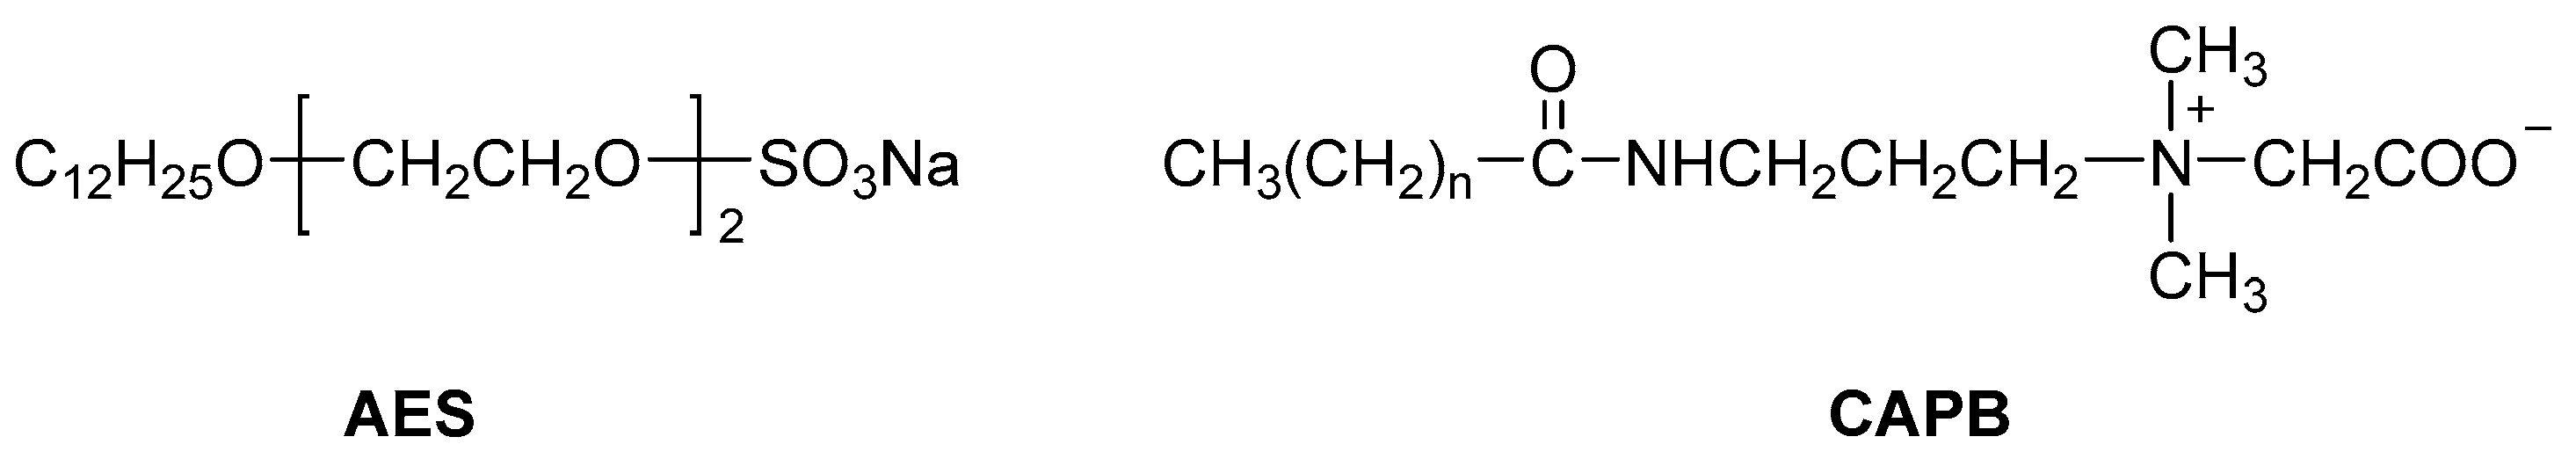
Figure 2.
Positions of the representative samples in the ternary phase diagram of the AES/CAPB/H2O system.
Figure 2.
Positions of the representative samples in the ternary phase diagram of the AES/CAPB/H2O system.
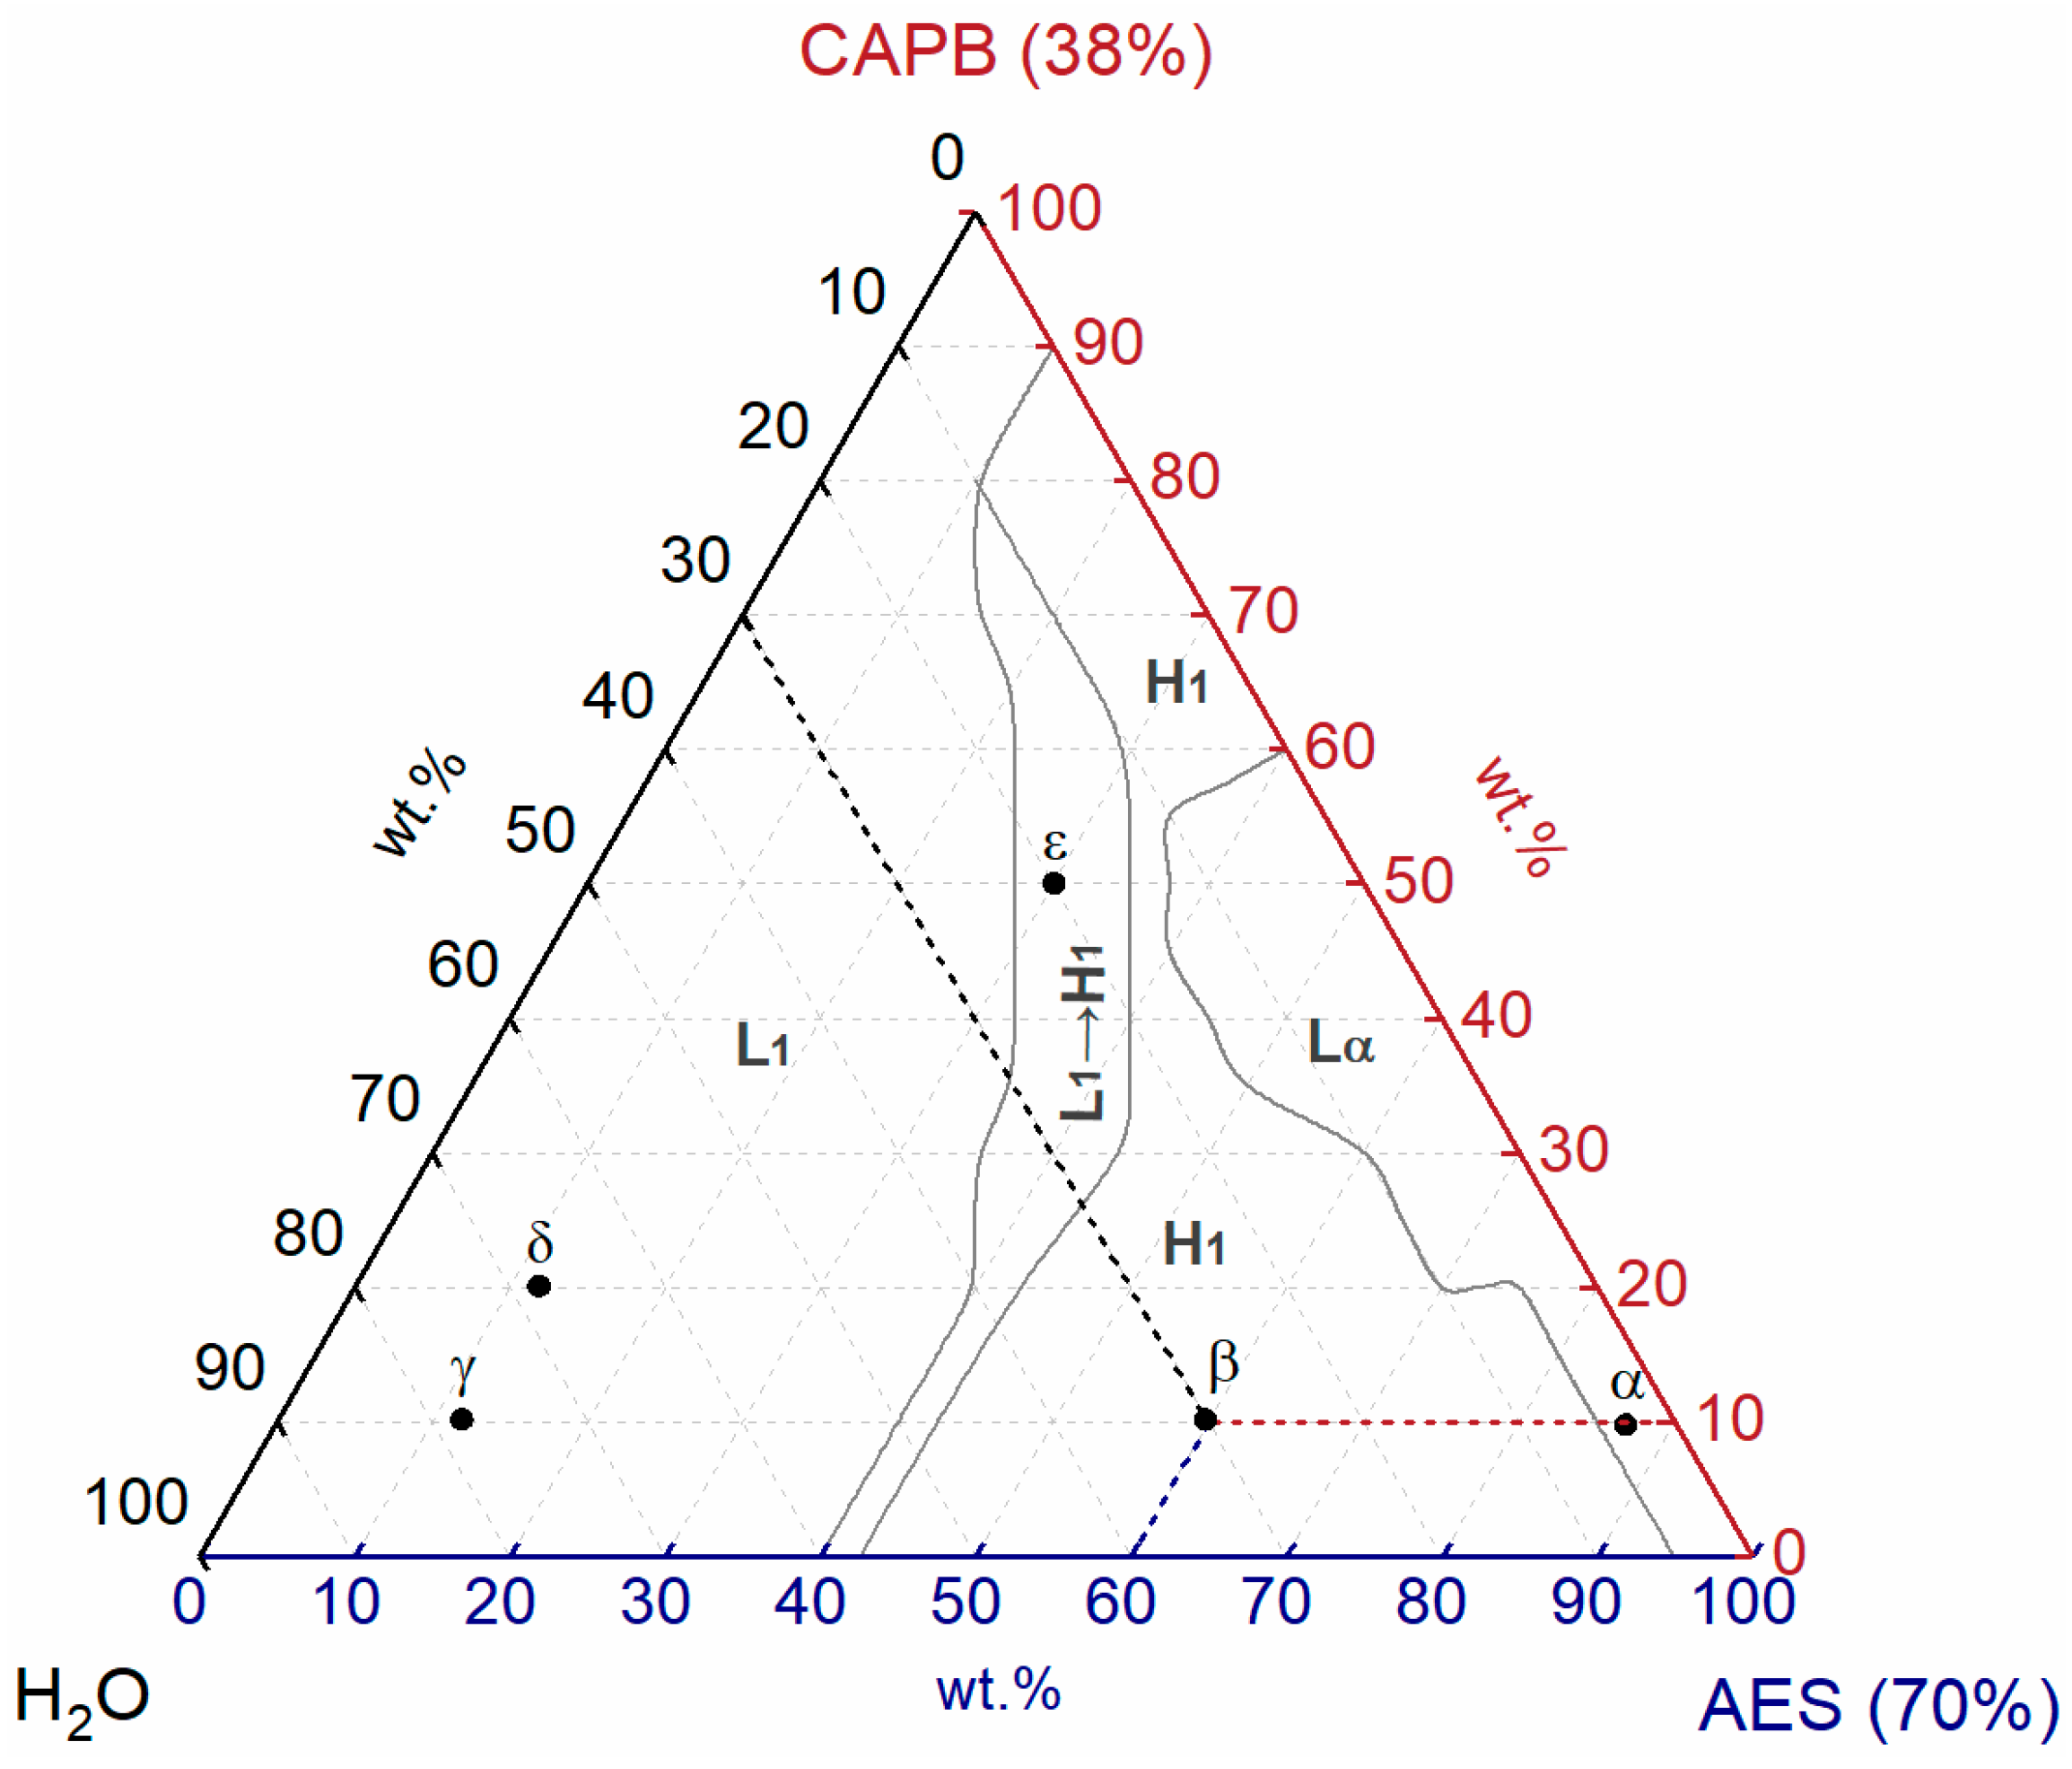
Figure 3.
POM textures of representative samples with crossed polarizers at 25 °C: (a) sample α, (b) sample β, (c) sample δ, and (d) sample ε.
Figure 3.
POM textures of representative samples with crossed polarizers at 25 °C: (a) sample α, (b) sample β, (c) sample δ, and (d) sample ε.

Figure 4.
Small angle X-ray scattering spectra of (a) sample α, (b) sample β, (c) sample δ, and (d) sample ε at 25 °C.
Figure 4.
Small angle X-ray scattering spectra of (a) sample α, (b) sample β, (c) sample δ, and (d) sample ε at 25 °C.
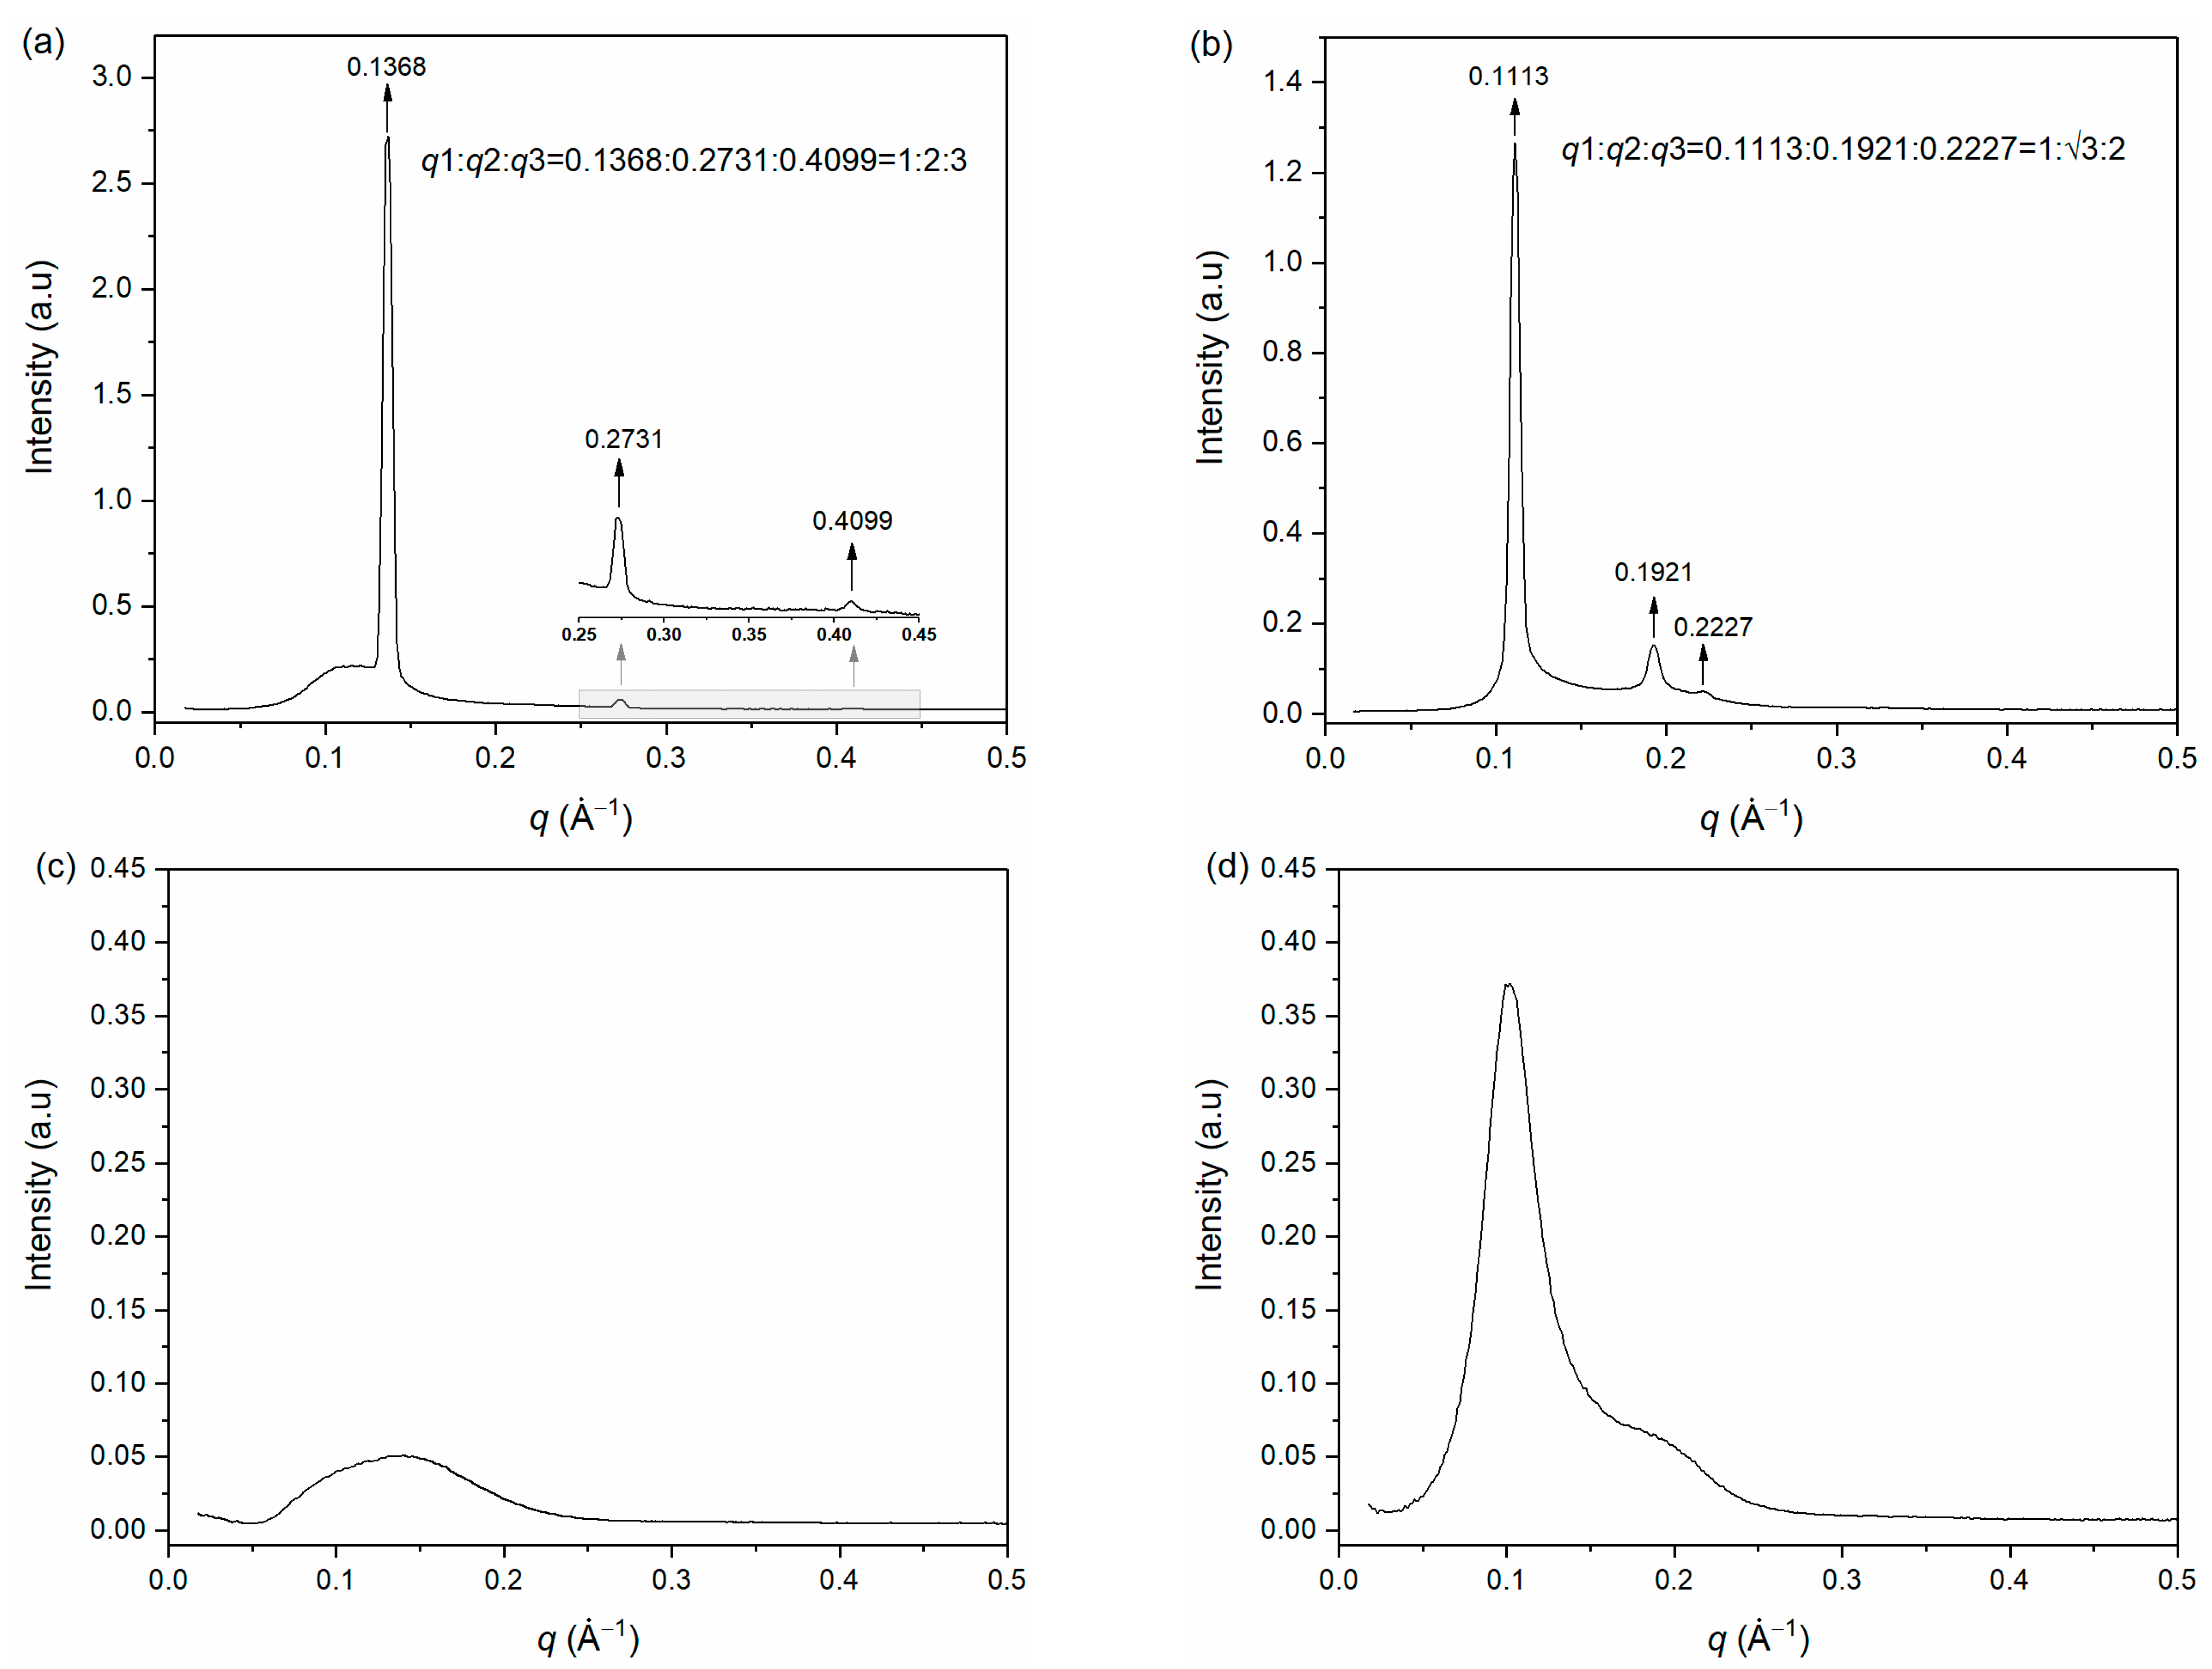
Figure 5.
Viscosity distribution of the AES/CAPB/H2O system at 25 °C.

Figure 6.
The effect of the weight percentage of (a) CAPB (38%) and (b) salts on the viscosity of the AES/CAPB/H2O system. Viscosities are expressed as means ± SD of three measurements.
Figure 6.
The effect of the weight percentage of (a) CAPB (38%) and (b) salts on the viscosity of the AES/CAPB/H2O system. Viscosities are expressed as means ± SD of three measurements.

Figure 7.
Viscosity versus the shear rate for sample 1, sample 2, and sample 3.
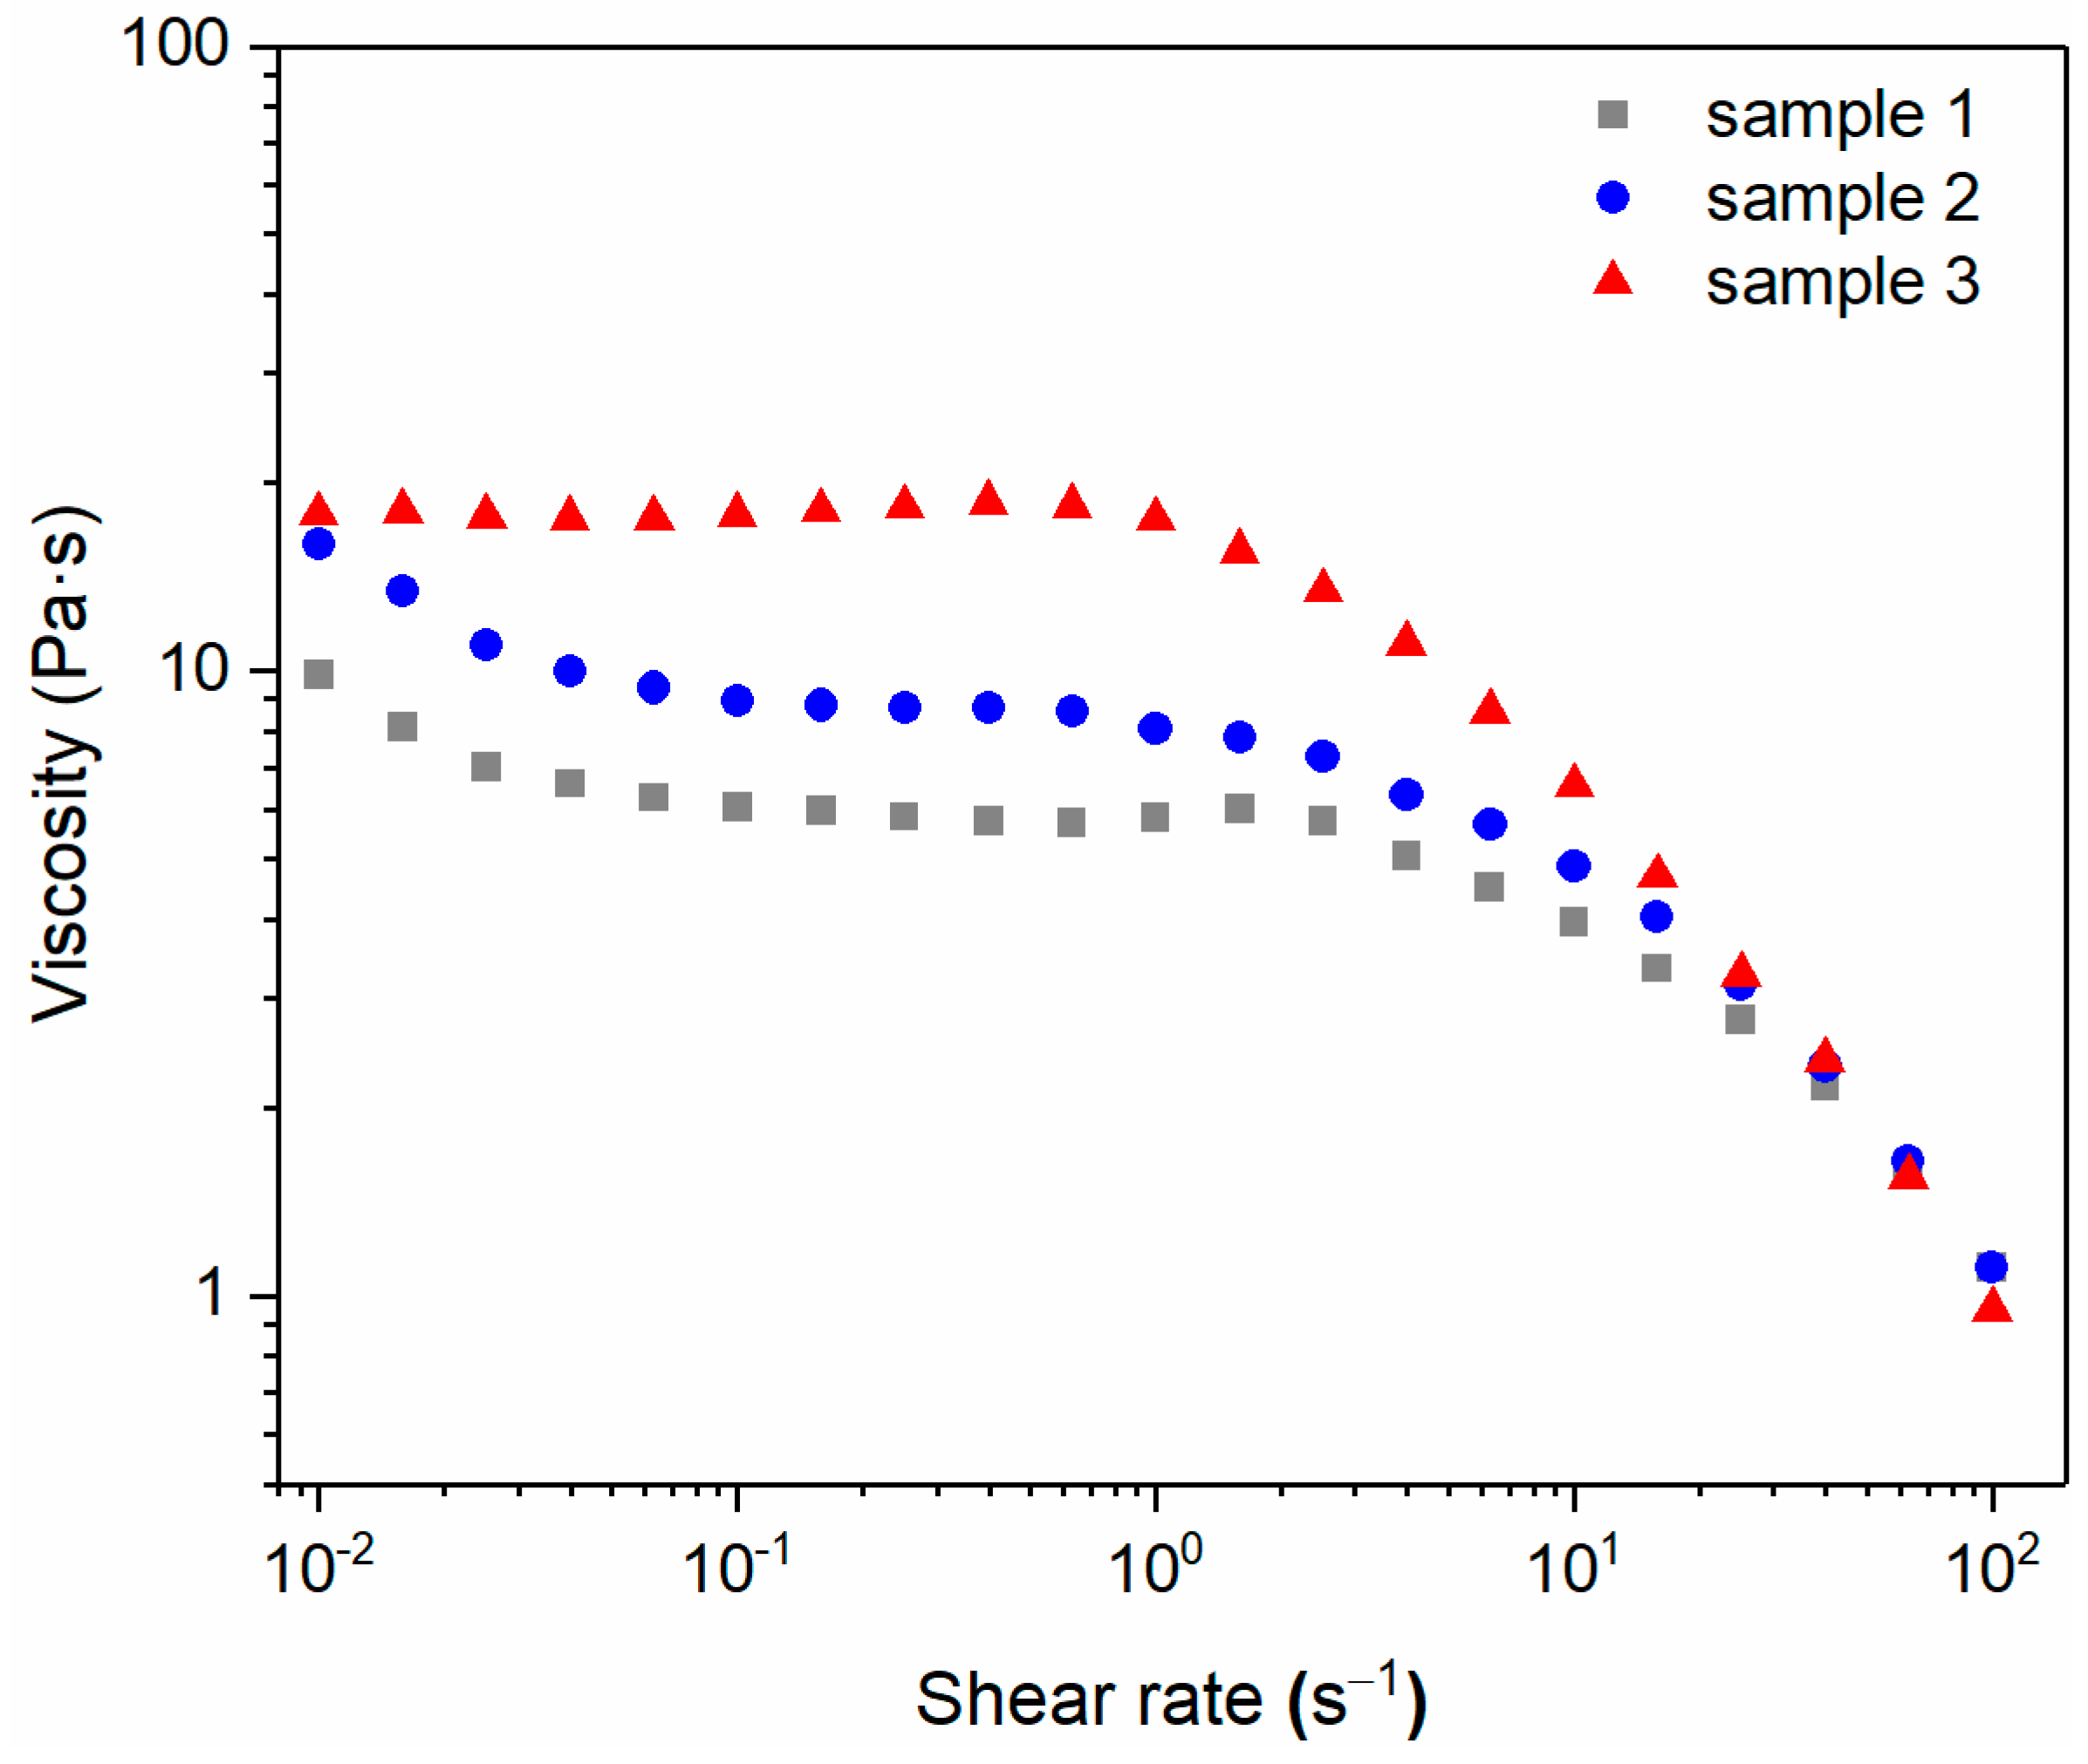
Figure 8.
Storage modulus (G′) and loss modulus (G″) versus strain sweep of the (a) sample 1, (b) sample 2, and (c) sample 3.
Figure 8.
Storage modulus (G′) and loss modulus (G″) versus strain sweep of the (a) sample 1, (b) sample 2, and (c) sample 3.


Table 1.
Compositions, phases, and viscosity of representative samples in the AES/CAPB/H2O system.
| Sample | AES (70%) (wt.%) | CAPB (38%) (wt.%) | H2O (wt.%) | Phase | Viscosity (Pa∙s) |
|---|---|---|---|---|---|
| α | 87.5 | 10 | 2.5 | Lα | 374.51 |
| β | 60 | 10 | 30 | H1 | 753.48 |
| γ | 12 | 10 | 78 | L1 | 0.02 |
| δ | 12 | 20 | 68 | L1 | 29.88 |
| ε | 30 | 50 | 20 | L1 → H1 | 47.28 |
Table 2.
Compositions and viscosities of samples 1, 2, and 3.
| Sample | CAPB (38%) (wt.%) | AES (70%) (wt.%) | H2O (wt.%) | Viscosity (Pa∙s) | η0 * | R2 |
|---|---|---|---|---|---|---|
| 1 | 8 | 12 | 80 | 5.80 | 5.99 | 0.9922 |
| 2 | 9 | 12 | 79 | 8.06 | 9.13 | 0.9977 |
| 3 | 10 | 12 | 78 | 17.53 | 18.69 | 0.9961 |
All samples contained 1.2 wt.% NaCl, 0.10 wt.% EDTA-2Na and 0.15 wt.% citric acid. * The fitting range of the shear rate is 0.1–100 s−1.
Disclaimer/Publisher’s Note: The statements, opinions and data contained in all publications are solely those of the individual author(s) and contributor(s) and not of MDPI and/or the editor(s). MDPI and/or the editor(s) disclaim responsibility for any injury to people or property resulting from any ideas, methods, instructions or products referred to in the content. |
© 2024 by the authors. Licensee MDPI, Basel, Switzerland. This article is an open access article distributed under the terms and conditions of the Creative Commons Attribution (CC BY) license (https://creativecommons.org/licenses/by/4.0/).
Share and Cite
MDPI and ACS Style
Wu, X.; Zhang, G.; Wang, P. Phase Behavior and Rheological Properties of AES/CAPB/H2O Ternary System. Appl. Sci. 2024, 14, 3605. https://doi.org/10.3390/app14093605
AMA Style
Wu X, Zhang G, Wang P. Phase Behavior and Rheological Properties of AES/CAPB/H2O Ternary System. Applied Sciences. 2024; 14(9):3605. https://doi.org/10.3390/app14093605
Chicago/Turabian StyleWu, Xinran, Guangyan Zhang, and Peng Wang. 2024. "Phase Behavior and Rheological Properties of AES/CAPB/H2O Ternary System" Applied Sciences 14, no. 9: 3605. https://doi.org/10.3390/app14093605
Note that from the first issue of 2016, this journal uses article numbers instead of page numbers. See further details here.