Article

A Methodology for Estimating the Assembly Position of the Process Based on YOLO and Regression of Operator Hand Position and Time Information

Korea Institute of Industrial Technology, Cheonan 31056, Republic of Korea
*
Author to whom correspondence should be addressed.
Appl. Sci. 2024, 14(9), 3611; https://doi.org/10.3390/app14093611
Submission received: 1 April 2024 / Revised: 12 April 2024 / Accepted: 17 April 2024 / Published: 24 April 2024
(This article belongs to the Special Issue Application of Artificial Intelligence in Engineering)

Abstract

:
These days, many assembly lines are becoming automated, leading to a trend of decreasing defect rates. However, in assembly lines that have opted for partial automation due to high cost of construction, defects still occur. The cause of defects are that the location of the work instructions and the work field are different, which is inefficient and some workers who are familiar with the process tend not to follow the work instructions. As a solution to establishing a system for object detection without disrupting the existing assembly lines, we decided to use wearable devices. As a result, it is possible to solve the problem of spatial constraints and save costs. We adopted the YOLO algorithm for object detection, an image recognition model that stands for “You Only Look Once”. Unlike R-CNN or Fast R-CNN, YOLO predicts images with a single network, making it up to 1000 times faster. The detection point was determined based on whether the pin was fastened after the worker’s hand appeared and disappeared. For the test, 1000 field data were used and the object-detection performance, mAP, was 35%. The trained model was analyzed using seven regression algorithms, among which Xgboost was the most excellent, with a result of 0.15. Distributing labeling and class-specific data equally is expected to enable the implementation of a better model. Based on this approach, the algorithm is considered to be an efficient algorithm that can be used in work fields.

1. Introduction

The most common defects during assembly include insufficient clamping force, sub-assembly material damage, bolt damage, loose bolts and cross threads/floating screws. Several production lines now use computerized inspection systems or operate smart factories that rely on computers for all tasks from production to management [1,2] to prevent these defects. Despite the advantages of automated equipment, such as high productivity and reduced production costs, its widespread use across all production lines may not be feasible due to cost and the potential for defects. For delicate work, human workers may still be necessary, resulting in a hybrid assembly system that leverages the strengths of both humans and computers [3,4]. Although fault-checking systems caused by the workers are in place in large-scale sites to mitigate these five types of defects, such systems are not prevalent in most sites and computers alone cannot prevent all such defects.
Although smart factory facilities are systematically built into the assembly process, the workers may encounter challenges when executing their tasks. Specifically, the workers may find it difficult to concentrate on their work due to the opposite location of their work field and the screen displaying the work instructions. Additionally, workers who are familiar with the assembly process may deviate from the work instructions, potentially leading to defects in the manual assembly process, as described above. These problems may contribute to the occurrence of the five common defects of the manual assembly process mentioned earlier.
Most repetitive assembly processes in manufacturing sites are already equipped with robots and mobile conveyor belts to increase process efficiency. However, the installation of additional robots was deemed too expensive to be feasible. Instead, a solution for increasing productivity was proposed to extract judgments, comparisons and results from workers’ eye-level perspectives using a fixed camera [5,6]. Unfortunately, finding a suitable installation area for such a camera proved difficult. As a result, it was decided to use wearable body cams to capture necessary images in real time at the worksite [7,8]. Object-detection accuracy is essential and so the YOLO algorithm was adopted due to its high processing speed [9]. Regression analysis will be conducted using seven algorithms (Xgboost [10], Adaboost [11], Bagging [12], Extra-Trees [13], Gradient Boosting [14], Random Forest [15], Prediction Voting Regressor for Unfitted Estimators [16]) provided by the scikit-learn regression APIs that can be utilized within the Python development environment [17,18].
This paper proposes the use of the YOLO algorithm for classification and localization to address five common fastening defects in the assembly line. The goal is to enable workers to receive real-time work instructions, conduct production inspections and receive remote support at the assembly site [19,20]. To achieve this, we captured a working video in advance, cut it into one image per 25 frames, completed the labeling and created a weight file. We then used the weight file with a computer (which will eventually be replaced by a wearable device) to derive the position information of the worker’s hand. This information was used to determine whether the tool held by the worker’s hand is classified correctly, check whether a bolt is attached to the correct position and perform a comparative analysis to extract data [21,22]. The collected data were organized into time-series data and the performance was analyzed using the aforementioned seven regression algorithms based on the location where the pin was fastened to the substrate. Based on the experimental results, we demonstrate that the proposed algorithm is effective in practical settings.
A wearable device equipped with a camera that does not cause inconvenience to workers on the production line is used to film the assembly process. In real time, the captured video is compared with a pre-trained model to monitor the work order and detect poor assembly according to the work instructions [23]. The aim is to provide workers with real-time information on productivity, quality and lead time efficiency, as well as to enable them to conduct self-inspections. This approach helps to create a safe working environment by reducing workers’ faults. The information is displayed on a screen for easy access and provides a more efficient and accurate way to monitor the assembly process.
The paper is structured as follows. Section 2 provides an explanation of the assembly process, the object-recognition algorithm and the problems that need to be addressed. In Section 3, we describe YOLO, the configuration of hand position/point datasets for regression with the YOLO algorithm and the configuration of regression algorithms and pre-processing. Section 4 and Section 5 cover the system configuration used in the experiment, the experimental results and our analysis of the results. Finally, in the conclusion, we summarize our findings and offer recommendations for future research.

2. Background

2.1. Assembly Process

The assembly process refers to all the processes in a factory that are required to complete a product with sub-parts of the product. Its purpose is not only to complete the product, but also to minimize labor costs by employing as few skilled workers as possible. Additionally, by conducting assembly simulations when building assembly lines in advance, the necessary components or assembly costs can be calculated, which can ultimately help reduce production costs. Through all these processes, the goals of minimizing lead time and improving the completeness of the product can be achieved [24].

2.2. Object-Detection Algorithm

This paper utilizes the YOLO algorithm, which prioritizes speed over accuracy, resulting in the development of multiple versions of the model. In the previous version, YOLOv3, an approximately 12% performance enhancement was observed by utilizing CSPDarknet53 as a backbone. CSPDarknet53 divides the feature map into two and merges it into the subsequent layer, contributing to this improvement [20]. In our proposed approach, we utilize object detection with YOLO to estimate the location information of screws for assembly by leveraging the bounding box information of the hand and driver.

2.3. Problem Statements

We will utilize an assembly-position-determination algorithm to organize the data generated during the screwing of pins or bolts to the substrate in a production line as time-series data. During the analysis of this time-series data, it will be possible to identify feature points. Next, we will use regression algorithms to compare and identify characteristics between the five types of screwing and normal assembly by using these reference points. Using the worker’s hand position and timing, YOLO will estimate the substrate state and derive the results. Through this process, we aim to decrease the defect rate and reduce the lead time in the production line.

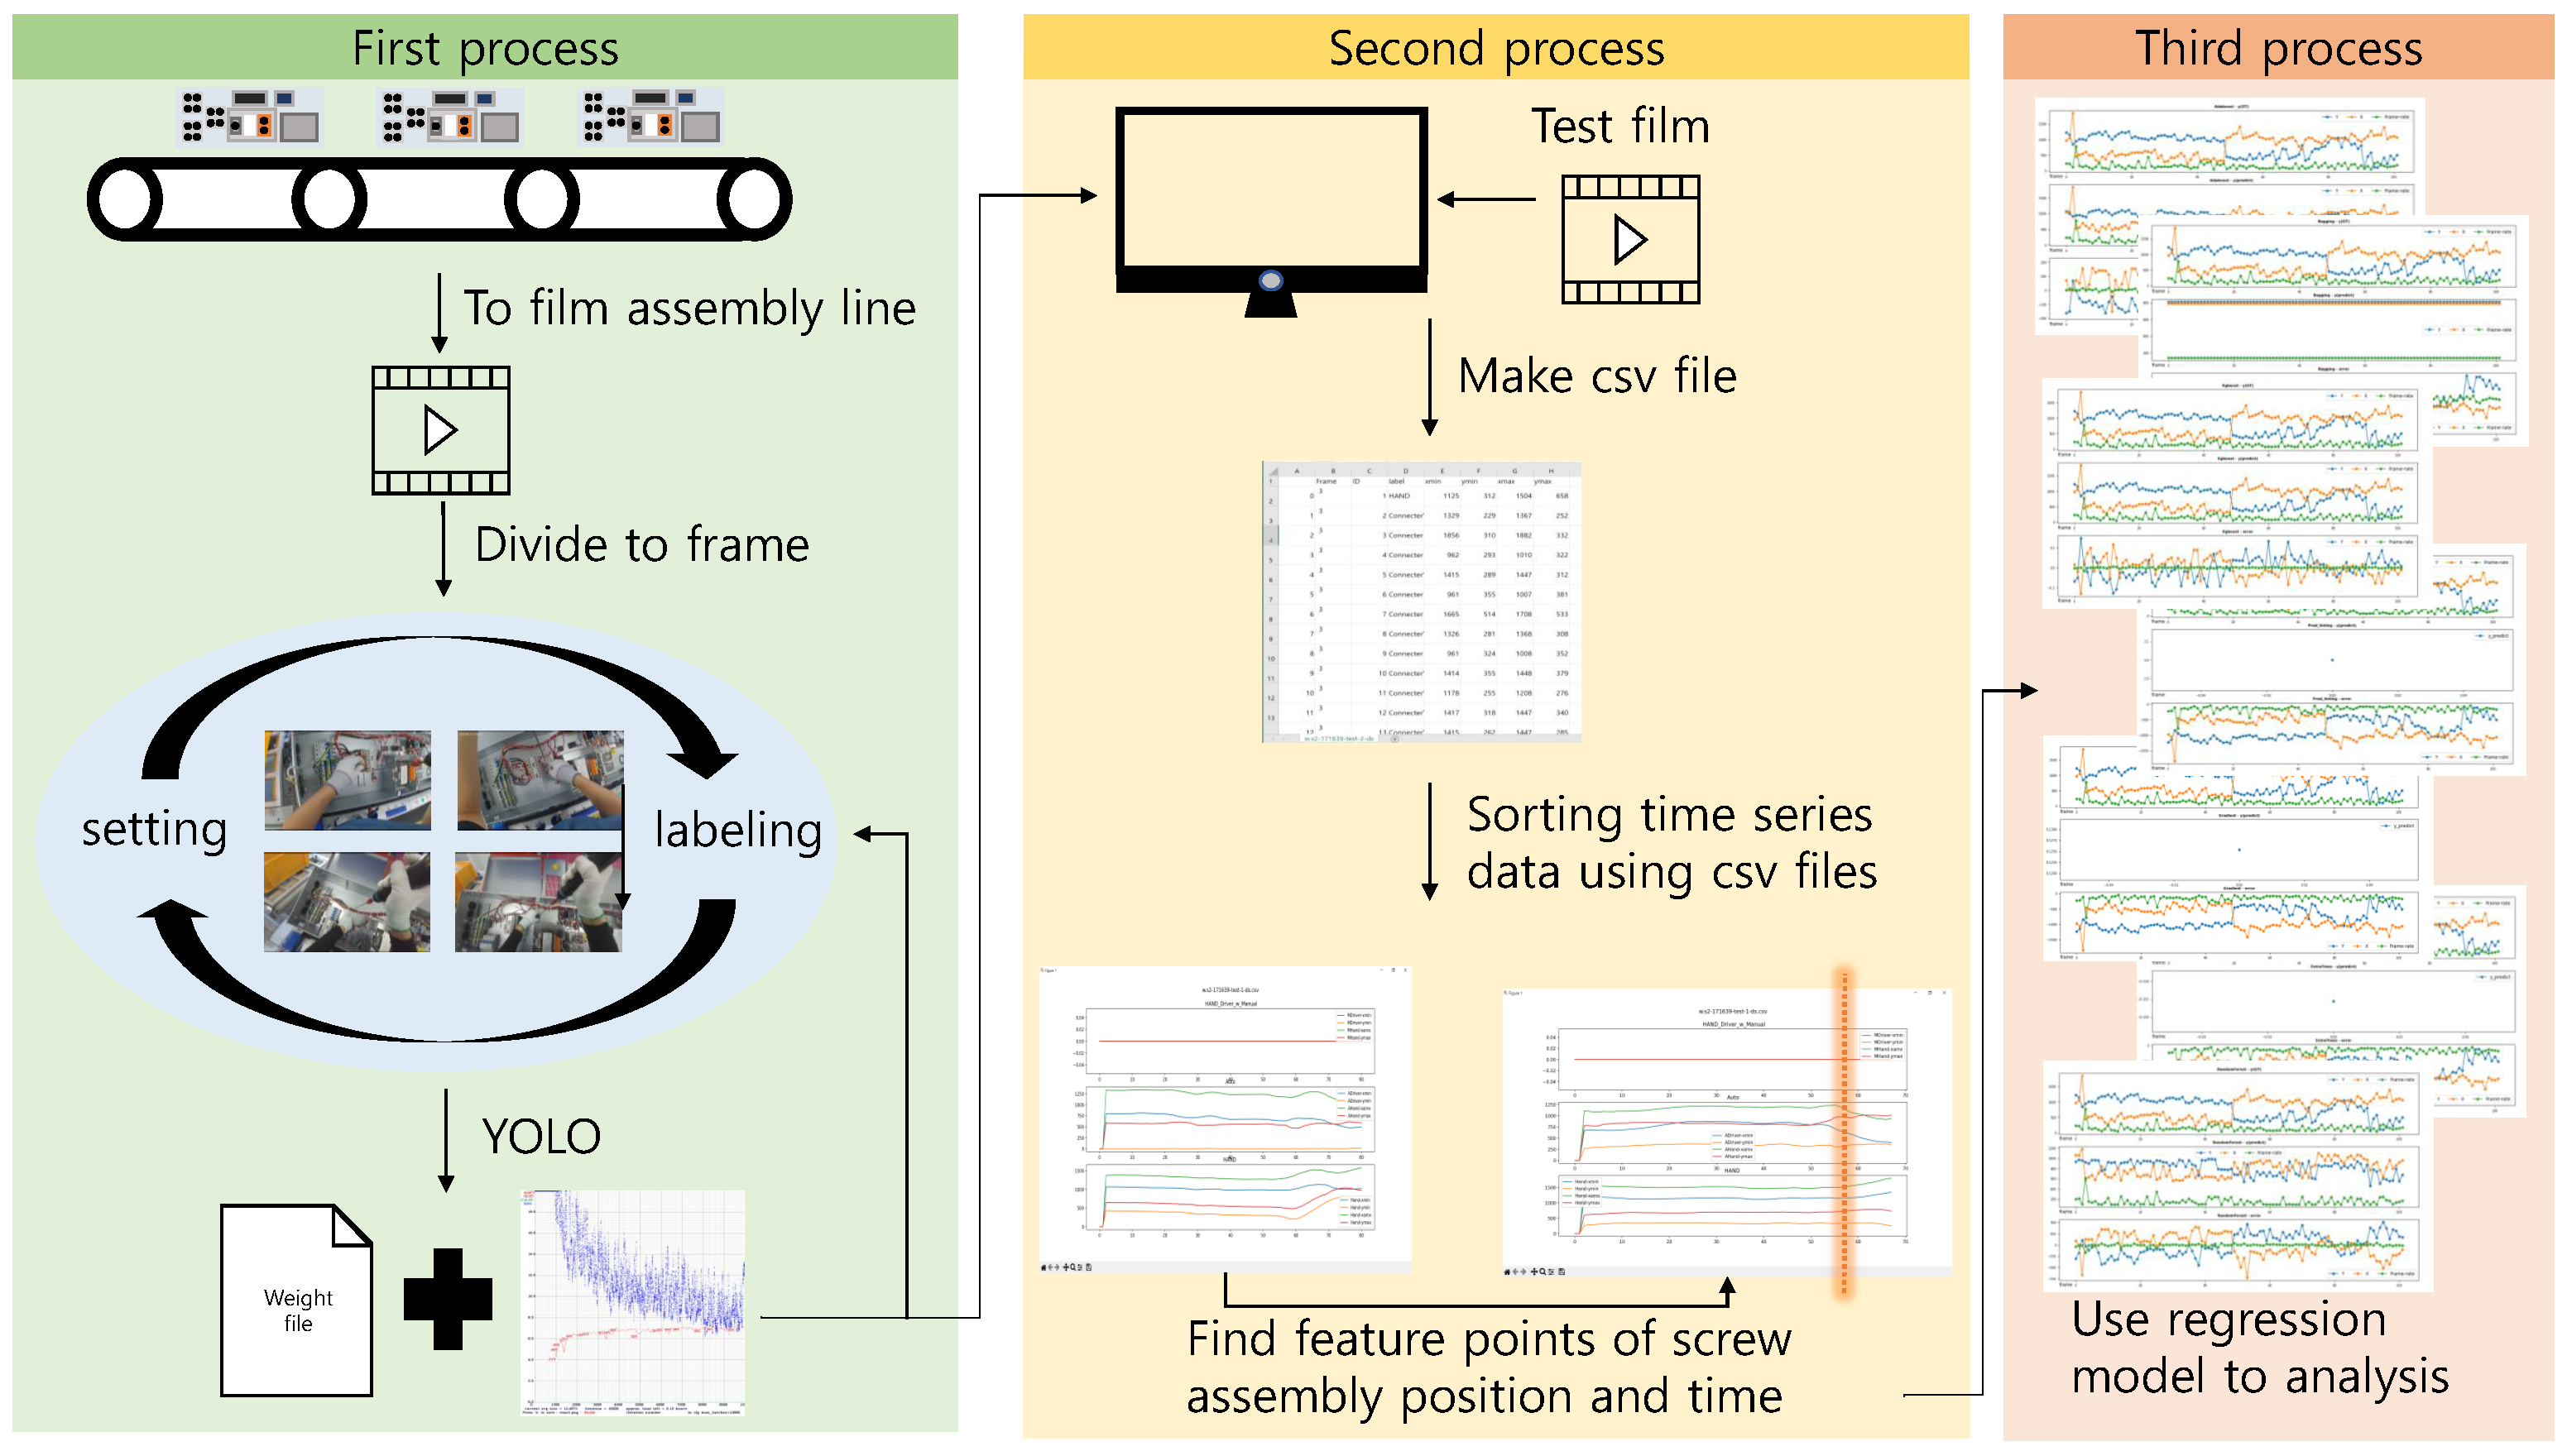
3. Proposed Methodology

3.1. Proposed Algorithm

Figure 1 shows the algorithm process which consists of three stages: dataset creation, data inference and analysis. The first stage involves video data of the production process using a camera. The resulting video is segmented into frames and each frame is labeled. The YOLO configuration file is then set up based on the development environment and this algorithm is used to create a dataset for terminal recognition of the substrate. If the training results fall below expectations, the process goes back to the previous step and the settings, such as batch size and image resizing value, are modified before retraining is carried out.
The second stage, data inference, involves using the dataset generated in the previous process to obtain satisfactory result values. The field image is used as input data and the frame-specific result value is saved as a CSV file. By organizing the CSV file into time-series data, the bounding box coordinates and frames of the class called “hand” and “hand with screw” can be obtained. With this information, the feature point can be checked in the time-series data and it can be confirmed that the pin is combined immediately after the operator’s hand disappears from the screen when comparing the feature with the input data.
In the third stage, the regression algorithm is utilized to determine whether the assembly process is normal or if any problems have occurred based on the feature points organized in the previous steps. The algorithm works by comparing the characteristics between the five types of screwing and normal assembly, using the reference points. This enables the identification of any deviations from the standard assembly process, such as poor assembly, incorrect timing or other issues that may arise during production. Overall, the third stage plays a critical role in ensuring the smooth and efficient operation of the production line, while also maintaining high-quality standards. The use of advanced algorithms and data-analysis techniques can help to identify potential issues before they become major problems, thereby ensuring that the assembly process runs smoothly and efficiently.

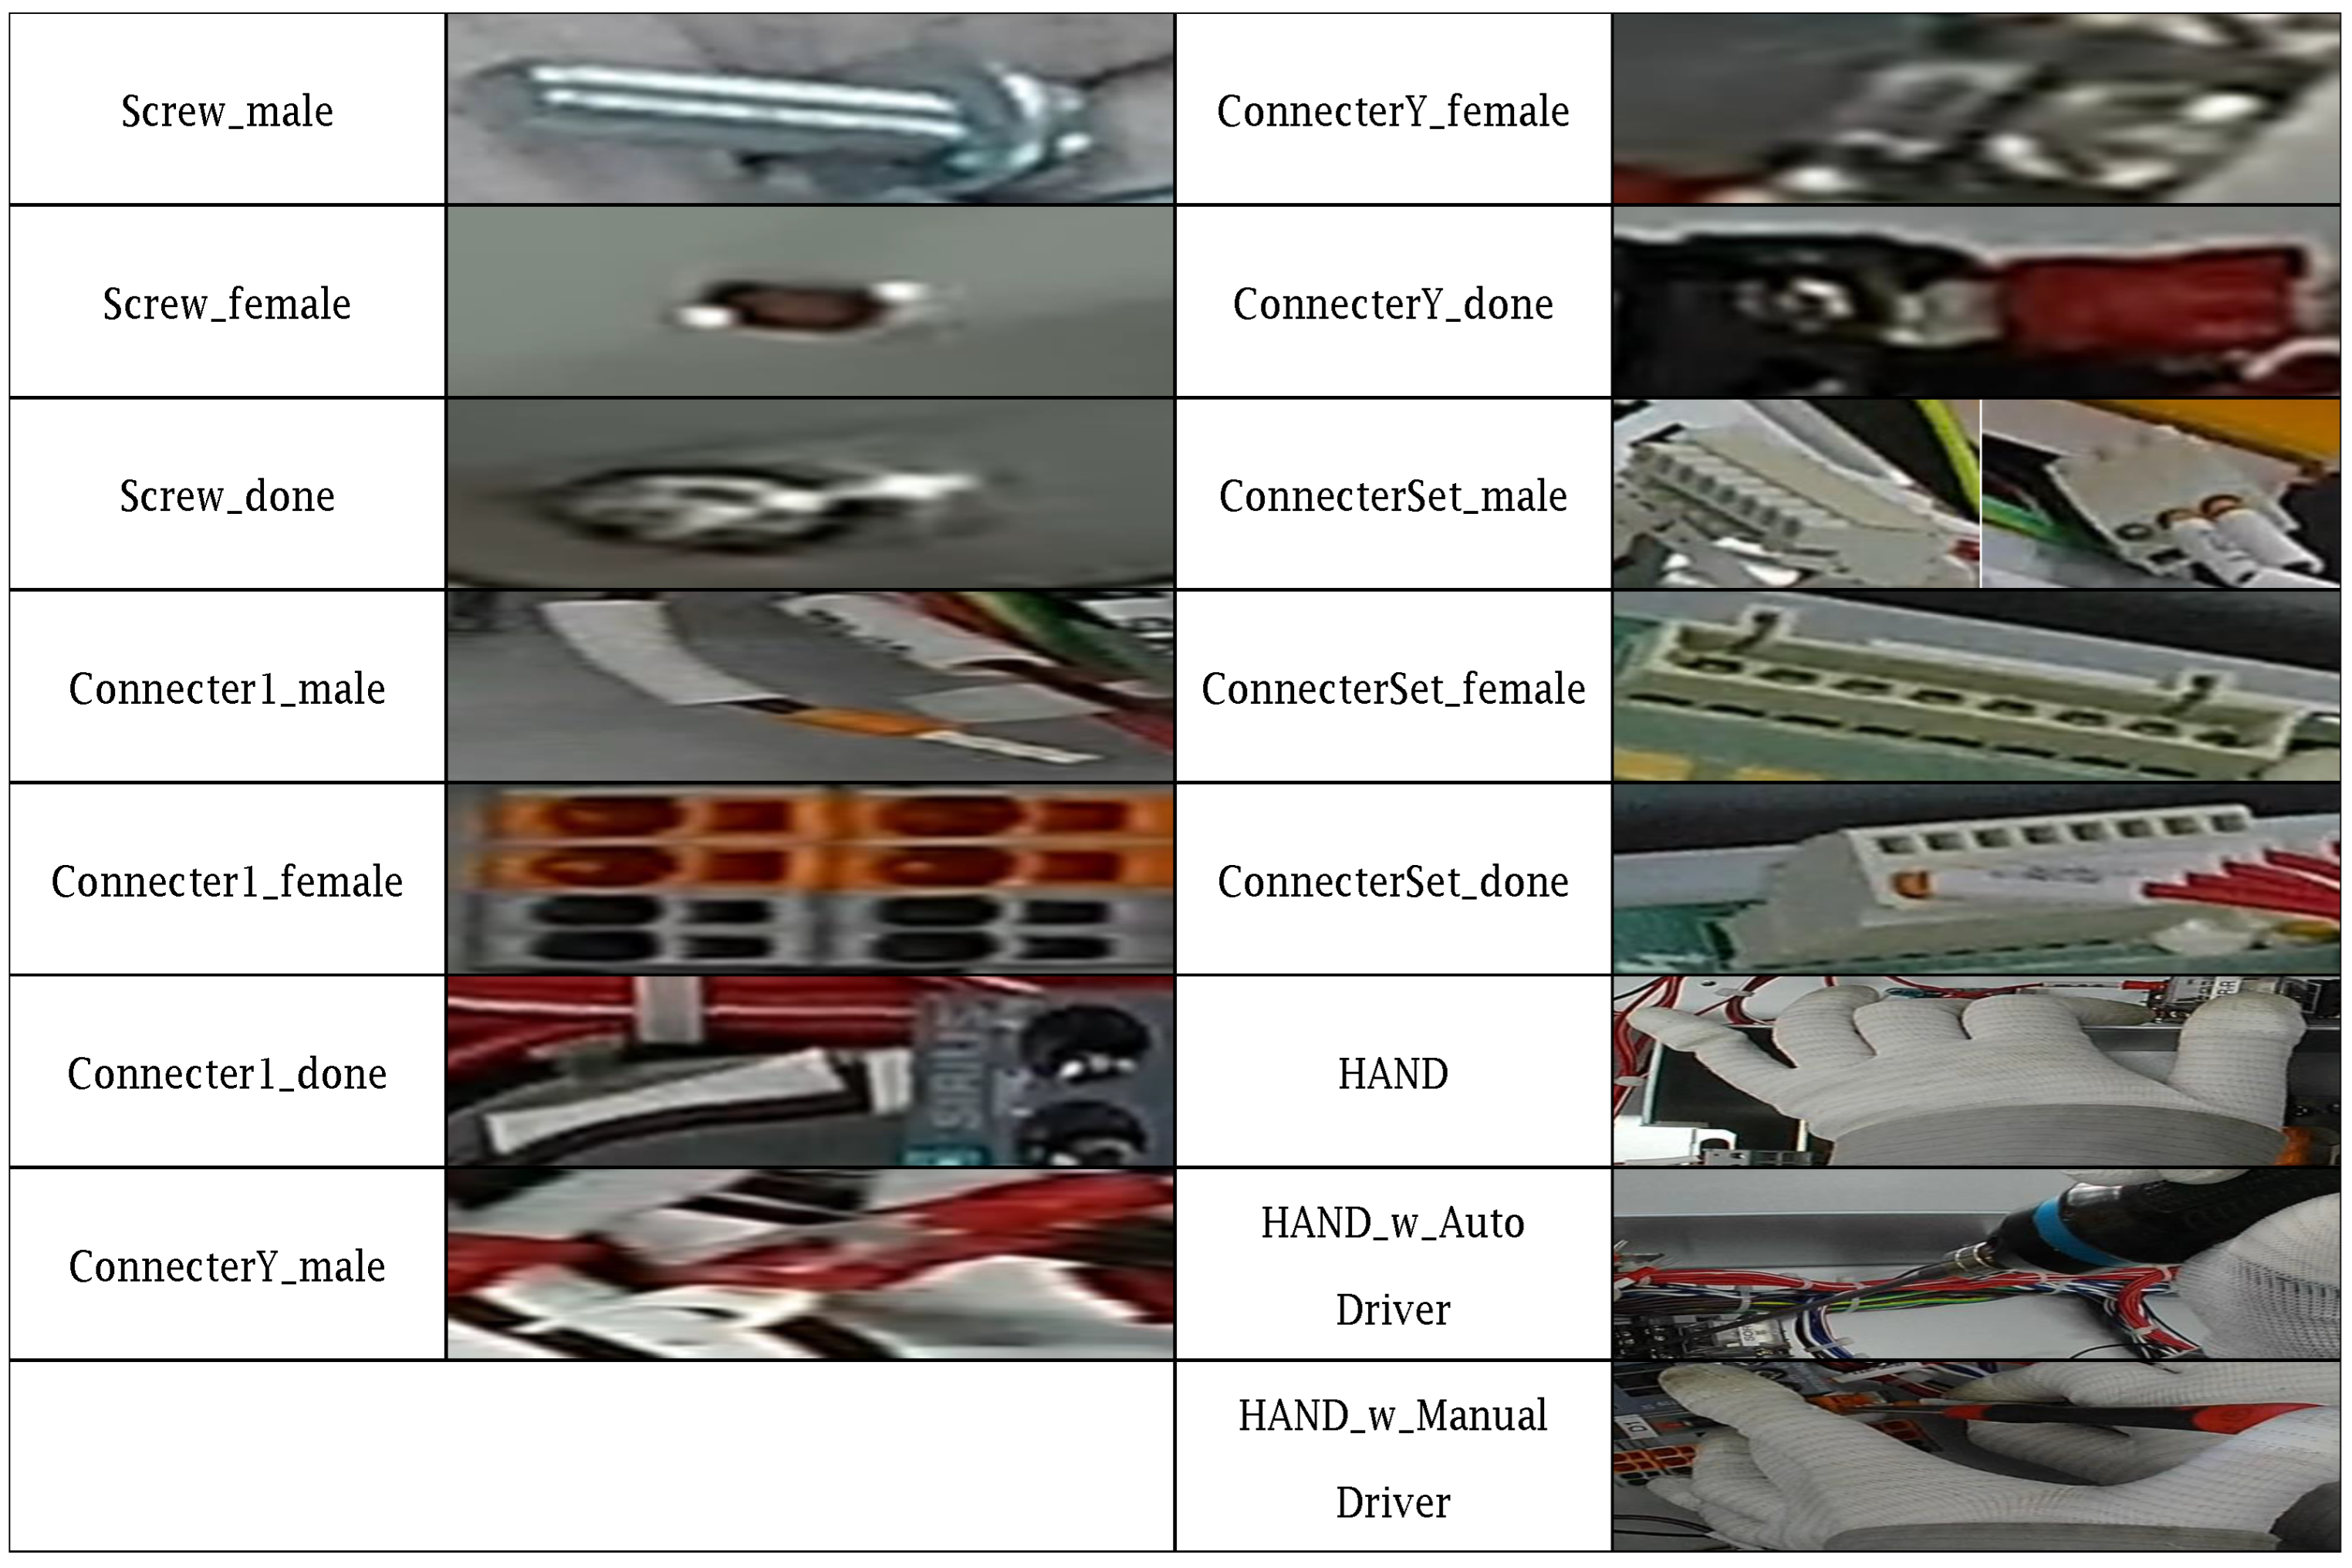
3.2. Dataset for YOLO

Deepsort was run using a weight file generated with YOLO. Deepsort is an algorithm that applies YOLO during the detection stage of the Simple Online and Realtime Tracking (SORT) algorithm, which detects objects in real time [25].
The dataset used in this study includes 15 classes in the Figure 2, which can be divided into 12 types of classes related to the screwing process and 3 types of classes related to the tracking process. The screwing process include male screws, female screws and connected status, for instance Screw, Connecter1 (a flat-shaped connector), ConnecterY (a connector shaped like the letter Y) and ConnecterSet (a combination of several connectors). In additional, the tracking process includes three classes for tracking the worker’s hand, including AutoDriver, ManualDriver and Hand. The dataset was created by filming a production process with a camera and labeling the frames with the appropriate class labels using YOLO. The resulting dataset was then used to train and evaluate the performance of the proposed algorithm for detecting and tracking the screwing driver and worker’s hands in real time.
Figure 3 illustrates the tracking results obtained using Deepsort. The class and the boundary box coordinates of the objects were extracted from the results. Based on these coordinates, we generated time-series data that corresponded to the points where the worker’s hand was performing tasks, as shown in Figure 4. However, it is noteworthy that in Figure 4, the graph for the HAND_Driver_w_Manual class differs from those of HAND and Auto classes, as it displays only one graph. This occurred because the objects belonging to this class were not detected during the experiment, resulting in all boundary box coordinates being measured as 0. We conducted a regression analysis based on the point where the worker’s hand class appeared and disappeared in each frame, using the point of substrate change as the reference.

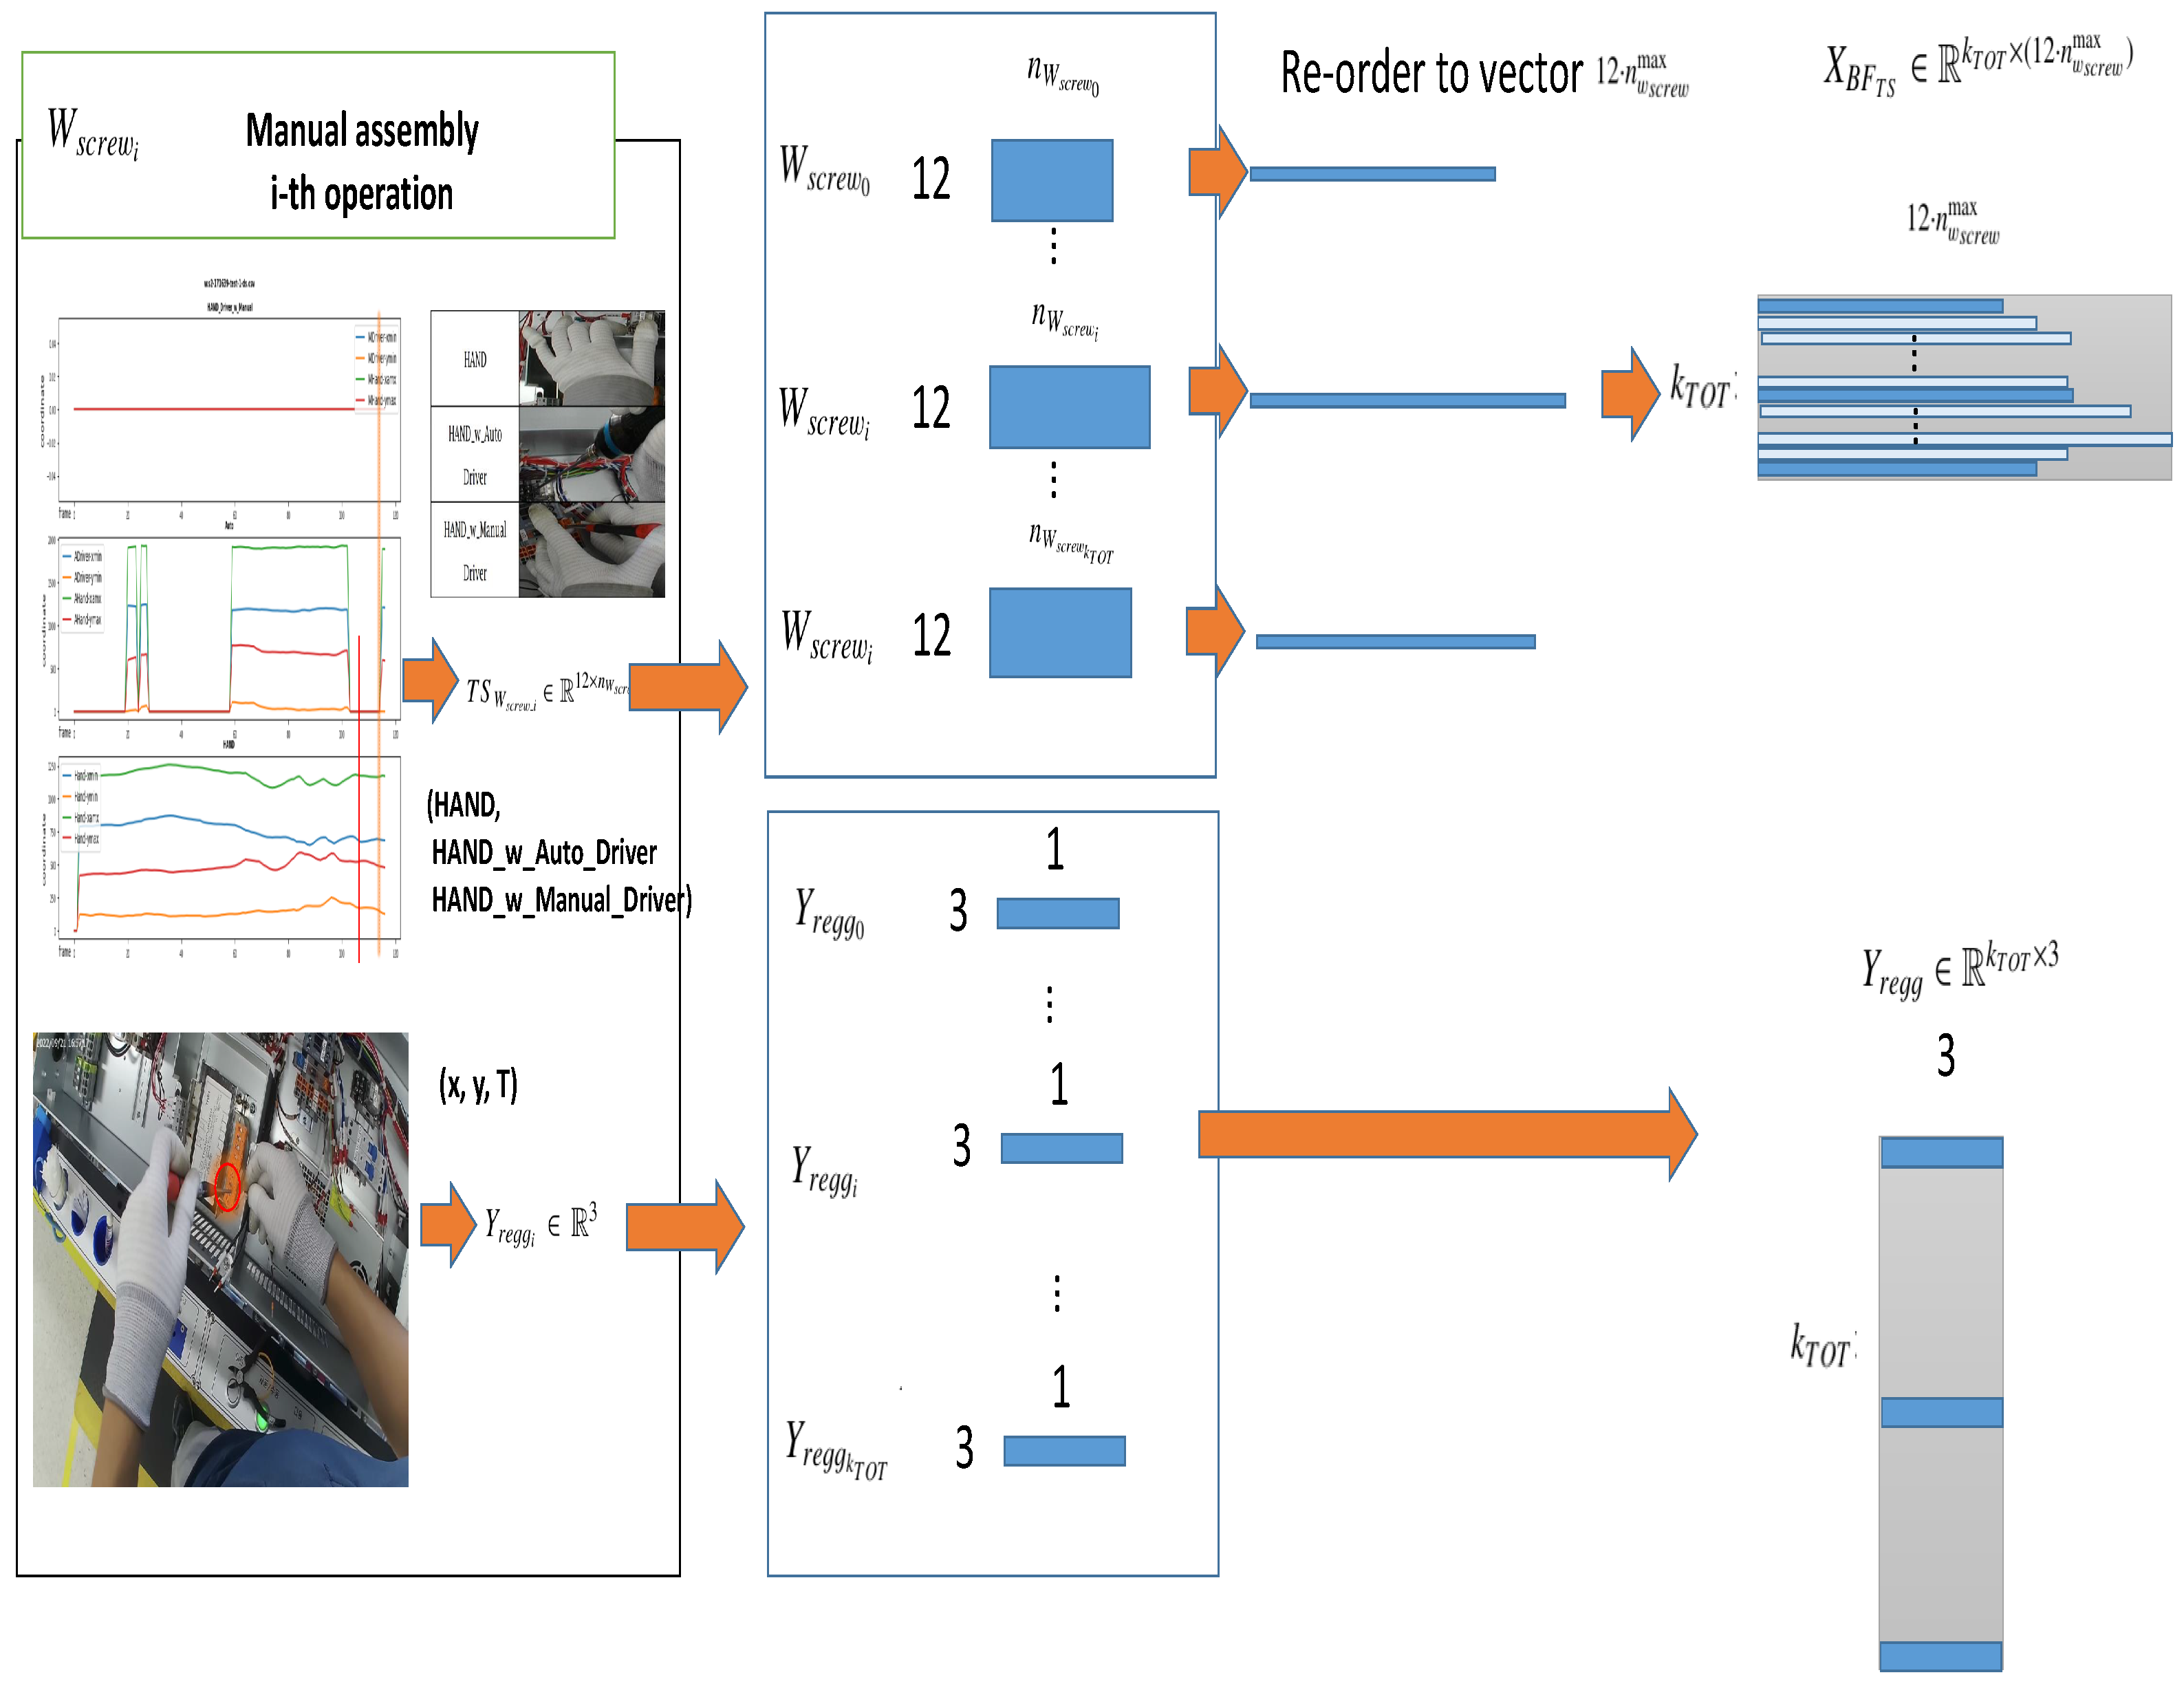
3.2.1. Pre-Processing for the Regression of the Assembly Timing and Position

For the regression process, we labeled Y r e g g i R 3 , the timing of screw fastening and the corresponding x and y coordinates in the i t h fastening operations, denoted as W s c r e w i as in Figure 5. The labeled data coordinates were stored for training of the regression algorithm. To prepare the input data for regression, we reorganized the time-series data for Hand, Hand_w_Manual Driver and Hand_w_autoDriver classes in the corresponding csv file into a time series of T S W s c r e w _ i R 12 × n W s c r e w i for each task W s c r e w i , where n W s c r e w i is the length of the time series of W s c r e w i . These time series were then assigned to a buffer vector B F T S R 12 × n w s c r e w max where n w s c r e w max is the maximum number of time steps across all W s c r e w i tasks.
The regression was performed using the input buffer vector X B F T S R k T O T × ( 12 · n w s c r e w max ) and the labeled output Y r e g g R k T O T × 3 where k T O T = 102 is the total operation number of the manual assembly process. The objective was to identify the feature points, i.e., the timing of the screw fastening, based on the worker’s hand position and timing information. We compared the characteristics of the five types of fastening and normal assembly by using the reference points and identified any anomalies in the assembly process. The results of the regression analysis were used to estimate the substrate state and optimize the production process to reduce the defect rate and lead time.

3.2.2. Regression Algorithms

Regression algorithms are commonly used in machine learning to predict a continuous target variable based on one or more predictor variables. They can be used for a variety of tasks, such as time-series forecasting, regression analysis and prediction modeling. Popular regression algorithms include linear regression, logistic regression and polynomial regression. Table 1 is a type of regression algorithm, and the criteria for selection depends on the type of problem being solved and the characteristics of the data being analyzed.

4. Method Validation Setup

System Configuration

The system configuration is categorized into two parts. The first part consists of a body cam that captures images to create a dataset and the second part includes a computer necessary for labeling, YOLO and regression. According to Figure 6 and Table 2, body cam has a resolution of 1080p and can shoot at 30fps, while the computer specifications include an i5-9400 CPU and a GTX1660ti GPU. The programs used for setting up YOLO were cmake-3.17.2, cuda-10.2, cudnn-10.2 and opencv-4.1.0.

5. Numerical Results and Discussion

5.1. YOLO Training and Reasoning Results

Figure 7 shows the loss graph of YOLO learning with a batch size set to 320 × 320, 15 classes and 10,000 iterations. The model was trained with 800 input data for training and 200 for validation. The mAP result indicates a 35% learning accuracy (1).
m A P = 1 15 i = 1 15 A P i ,
where i represents the number of classes used in the training.
AP is the abbreviation for Average Precision, which is a metric indicating the precision of an object-detection model as
A P = i ( r i + 1 r i ) ρ i n t e r p ( r i + 1 ) ,
and r i represents the i-th recall, which is a metric indicating how well an object-detection model detects all actual accurate objects that exist.
The interpolated precision value e for the threshold r i + 1 is defined as
ρ i n t e r p ( r i + 1 ) = r ˜ : r ˜ m a x r i + 1 ρ ( r ˜ ) ,
where r ˜ : r ˜ m a x r i + 1 ρ ( r ˜ ) represents obtaining the maximum precision value for all recall values r ˜ that are greater than or equal to the threshold r i + 1 .
Figure 8 shows the performance-analysis results by class. The AP figure for each class varies significantly, with a minimum value of 37% and a maximum value of 100%. Although there are 15 classes, only 9 classes were observed in the video used for testing. This is because the labeling process did not evenly distribute the learning data, resulting in a low mAP. The results indicate that evenly distributing the data per class during labeling is crucial to achieving a high mAP. Additional labeling work could lead to better performance.

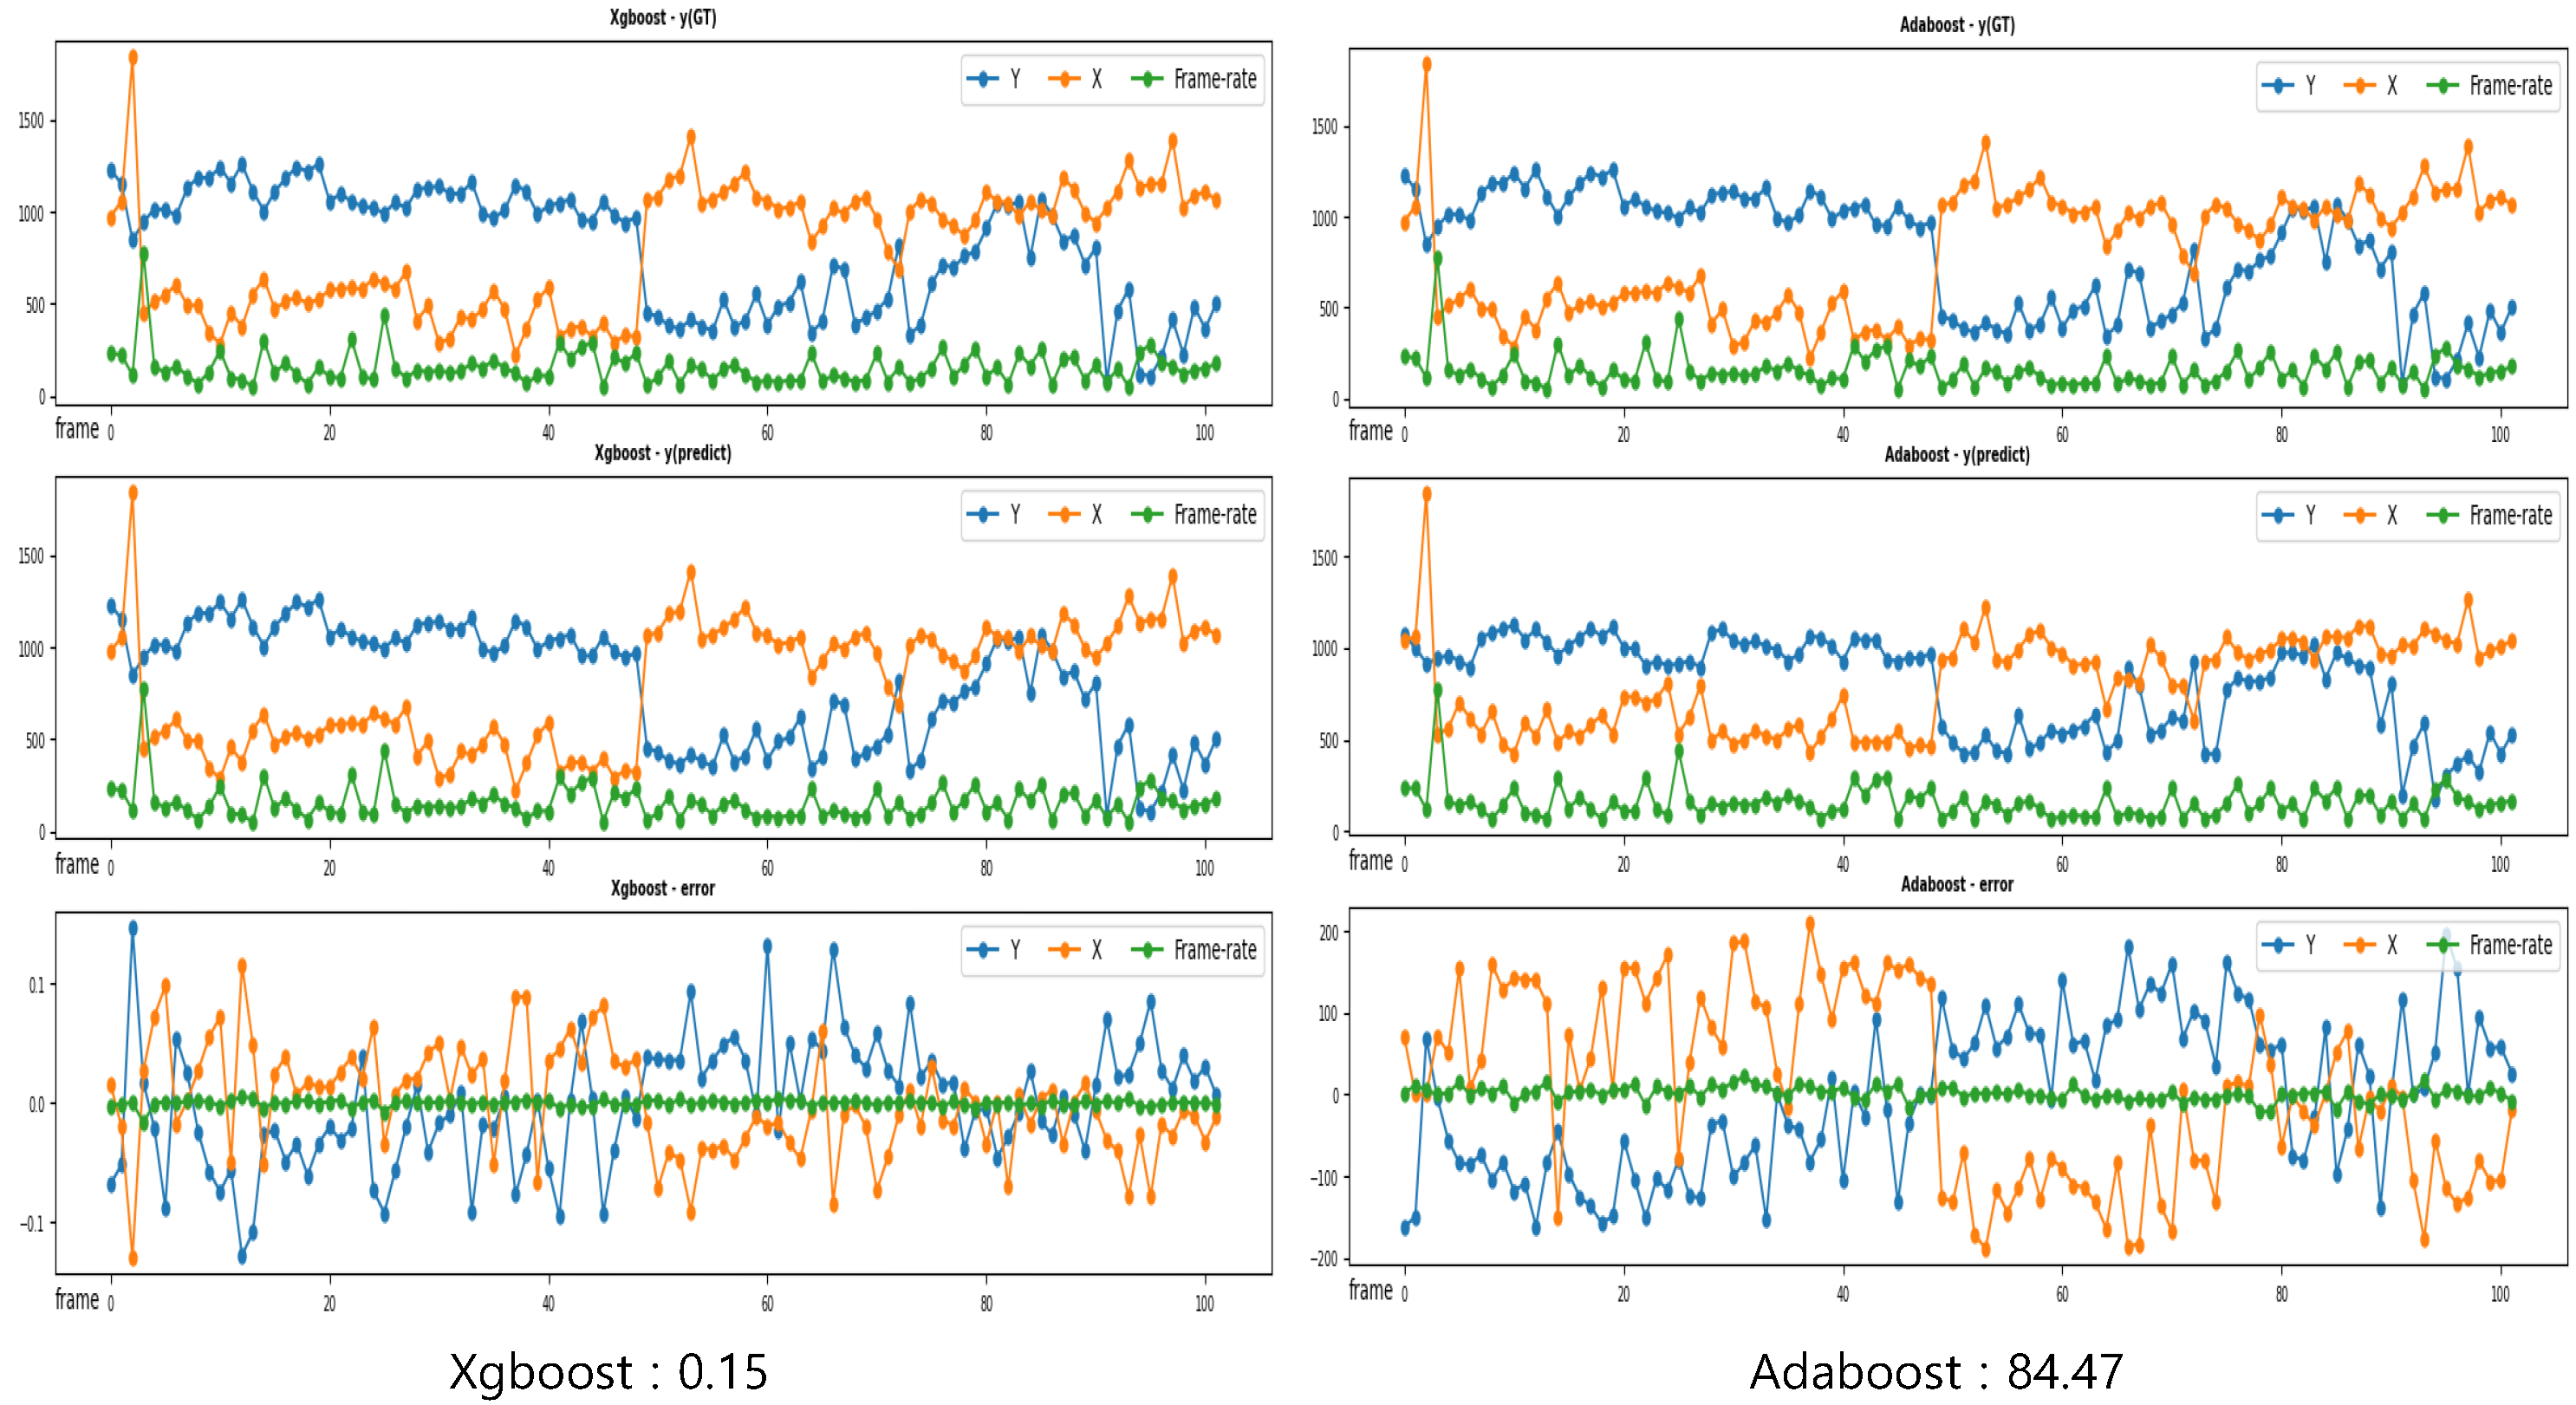
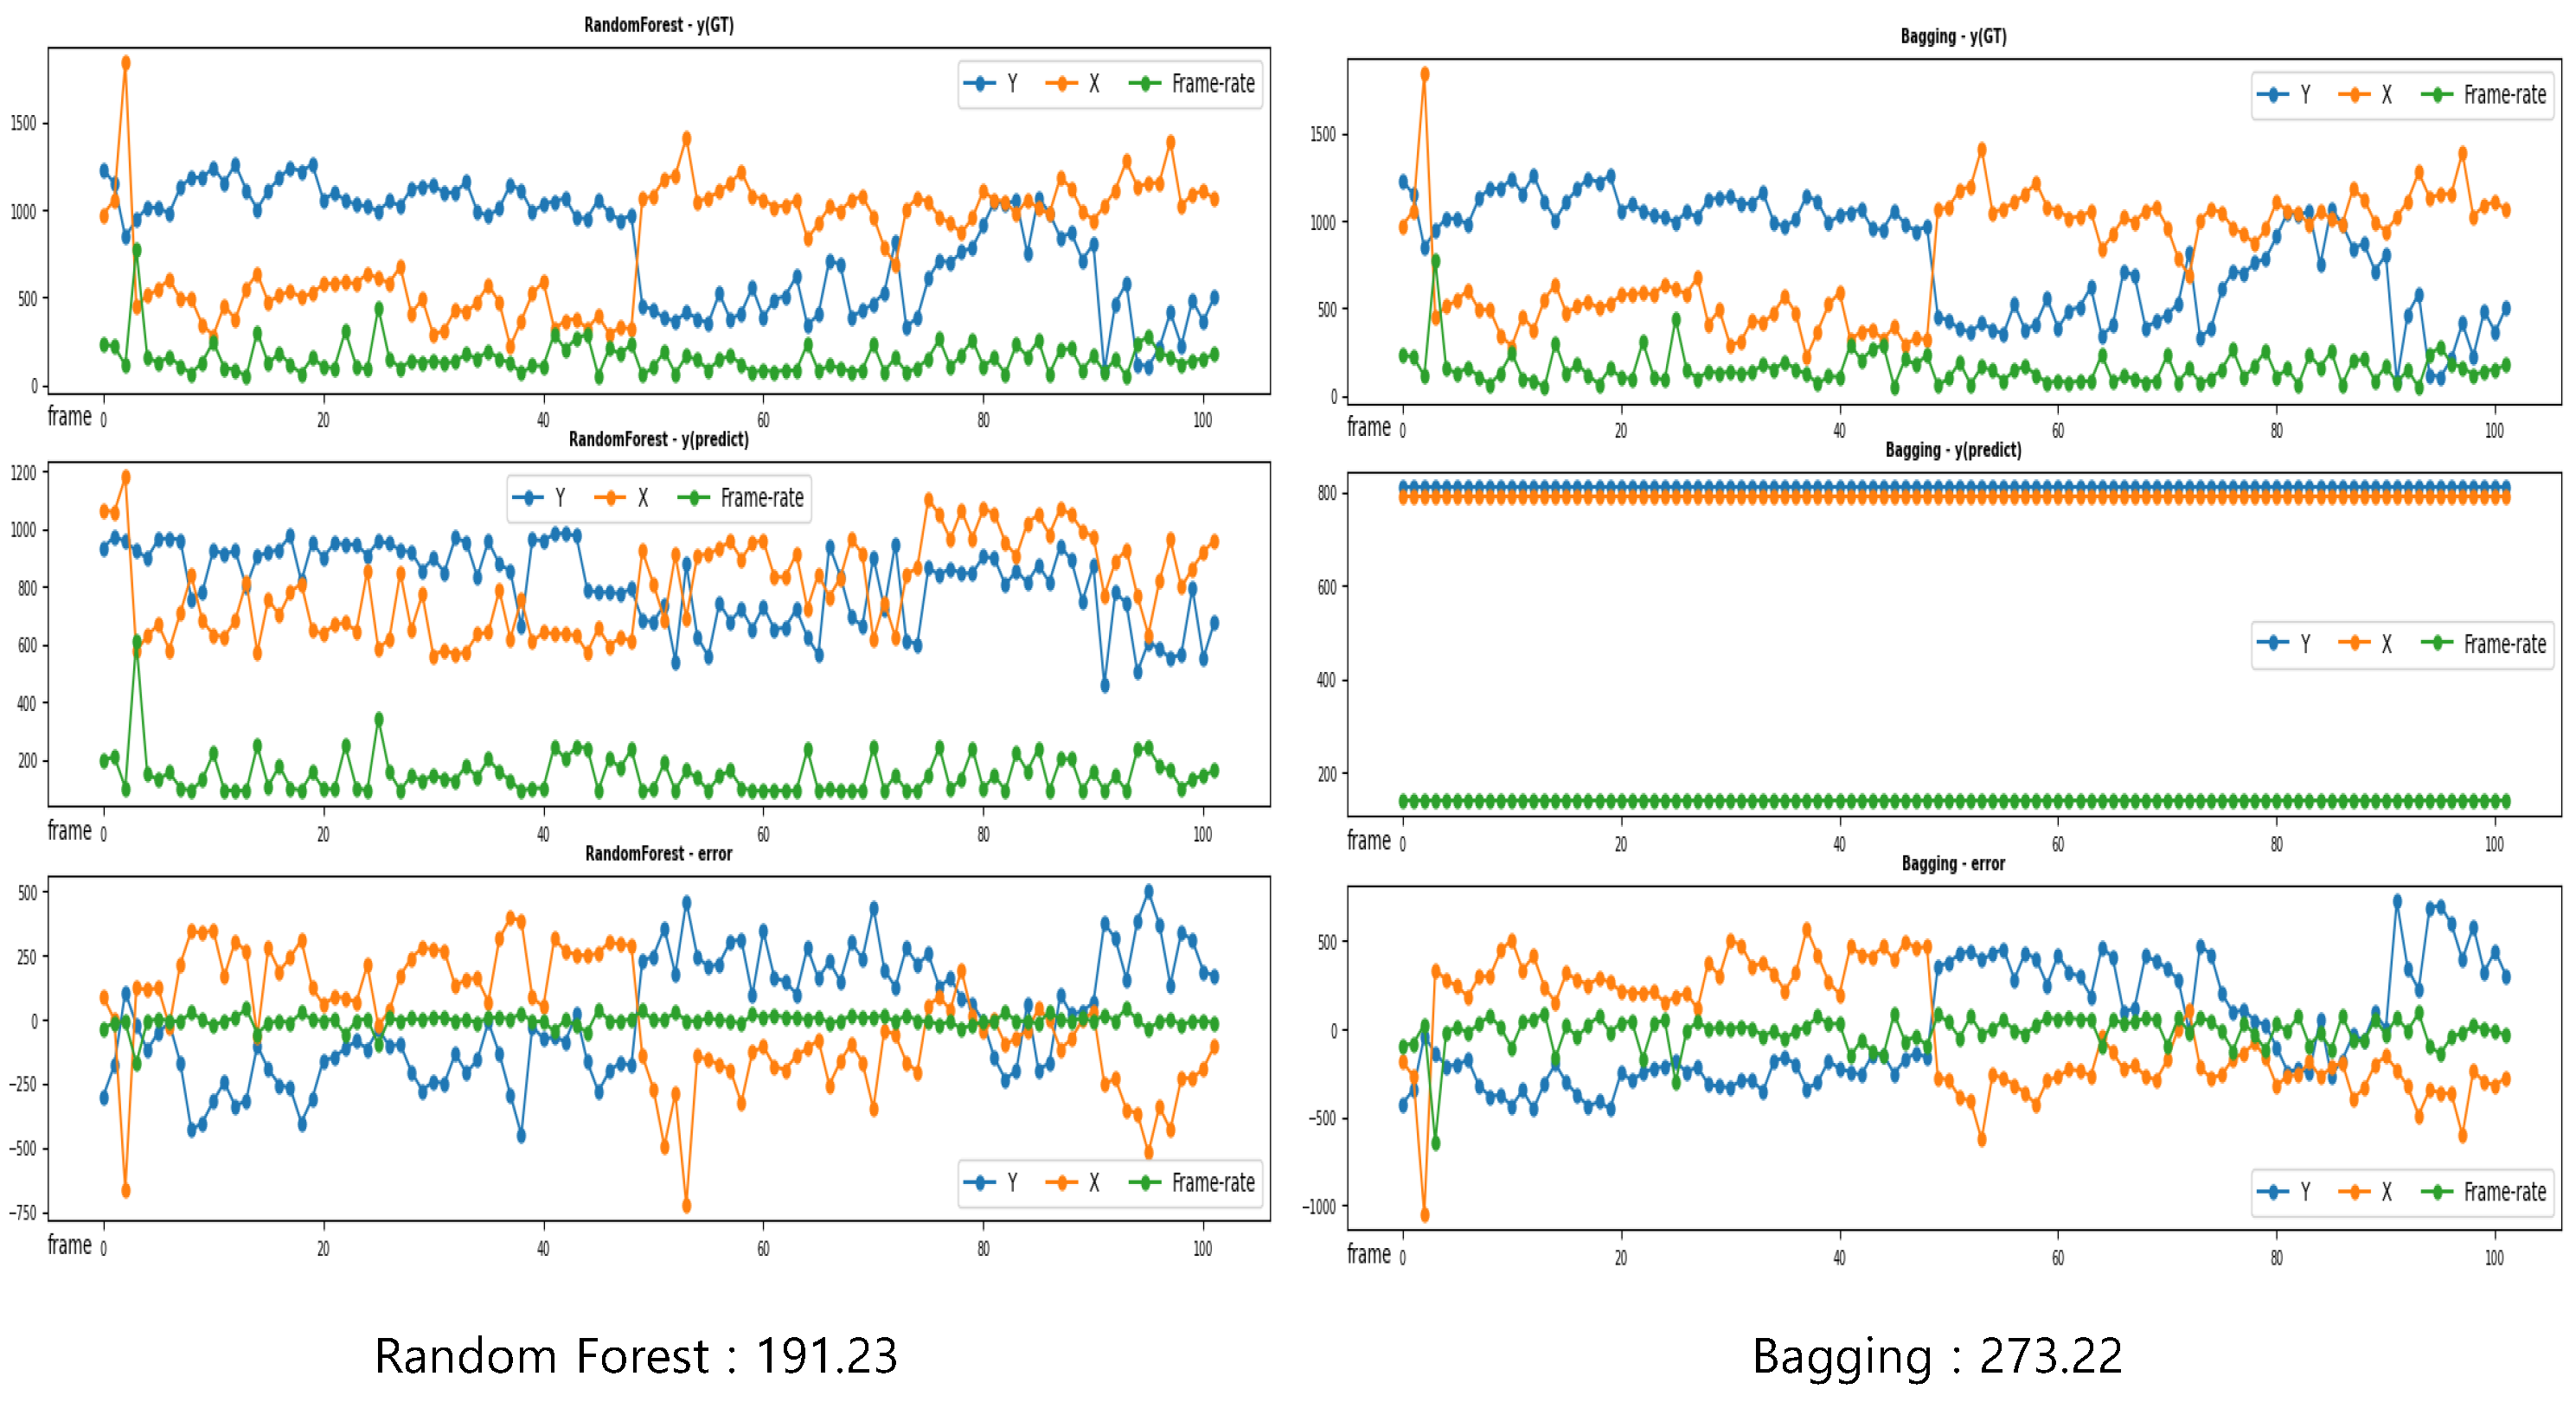
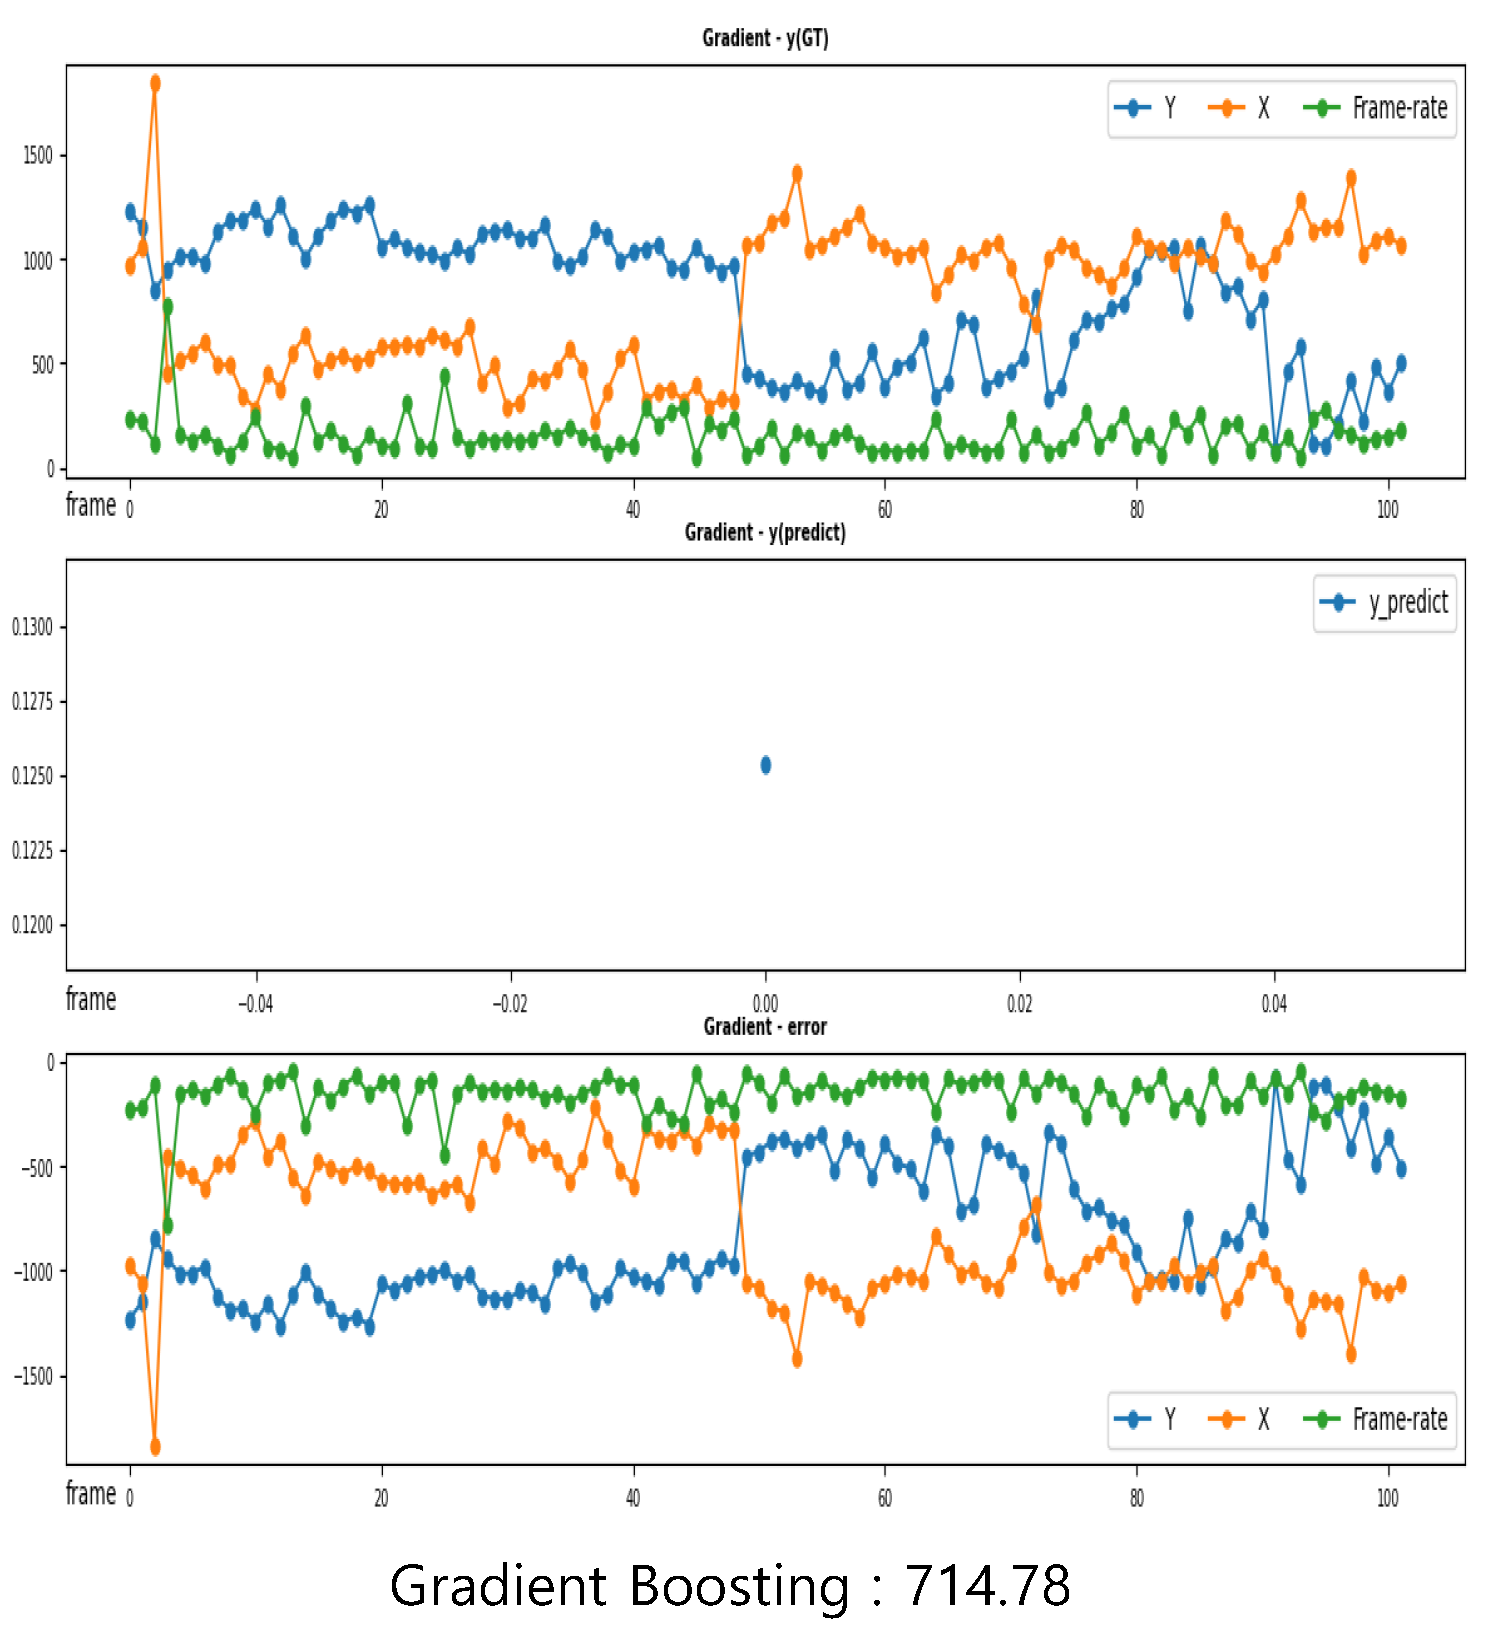
5.2. Regression Results

Time-series graphs (Figure 9, Figure 10, Figure 11 and Figure 12) represent values up to the second decimal place using seven regression algorithms. The x-coordinate indicates the number (frame) of data used in the regression, while the y-coordinate shows the coordinate value and error of the recognized object for each data point. Among the three algorithms used, Extra-Trees, Gradient Boosting and Prediction Voting Regressor for Unfitted Estimators showed a single frame value with an average y_prediction value, in contrast to the other four algorithms.
The performance of Xgboost (Figure 9) is 0.15, which implies that the screw-fastening position and timing are largely consistent. This paper compared the performance of regression algorithms using RMSE for the performance measure as
R M S E = 1 t o t a l _ f r a m e · Σ ( y ( p r e d i c t ) y ( G T ) ) 2 .
RMSE has the characteristics of preventing values from becoming negative and increasing the sensitivity of errors by squaring them (in this experiment, total_frame is 102).
The results show that Xgboost (Figure 9) performed the best, with Adaboost (Figure 9) and Random Forest showing values of 84.47 and 191.23 (Figure 10) respectively. The graph clearly shows a significant difference between the predicted and ground-truth values for these two algorithms. In other cases, Bagging (Figure 10), Prediction Voting Regressor for Unfitted Estimators (Figure 11), Extra-Trees (Figure 11) and Gradient Boosting (Figure 12) produced results where the predicted values were close to 1 and the error values were opposite to the ground-truth values. As a result, the RMSE was the lowest for Bagging at 273.22 and the highest for Gradient Boosting at 714.78.
As a result of the comparative analysis, it was found that Xgboost performed significantly better than other regression algorithms, producing the most ideal error values. Therefore, Xgboost was selected for regression in the subsequent experiments.

5.3. Visualization Results

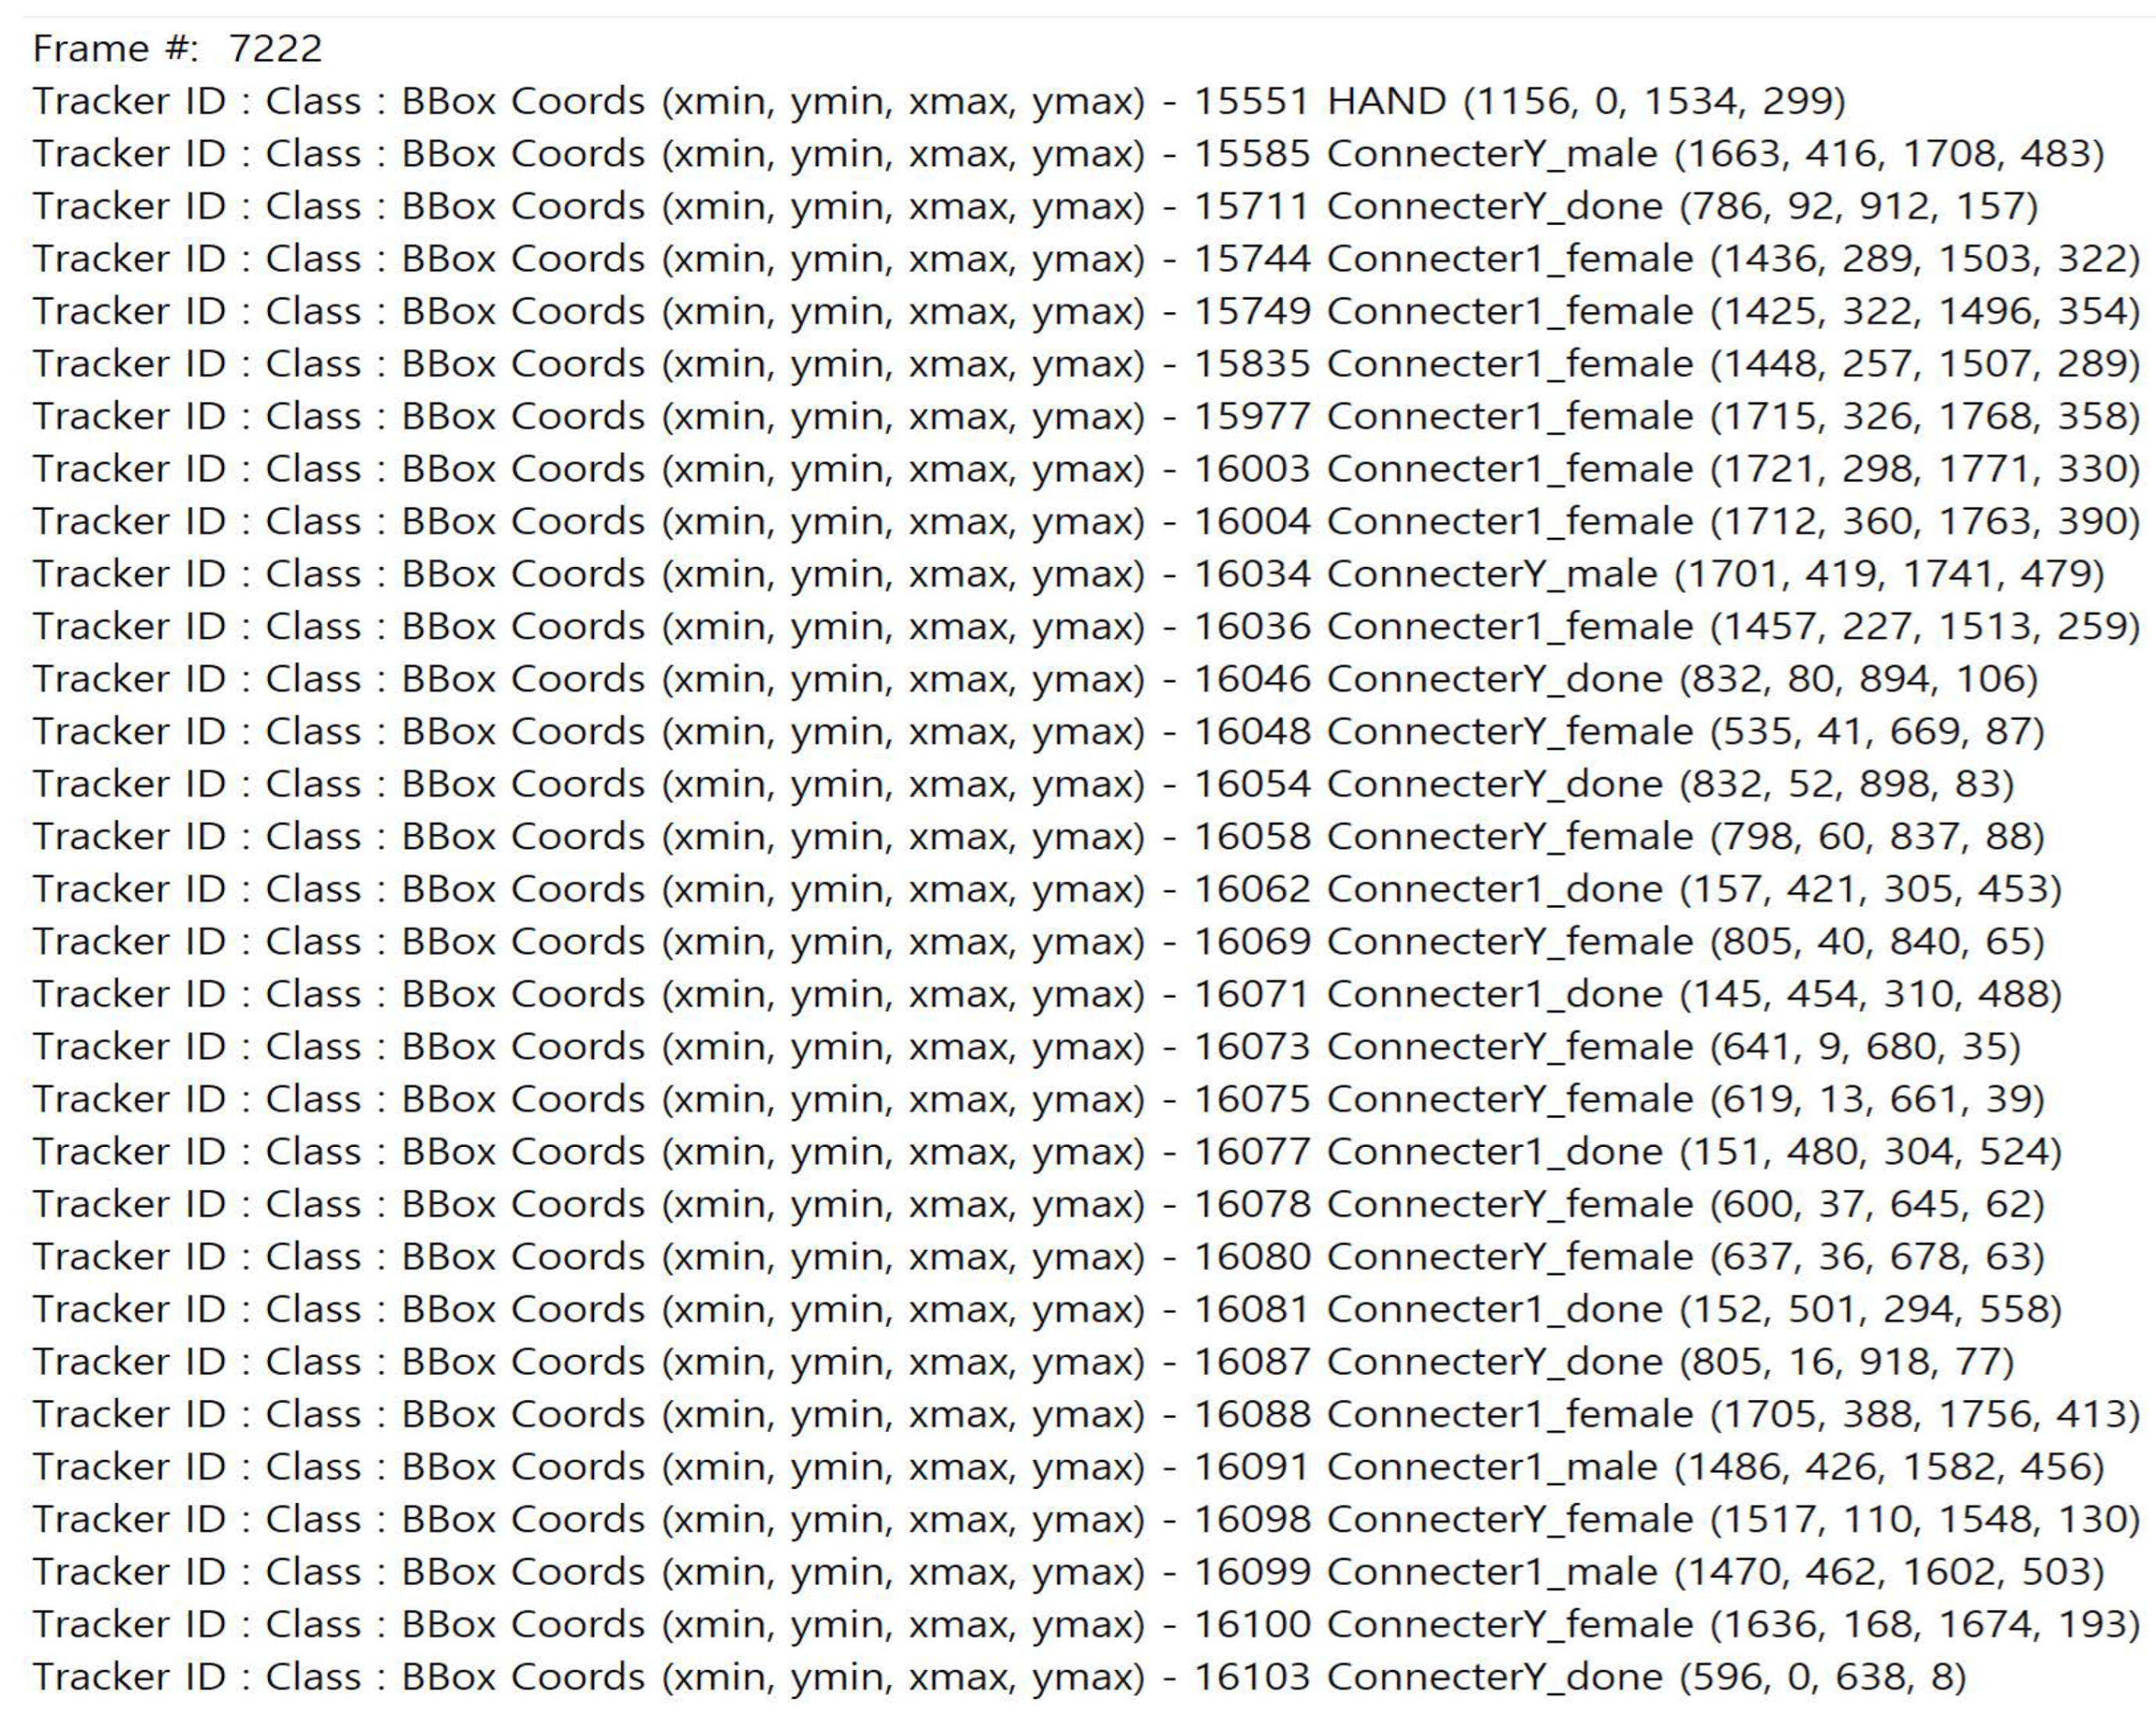
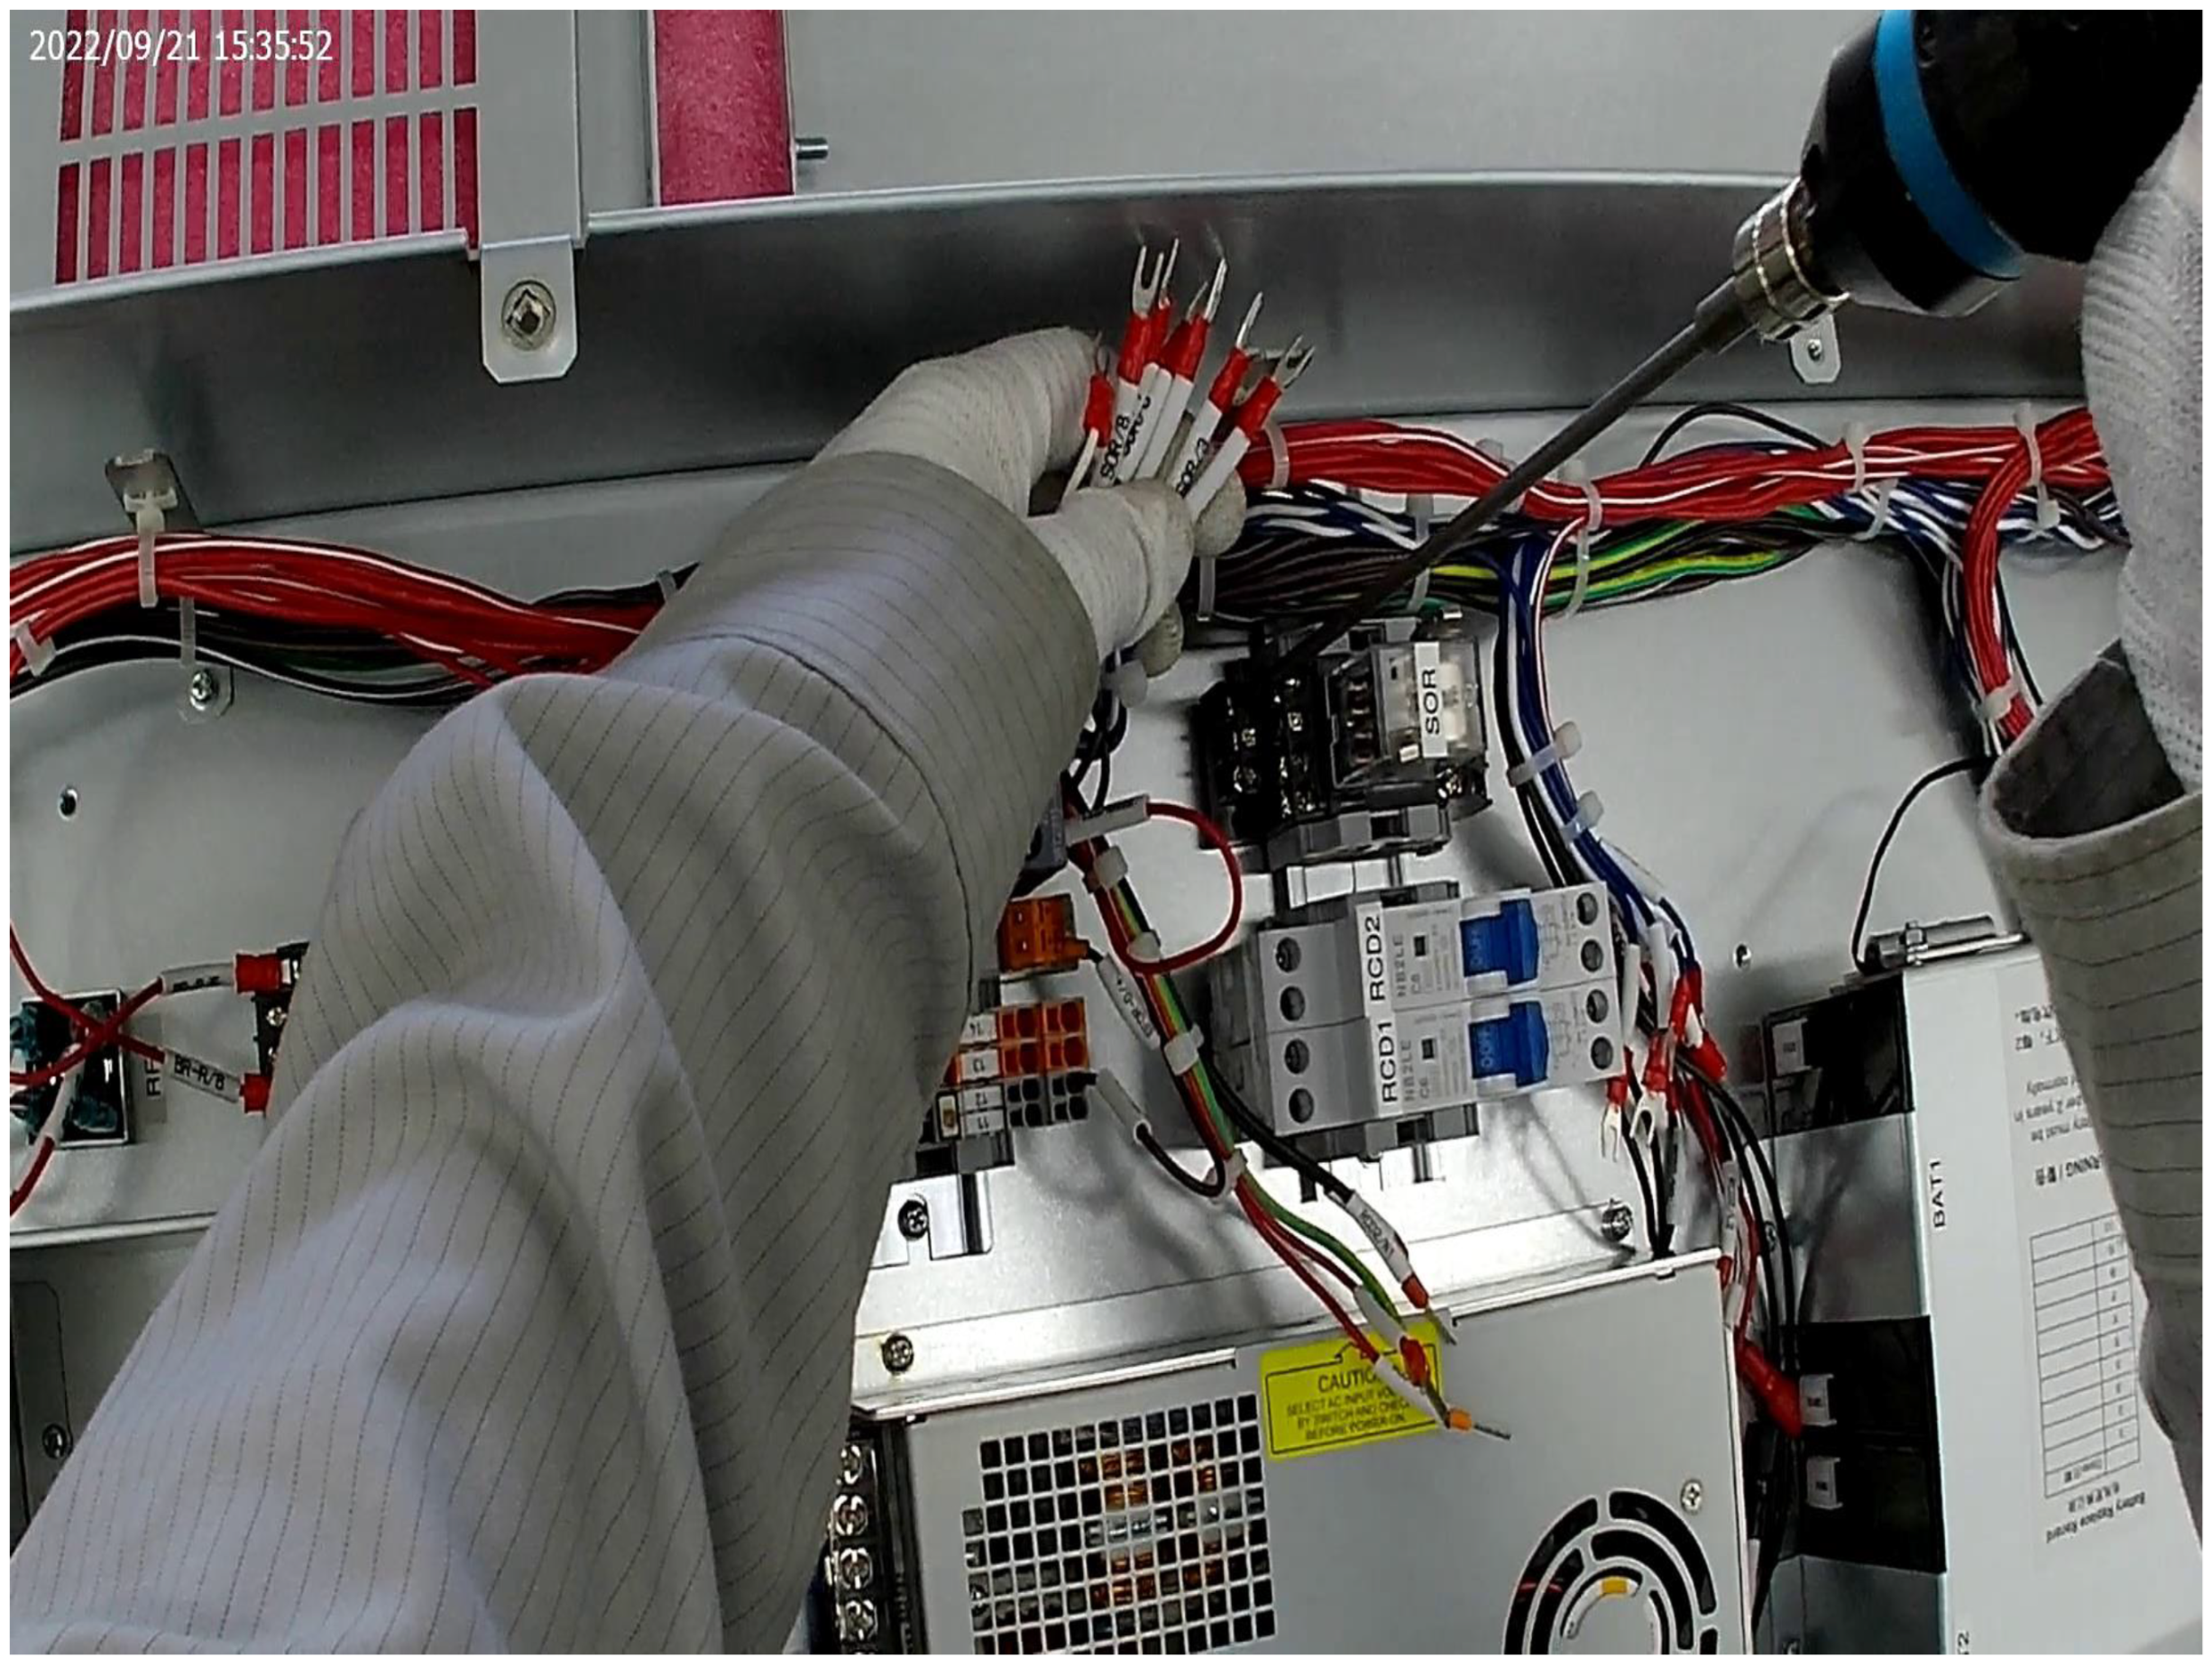
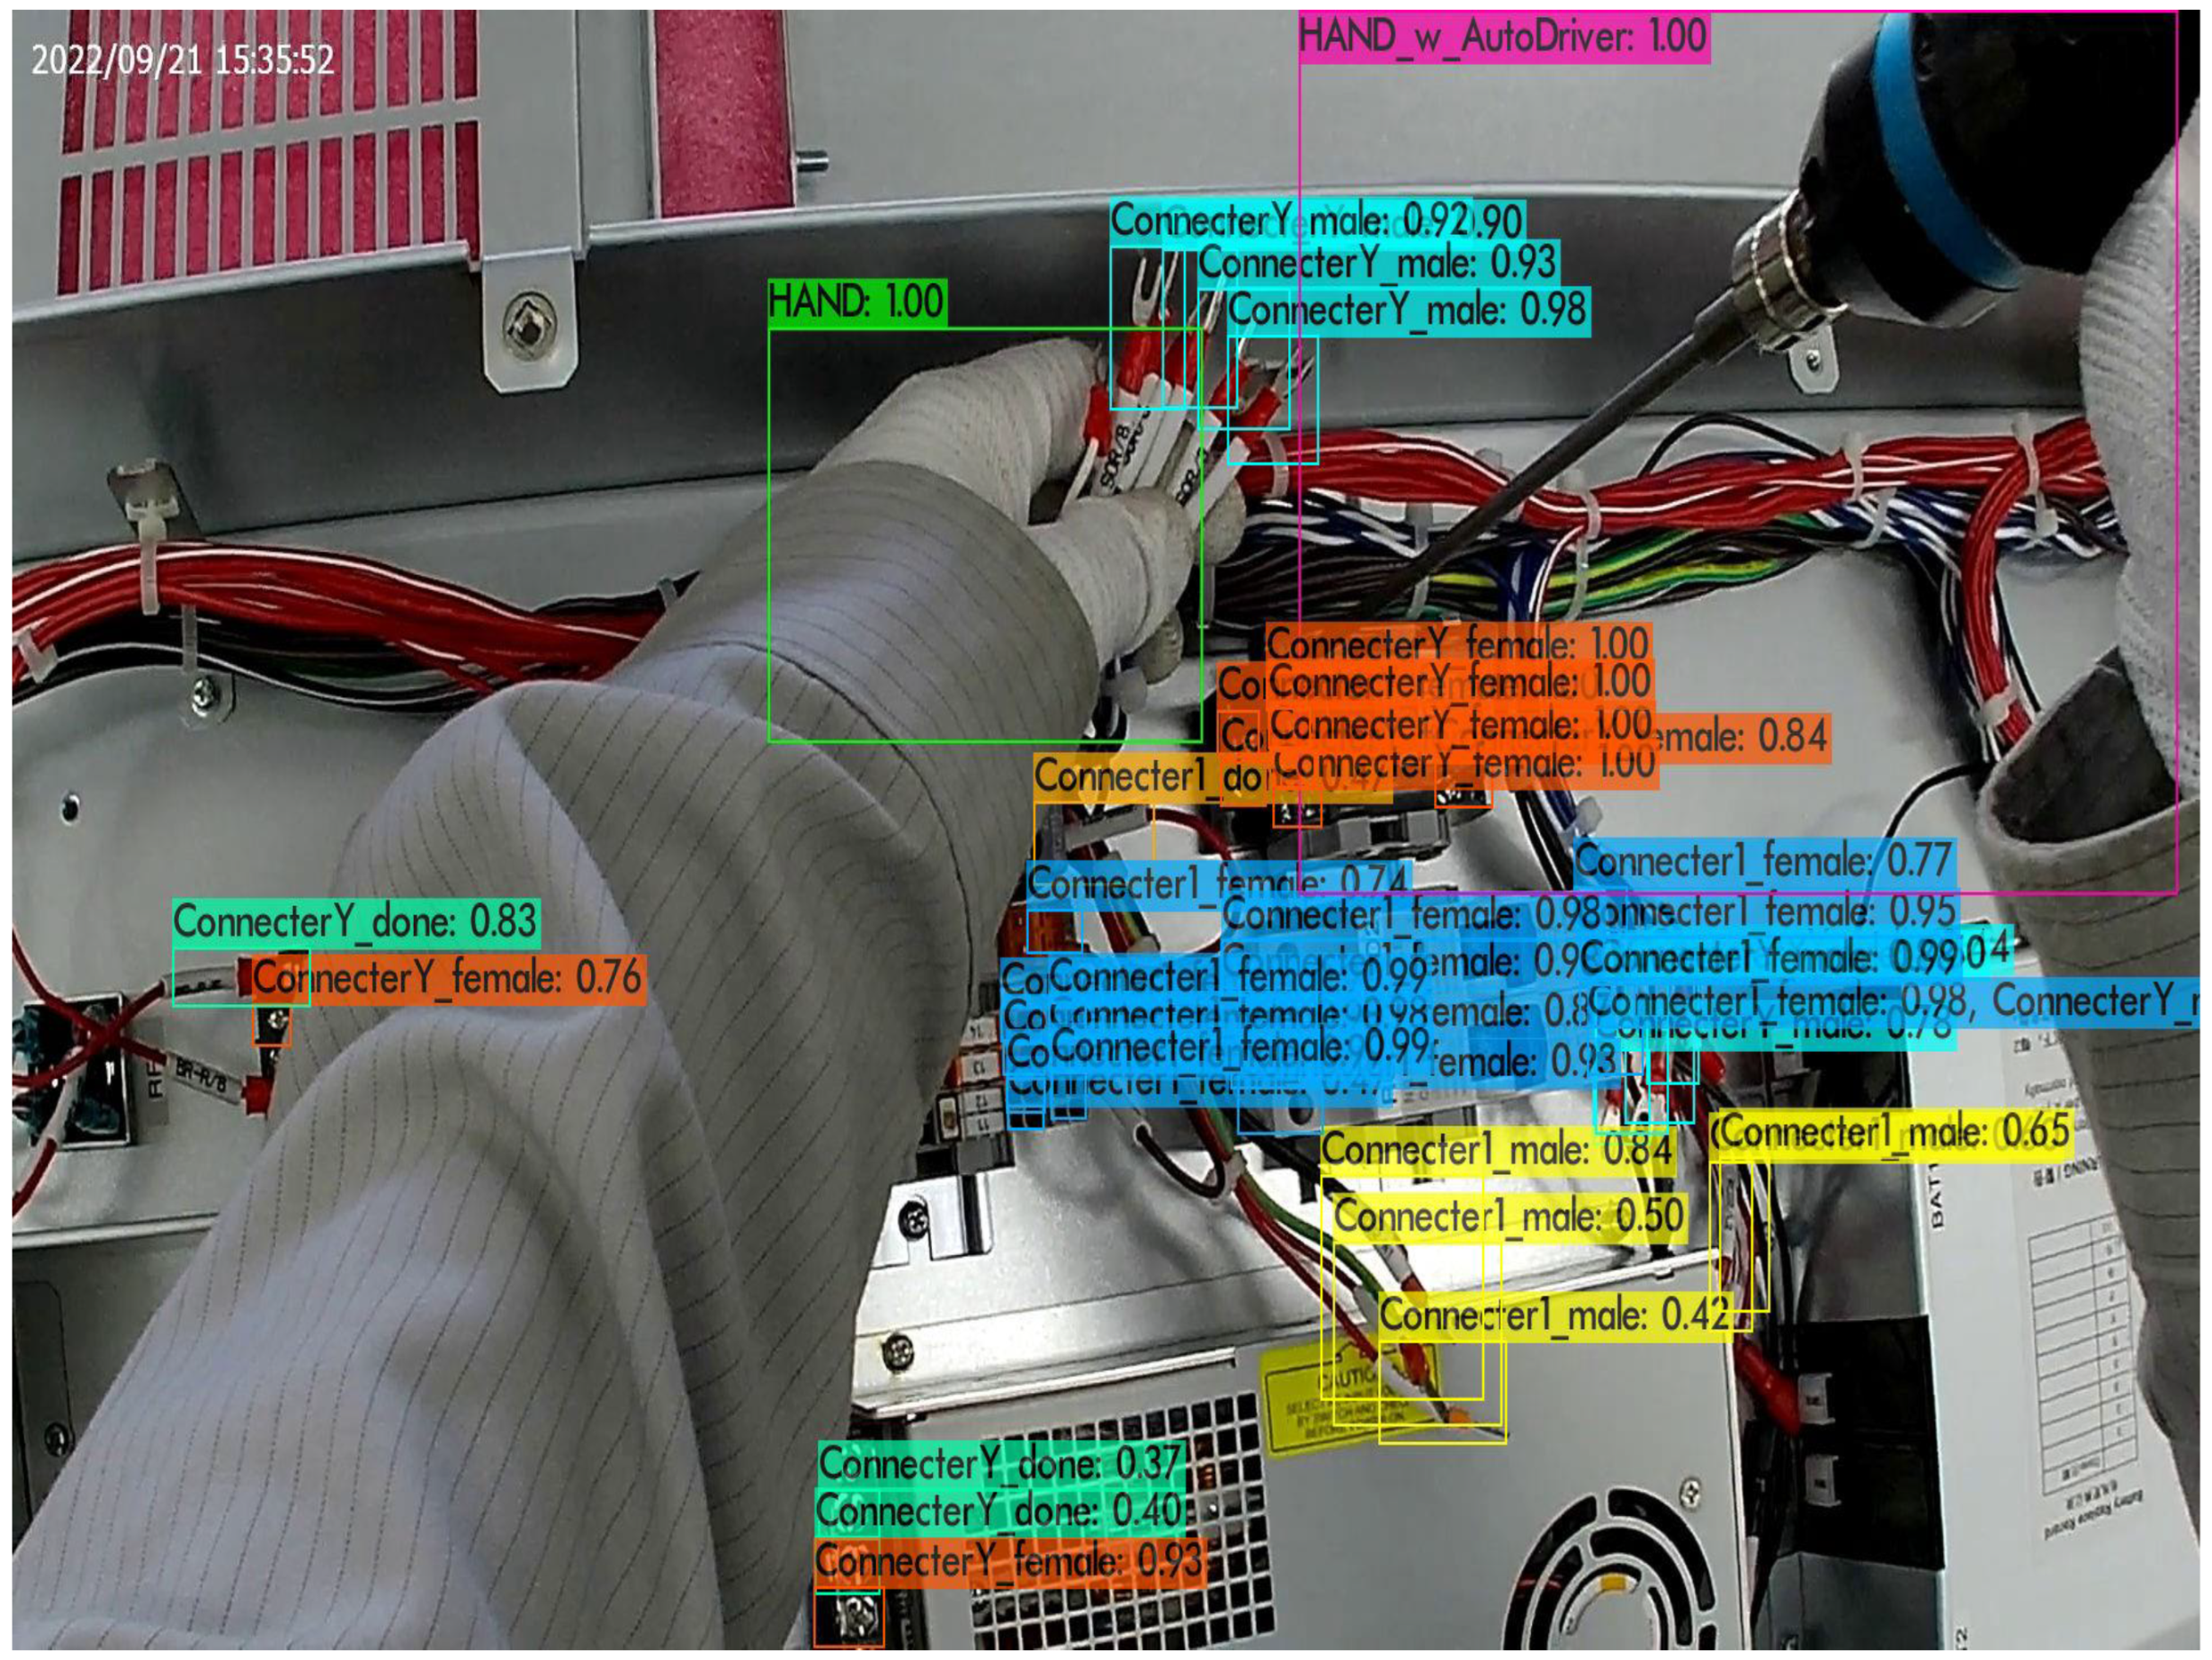
5.3.1. Object-Detection Results of YOLO
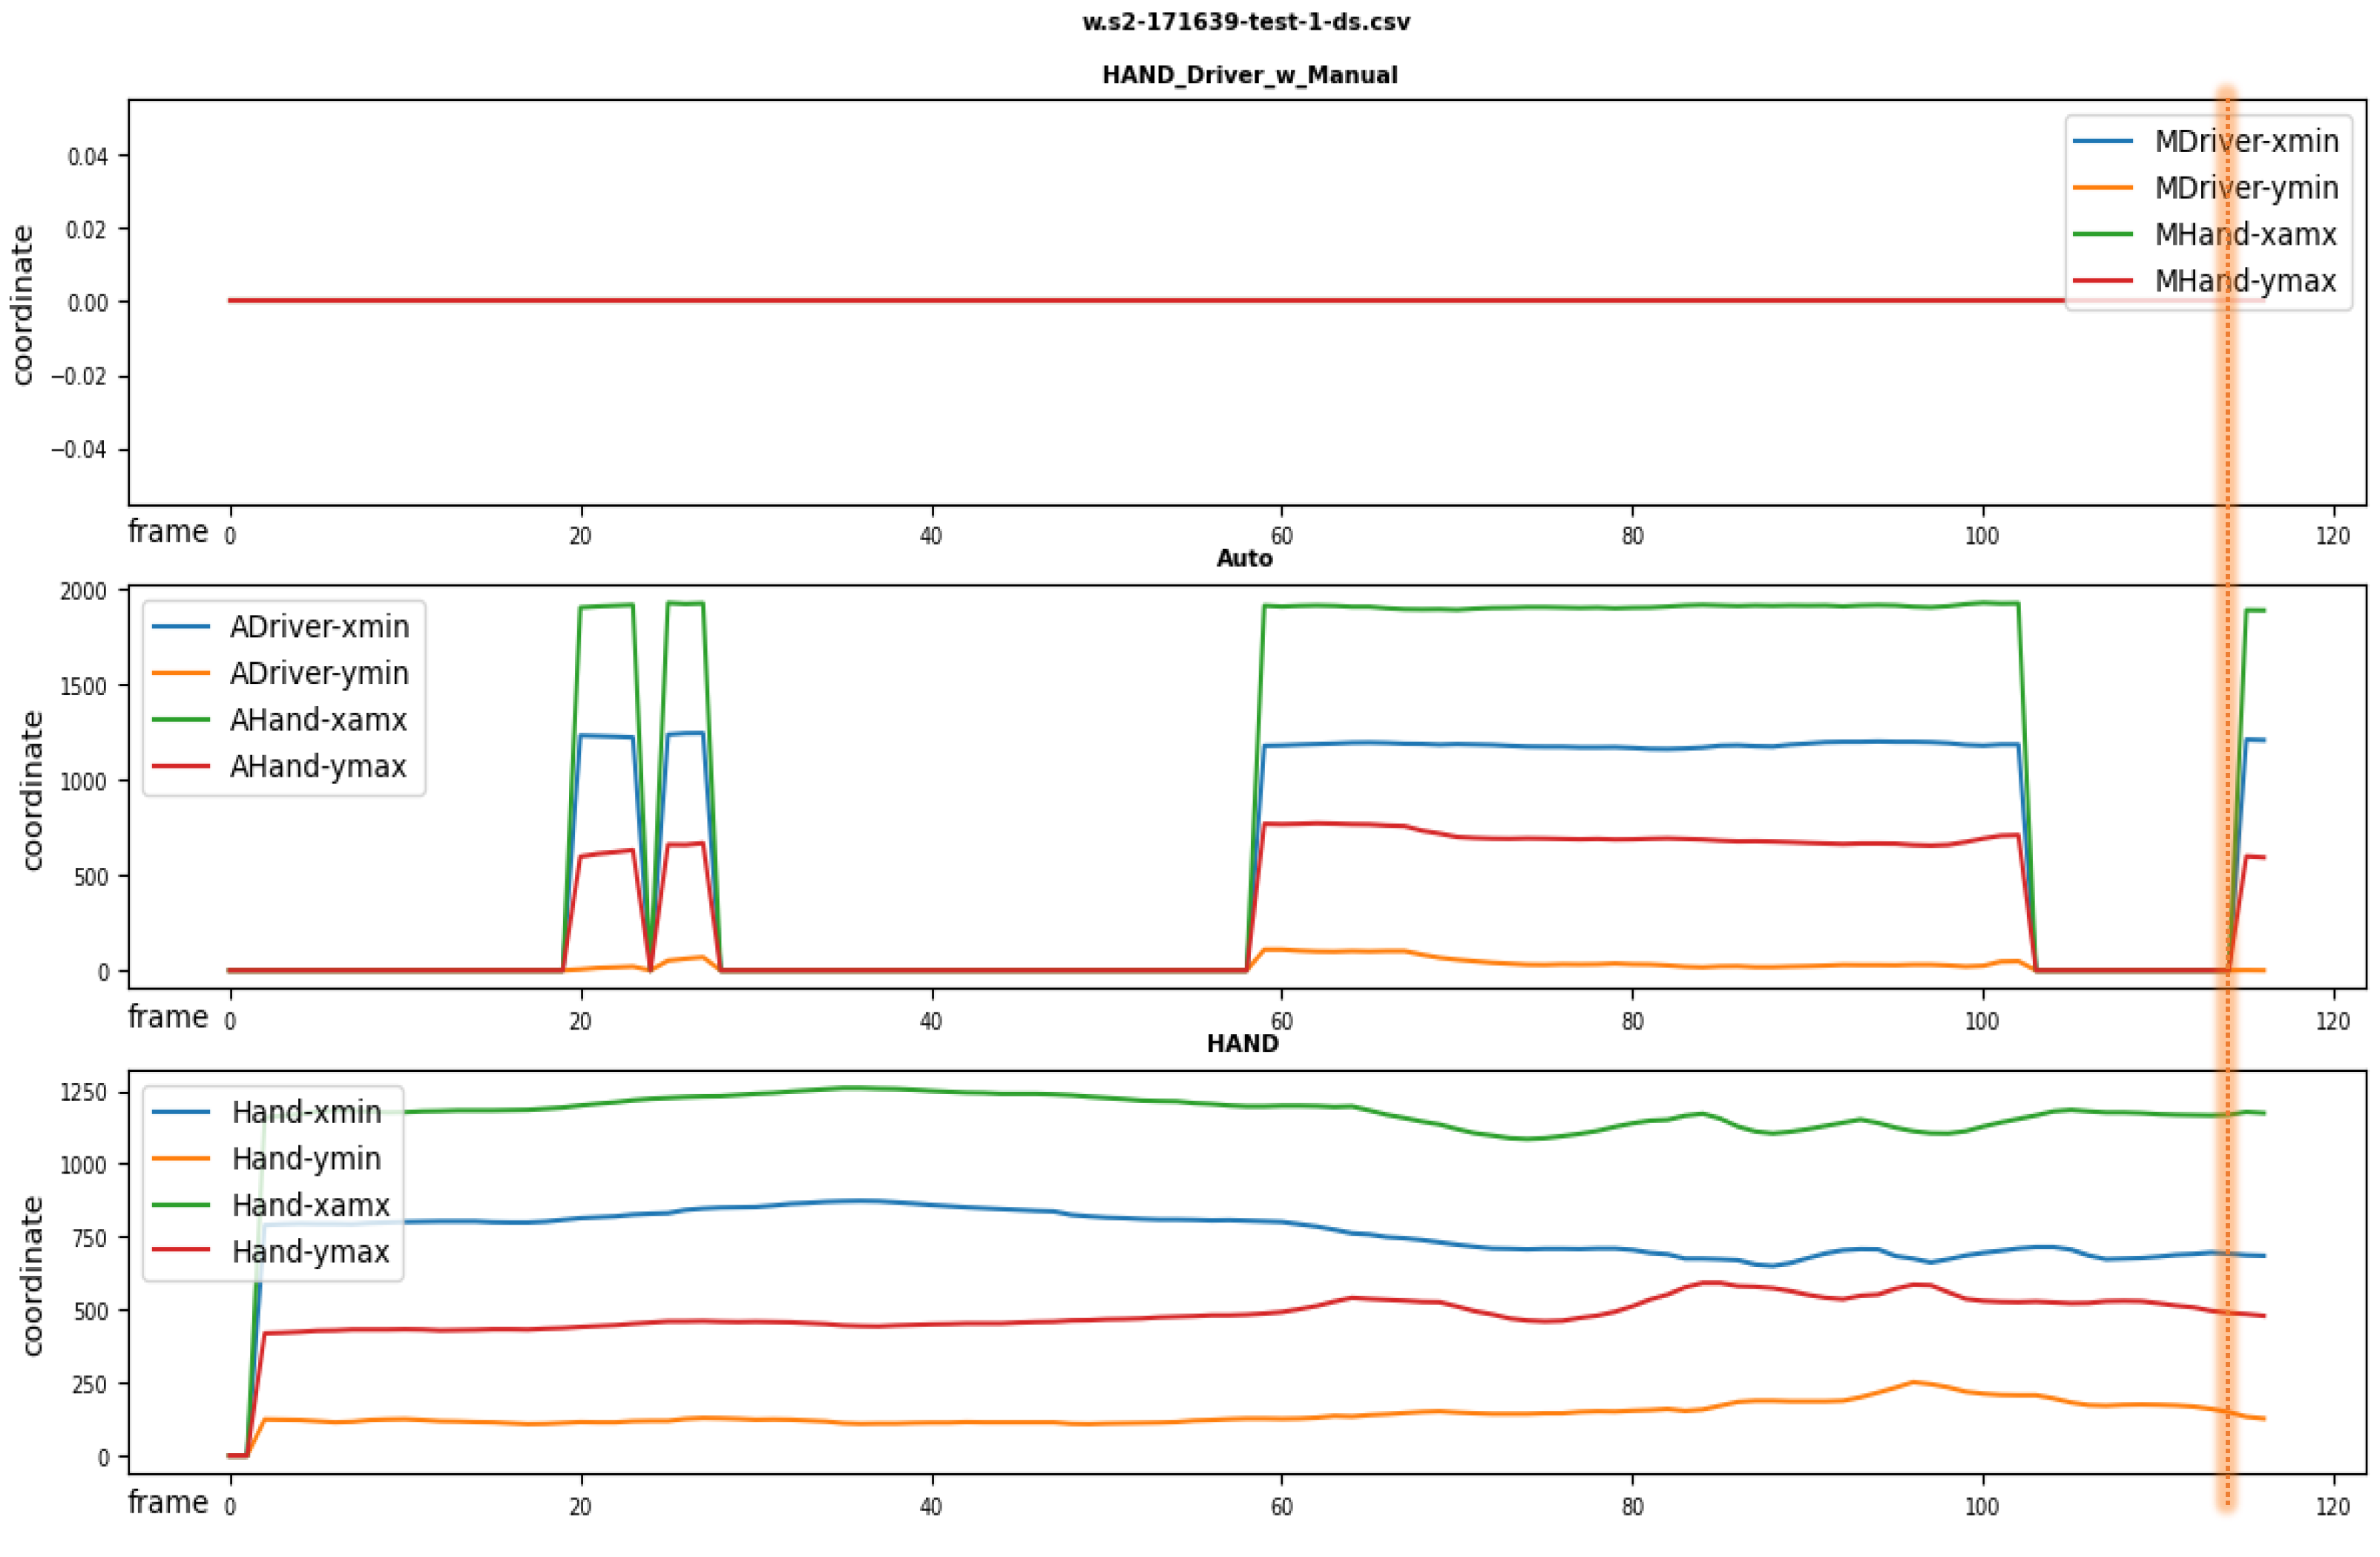
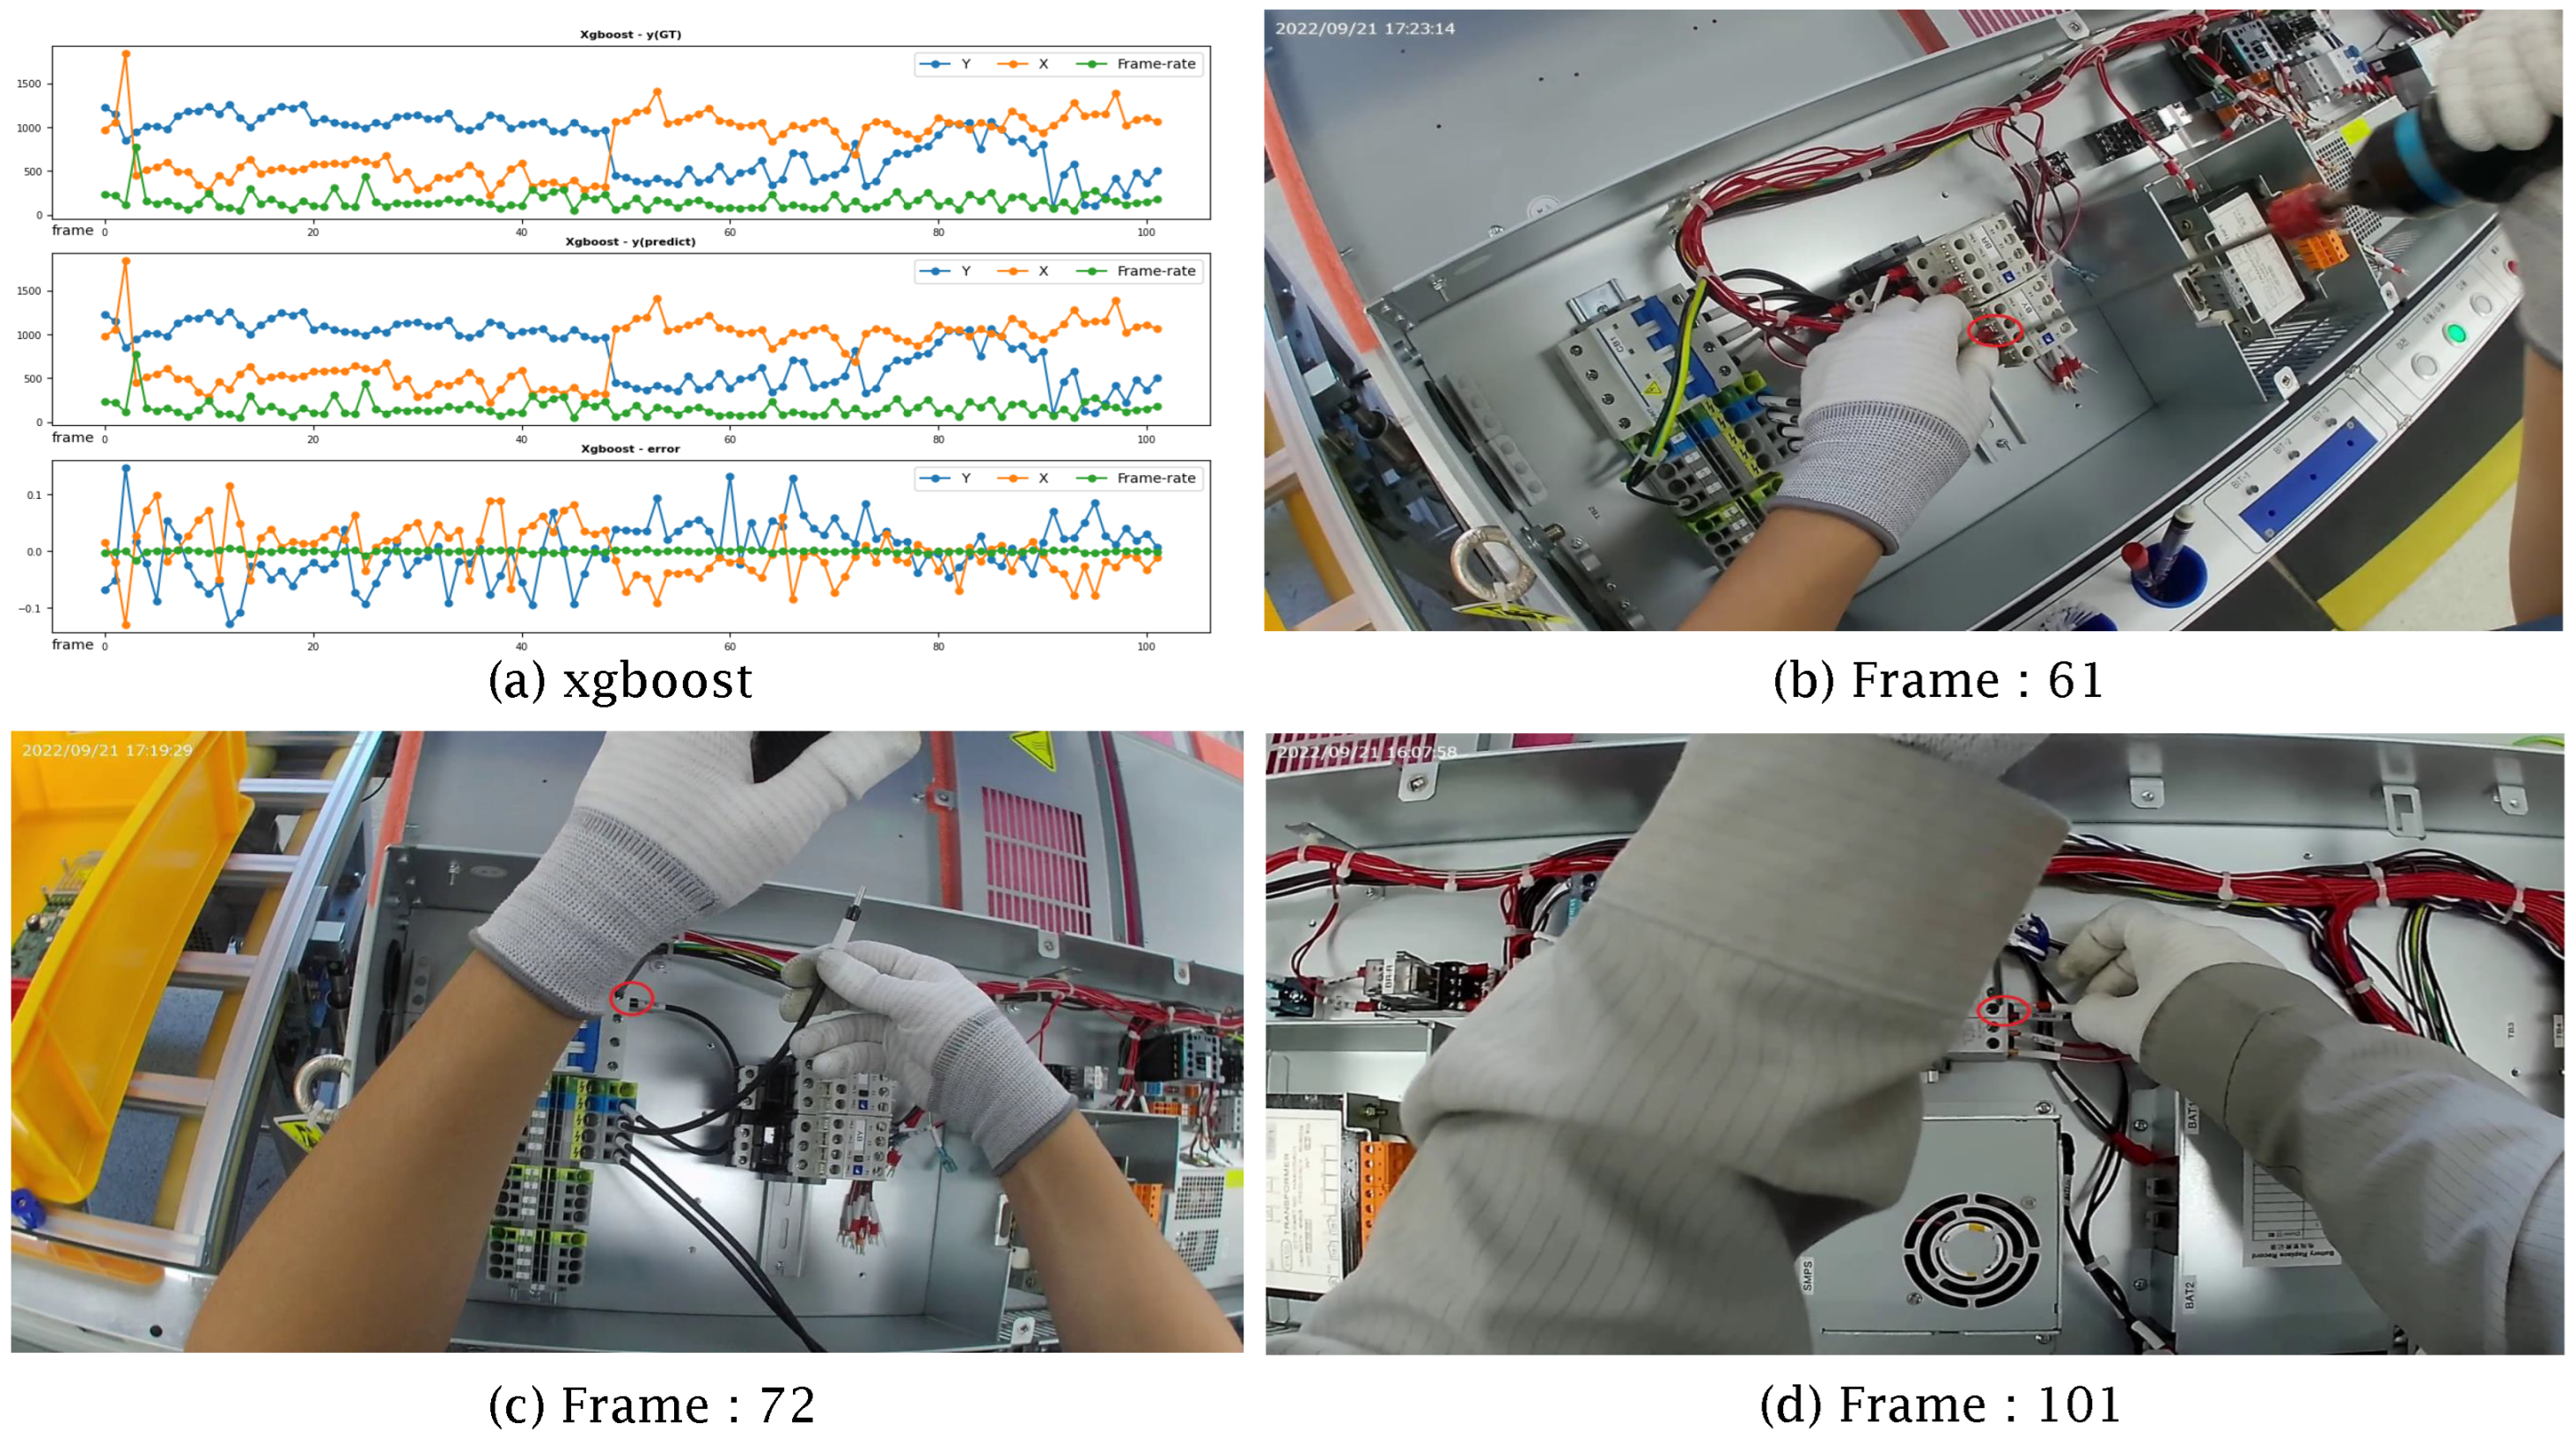
Figure 9 shows a section of the site data. After testing the data in Figure 9 with the input values, the corresponding results were obtained, as shown in Figure 13 and Figure 14. The obtained AP values for each class range from 0.37 to 1.00. As the threshold value was not specified, the focus was on whether the recognition functioned properly. Thus, although the recognition was deemed successful, its accuracy was considered inadequate.

5.3.2. Regression

The first picture in Figure 15 shows the time-series regression results using Xgboost. The other three pictures show the locations where the pin was fastened immediately after the worker’s hand holding the driver appeared and disappeared, marked with red circles on the coordinates. The red circles here indicate the positions in the actual video corresponding to the coordinate values predicted by Xgboost. The coordinate values for each of the three frames are as follows: frame_61 (1017, 488), frame_72 (686, 822) and frame_101 (1063, 507). The coordinate values predicted via Xgboost are as follows: frame_61 (1017, 488), frame_72 (686, 822) and frame_101 (1063, 507). The error values per frame are as follows: frame_61 (−0.01, −0.012), frame_72 (−0.001, 0.006) and frame_101 (−0.005, 0.003). Testing all 102 data points revealed that the predicted values were in compliance.

5.4. Discussion and Future Works

Our proposed method employs the YOLO algorithm to detect objects. The detection trigger is set at the point where a pin is fastened, coinciding with the worker’s hand appearing and then disappearing. Additionally, we assessed the performance of our trained model using nine different regression algorithms. We anticipate that by ensuring an equal distribution of labeling and class-specific data, we can develop a more robust model. However, our methodology might be improved by adopting state-of-the-art object-detection/pose-estimation algorithms such as YOLO-NAS [26]. YOLO-NAS is designed to detect small objects, enhance localization accuracy and improve the performance-per-compute ratio for real-time application in edge-device environments. While it can be applied to pose estimation, the focus of our proposed paper is not on estimating the pose of workers, but rather on identifying fastening locations and timings in manual assembly.
For future work, we aim to extend the capabilities of our system by integrating more advanced versions of YOLO-NAS that are optimized for even lower computational overhead and greater efficiency on edge devices. This would enable us to handle more complex scenes in manual assembly environments with higher accuracy and faster processing times. Additionally, we plan to explore the feasibility of adapting our system for real-time pose estimation of workers to further enhance safety and ergonomics in industrial settings. These improvements will contribute to smarter, more adaptive automation technologies in manufacturing processes.
Also, in our future research, we will also conduct a comparative analysis of our model against the YOLO-NAS Pose models, which have demonstrated state-of-the-art accuracy and latency on the COCO Val 2017 dataset. Specifically, the nano version of YOLO-NAS Pose, capable of achieving output speeds up to 425 fps on a T4 GPU and its larger counterpart, which reaches up to 113 fps, will be evaluated as potential competitors. By assessing these models, we aim to benchmark our system’s performance and identify areas for enhancement, ensuring that our solution remains competitive in high-speed, high-accuracy applications in industrial environments.
In our upcoming research efforts, we will incorporate improvements to the loss functions used during the training phase, as inspired by Deci’s advancements. We plan to enhance our model’s accuracy for both bounding box detection and pose estimation by adopting a dual metric approach. Alongside the traditional Intersection by Union (IoU) score, we will also incorporate an Object Keypoint Similarity (OKS) score, which assesses the accuracy of predicted key points against actual key points. Furthermore, we will explore the implementation of the OKS forward regression method, which has been shown to outperform the conventional L1 and L2 loss methods in similar applications. This advancement will potentially lead to more precise and reliable model predictions in real-world scenarios.

6. Conclusions

In this study, the algorithm based on the YOLO algorithm was developed to detect errors in manual assembly processes on production lines using data on the position of objects and the worker’s hand. The algorithm was evaluated using actual field data and a mAP value of 35% was achieved. However, to improve the algorithm’s accuracy, the class-specific data in labeling and training should be evenly distributed to create weights.
Based on the results of this study, a comparison of performance using video input data captured from the worker’s viewpoint and a fixed height will be conducted to determine an alternative solution. By combining YOLO with the accurate determination of the screw-fastening moment and location, further research can be conducted to verify whether the screw is properly fastened at that moment and location. This can lead to the development of a more reliable and efficient system for detecting errors in manual assembly processes on production lines. Additionally, the proposed algorithm can also be extended to other applications, such as monitoring and detecting errors in similar manual processes.

Author Contributions

Conceptualization, Y.Y.; Methodology, B.L.; Formal analysis, S.J.; Data curation, S.J.; Writing—original draft, B.L. and Y.Y.; Visualization, B.L.; Supervision, Y.Y.; Project administration, Youngjun Yoo. All authors have read and agreed to the published version of the manuscript.

Funding

This study has been funded with the support of the Ministry of SMEs and Startups as “Development of Intelligent SHWIS (AI—Smart Human Work Interactive Interface System) AR technology that provides AR Inspection”.

Institutional Review Board Statement

Not applicable.

Informed Consent Statement

Not applicable.

Data Availability Statement

The original contributions presented in the study are included in the article, further inquiries can be directed to the corresponding author.

Conflicts of Interest

The authors declare no conflicts of interest.

References

  1. Hozdić, E. Smart factory for industry 4.0: A review. Int. J. Mod. Manuf. Technol. 2015, 7, 28–35. [Google Scholar]
  2. Büchi, G.; Cugno, M.; Castagnoli, R. Smart factory performance and Industry 4.0. Technol. Forecast. Soc. Chang. 2020, 150, 119790. [Google Scholar] [CrossRef]
  3. Krüger, J.; Lien, T.K.; Verl, A. Cooperation of human and machines in assembly lines. CIRP Ann. 2009, 58, 628–646. [Google Scholar] [CrossRef]
  4. Wallhoff, F.; Blume, J.; Bannat, A.; Rösel, W.; Lenz, C.; Knoll, A. A skill-based approach towards hybrid assembly. Adv. Eng. Inform. 2010, 24, 329–339. [Google Scholar] [CrossRef]
  5. Li, F.; Jiang, Q.; Zhang, S.; Wei, M.; Song, R. Robot skill acquisition in assembly process using deep reinforcement learning. Neurocomputing 2019, 345, 92–102. [Google Scholar] [CrossRef]
  6. Morioka, M.; Sakakibara, S. A new cell production assembly system with human–robot cooperation. CIRP Ann. 2010, 59, 9–12. [Google Scholar] [CrossRef]
  7. Kucukoglu, I.; Atici-Ulusu, H.; Gunduz, T.; Tokcalar, O. Application of the artificial neural network method to detect defective assembling processes by using a wearable technology. J. Manuf. Syst. 2018, 49, 163–171. [Google Scholar] [CrossRef]
  8. Lee, Y.; Kim, J.; Joo, H.; Raj, M.S.; Ghaffari, R.; Kim, D. Wearable sensing systems with mechanically soft assemblies of nanoscale materials. Adv. Mater. Technol. 2017, 2, 1700053. [Google Scholar] [CrossRef]
  9. Redmon, J.; Divvala, S.; Girshick, R.; Farhadi, A. You only look once: Unified, real-time object detection. In Proceedings of the 2016 IEEE Conference on Computer Vision and Pattern Recognition (CVPR), Las Vegas, NV, USA, 27–30 June 2016; pp. 779–788. [Google Scholar]
  10. Chen, T.; Guestrin, C. Xgboost: A scalable tree boosting system. In Proceedings of the 22nd ACM Sigkdd International Conference on Knowledge Discovery and Data Mining, San Francisco, CA, USA, 13–17 August 2016; pp. 785–794. [Google Scholar] [CrossRef]
  11. Schapire, R.E. Explaining Adaboost. In Empirical Inference: Festschrift in Honor of Vladimir N. Vapnik; Springer: Berlin/Heidelberg, Germany, 2013; pp. 37–52. [Google Scholar] [CrossRef]
  12. Bauer, E.; Kohavi, R. An empirical comparison of voting classification algorithms: Bagging, boosting and variants. Mach. Learn. 1999, 36, 105–139. [Google Scholar] [CrossRef]
  13. John, V.; Liu, Z.; Guo, C.; Mita, S.; Kidono, K. Real-time lane estimation using deep features and extra trees regression. In Lecture Notes in Computer Science, Proceedings of the Image and Video Technology: 7th Pacific-Rim Symposium, PSIVT 2015, Auckland, New Zealand, 25–27 November 2015; Revised Selected Papers 7; Springer: Cham, Switzerland, 2016; pp. 721–733. [Google Scholar] [CrossRef]
  14. Bentéjac, C.; Csörgő, A.; Martínez-Muñoz, G. A comparative analysis of Gradient Boosting algorithms. Artif. Intell. Rev. 2021, 54, 1937–1967. [Google Scholar] [CrossRef]
  15. Biau, G.; Scornet, E. A Random Forest guided tour. Test 2016, 25, 197–227. [Google Scholar] [CrossRef]
  16. Phyo, P.; Byun, Y.; Park, N. Short-term energy forecasting using machine-learning-based ensemble voting regression. Symmetry 2022, 14, 160. [Google Scholar] [CrossRef]
  17. Fabian, P. Scikit-learn: Machine learning in Python. J. Mach. Learn. Res. 2011, 12, 2011. [Google Scholar]
  18. Bisong, E. Introduction to Scikit-learn. In Building Machine Learning and Deep Learning Models on Google Cloud Platform: A Comprehensive Guide for Beginners; Apress: Berkeley, CA, USA, 2019; pp. 215–229. [Google Scholar] [CrossRef]
  19. Nepal, U.; Eslamiat, H. Comparing YOLOv3, YOLOv4 and YOLOv5 for autonomous landing spot detection in faulty UAVs. Sensors 2022, 22, 464. [Google Scholar] [CrossRef] [PubMed]
  20. Bochkovskiy, A.; Wang, C.; Liao, H.M. Yolov4: Optimal speed and accuracy of object detection. arXiv 2020, arXiv:2004.10934. [Google Scholar] [CrossRef]
  21. Chen, C.; Wang, T.; Li, D.; Hong, J. Repetitive assembly action recognition based on object detection and pose estimation. J. Manuf. Syst. 2020, 55, 325–333. [Google Scholar] [CrossRef]
  22. Zhang, J.; Wang, P.; Gao, R.X. Hybrid machine learning for human action recognition and prediction in assembly. Robot. Comput.-Integr. Manuf. 2021, 72, 102184. [Google Scholar] [CrossRef]
  23. Andrianakos, G.; Dimitropoulos, N.; Michalos, G.; Makris, S. An approach for monitoring the execution of human based assembly operations using machine learning. Procedia Cirp. 2019, 86, 198–203. [Google Scholar] [CrossRef]
  24. Ralyté, J.; Rolland, C. An Assembly Process Model for Method Engineering. In Lecture Notes in Computer Science, Proceedings of the Advanced Information Systems Engineering: 13th International Conference, CAiSE 2001, Interlaken, Switzerland, 4–8 June 2001; Proceedings 13; Springer: Berlin/Heidelberg, Germany, 2001; pp. 267–283. [Google Scholar] [CrossRef]
  25. Wojke, N.; Bewley, A.; Paulus, D. Simple online and realtime tracking with a deep association metric. In Proceedings of the 2017 IEEE International Conference on Image Processing (ICIP), Beijing, China, 17–20 September 2017; pp. 3645–3649. Available online: https://ieeexplore.ieee.org/document/8296962 (accessed on 1 April 2024).
  26. Terven, J.; Córdova-Esparza, D.-M.; Romero-González, J.-A. A Comprehensive Review of YOLO Architectures in Computer Vision: From YOLOv1 to YOLOv8 and YOLO-NAS. Mach. Learn. Knowl. Extr. 2023, 5, 1680–1716. [Google Scholar] [CrossRef]
Figure 1. Schematic diagram of the proposed methodology.
Applsci 14 03611 g001
Figure 2. Class definition for object detection of the proposed process.
Applsci 14 03611 g002
Figure 3. Deepsort results of the corresponding class for the proposed methodology.
Applsci 14 03611 g003
Figure 4. Time series information for regression of the manual assembly timing and position.
Applsci 14 03611 g004
Figure 5. Data pre-processing diagram of the proposed methodology.
Applsci 14 03611 g005
Figure 6. Model name: Drift X3.
Applsci 14 03611 g006
Figure 7. Learning result of Dataset.
Applsci 14 03611 g007
Figure 8. Performance-analysis results by class.
Applsci 14 03611 g008
Figure 9. Regression results of the Xgboost and Adaboost.
Applsci 14 03611 g009
Figure 10. Regression results of the Random Forest and Bagging.
Applsci 14 03611 g010
Figure 11. Regression results of the Prediction Voting and Extra Trees.
Applsci 14 03611 g011
Figure 12. Regression results of the Gradient Boosting.
Applsci 14 03611 g012
Figure 13. Test data for object detection for the manual assembly process.
Applsci 14 03611 g013
Figure 14. Result of the test data for object detection for the manual assembly process.
Applsci 14 03611 g014
Figure 15. Regression results of the screwing position of the manual assembly process corresponding timing (frame).
Applsci 14 03611 g015
Table 1. Explanation of Regression algorithms.
Regression AlgorithmDescription
XgboostXgboost is an algorithm that utilizes decision trees and hyper
parameters Γ and Δ to prevent overfitting, which can occur in
Gradient Tree Boosting. Its structure reduces the loss function
by weighting learning in the ensemble process and supports
parallel processing, resulting in faster speeds.
AdaboostAdaboost is a similar algorithm to Random Forest, which uses
stumps (single-condition decision trees) for classification.
In Adaboost, the result value for each stump influences the
weight and classification of subsequent stumps, a process
known as boosting.
BaggingBagging is an algorithm that uses bootstrapping, which is a
method of randomly sampling and extracting a certain amount
of data from a given dataset with replacement. The learning
process is then repeated n times to obtain an average and
the final prediction result is derived through higher prediction
values or majority voting. These characteristics have the
advantage of being able to offset errors in the classifier.
Extra-TreesExtra-Trees is an algorithm with a structure similar to Random
Forest, but it differs from Random Forest in that it selects the
data with the highest score during the process of extracting
random data. This prevents overfitting and enables node
segmentation to be performed quickly, resulting in high
accuracy and speed.
Gradient BoostingGradient Boosting is a structure similar to Adaboost, consisting
of a stump. In Gradient Boosting, new learning is conducted by
assigning high weights to data that were incorrectly predicted
from the results of previous learning. The algorithm repeats this
process to learn in the direction of minimizing the loss function.
However, a disadvantage of Gradient Boosting is its long learning
time.
Random ForestRandom Forest is an algorithm that consists of several decision
trees. The decision tree is used as a solution to overfitting,
which occurs when the learning data are insufficient or the
number of features is large and shows the same results as
the learning data.
Prediction Voting
Regressor for
Unfitted Estimators
The Prediction Voting Regressor for Unfitted Estimators is an
algorithm that uses multiple estimators to predict the entire
dataset and calculates their average to make the final prediction.
This approach increases the reliability of the prediction due to
the use of multiple estimators. However, there is a risk of
overfitting during the random parameter specification process.
Table 2. Body cam information.
Specification ItemDetails
Video FormatMP4 (H.264), 1080P@30FPS
Lens Type140 wide angle
InputType-c usb, TRRS port
BluetoothBuild-in, remote control compatible
Size (L × W × H)47 mm × 92 mm × 35 mm
Photo model4, 8, 12 Mega pixels
Battery3000 mAh rechargeable
memoryMicro sd, SDHC, SDXC, up to 256 gb
WaterproofIP × 7 waterproof
Weight97 g
Sensor typeSONY 12MP
MicrophoneBuild-in
Wi-Fi2.4/5.8 G
Disclaimer/Publisher’s Note: The statements, opinions and data contained in all publications are solely those of the individual author(s) and contributor(s) and not of MDPI and/or the editor(s). MDPI and/or the editor(s) disclaim responsibility for any injury to people or property resulting from any ideas, methods, instructions or products referred to in the content.

