
Improved Design of Imaging System for Online Detection of Large-Sized Step-Shaft Runout Errors
1
School of Opto-Electronic Engineering, Changchun University of Science and Technology, Changchun 130022, China
2
Institute of Optoelectronic Measurement and Control Technology, Changchun 130022, China
*
Authors to whom correspondence should be addressed.
Appl. Sci. 2024, 14(9), 3614; https://doi.org/10.3390/app14093614
Submission received: 29 February 2024
/
Revised: 18 April 2024
/
Accepted: 19 April 2024
/
Published: 24 April 2024
(This article belongs to the Special Issue Optical Imaging and Sensing: From Design to Its Practical Use)
Abstract
:Large-sized step shafts are important devices for supporting and transferring heavy parts, and online inspection equipment for runout errors is affected by the environment and is subject to coaxiality errors and center-position errors, leading to problems such as reduced measurement accuracy in imaging systems. In view of the above problems, this paper proposes an improved optical imaging system design for runout error detection based on the plane-mirror-group correction method. Zemax was used to optimize the structure and simulate the optical path of the optical imaging system. The total length of the structure was 50 mm, and the MTF function for each field of view was greater than 0.3 at the spatial level up to a frequency of 42 lp/mm. The system was applied to a test platform for runout error detection, achieving the detection of runout errors of a large size in the radial direction and at the end face with a diameter range of 500–700 mm. The measurement repeatability was less than 30 μm, and the system corrected the coaxiality error of the stepped-shaft online inspection equipment considered in this paper.
1. Introduction
A large-sized step shaft is a piece of modern, large-scale precision equipment that is important in transmission machinery parts, the transfer of movement, torque, and other important aspects. However, step shafts are affected by processing equipment and environmental factors, and in the case of rotary radial runout error and end-face runout error in rotary processes, runout error directly affects the transmission accuracy of the shaft parts, which leads to friction, vibration, and noise phenomena, reducing the service life of the stepped shaft [1,2,3]. In stepped-shaft runout error detection, the non-contact online measurement method is used to obtain measurement values for runout errors via imaging analysis of the stepped-shaft rotary process. However, in actual measurements in factories, it has been found that the stepped-shaft extraction and installation process causes the installation of different axes, center-position offset, and other impacts on imaging results, resulting in a reduction in measurement accuracy [4,5,6]. Therefore, for the non-contact online measurement of runout errors in large-sized step shafts, it is very important to reduce the influence of coaxiality errors and center-position errors on imaging during the extraction and installation process so as to improve the accuracy of the detection of runout error in large-sized step shafts.
In recent years, researchers and scholars at home and abroad have proposed a variety of methods for developing non-contact online inspection imaging systems to assess runout error. For instance, Peng et al. designed a long-distance imaging system for the non-contact measurement of radial runout errors in lathe spindles, where the ratio of the object image was close to 1, and the system was combined with a sub-pixel positioning algorithm to improve the edge of the actual positioning accuracy. The measurement accuracy for radial runout error reached the sub-micrometer level, but the system could only be applied at low speeds, as it was only applicable to the spindles of machine tools with low rotational speeds [7]. Zhou et al. proposed a structured, light-based runout error measurement method that used a fisheye lens and divided the field of view into multiple regions for correction, and the experimental results showed that the measurement accuracy for a 30 mm axis was 20 μm [8]. Zhang et al. proposed a method of coaxiality error measurement based on the principle of laser ranging for large-sized parts, and the Kalman filtering method was used to measure the data. The Kalman filtering method is used to process the data, and coaxiality error measurement can be achieved for large parts less than 0.5 mm in size [9]; however, the system is affected by ambient light. These methods are based on the algorithmic processing of measurement data, and it is difficult to realize the correction of coaxiality errors when large-sized stepped-shaft runout error detection uses these data, such that these techniques cannot guarantee real-time, accurate online measurement. Therefore, in view of the shortcomings of the above methods, such as their low measurement accuracy and the great influence of ambient light, this paper proposes an improved design for an imaging system in order to meet the needs for the accurate online detection of large-sized, stepped-shaft runout errors based on a plane mirror set with a diameter range of 500–700 mm.
2. Principle and Simulation Analysis
2.1. The Working Principle of the Runout Detection System
The runout detection system is an integral part of photoelectric detection in large-sized, stepped-shaft automatic measuring equipment, whose systems include an optical runout detection system, an optical diameter detection system, a base, brackets, etc. A large-sized, stepped-shaft photoelectric detection system is shown in Figure 1.
A runout detection optical system consists of a laser, a collimated focusing optical system, an optical imaging system, a photodetector, a motor drive, and a signal processor, as shown in Figure 2. The system uses direct laser triangulation for runout detection, which has the advantages of concentrated light intensity, a simple structure, and a low error rate. Direct laser triangulation can be used to determine a measured object’s displacement because a point of displacement can be an imaging spot, and this point can be used as the measurement position for a one-to-one correspondence, which is more suitable for runout detection along a stepped axis.
The measurement principle of direct laser triangulation is shown in Figure 3, where the beam emitted by the laser diode is vertically incident on the reference plane through the collimated focusing optical system and then converges on the photosensitive surface of the photodetector through the lens of the optical imaging system after reflection occurs. When the step axis in the rotation process produces a jump, the measured point from the reference plane moves along the direction of the incident optical axis from point A to point B, resulting in a displacement of y. With the change in the image point in the photodetector from point A′ to point B′ and with the displacement of y′, the detector at the spot position can detect the amount of change in order to calculate the runout error along the stepped axis [10,11].
This may be calculated according to optical imaging theorem and the direct laser triangulation method:
where B’C’ = y’ × sinβ; A’C’ = y’ × cosβ; C = y × sinα; and AC = y × sinα. From the imaging conditions of Gaussian paraxial optical system, we can see the following:
where l is object distance, l = L, l’ is the image distance, and l’ = L’. Let the focal length of the imaging optical system be ƒ. When the laser beam is incident on the surface of the measured object, Equation (2) can be substituted to obtain the following formula:
Substitute into Equation (1) to find the displacement L of the measured object. It can be shown that when the actual position is under the reference position, the runout y is as follows:
When the actual position is at the reference position, the runout y is as follows:
The distance between the intersection point A of the principal optical axis of the imaging system, the incident beam, and the center O is L; the distance between the intersection point A′ of the principal optical axis of the imaging system and the photodetector and the center O is L′; the angle between the principal optical axis and the incident beam is α; and the angle between the photodetector and the principal optical axis is β. Using this information, the following is obtained:
In order to ensure that a clear image is captured of the point of light at each point on the photodetector, the optical path design of the imaging system, the object plane, the image plane, and the main plane of the optical system should satisfy the “Scheimpflug” condition, i.e., the laser beam of the laser transmitter, the main optical axis of the imaging optical system, and the extension of the main plane of the position detector should intersect at a point P, as shown in Figure 3.
2.2. Imaging Optical System Design
The system adopts the ML101J24P red semiconductor laser diode produced by the Mitsubishi Electric Corporation of Japan as the illumination source. It has dimensions of Φ5.6×7 mm, with a typical emission wavelength of 658 nm, and a continuous output optical power of up to 100 mW. Through a collimation and beam expansion system, the beam diameter of the light generated by this source can be controlled to 0.0007 mm. To ensure the efficient utilization of energy in the illumination system, it is optically coupled with a Fourier transform imaging system, with the entrance pupil of the imaging system also set to 0.0007 mm. Additionally, based on the detection principle, the imaging optical system detects jitter errors through linear motion. Compared to selecting CCDs with two-dimensional structures for detection, a position-sensitive detector (PSD) with a one-dimensional structure is more suitable for measuring single-axis positions. PSDs typically have faster response times and can capture changes in light signals in real time, making them advantageous for real-time, non-contact measurement applications [12].
Due to the system’s diameter not exceeding 50 mm and the need for detecting jitter errors within a range of 3 mm for step shafts ranging from 500 mm to 700 mm in size, the PSD-1315 position-sensitive detector (OTRON, Shanghai, China) was chosen. This detector has a photosensitive surface diameter of no more than 30 mm, excellent resolution, a spectral response ranging from 320 nm to 1100 nm, and an effective photosensitive area of 1.3 × 15 mm2. It achieves a resolution of up to 0.1 μm. These characteristics enable the detector to meet the requirements for detection range and precision in the design.
2.2.1. Parameter Calculation of Imaging Optical System
The effective photosensitive surface of the PSD-1315 detector used in the imaging optical system is 1.3 × 15 mm2. In order to eliminate the detection error caused by the nonlinearity of the PSD, only the middle part is used, that is, the spot is imprinted within the range of ±3.5 mm, being placed as close to the center of the detector as possible. Due to the runout error detection of the step axis in the range of ±1.5 mm, it can be known that the linear field of view of the object is 2y = 3 mm. The imaging range of the PSD position detector is ±3.5 mm, that is, the line field of view of the image square is 2y′ = 7 mm. The magnification of the imaging optical lens can be obtained as follows:
Combined with the image position, determined using Formulas (5) and (6) in the above direct laser triangulation method, the relationship between magnification and the angle of the imaging optical system can be obtained using the following formula:
The position of the PSD position detector is determined by its angle μ from the horizontal line, where
From the working principles of the imaging optical system, it can be seen that the runout error of the step axis is measured based on the vertical incidence of the laser beam on the surface of the measured object. When the incident beam is not perpendicular to the surface of the measured object, the tilt of the surface changes the spatial distribution of the scattered light to be equivalent to that of the imaging optical system, resulting in a change in the position of the scattered light spot in the photodetector relative to its vertical incidence. If this is calculated according to the position at this time, there is bound to be an error, namely the inclination error, which is the root cause of measurement errors when assessing the surface of a measured object. It can be seen that when the surface of the measured object is tilted, the position of the light-energy centroid of the image spot on the position detector is shifted to a certain extent relative to its geometric center, and so the light-energy centroid is no longer the geometric center of the image spot.
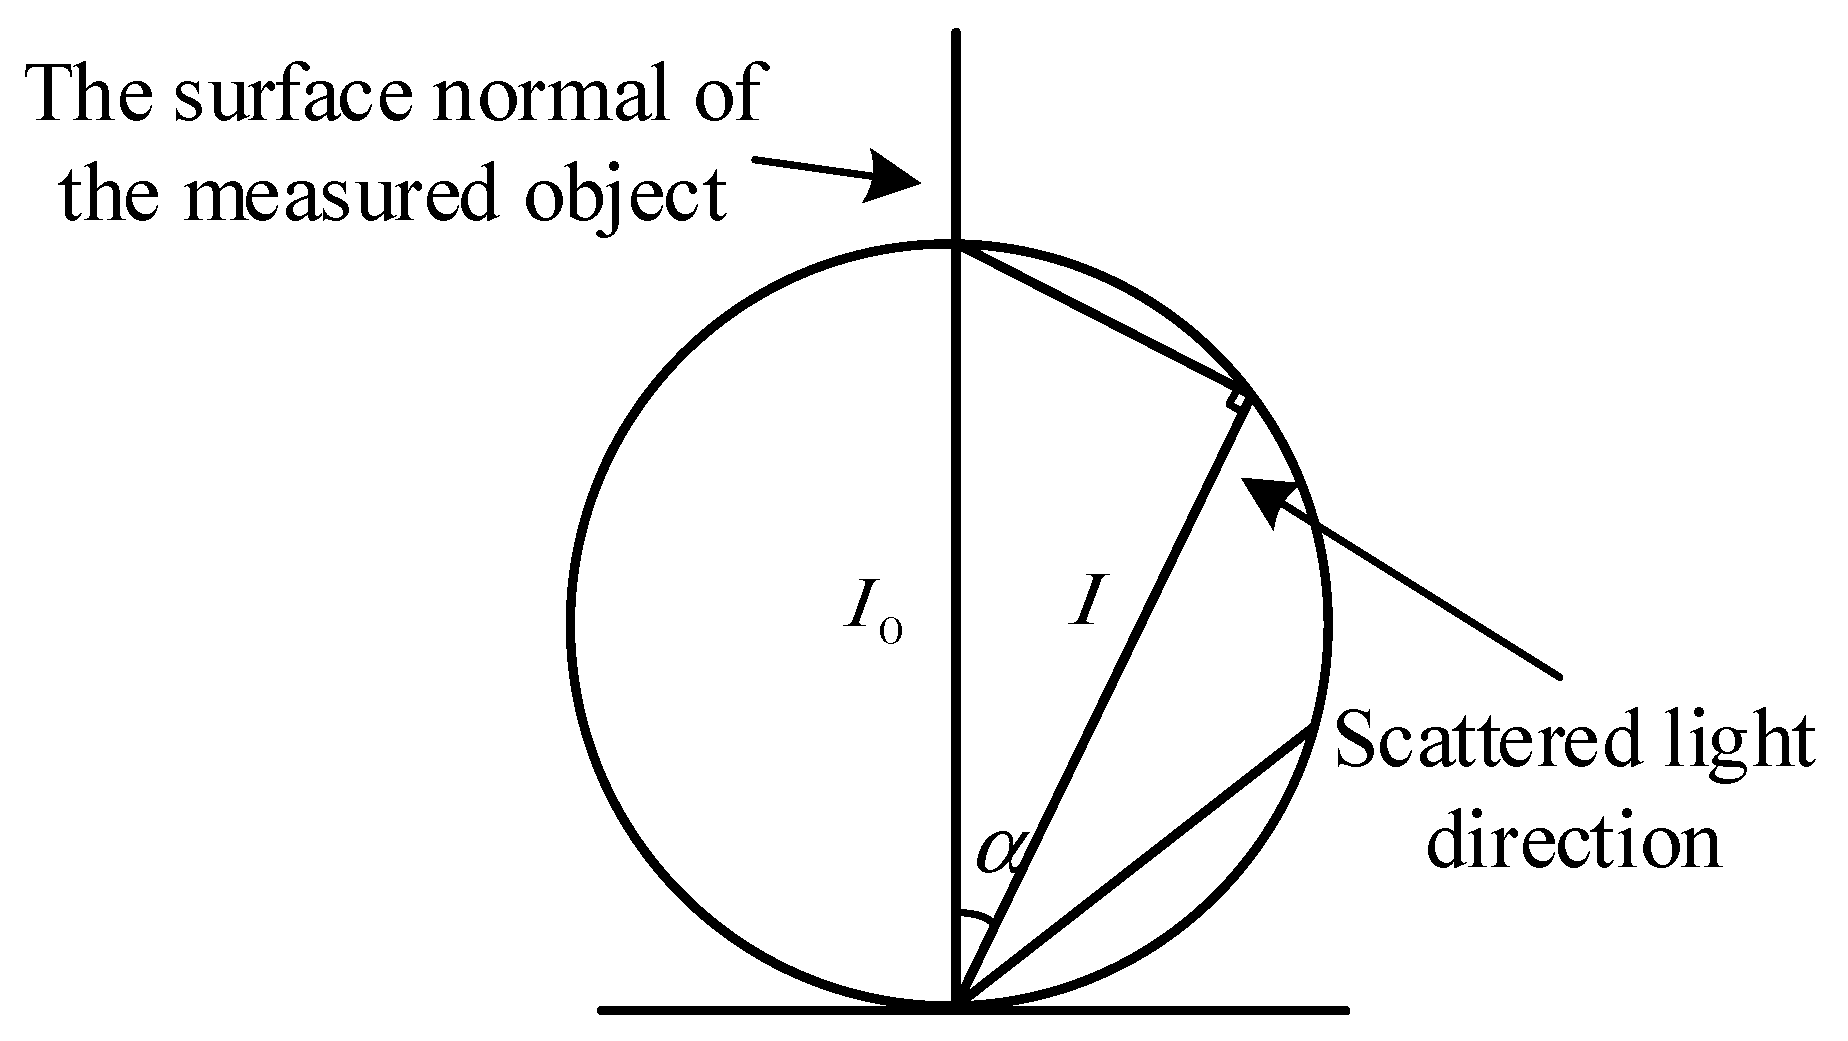
Under ideal conditions, the measured object surface can be approximately regarded as a diffuse reflective surface, and the influence of the object surface tilt is analyzed based on Lambert’s law [11]. The schematic diagram of Lambert’s Law is shown in Figure 4, and the spatial distribution of the scattered field can be expressed as follows:
The strip-surface element dS, which is perpendicular to the receiving surface, is used on the lens of the imaging system, as shown in Figure 5. Since the overall thickness of the lens is small relative to the entire system, it can be ignored. Based on Lambert’s formula, the light energy received by the lens is calculated using the following Formula [13]:
where ƒ is the measured distance, R is the radius of the imaging system, α is the angle between the incident laser and the main optical axis of the imaging system lens, θ is the angle between the horizontal plane and the reference plane, that is, the object plane inclination angle, and Io is the scattered light intensity generated by the laser beam, which is incident on the side under ideal conditions. According to formula (12), it can be seen that the intensity of scattered light energy on the measured object surface is affected by the slope angle θ.
The displacement measurement error ∆X can be obtained using Formulas (4)–(6), shown above, and the calculation formula the gross error. This is calculated from the displacement X of the light-energy centroid on the PSD, which is caused by the object plane tilt.
In this design, in order to better correct the tilt error to improve the measurement ac-curacy of the runout error detection, in the imaging optical system between the lens group and the position detector to add a set of plane mirrors (M1, M2) to change the direction of the image plane, so that the system in the actual surface of the object to be measured when the small tilt can also be clearly imaged, and still meet the “Scheimpflug “conditions, that is, the equivalent optical path diagram in the laser beam of the laser transmitter, imaging optical system of the main optical axis and the position detector main plane of the exten-sion line intersects at a point O, equivalent optical path diagram shown in Figure 6 [10,12,14].
The planar mirrors shown in Figure 6 only change the direction of the optical path without changing the imaging characteristics. Therefore, after adding a pair of planar mirrors, the system can still perform perfect imaging at the light-energy centroid of the PSD position detector. Considering the overall size of the imaging system, a planar mirror with a radius of 5 mm is used as M1 and M2.
According to the requirements of the runout error detection of the large-sized step shaft, the design parameters of the imaging optical system are given in Table 1.
Since the overall length of the system should not exceed 50 mm, in order to make the structure of the imaging system simpler and smaller, a four-piece lens group with a half-object height of 1 mm and a half-image height of 2 mm was selected as the initial structure of the imaging system based on the optical design manual. The lens parameters of the initial structure are shown in Table 2. The system had the best imaging effect at α = 40° and β = 26°.
2.2.2. Improved Imaging Optics Design
In order to meet the design requirements of the system, it is necessary to optimize the initial structure. First, the focal length of the selected initial structure is scaled, and the operand PMAG is used to control the magnification. Next, the air interval between the devices attached to the lens and the thickness of the lens are set as variables, and the operand MNCA and MNCG are used to control the thickness and air interval of the lens. When optimizing the lens, it is necessary to prioritize the surface where the aberration is prominent, control the aberration within the effective range, and then optimize the other surfaces one by one. If the value still fails to meet the design requirements after several optimization, the existing glass is replaced and the operand MTFT, which controls MTF, is added again for HAMMER optimization. The final structure obtained is shown in Figure 7, and the final parameters of the lens are shown in Table 3.
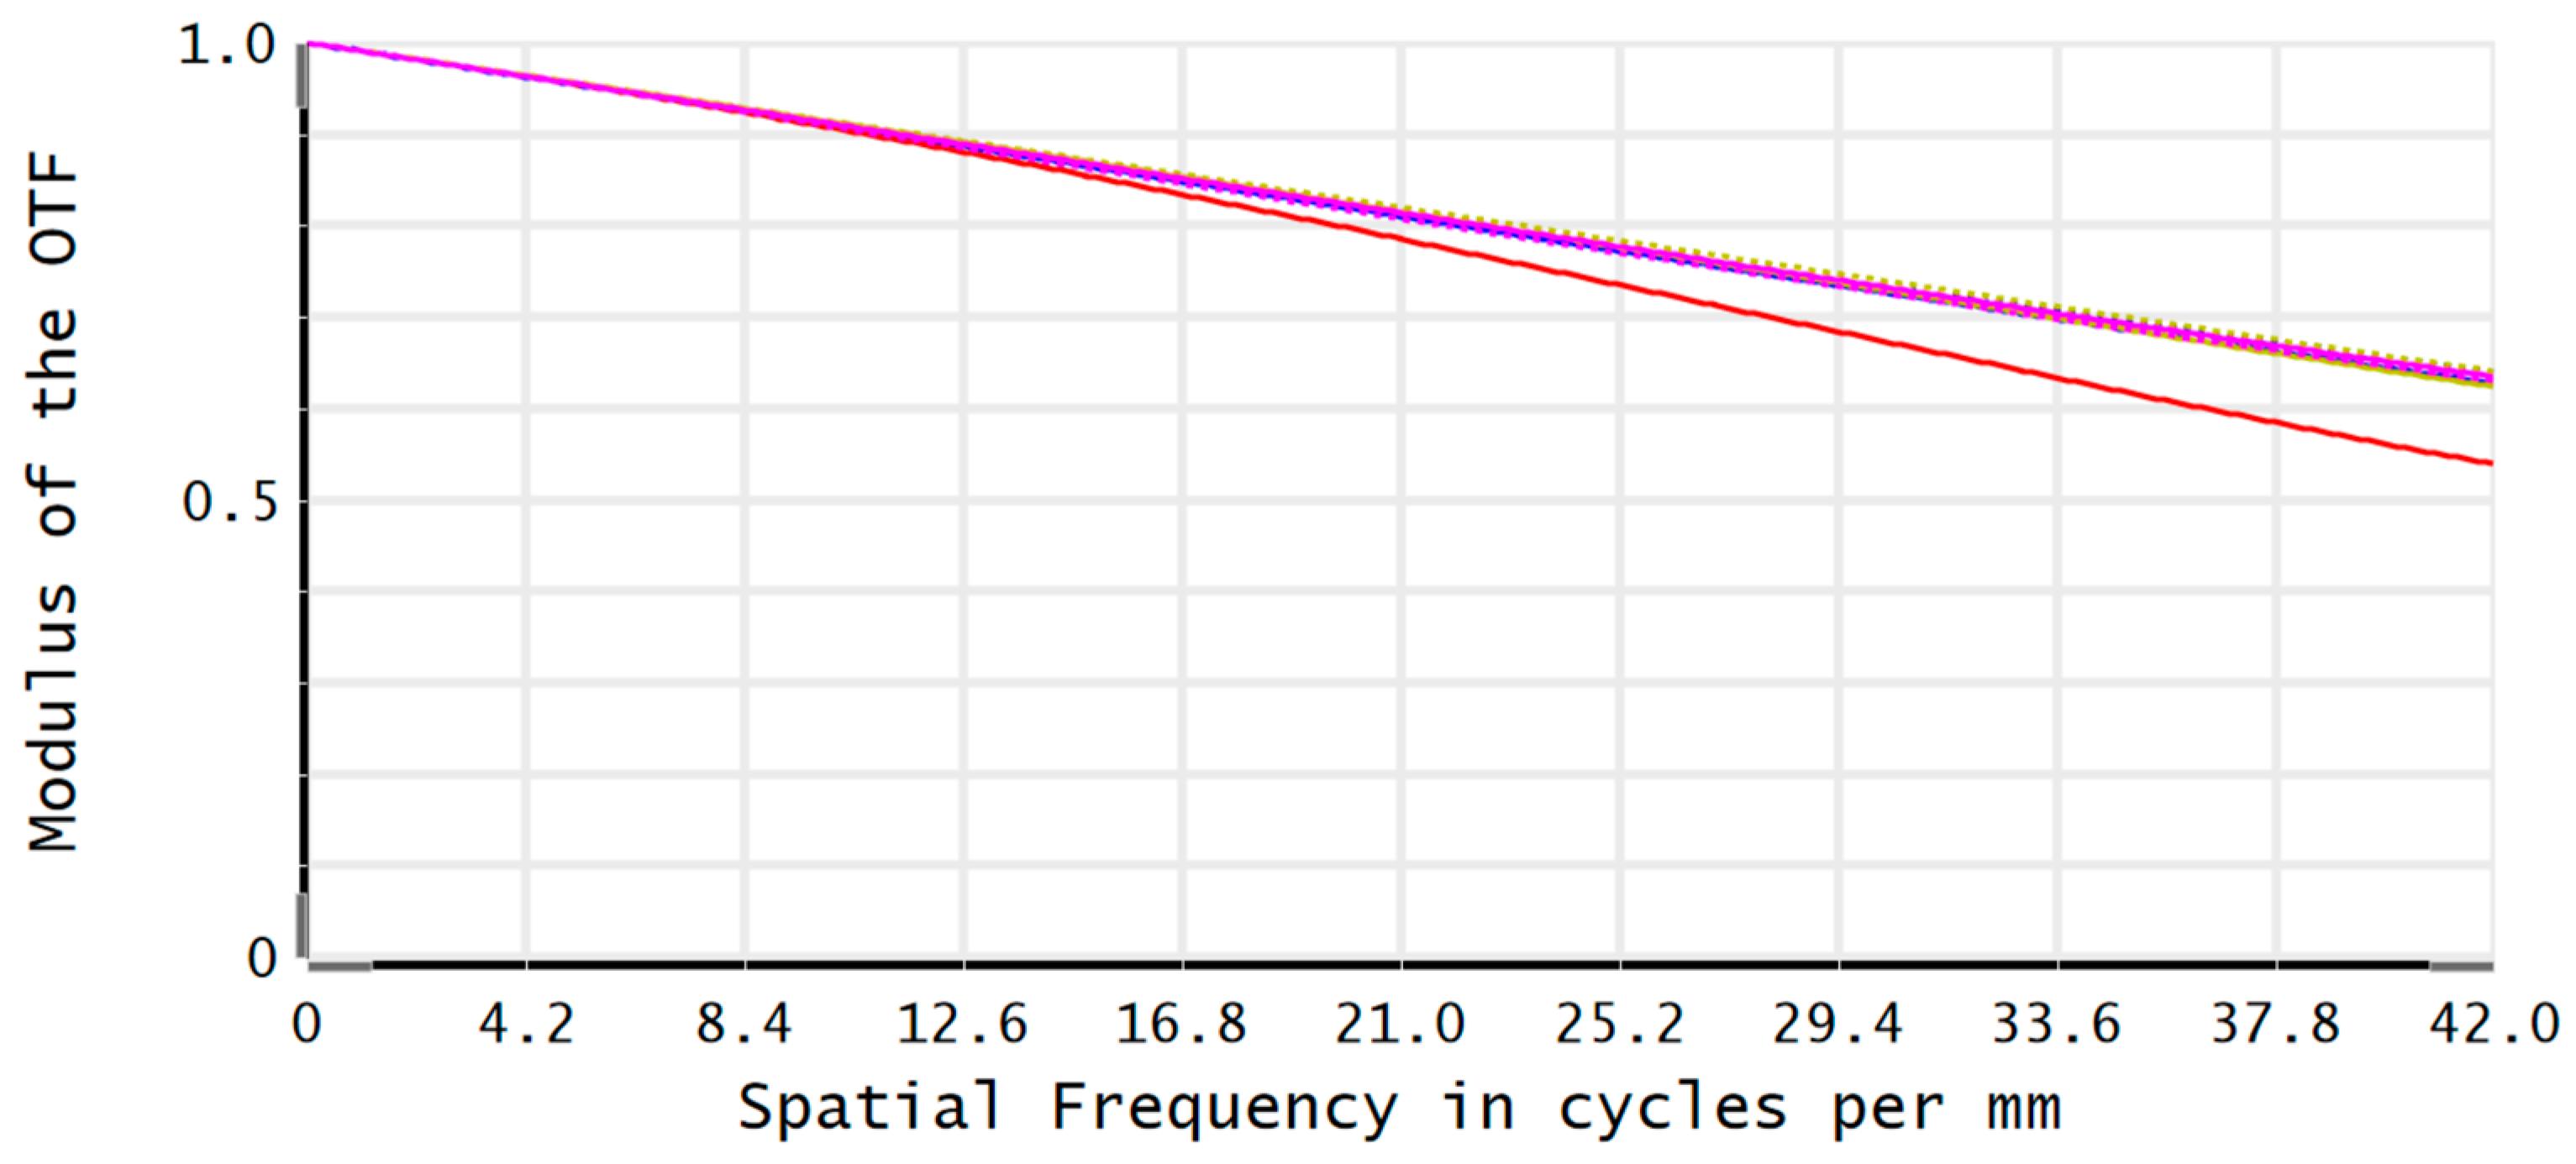
Figure 8 and Figure 9 show the MTF function and point diagram of the system, respectively. It can be seen from the figure that the radius of the Avery’s spot of the system is 5.363 μm and the radius of RMS is 4.929 μm when the spatial frequency is 42 lp/mm. Both these values meet the imaging quality requirements of the imaging optical system. In addition, the imaging energy of PSD position detector is concentrated in an Ailey spot, which meets the requirement of light-energy centroid detection.
The MTF function and point diagram of the two groups of optical imaging systems were compared using Zemax v.24.1, and the inclination range of the measured object surface was set to be 7°. The comparison of MTF function and point diagram of the two groups of optical imaging systems is shown in Figure 10. Through comparison, it can be seen that the runout error detection imaging optical system designed in this paper can still achieve value greater than 0.3 when the space stop frequency is 42 lp/mm, and the airy spot radius of the system meets the design requirements when the step axis produces a small inclination error.
2.2.3. Tolerance Analysis
The wavelength of imaging optical system tolerance analysis is set to 658 nm, the surface tolerance module in the radius of curvature is set to an aperture of 2, thickness tolerance is set to 0.025 mm, lens surface X,Y eccentricity tolerance due to rotationally symmetrical structures is set to 0.008 mm, the same surface X,Y axis tilt is set to 0.0133 degrees, and the surface irregularity is set to an aperture of 0.25. Because the manufacturing process will affect the size of said difference, it is necessary to set the component tolerance of 0.008 X,Y eccentricity, 0.0133 degrees of the X,Y axis tilt. To ensure the ability of the lens to refract light for processing in accordance with the design of the optical focal length of the lens, lens refractive index tolerance is set to 0.0008, and Abbe tolerance is set to 0.08%. In other words, the Q4 grade tolerance standard is selected for tolerance analysis.
After tolerance analysis of the optical system, the total reduction in MTF in the worst case is not more than 0.3, meaning that that the photodetector PSD receiving the target can still distinguish the resolution of the optical system. This imaging system adopts a sensitivity analysis method to carry out tolerance analysis. Using the geometric average transfer function of a 42 lp/mm optical system as the standard, 200 Monte Carlo samples are adopted, and the geometric average transfer function value obtained is 0.43520936. The analysis results are shown in Table 4.
As can be seen from Table 4, the tolerance analysis results show that 90% of the mean geometric MTF transfer function is better than 0.33013253. According to the experience of optical manufacturing, 90% of the MTF results of the tolerance analysis are better than 0.15, and thus meet the design requirements. Therefore, the tolerance analysis results shown in this paper meet the design requirements.
3. Experimental Validation of Runout Detection Optical System
In this section, a test platform is built for the runout detection optical system designed above in order to measure the stepped shaft with a diameter of 65–750 mm, and the block diagram of the test platform is shown in Figure 11. The optical power meter evaluates the output power of the laser beam received by the PSD, and the evaluation results show that the laser emitted from the semiconductor laser emitter reaches the level of about 50% of the light energy remaining on the PSD, and the optical power required is at 10 mW or more, and the adopted ML101J24P semiconductor laser transmitter (Mitsubishi Group, Shanghai, China) is 100 mW, which meets the requirements.
The position of the imaging spot in the receiving area of the PSD was captured using image capture, the captured data were fitted using a computer, and the test platform is shown in Figure 12. The test platform mainly consists of a semiconductor laser transmitter, a beam-expanding collimating optical system, an imaging optical system, a PSD, a base, and a computer. Regarding these components, the parameters of the expanded beam collimation optical system are as follows: f = 7 mm, the numerical aperture NA of the object square is 0.15, and the total length of the system is 20 mm.
It can be seen from Equation (6) that y and y′ have a linear relationship, i.e., when the object under testing moves along the incident light, the imaging spot received on the PSD is a straight line. The measured step axis of the reference surface is a reference for up and down movement, the imaging optical system in the PSD forms the image point, the step-axis displacement is recorded as x, the image point position is recorded as y, and the test results are shown in Figure 13. The displacement is positive for the step-axis upward jump, and negative for the downward jump.
From the fitting curve, it can be seen that the primary coefficient of 2.3091 is close to the magnification of 2.33 shown by the beating-detection imaging system, indicating that the output of the PSD has a good linear relationship with the input.
When using the runout detection optical system to measure the step shafts, KEYENCE laser displacement sensors were used to detect the radial runout and end-face runout of stepped-shaft standards, with diameters ranging from 65 mm to 750 mm. Five cross-sectional positions were selected for end-face runout detection, and the diameter of 750 mm was selected for radial runout detection, with the measured values of the KEYENCE displacement sensor (KEYENCE, Shanghai, China) used as the true value. Among these values, the repeatability of KEYENCE radial runout error measurement was 10 μm; the repeatability of the radial runout error measurement of the runout detection system designed in this paper was 10 μm. Then, we used the stepped-axis motion control to adjust the tilt angle of the stepped-axis to 5° to carry out the measurement of the end-face runout, and the runout error derived from this is shown in Figure 14.
The results of the end-face runout measurement show that, when the measured stepped shaft is not tilted, the runout detection optical system designed in this paper has a similar measurement accuracy to the KEYENCE displacement sensor, being just 0.01 mm lower. When the measured stepped shaft is tilted, the KEYENCE displacement sensor is unable to correctly measure the runout of the stepped-shaft end face, while the runout detection optical system can still measure it accurately, meeting the requirements of correcting of the error of the request for advice.
4. Conclusions
Based on the direct laser triangulation method of stepped-shaft runout detection systems, this paper improves the imaging optical system in the runout error detection system of a stepped shaft with a large size of 500–700 mm. The coaxiality error that may occur during the stepped-shaft detection process is corrected by adding an optical plane mirror group, the imaging optical system is simulated by Zamax 19.4, and the simulation results show that the total length of the structure of the imaging optical system is 50 mm and that the MTF function of each field of view is greater than 0.3 at a spatial frequency of 42 lp/mm. By building a test platform for the runout detection optical system, the system is compared with that of the Keyence displacement sensor. By building the test platform of the runout detection optical system and comparing its output with the measurement results of KEYENCE displacement sensor, the experimental results prove that the improved runout detection optical system is able to measure the runout error of step shafts in the range of 65–750 mm and correct the coaxiality error within 5° at the same time, so that it achieves the purpose of the high-precision on-line detection of the runout error of step shafts of large sizes with diameters in the range of 500–700 mm. This method provides a theoretical and experimental basis for the on-line detection of runout errors of large-sized step shafts. The design of aspheric imaging system can also be used to achieve higher measurement accuracy and better correction effects in subsequent research.
Author Contributions
Conceptualization, Y.Z. and J.D.; methodology, Y.Z. and H.Z.; software, Y.Z. and H.Z.; validation, Y.Z., Y.L. and J.L.; formal analysis, J.D.; investigation, Y.Z. and H.Z.; resources, J.D.; data curation, Y.Z.; writing—original draft preparation, Y.Z.; writing—review and editing, J.D.; visualization, Y.Z.; supervision, Y.L.; project administration, J.D.; funding acquisition, J.D. All authors have read and agreed to the published version of the manuscript.
Funding
This research was funded by Zhongshan Institute of Changchun University of Science and Technology introduced innovative research team project; Project Number: CXTD2023006. And the Department of Science and Technology of Jilin Province under Grant 20210201088GX.
Institutional Review Board Statement
Not applicable.
Informed Consent Statement
Not applicable.
Data Availability Statement
The data presented in this study are available on request from the corresponding author. The data are not publicly available due to privacy.
Acknowledgments
The author would like to thank Changchun University of Science and Technology and Jilin Province photoelectric measurement and control Institute.
Conflicts of Interest
The authors declare no conflicts of interest.
References
- Fu, S.Y.; Lu, J.Q.; Ding, C.; Huang, Y.; Gao, X.Y.; Zhao, Z.X. The Measurement for Shaft’s Size with Multiple Parameters Based on Optoelectronic Imaging. Modul. Mach. Tool Autom. Manuf. Tech. 2022, 7, 152–155. [Google Scholar]
- Zhang, J.; Wang, J.Y. Research on Measuring Method for Roundness-error of Shaft Parts Based on Digital Technology. Mar. Electr. Electron. Eng. 2019, 39, 29–32+35. [Google Scholar]
- Dou, W.Y.; Zhao, Z.X.; Cao, X.C.; Liu, R.Y. Analysis of Coaxiality Error of Spindle Springtube Assembly Based on Radial Circle Run—Out Detection. Mach. Des. Res. 2022, 36, 199–203. [Google Scholar]
- Shi, X.C.; Zhou, H.; Tang, W.S.; Li, Z.G.; Zhao, X.L. Profile parameters measurement of automotive synchronous belt based on laser triangulation method. Chin. J. Sci. Instrum. 2019, 40, 138–145. [Google Scholar]
- Shang, Z.Y.; Wang, J.H.; Zhao, L.; Yin, P.L. Research on Surface Roughness Measurement Using Incoherent Light Triangulation Method. Tool Eng. 2023, 57, 145–149. [Google Scholar]
- Liu, K.M.; Tao, W.; Chen, X.; Li, Z.; Zhao, H. Laser Triangulation Method for Glass Thickness by Automatically Adapting to Displacement Change. Chin. J. Lasers 2020, 47, 155–162. [Google Scholar]
- Peng, K.; Yang, Z.Q.; Yang, W.D.; Liu, L.B. Research on measurement method of lathe spindle radial run-out error based on machine vision. Technol. Test. 2018, 2, 138–140. [Google Scholar]
- Zhou, X.D.; Zhang, Y.C.; Tan, Q.C.; Zhang, W.J. New method of cylindricity measurement based on structured light vision technology. J. Jilin Univ. 2017, 2, 524–529. [Google Scholar]
- Zhang, Y.G.; Wang, Y.D.; Liu, Y.J.; Lv, D.P.; Fu, X.B.; Zhang, Y.C.; Li, J.M. A concentricity measurement method for large forgings based on laser ranging principle. Measurement 2019, 147, 106838. [Google Scholar] [CrossRef]
- Zhang, X.T.; Kang, L.; An, Z.Y.; Wang, R.F. Improved laser triangulation probe design. Infrared Laser Eng. 2018, 47, 305–309. [Google Scholar]
- Zhang, S.; Zhu, W.B.; Li, J.; Lu, X.E. Design of micro-optical system for laser displacement sensor sensing probe. Chin. Opt. 2018, 11, 1001–1010. [Google Scholar] [CrossRef]
- Chen, X.H.; Xiao, Y.W.; Huang, L.H.; Gu, N.T. Effect of non-Scheimpflug conditions on laser triangulation accuracy. J. Chongqing Univ. Technol. 2022, 36, 119–127. [Google Scholar]
- Sun, X.W.; Zhao, W.T.; Zhu, X.H. Analysis of angle error of laser displacement sensor. Heavy Mach. 2018, 6, 73–76. [Google Scholar]
- Dong, Z.X.; Sun, X.W.; Liu, W.J.; Yang, L.J.; Wang, L. Precision measurement method of free-form curved surfaces based on laser displacement sensor. Chin. J. Sci. Instrum. 2018, 39, 30–38. [Google Scholar]
Figure 1.
Large-sized stepped-shaft photoelectric detection system.

Figure 2.
Component diagram of optical system for runout detection.

Figure 3.
Schematic diagram of direct laser triangulation.

Figure 4.
Lambert’s law diagram.

Figure 5.
Light plane reception diagram.

Figure 6.
Diagram of the “Scheimpflug” conditional equivalent optical path.

Figure 7.
Imaging optical system structure diagram.

Figure 8.
MTF function at up to frequency 42 lp/mm.

Figure 9.
Imaging optics point list.

Figure 10.
Comparison of MTF and dot plot.

Figure 11.
Block diagram of runout detection optical system.

Figure 12.
Jump detection test bench diagram.

Figure 13.
Fitting curve of test results.

Figure 14.
End-face runout detection result graph: (a) KEYENCE without tilt; (b) runout detection optical system without tilt; (c) KEYENCE with tilt; (d) runout detection optical system with tilt.
Figure 14.
End-face runout detection result graph: (a) KEYENCE without tilt; (b) runout detection optical system without tilt; (c) KEYENCE with tilt; (d) runout detection optical system with tilt.


Table 1.
Design parameters of imaging optical system.
| System Parameters | Value |
|---|---|
| PSD position detector effective area/mm2 | 1.3 × 15 |
| Detection range/mm | 1.5 |
| Operating band/nm | 658 |
| Integral length/mm | <50 |
| Dip correction/° | 5 |
| Resolution | >30%@42 lp/mm |
Table 2.
Imaging optical system lens initial parameters.
| Surface | Type | Radius of Curvature/mm | Thickness/mm | Material | Clear Diameter/mm | Argument (Tangent) | |
|---|---|---|---|---|---|---|---|
| 0 | OBJECT | Inclined | Infinity | 10.000 | 1.237 | 0.840 | |
| 1 | Standard | 6.665 | 2.962 | H-ZLAF66 | 2.402 | ||
| 2 | Standard | 5.225 | 1.923 | 18.706 | |||
| 3 | Standard | 19.393 | 2.879 | H-ZLAF92 | 25.877 | ||
| 4 | Standard | −21.585 | 1.271 | 34.829 | |||
| 5 | DIAPHRAGM | Standard | 5.129 | 1.877 | N-LASF9 | 37.846 | |
| 6 | Standard | 4.169 | 5.000 | 46.408 | |||
| 7 | Standard | −123.720 | 3.000 | 47.830 | |||
| 8 | Standard | −10.592 | 30.000 | 50.016 | |||
| 9 | IMAGE | Inclined | Infinity | 47.562 | −2.050 |
Table 3.
Imaging optical system final parameters.
| Surface | Type | Radius of Curvature/mm | Thickness/mm | Material | Clear Diameter/mm | |
|---|---|---|---|---|---|---|
| 0 | OBJECT | Inclined | Infinity | 10.0 | 1.9 | |
| 1 | Standard | 5.8 | 2.2 | N-LASF9HT | 2.7 | |
| 2 | Standard | 4.6 | 4.1 | 2.3 | ||
| 3 | Standard | 22.5 | 3.7 | H-ZLAF92 | 2.6 | |
| 4 | Standard | −26.0 | 4.8 | 2.7 | ||
| 5 | DIAPHRAGM | Standard | 5.4 | 2.0 | SF57HTULTRA | 2.4 |
| 6 | Standard | 4.3 | 1.3 | 2.3 | ||
| 7 | Standard | 142.7 | 3.0 | SF11 | 2.9 | |
| 8 | Standard | −23.3 | 10.0 | 3.3 | ||
| 9 | IMAGE | Standard | Infinity | 4.5 |
Table 4.
Monte Carlo analysis results.
| Geometric Mean MTF | Result |
|---|---|
| 90%≥ | 0.33013253 |
| 80%≥ | 0.36453406 |
| 50%≥ | 0.43950725 |
| 20%≥ | 0.52218292 |
| 10%≥ | 0.54527571 |
Disclaimer/Publisher’s Note: The statements, opinions and data contained in all publications are solely those of the individual author(s) and contributor(s) and not of MDPI and/or the editor(s). MDPI and/or the editor(s) disclaim responsibility for any injury to people or property resulting from any ideas, methods, instructions or products referred to in the content. |
© 2024 by the authors. Licensee MDPI, Basel, Switzerland. This article is an open access article distributed under the terms and conditions of the Creative Commons Attribution (CC BY) license (https://creativecommons.org/licenses/by/4.0/).
Share and Cite
MDPI and ACS Style
Zhao, Y.; Duan, J.; Zhang, H.; Li, J.; Liu, Y. Improved Design of Imaging System for Online Detection of Large-Sized Step-Shaft Runout Errors. Appl. Sci. 2024, 14, 3614. https://doi.org/10.3390/app14093614
AMA Style
Zhao Y, Duan J, Zhang H, Li J, Liu Y. Improved Design of Imaging System for Online Detection of Large-Sized Step-Shaft Runout Errors. Applied Sciences. 2024; 14(9):3614. https://doi.org/10.3390/app14093614
Chicago/Turabian StyleZhao, Yanan, Jie Duan, Hongtao Zhang, Jiyu Li, and Yuting Liu. 2024. "Improved Design of Imaging System for Online Detection of Large-Sized Step-Shaft Runout Errors" Applied Sciences 14, no. 9: 3614. https://doi.org/10.3390/app14093614
Note that from the first issue of 2016, this journal uses article numbers instead of page numbers. See further details here.