
The Association between Countermovement Rebound Jump Metrics and Independent Measures of Athletic Performance


1
London Sport Institute, Middlesex University, London NW4 4BT, UK
2
Department of Physical Education and Sport Sciences, University of Limerick, V94 T9PX Limerick, Ireland
*
Author to whom correspondence should be addressed.
Appl. Sci. 2024, 14(9), 3718; https://doi.org/10.3390/app14093718
Submission received: 3 April 2024
/
Revised: 23 April 2024
/
Accepted: 25 April 2024
/
Published: 26 April 2024
Abstract
:This study investigates the associations between countermovement rebound jump (CMRJ) performance metrics and various independent measures of athletic performance, including the isometric mid-thigh pull (IMTP), 20 m linear sprint, and 505 change-of-direction (COD) speed tests. Pearson’s correlations were used to analyse the relationship between the CMRJ measures with athletic performance, with significance being set at p ≤ 0.006. Results showed large significant positive relationships between IMTP peak force and force at 300 milliseconds with the first jump height of the CMRJ (JH-1, r = 0.54 to 0.55, p ≤ 0.002). Additionally, inverse relationships were observed between reactive strength index modified (RSImod) and reactive strength index (RSI) with 20 m sprint total and split times (r = −0.55 to −0.66, p ≤ 0.001), and the 10 m and total sprint times were significantly correlated with JH-1 (r = −0.54, p = 0.003), indicating that greater vertical explosive power and reactive strength are associated with faster sprint performance. Finally, a significant inverse relationship was identified between CMRJ metrics (two JH values and RSImod) and 505 COD times in both the left and right sides (r = −0.51 to −0.68, p ≤ 0.006). These findings suggest that CMRJ performance metrics are valuable indicators of lower-limb explosive force production, with a strong link to both linear sprint and COD performance. The finding underscores the importance of including CMRJ assessments in athletic performance evaluations due to their dual assessment capacity of slow and fast stretch–shortening cycle mechanics.
1. Introduction
Jump testing has become commonplace for practitioners working in strength and conditioning or sports science [1], with the metrics measured in jump testing used to monitor the efficiency of training programmes [2] or the association with athlete performance (e.g., change of direction speed [3] or linear sprint speed [4,5]). Studies have utilized the countermovement jump (CMJ) and drop jump (DJ) tests to evaluate slow (i.e., duration ≥ 250 milliseconds [ms]) and fast (i.e., duration ≤ 250 ms) stretch–shortening cycle (SSC) functions, respectively [6,7,8]. Recently, several studies have confirmed that the countermovement rebound jump (CMRJ) provides practitioners with the same reliable metrics as both the CMJ and DJ, and it is more time-efficient for testing, especially when working with large groups of athletes [1,9].
Aside from jump testing, sprint running is common in many sports; thus, the assessment of sprint speed is understandably considered an essential monitoring tool for various athletic populations [5,10,11]. However, unlike track sprinting, where the maximum linear sprint speed is the only determining factor of success, sprint speed could impact matches in a multitude of ways in field- or court-based sports. Specifically, the most common sprint distance for soccer players is, on average, 20 meters (m), highlighting acceleration as being more prevalent than top speed [6,12,13]. Furthermore, these short-distance sprints in sports like soccer are interspersed with multi-directional movements, such as the powerful side-step or shuffle, to evade defenders or react to attacking movements [6]. Therefore, the ability to decelerate, change direction, and re-accelerate (or sprint) again has become an essential skill for athletes in field- or court-based sports [14]. This capacity is often referred to as the change of direction (COD) speed. Despite a wide variety of testing options to assess COD speed, the 505 assessment stands out as a widely adopted method due to its capability of evaluating something called the COD deficit (which represents the difference in time between a COD assessment and linear speed assessment of equal total distance), in addition to typical outcome measures of time [15,16].
It has been proposed that the strength or power capabilities of muscles in the lower extremities evaluated in jump testing are determining factors of linear or COD speed [3]. For this reason, several studies have investigated the association between jump performance (via a range of metrics) and linear or COD speed performance [3,5,10,11,16,17]; however, findings show large inconsistencies. For example, when considering the relationship between jumping and linear sprint speed, an inverse correlation between CMJ height and 10 m sprint time (r = −0.54, p < 0.05) has been observed [3], and another study found the same inverse correlation between CMJ height and 30 m (r = −0.54, p < 0.05) as well as 60 m (r = −0.55, p < 0.05) sprint times [5]. However, these two studies recruited healthy males and professional sprinters as their subjects, respectively, which does not guarantee comparable findings in team sport athletes, given the inherent differences in sprint characteristics already noted between these populations [12]. Taking this into consideration, Hori et al. [13] reported a large inverse correlation between CMJ height and 30 m sprint time (r = −0.69, p < 0.01) in Australian Rules football players, and Carr et al. [10] found a very large correlation between CMJ height and 20 m sprint time (r = −0.74, p = 0.006) in first-class county cricketers. When considering the DJ, Barr and Nolte [4] reported that DJ height had a large to very large correlation with the 10 m (r = −0.66, p < 0.005) and 30 m (r = −0.86, p < 0.005) sprint times. In the same study, the reactive strength index (RSI, a ratio between jump height [JH] and ground contact time [GCT]), reported a moderate to large correlation with the 10 m (r = −0.57, p < 0.005) and 30 m (r = −0.42, p < 0.005) sprint times. Noting that the RSI comprises two component parts rather than a single metric, any changes in DJ height or GCT would distort RSI values [2], which, in turn, explains the reduced correlation between the RSI and sprint time compared to correlations between DJ height and sprint time. Since the CMRJ involves similar characteristics to the CMJ and DJ, it could be argued that similar relationships between CMRJ metrics and linear sprint time would be expected, but, as of yet, these associations have not been determined.
Research has also shown a variety of associations between jumping metrics and COD speed. Hernández-Davó et al. [18] reported that CMJ height showed a moderate inverse correlation with 505 test times (r = −0.46, p < 0.05), but only on the side that exhibited the faster 505 test times. In another study, by Suarez-Arrones et al. [3], a similar correlation was observed between CMJ height and 10 m COD time (i.e., sprint 5 m to the line, turning 180°, and sprint 5 m back to starting line; r = −0.43, p < 0.05). Thomas et al. [14] firstly investigated the association between the reactive strength index modified (RSImod, a ratio between JH in CMJ and time to take-off [TTTO]) and 505 test time, showing significant moderate to large correlations between these two metrics (r = −0.30 to −0.57, p ≤ 0.05). A greater RSImod value requires athletes to jump as high as possible (applying large amounts of force vertically) whilst spending minimal time on the ground [2]. Similarly, a short 505 test time requires athletes to sprint maximally (applying large amounts of force horizontally) whilst entering and exiting the COD as fast as they can [14,15]. Noting that whereas the direction of force application is different between these tests, the capability to rapidly produce braking and propulsive forces is equally vital to both RSImod and COD speed [14]. Given that the DJ and COD tests share similarities in lower extremity push-off mechanisms, a large correlation between metrics measured from the DJ and COD tests might be expected.
In addition, Young et al. [6] reported large correlations between the RSI and COD speed (r = −0.65, p = 0.001). In contrast, Foden et al. [17] found trivial relationships between the RSI and COD speed (505-left: r = 0.13, 505-right: r = −0.14, p > 0.05), while Jones et al. [19] revealed that DJ height showed trivial correlations with COD speed (r = −0.29, p > 0.05). Collectively, though, researchers have not clarified why CMJ and DJ tests reported different associations with COD speed across various studies [3,6,17,19]. In addition, it is clear that athletes need to generate large amounts of force to jump, sprint, or change direction—a quality which can be evaluated reliably from the isometric mid-thigh pull (IMTP) [20]. Typically, the peak force (PF) determined during the IMTP test has been proved to have meaningful associations with 20 m sprint time (r = −0.69, p ≤ 0.01) [21], COD time (r = −0.69, p ≤ 0.05) [21], and jump performance (including JH and RSI, r = 0.36 to 0.82, p < 0.05) [22]. However, there is a paucity of research investigating the associations between metrics derived from the CMRJ (e.g., countermovement depth [CM depth], JH, leg stiffness [Kleg], TTTO, GCT, RSI, RSImod) and the aforementioned athletic performance measures (e.g., 20 m sprint time, COD time, and force measured from IMTP). Thus, further research is required to provide a sound biological basis for practitioners utilizing this assessment in their routine monitoring processes [2].
Therefore, the aim of this study was to determine if there are any meaningful associations between CMRJ performance and independent measures of athletic performance. Based on metrics measured from the CMJ and DJ demonstrating small to very large correlations with independent measures of athletic performance [4,6,10,13,14,17,19,21], the hypothesis was that metrics calculated from the CMRJ would exhibit comparable associations with maximal and rapid force production capabilities, linear sprint, and COD speed performance.
2. Materials and Methods
2.1. Participants
A priori power analysis was conducted using GPower software (version 3.1.9.6, Mac OS X), suggesting a sample of 21 was required to have an 80% chance (G power = 0.8) to find a statistically significant difference with a moderate effect size (ES, Hedges’ g = 0.5) [23]. Twenty-six male professional and semi-professional team sports athletes volunteered to participate in the present study (soccer [n = 11], rugby [n = 6], and basketball [n = 9]). To be eligible, all subjects were required to be free of any musculoskeletal injury within six months and have at least one year of structured resistance, plyometric, and sprint training experience. All subjects were required to sign a written informed consent form, and this study was approved by the London Sport Institute research and ethics committee at Middlesex University, London, UK (application no. 23117).
This was an observational descriptive study investigating the associations between CMRJ metrics and independent measures of athletic performance. The testing session started with a standardized warm-up, followed by demonstrations of each test and sufficient practical familiarizations. Subjects then performed three repetitions of each test in the following order: (1) CMRJ tests, (2) 20 m linear sprint tests, (3) COD speed tests, and (4) IMTP tests. This specific test order was chosen in an attempt to avoid the influence of neuromuscular fatigue having an impact on the subsequent test [24]. Subjects were asked to maintain their habitual daily routine but to avoid strenuous training for 24 h prior to the testing day and heavy meals an hour before testing.
2.2. Procedures
Test Protocol. The warm-up consisted of 5 min light-intensity aerobic jogging, followed by lower-body dynamic stretches and activation exercises, as described by a previous CMRJ study [9]. In order to warm-up sufficiently and familiarise themselves with multiple tests, subjects performed CMRJ tests, 20 m sprint, COD, and IMTP tests at 60, 80, and 100% of perceived maximal effort. Subjects were given 90 s of rest between each CMRJ and IMTP trial, and a minimum of 3 min of recovery between each trial during the linear sprint and COD tests.
2.3. Countermovement Rebound Jump
The CMRJ is essentially composed of a CMJ (i.e., CMRJ1) followed by an immediate rebound jump (CMRJ2), where subjects are instructed to “jump as high as you can in both jumps whilst spending as little amount of time on the ground in-between” [1]. Subjects were instructed to stand still for at least one second before performing the movement initiation to enable an accurate estimate of body weight and kept hands on their hips. All jumps were performed on twin portable force plates (Kistler Instruments Ltd., Hook, UK) that recorded the ground reaction force (GRF) at a sampling frequency of 1000 Hz. The GRF data were exported to MATLAB software (R2022a; MathWorks, Natick, MA, USA) for the subsequent calculation of JH (JH-1 and JH-2, the first and second JH of the CMRJ test, respectively) via the impulse-momentum method [25] and other strategy-based variables (i.e., CM depth, TTTO, RSImod, Kleg, GCT, and RSI) via the methods described by Bishop et al. [2].
2.4. Isometric Mid-Thigh Pull
All three trials for the IMTP test were conducted on a custom-built isometric rack (Absolute Performance, Cardiff, UK), which allows the bar to be fixed at any height above the portable force plates. A goniometer was used to measure 145° of hip and knee flexions (full extension equals 180°). This degree of flexion was chosen to accommodate the suggestion by Guppy et al. [26], where using the 145° concurrently optimises IMTP performance and provides reliable data. Subjects stood on the force plates with their feet hip to shoulder-width apart, the bar was positioned at their mid-thigh height, and subjects gripped the bar using weightlifting straps in accordance with previously recommended methods [21,27]. Once subjects were ready (verified by checking the force–time curve on the screen and subjects), they were given a countdown of “3, 2, 1, Pull”. Subjects were instructed to pull against the bar with maximal effort and push their feet down into the force plates as quick as possible for five seconds (s) [21]. Prior to each trial, subjects were instructed to keep stationary for 2 s to ensure the estimation of body weight was accurate. The onset of the pull was determined as the force exceeding 5 standard deviations (SDs) of body mass [27]. The maximum force (PF) and force at different time points (F@ 100 ms, F@ 200 ms, and F@ 300 ms) measured during each trial was calculated from the net force, where the subject’s body weight was deducted from the raw force data, with the average score of each subject being extracted for the statistical comparison.
2.5. Twenty-Metre Sprint
Electronic timing gates (Brower Timing Systems, Draper, UT, USA) were positioned at 0, 10, and 20 m to record the 20 m sprint time and the split sprint times. The mean 10 m split sprint time was taken for calculating the COD deficit [15], while the mean 20 m sprint times were recorded to replicate common sprint distances that are prevalent in field-based sports [17]. Subjects stood with a two-point, split-stance start position for each test [17]. Their preferred foot was placed 0.3 m behind the start line with no excessive forward lean on their upper bodies [17], and they were instructed to sprint with maximal effort after receiving a “go” command. According to the previous study that utilised the same equipment [17], each timing gate was mounted approximately at hip height (adjusted based on each subject’s iliac crest height); the timing started when the beam of the first gate was broken by the pelvic and ended when the beam of the last gate was broken.
2.6. 505 Change of Direction Speed Test
During the 505 COD test, subjects sprinted through the timing gates (positioned at the 10 m line) to the turning point (a line marked at 15 m), turned 180° on the designated turning leg, and re-accelerated 5 m after changing direction. Subjects used the same two-point, split-stance start position with their preferred foot placed 0.3 m behind the starting line [17]. Subjects used the left and right leg as the turning leg, respectively, with the test order of left and right sides randomized [15]. In addition, the time of the 10 m sprint (taken from the 20 m linear sprint test) was used to calculate the COD deficit, which is calculated by using the mean 505 time minus the mean 10 m sprint time [15].
2.7. Statistical Analyses
Statistical analyses were conducted via SPSS (version 27; SPSS Inc., Chicago, IL, USA) and Microsoft Excel. The mean and SD of measured variables were recorded and subjected to statistical analysis. Normality of all collected variables was assessed with the Shapiro–Wilk statistic, and the homogeneity of variance was verified with the Levene’s test (p > 0.05). Within-session reliability of the metrics measured from the CMRJ and athletic performance tests was computed using a 2-way random effects model intraclass correlation coefficient (ICC) with absolute agreement and 95% confidence intervals (CIs) as well as the coefficient of variation (CV) with a 95% CI. The magnitude of the ICC was evaluated as an ICC value > 0.90 = excellent, 0.75–0.90 = good, 0.50–0.74 = moderate, and <0.50 = poor [28]. The CV was calculated as (CV% = SD/mean × 100), with CV values considered good if <5%, moderate if between 5 and 10%, and poor if >10% [29]. The 95% CI for the CV was calculated as ((CV/√ (2n)) × 1.96), where n was the total numbers of subjects.
Pearson’s r correlation (for parametric data) or Spearman’s ρ correlation (for non-parametric data) was used to investigate the relationships between the CMRJ metrics and independent measures of athletic performance, with statistical significance set at p < 0.05 [30]. Bonferroni corrections were applied to all correlations to account for multiple comparisons and the familywise type I error rate [30], resulting in statistical significance being set at p < 0.006. The strength of coefficient r was determined according to Hopkins [31], as (r < 0.1: trivial; 0.1 to 0.3: small; 0.3 to 0.5: moderate; 0.5 to 0.7: large; 0.7 to 0.9: very large; >0.9: nearly perfect).
A median split analysis was performed, creating higher and lower JH, RSImod, and RSI groups for each jump in the CMRJ test. This was completed to determine whether subjects with higher CMRJ metrics exhibited greater strength or faster performance during the linear sprint and 505 COD tests. The difference between the higher and lower groups was assessed with Mann–Whitney U tests, with statistical significance set at p < 0.05, and Hedges’ g ES were used to determine the magnitude of differences between higher and lower jump performance groups. These ES were interpreted as g < 0.35 = trivial; 0.35–0.80 = small; 0.81–1.50 = moderate; and >1.5 = large [31].
3. Results
The reliability analysis showed that variables from all tests had a good to excellent ICC (0.83–0.99) with a good to poor CV (2.20–29.56%) (Table 1). The relationship between CMRJ metrics and athletic performance metrics is depicted in Table 2. Pearson’s r correlation coefficients demonstrated large significant positive relationships between IMTP PF and F@ 300 ms with the JH-1 (r = 0.54 to 0.55, p ≤ 0.002). In addition, significant large relationships were found between CM depth from the CMRJ test with all IMTP variables, excluding F@ 100 ms (r = 0.55 to 0.61, p ≤ 0.001). The 20 m linear sprint test (including split times and total time) showed large significant inverse relationships with RSImod and RSI values in the CMRJ test (r = −0.55 to −0.66, p ≤ 0.001), while the 10 m and total sprint times were significantly correlated with JH-1 (r = −0.54, p = 0.003). Finally, the two JH and RSImod in the CMRJ test revealed large significant inverse relationships with 505 COD times (r = −0.51 to −0.68, p ≤ 0.006).
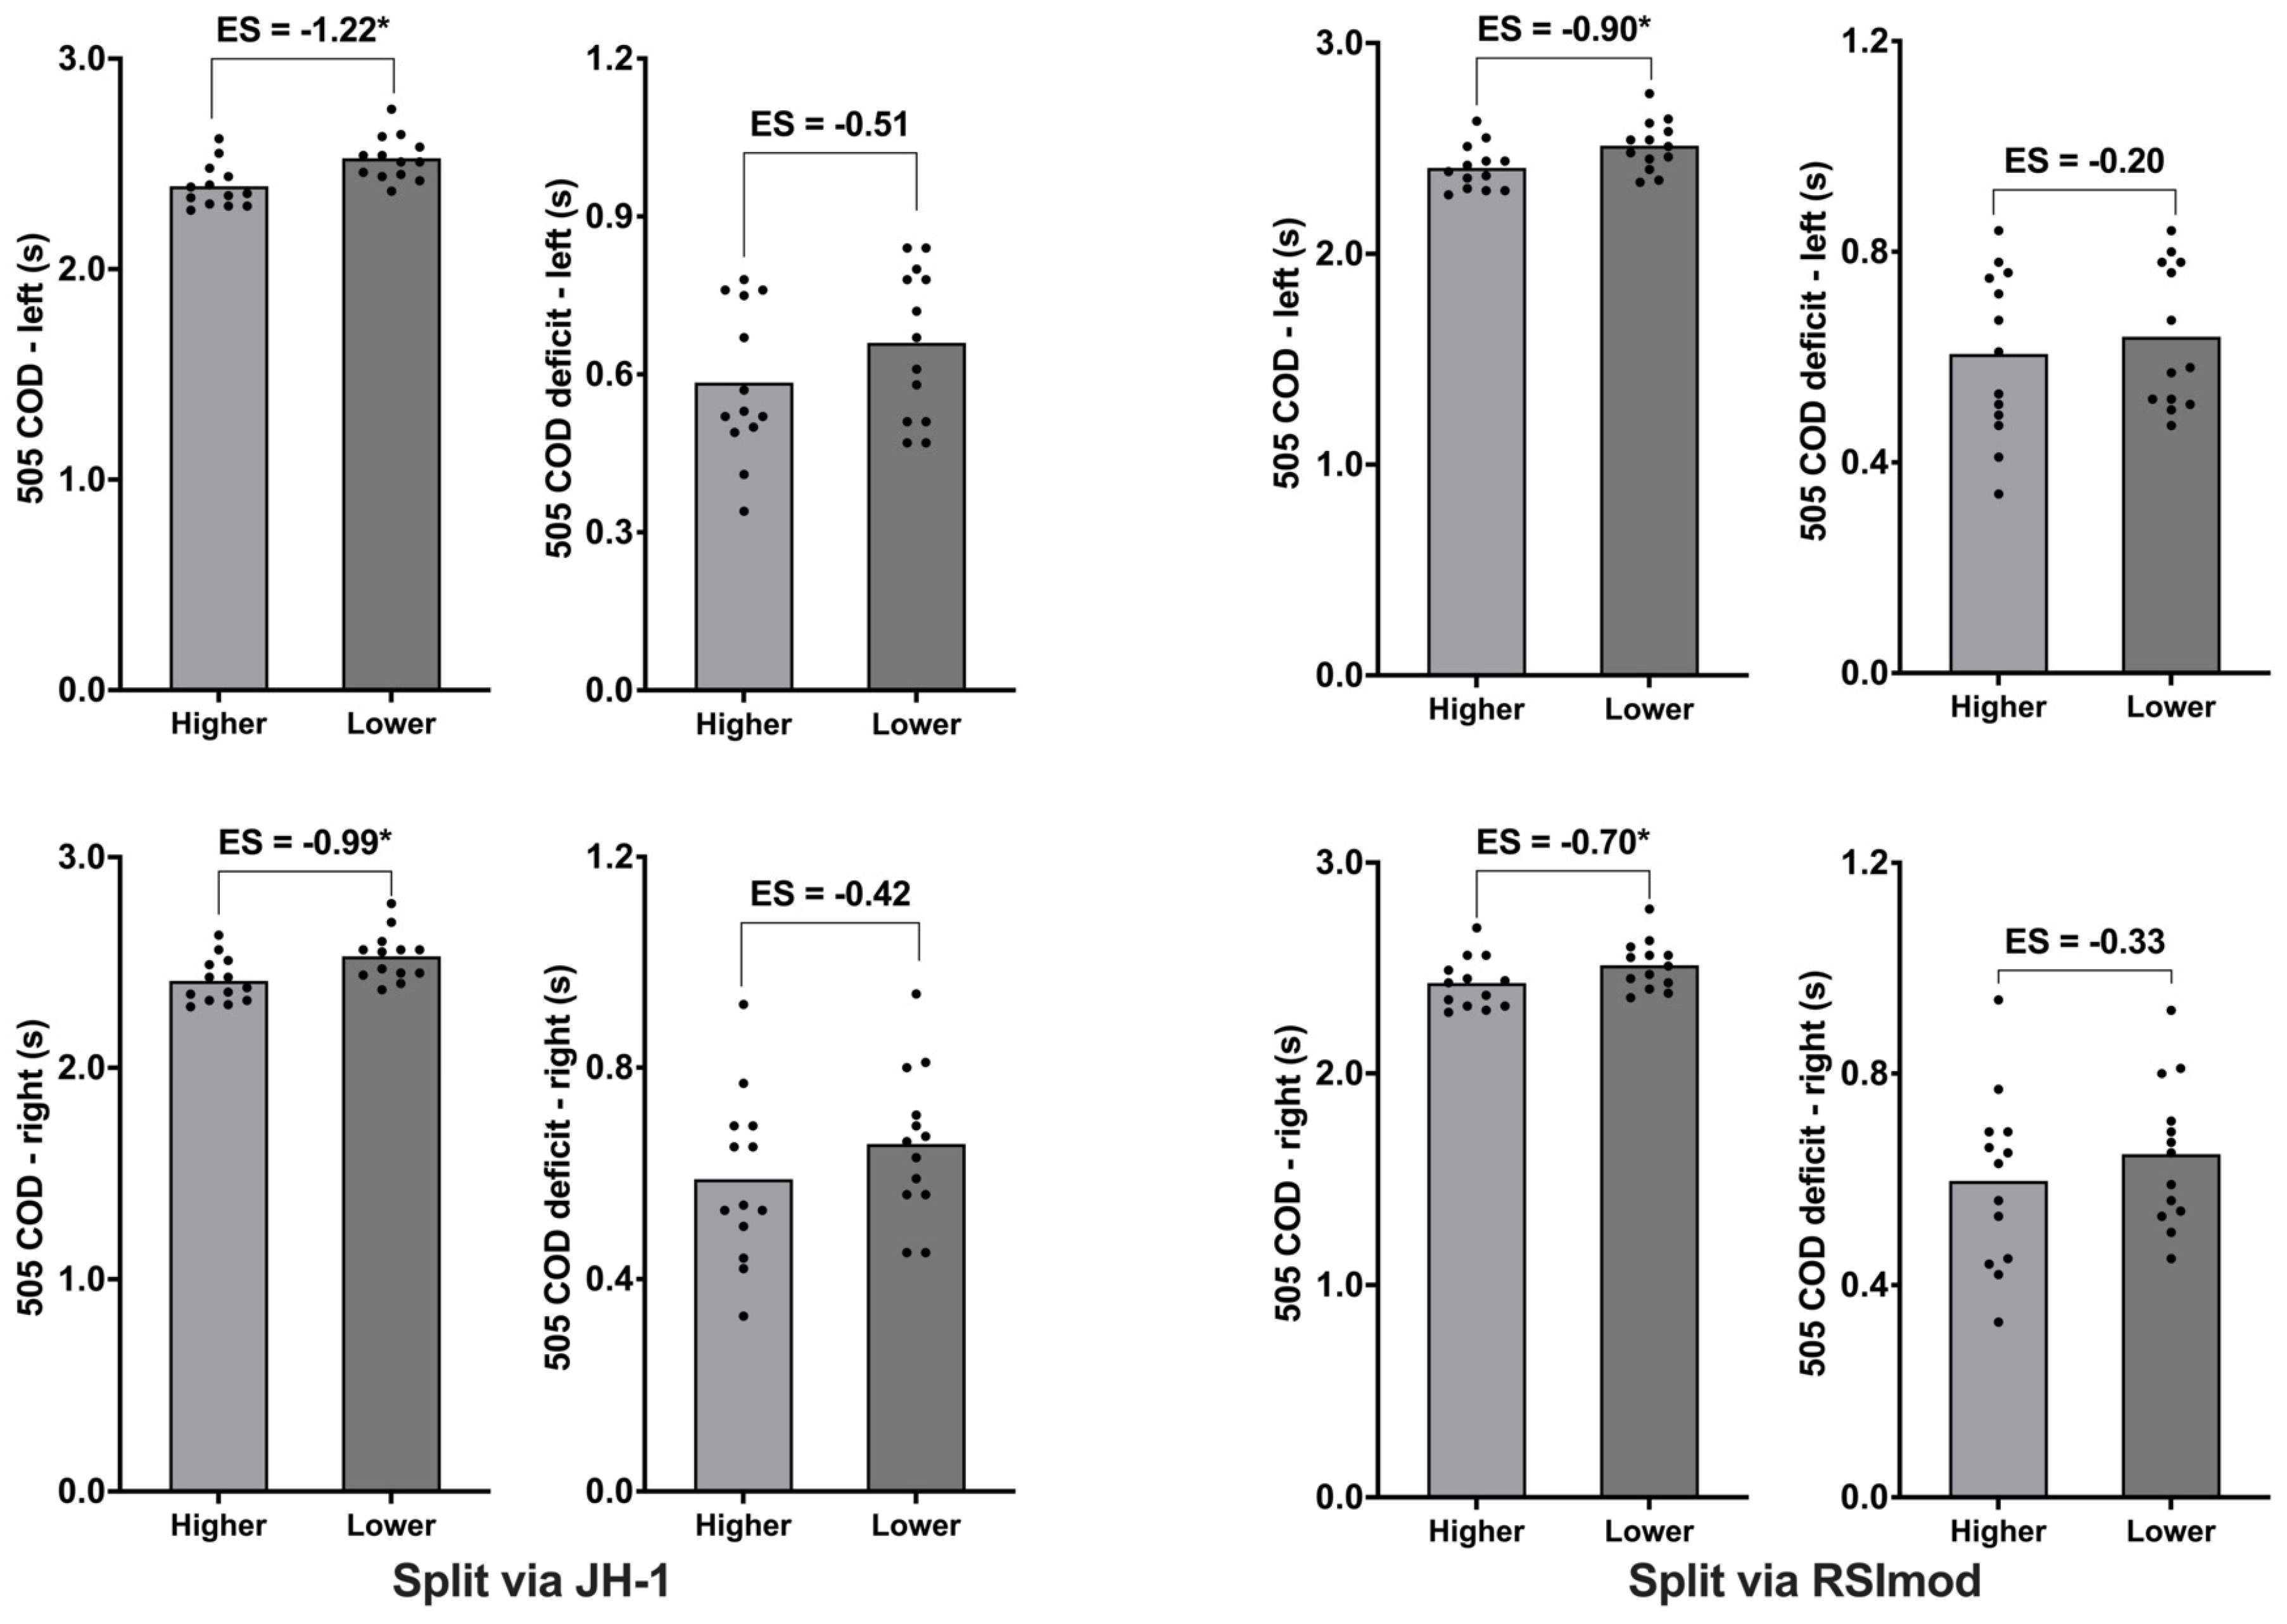
Figure 1, Figure 2, Figure 3, Figure 4, Figure 5, Figure 6 and Figure 7 show comparisons when using the median split analysis to create higher and lower JH (JH-1 and JH-2), RSImod, and RSI groups for independent measures of athletic performance. For both jumps in the CMRJ, significant differences were found between groups for two JH values as well as RSImod and RSI values (p < 0.001). For the CMRJ1 (the first jump of the CMRJ test), significant differences were found between groups when using JH-1 for all athletic performance metrics (g ≥ −0.99, p ≤ 0.03), excluding the 10–20 m time and COD deficits in the right and left sides (p ≥ 0.20). Significant differences were also found between groups when using RSImod for median split analysis, for all linear sprint times (g ≥ −0.58, p ≤ 0.05) and 505 COD times in the right and left sides (g ≥ −0.70, p ≤ 0.05). No other significant differences in IMTP force or COD deficit times were present between higher and lower RSImod groups in CMRJ1. For the CMRJ2 (the second jump of the CMRJ test), significant differences were found between groups when using JH-2 for all athletic performance metrics (g ≥ −0.70, p ≤ 0.05), excluding the F@ 100 ms in IMTP, 10–20 m sprint time, and COD deficits in the right and left sides (p ≥ 0.50); significant differences were also found between groups when using RSI for all linear sprint times (g ≥ −0.59, p ≤ 0.05) and 505 COD times in the right and left sides (g ≥ −0.44, p ≤ 0.04). No other significant differences in IMTP force or COD deficit times were present between higher and lower RSI groups in the CMRJ2.
4. Discussion
This study aimed to examine the meaningful associations between CMRJ performance and independent measures of athletic performance. Results showed that higher JH-1 and greater CM depth in the CMRJ significantly correlated with better performance in the IMTP test. Moreover, a notable inverse relationship between CMRJ metrics and the 20 m linear sprint test was revealed, characterised by large r values. Additionally, a significant inverse relationship was evident between 505 COD times with both JH values and RSImod. While results showed no significant correlations between some CMRJ metrics (e.g., JH-2 and RSI) and the aforementioned measures of athletic performance, the median split analysis underscored significant disparities in IMTP force variables, 20 m sprint times, and 505 COD times between groups, when categorized by higher and lower JH, RSImod, and RSI values. Thus, our preliminary hypothesis was, in part, confirmed.
4.1. Association between CMRJ and IMTP
The present study discovered a statistically significant correlation between IMTP PF and JH-1 in the CMRJ (r = 0.54, p = 0.002), which substantiates the results of previous research [20]. This finding was expected since the IMTP test evaluates the maximal force an athlete can produce, which is also crucial for the power output during the propulsive phase of a jump [20]. Additionally, a noteworthy correlation was established between F@ 300 ms and JH-1 (r = 0.55, p < 0.001), predominantly aligning with previous studies that reported a significant relationship between F@ 250 ms during IMTP and CMJ height (ρ = 0.35) [32]. Specifically, the association between the IMTP F@ 300 ms time frame and JH-1 may be due to the similar duration of the propulsive phase in a CMJ (or CMRJ1), which is typically between 250 and 280 ms [33]. Since the propulsive impulse is a determination factor for JH, the ability to generate considerable force within these critical time frames appears to be a key attribute influencing jump performance [25]. This notion was further supported by the significant positive relationships between IMTP force variables and CM depth during the CMRJ test (r = 0.55 to 0.61, p ≤ 0.001), indicating that a deeper CM depth permits athletes more time to generate larger forces prior to take-off [2]. The correlation between JH-2 and IMTP PF was moderate and non-significant in the present study, aligning more closely with prior research that has shown moderate associations between IMTP PF and DJ height at 0.3 m (r = 0.429, p ≤ 0.01) and 0.4 m drop heights (r = 0.364, p ≤ 0.05) [22]. This discrepancy may be attributed to the unique methodology of our CMRJ test, where athletes fell from individually determined heights after the initial jump, rather than from a standardised fixed drop height. This modification likely introduced additional challenges compared to the conventional DJ test, potentially affecting some athletes’ ability to achieve optimal rebound heights (JH-2) [1]. Nevertheless, the median split analysis, splitting subjects via both JH values, revealed that the IMTP PF, F@ 200 ms and F@ 300 ms values were significantly larger in the higher group (g ≥ 0.70, p ≤ 0.05). Put simply, athletes who jump higher in both CMRJ jumps have at least a moderate likelihood of generating greater forces in the IMTP test.
Contrary to the expectation, RSImod/RSI values did not significantly correlate with any IMTP force measures, deviating from previous studies that have established a significant association [22,32,34]. The median split analysis indicated non-significant trivial to moderate differences (g ≤ 0.72, p ≥ 0.08) in IMTP performance between higher and lower groups, when split by RSImod and RSI metrics (Figure 2 and Figure 5). This lack of significant differences is likely explained by the fact that RSImod and RSI may not directly translate to the expressions of maximal force production in an IMTP, whereby the force is generated from a controlled, isometric context, despite both RSImod and RSI being relevant for dynamic performance or serving as a reflection of jump strategy [2]. Furthermore, the RSImod and RSI are susceptible to manipulation through alterations in jump strategies rather than pure absolute strength capacity [2]. Therefore, the changes in jump strategies among subjects may have resulted in differences in associations between IMTP and CMRJ measures, and to the extent of magnitude of these associations [20].
4.2. Association between CMRJ and 20 m Linear Sprint
Substantiating the findings of previous studies [4,5,10,35], large and statistically significant inverse relationships between JH-1, RSImod, and RSI with the 20 m linear sprint test were observed (r = −0.54 to −0.66, p ≤ 0.001). These findings underscore that athletes demonstrating superior vertical explosive power and reactive strength, as quantified by their CMRJ metrics, also tend to accelerate faster over short distances. The median split analysis further reinforced these associations, revealing that athletes with higher JH-1 and JH-2 values exhibited notably quicker times in the 10 m sprint (g ≥ −0.75, p < 0.05) and 20 m sprint (g ≥ −0.55, p < 0.05), respectively (Figure 3 and Figure 6). This aligns with the biomechanical notion that the vertical jump and sprint share mechanical similarities, predominantly the flexion and extension patterns of the hip, knee, and ankle joints [36]. The increased propulsive force or impulse in a vertical jump implies a possible augmented force application during ground contact of sprinting, potentially resulting in an extended stride length and a faster leg swing cycle [5,36]. Despite the insights provided by the median split analysis, the direct correlation between JH-2 and sprint time was moderate and failed to achieve statistical significance. This discrepancy may reflect the heterogeneous nature of our sample (different jump and sprint techniques amongst three sports), suggesting that a potential non-linear relationship existed, where only athletes surpassing a specific JH-2 threshold demonstrated reduced sprint times.
Delving into the specifics of RSImod and RSI, the median split analysis elucidates their nuanced contribution to sprint performance. Specifically, athletes with higher RSImod and RSI scores exhibited significantly shortened 10 m (g = −0.58, p = 0.04 and g = −0.64, p = 0.04) and 10–20 m sprint times (g = −0.74, p = 0.03 and g = −0.73, p = 0.04), which also extended to shorten the 20 m sprint times (g = −0.75, p = 0.04 and g = −0.73, p = 0.03), as can be seen in Figure 3 and Figure 6. Collectively, these insights advocate that the CMRJ test is integral to sprinting due to its incorporation of both slow and fast SSC movements. Developing explosive force through SSC movements in the CMRJ is particularly beneficial to force generation during the start acceleration and maximum speed phases of sprinting [37]. This is because of the necessity for athletes to rapidly increase their lower limb joint extension velocity and exert substantial force against the ground, which are key factors in effectively building up sprint velocity [17,35]. Although this study did not directly investigate the training effect, it could be speculated that the training program designed to enhance RSImod and RSI in the CMRJ test may have the potential to improve both acceleration and overall sprint performance [37].
4.3. Association between CMRJ and 505 COD Speed
The 505 COD test examines an athlete’s ability to decelerate, change direction, and subsequently re-accelerate, necessitating a complex interplay of neuromuscular coordination, strength, and power [14,15]. Substantiating the findings of previous studies [3,6,14,17,18], the correlational analysis showed a statistical large inverse relationship between two JH values and RSImod with 505 COD times (r = −0.51 to −0.68, p ≤ 0.006). This indicates that the ability to generate and sustain a high amount of force rapidly across the braking and propulsive phases in CMRJ is equally vital for COD tasks (maximum entry and exit velocities) [14]. In contrast to a linear sprint, the RSI showed non-significant correlations with 505 COD times, which is consistent with prior research [17]. A recent meta-analysis elucidated that when individuals perform COD manoeuvres with directional changes of >90°, they predominantly rely on slow SSC mechanics [38]. The results from the median split analysis support this notion (Figure 4 and Figure 7), whereby athletes who jumped higher in both jumps of the CMRJ test and scored higher RSImod and RSI values exhibited faster 505 COD times on the right and left sides (g ≥ −0.44, p ≤ 0.04). Collectively, it seems reasonable to deduce that outcomes related to slow SSC movements (e.g., JH-1 and RSImod) obtained from the CMRJ test may offer a more accurate indication of an athlete’s COD capabilities than those associated with fast SSC movements (e.g., JH-2 and RSI) [17].
Contrary to the expectations, no significant correlation was found between CMRJ metrics and the COD deficit (Table 2). However, this finding is consistent with that of Lockie et al. [39] and Thomas et al. [14], who reported the absence of such relationships in male team sports athletes. While some CMRJ metrics are inversely associated with 505 COD times, they do not necessarily predict the efficiency of directional changes, which is what the COD deficit measures [15]. The lack of correlation with the 505 COD deficit may be due to the multidimensional nature of COD tasks, which require not only the power and force production quantified by CMRJ metrics but also specific technical skills that are not captured in the CMRJ test; these skills typically include the body lean, foot placement, and step adjustment for deceleration and acceleration [6,40]. Finally, and although a relatively minor consideration, the median split analysis did not reveal significant differences in the COD deficit between groups with higher and lower CMRJ metrics (Figure 4 and Figure 7). Therefore, CMRJ performance measures could confidently mirror the physical competencies relevant to a 505 COD task, but they might not be sufficient by themselves to predict COD efficiency comprehensively. For practitioners, a holistic appraisal encompassing the technical aspects of COD tasks is imperative to optimise athletic performance in sports requiring multidirectional movements [14].
4.4. Limitations
The current study is not without its limitations. First, our research focused solely on CMRJ metrics verified for reliability in a previous study [1] without evaluating other kinetic variables, like propulsive force and power, which might show a stronger correlation to athletic performance if included. Second, the reliability of the 505 COD deficit was not acceptable, with poor CV values (22.23 to 29.64%). This high variability could be attributed to the COD deficit being a ratio metric, which typically exhibits larger variability than raw data metrics [41]. When compared with the raw data for 505 COD times, it can be seen that individual test scores were more closely clustered together, as depicted in Figure 4 and Figure 7. This phenomenon likely contributed to the absence of a significant correlation between CMRJ metrics and COD deficits observed in our analysis. Third, the 20 m sprint distance selected for this study, derived from previous research with team sports athletes [10,17,24], might not reflect the real maximum speed achievable by athletes, potentially weakening the observed correlations. Practitioners should consider this when comparing CMRJ performance with longer sprint distances that exceed 20 m, where athletes are more likely to reach their maximum speed. Finally, the small sample size in our study limits the generalizability of our findings to other populations. With this in mind, future studies should aim to recruit a broader and more representative sample to enhance the robustness and applicability of the results across various sporting populations.
5. Conclusions
Drawing from the insights of our study, we propose several practical applications for strength and conditioning practitioners. Our study supports using CMRJ metrics as a valuable indicator of lower-limb explosive force production and as the physical attributes relevant to an athlete’s maximum force output, linear sprint, and COD performance. In addition, a number of correlations identified in the present study were large, positioning the CMRJ test as a useful surrogate measure of performance for independent athletic qualities. Considering the efficiency of the CMRJ test in assessing a spectrum of explosive power attributes, it should be integrated into athletic performance evaluations. Furthermore, in recognition of the large variability of some CMRJ metrics, we recommend implementing familiarisation trials to enhance the consistency of the data collected from metrics such as CM depth and Kleg. This approach would lead to more reliable data, enabling practitioners to make well-informed decisions in developing and refining training programs.
Author Contributions
Conceptualization, J.X., A.T. and C.B.; methodology, J.X., A.T. and C.B.; software, J.X., A.T. and C.B.; validation, J.X., A.T. and C.B.; formal analysis, J.X., C.B. and S.C.; investigation, J.X., C.B. and S.C.; resources, J.X., A.T. and C.B.; data curation, J.X. and C.B.; writing—original draft preparation, J.X. and C.B.; writing—review and editing, all authors; visualization, J.X. and C.B.; supervision, A.T. and C.B.; project administration, A.T. and C.B. All authors have read and agreed to the published version of the manuscript.
Funding
This research received no external funding.
Institutional Review Board Statement
This study was conducted in accordance with the guidelines of the Declaration of Helsinki and the current national laws and regulations, and it was approved by the London Sport Institute research and ethics committee at Middlesex University, London, UK on 13 October 2022 (application no. 23117).
Informed Consent Statement
Informed consent was obtained from all subjects involved in this study.
Data Availability Statement
The raw data supporting the conclusions of this article will be made available by the authors without undue reservation.
Acknowledgments
The authors warmly thank the participants of this study.
Conflicts of Interest
The authors declare no conflicts of interest.
References
- Xu, J.; Turner, A.; Comyns, T.M.; Chavda, S.; Bishop, C. The Countermovement Rebound Jump: Between-Session Reliability and a Comparison with the Countermovement and Drop Jump Tests. J. Strength Cond. Res. 2024, 38, e150–e159. [Google Scholar] [CrossRef] [PubMed]
- Bishop, C.; Turner, A.; Jordan, M.; Harry, J.; Loturco, I.; Lake, J.; Comfort, P. A Framework to Guide Practitioners for Selecting Metrics during the Countermovement and Drop Jump Tests. Strength Cond. J. 2021, 44, 95–103. [Google Scholar] [CrossRef]
- Suarez-Arrones, L.; Gonzalo-Skok, O.; Carrasquilla, I.; Asián-Clemente, J.; Santalla, A.; Lara-Lopez, P.; Núñez, F.J. Relationships between Change of Direction, Sprint, Jump, and Squat Power Performance. Sports 2020, 8, 38. [Google Scholar] [CrossRef] [PubMed]
- Barr, M.J.; Nolte, V.W. Which Measure of Drop Jump Performance Best Predicts Sprinting Speed? J. Strength Cond. Res. 2011, 25, 1976–1982. [Google Scholar] [CrossRef] [PubMed]
- Washif, J.A.; Kok, L. Relationships between Vertical Jump Metrics and Sprint Performance, and Qualities that Distinguish between Faster and Slower Sprinters. J. Sci. Sport Exerc. 2022, 4, 135–144. [Google Scholar] [CrossRef]
- Young, W.B.; Miller, I.R.; Talpey, S.W. Physical Qualities Predict Change-of-Direction Speed but Not Defensive Agility in Australian Rules Football. J. Strength Cond. Res. 2015, 29, 206–212. [Google Scholar] [CrossRef] [PubMed]
- McMahon, J.J.; Lake, J.P.; Stratford, C.; Comfort, P. A Proposed Method for Evaluating Drop Jump Performance with One Force Platform. Biomechanics 2021, 1, 178–189. [Google Scholar] [CrossRef]
- Krzyszkowski, J.; Chowning, L.D.; Harry, J.R. Phase-Specific Predictors of Countermovement Jump Performance that Distinguish Good from Poor Jumpers. J. Strength Cond. Res. 2022, 36, 1257–1263. [Google Scholar] [CrossRef]
- Xu, J.; Turner, A.; Comyns, T.M.; Harry, J.R.; Chavda, S.; Bishop, C. Countermovement Rebound Jump: A Comparison of Joint Work and Joint Contribution to the Countermovement and Drop Jump Tests. Appl. Sci. 2023, 13, 10680. [Google Scholar] [CrossRef]
- Carr, C.; McMahon, J.J.; Comfort, P. Relationships between Jump and Sprint Performance in First-Class County Cricketers. J. Trainol. 2015, 4, 1–5. [Google Scholar] [CrossRef]
- Young, W.; Russell, A.; Burge, P.; Clarke, A.; Cormack, S.; Stewart, G. The use of Sprint Tests for Assessment of Speed Qualities of Elite Australian Rules Footballers. Int. J. Sports Physiol. Perform. 2008, 3, 199–206. [Google Scholar] [CrossRef] [PubMed]
- Wild, J.J.; Bezodis, I.N.; North, J.S.; Bezodis, N.E. Differences in Step Characteristics and Linear Kinematics between Rugby Players and Sprinters during Initial Sprint Acceleration. Eur. J. Sport Sci. 2018, 18, 1327–1337. [Google Scholar] [CrossRef]
- Hori, N.; Newton, R.U.; Andrews, W.A.; Kawamori, N.; McGuigan, M.R.; Nosaka, K. Does Performance of Hang Power Clean Differentiate Performance of Jumping, Sprinting, and Changing of Direction? J. Strength Cond. Res. 2008, 22, 412–418. [Google Scholar] [CrossRef] [PubMed]
- Thomas, C.; Dos’ Santos, T.; Comfort, P.; Jones, P.A. Relationships between Unilateral Muscle Strength Qualities and Change of Direction in Adolescent Team-Sport Athletes. Sports 2018, 6, 83. [Google Scholar] [CrossRef] [PubMed]
- Nimphius, S.; Callaghan, S.J.; Spiteri, T.; Lockie, R.G. Change of Direction Deficit: A More Isolated Measure of Change of Direction Performance than Total 505 Time. J. Strength Cond. Res. 2016, 30, 3024–3032. [Google Scholar] [CrossRef]
- Katsumata, K.; Aoki, K. Jumping Ability is Related to Change of Direction Ability in Elite Handball Players. J. Electromyogr. Kinesiol. 2021, 60, 102575. [Google Scholar] [CrossRef] [PubMed]
- Foden, M.; Astley, S.; Comfort, P.; McMahon, J.J.; Matthews, M.J.; Jones, P.A. Relationships between Speed, Change of Direction and Jump Performance with Cricket Specific Speed Tests in Male Academy Cricketers. J. Trainol. 2015, 4, 37–42. [Google Scholar] [CrossRef] [PubMed]
- Hernández-Davó, J.L.; Loturco, I.; Pereira, L.A.; Cesari, R.; Pratdesaba, J.; Madruga-Parera, M.; Sanz-Rivas, D.; Fernández-Fernández, J. Relationship between Sprint, Change of Direction, Jump, and Hexagon Test Performance in Young Tennis Players. J. Sports Sci. Med. 2021, 20, 197. [Google Scholar] [CrossRef]
- Jones, P.A.; Bampouras, T.; Marrin, K. An Investigation into the Physical Determinants of Change of Direction Speed. J. Sports Med. Phys. Fit. 2009, 49, 97–104. [Google Scholar]
- Lum, D.; Haff, G.G.; Barbosa, T.M. The Relationship between Isometric Force-Time Characteristics and Dynamic Performance: A Systematic Review. Sports 2020, 8, 63. [Google Scholar] [CrossRef]
- Thomas, C.; Comfort, P.; Chiang, C.; Jones, P.A. Relationship between Isometric Mid-Thigh Pull Variables and Sprint and Change of Direction Performance in Collegiate Athletes. J. Trainol. 2015, 4, 6–10. [Google Scholar] [CrossRef] [PubMed]
- Beattie, K.; Carson, B.P.; Lyons, M.; Kenny, I.C. The Relationship between Maximal Strength and Reactive Strength. Int. J. Sports Physiol. Perform. 2017, 12, 548–553. [Google Scholar] [CrossRef]
- International Committee of Medical Journal Editors. Uniform Requirements for Manuscripts Submitted to Biomedical Journals. Pathology 1997, 29, 441–447. [Google Scholar]
- Loturco, I.; Pereira, L.A.; Freitas, T.T.; Alcaraz, P.E.; Zanetti, V.; Bishop, C.; Jeffreys, I. Maximum Acceleration Performance of Professional Soccer Players in Linear Sprints: Is there a Direct Connection with Change-of-Direction Ability? PLoS ONE 2019, 14, e0216806. [Google Scholar] [CrossRef] [PubMed]
- Xu, J.; Turner, A.; Comfort, P.; Harry, J.R.; McMahon, J.J.; Chavda, S.; Bishop, C. A Systematic Review of the Different Calculation Methods for Measuring Jump Height during the Countermovement and Drop Jump Tests. Sports Med. 2023, 53, 1055–1072. [Google Scholar] [CrossRef] [PubMed]
- Guppy, S.N.; Brady, C.J.; Kotani, Y.; Stone, M.H.; Medic, N.; Haff, G.G. The Effect of Altering Body Posture and Barbell Position on the between-Session Reliability of Force-Time Curve Characteristics in the Isometric Mid-Thigh Pull. Sports 2018, 6, 162. [Google Scholar] [CrossRef] [PubMed]
- Chavda, S.; Turner, A.N.; Comfort, P.; Haff, G.G.; Williams, S.; Bishop, C.; Lake, J.P. A Practical Guide to Analyzing the Force-Time Curve of Isometric Tasks in Excel. Strength Cond. J. 2020, 42, 26–37. [Google Scholar] [CrossRef]
- Koo, T.K.; Li, M.Y. A Guideline of Selecting and Reporting Intraclass Correlation Coefficients for Reliability Research. J. Chiropr. Med. 2016, 15, 155–163. [Google Scholar] [CrossRef] [PubMed]
- Duthie, G.; Pyne, D.; Hooper, S. The Reliability of Video Based Time Motion Analysis. J. Hum. Mov. Stud. 2003, 44, 259–272. [Google Scholar]
- Curtin, F.; Schulz, P. Multiple Correlations and Bonferroni’s Correction. Biol. Psychiatry 1998, 44, 775–777. [Google Scholar] [CrossRef]
- Hopkins, W.G. Measures of Reliability in Sports Medicine and Science. Sports Med. 2000, 30, 1–15. [Google Scholar] [CrossRef] [PubMed]
- Dos’ Santos, T.; Thomas, C.; Comfort, P.; McMahon, J.J.; Jones, P.A. Relationships between Isometric Force-Time Characteristics and Dynamic Performance. Sports 2017, 5, 68. [Google Scholar] [CrossRef]
- McMahon, J.J.; Murphy, S.; Rej, S.J.; Comfort, P. Countermovement Jump Phase Characteristics of Senior and Academy Rugby League Players. Int. J. Sports Physiol. Perform. 2017, 12, 803–811. [Google Scholar] [CrossRef] [PubMed]
- Kuki, S.; Sato, K.; Stone, M.H.; Okano, K.; Yoshida, T.; Tanigawa, S. The Relationship between Isometric Mid-Thigh Pull Variables, Jump Variables and Sprint Performance in Collegiate Soccer Players. J. Trainol. 2017, 6, 42–46. [Google Scholar] [CrossRef] [PubMed]
- Shalfawi, S.A.; Sabbah, A.; Kailani, G.; Tønnessen, E.; Enoksen, E. The Relationship between Running Speed and Measures of Vertical Jump in Professional Basketball Players: A Field-Test Approach. J. Strength Cond. Res. 2011, 25, 3088–3092. [Google Scholar] [CrossRef] [PubMed]
- Kale, M.; Asçi, A.; Bayrak, C.; Açikada, C. Relationships among Jumping Performances and Sprint Parameters during Maximum Speed Phase in Sprinters. J. Strength Cond. Res. 2009, 23, 2272–2279. [Google Scholar] [CrossRef] [PubMed]
- Hennessy, L.; Kilty, J. Relationship of the Stretch-Shortening Cycle to Sprint Performance in Trained Female Athletes. J. Strength Cond. Res. 2001, 15, 326–331. [Google Scholar]
- Jarvis, P.; Turner, A.; Read, P.; Bishop, C. Reactive Strength Index and its Associations with Measures of Physical and Sports Performance: A Systematic Review with Meta-Analysis. Sports Med. 2022, 52, 301–330. [Google Scholar] [CrossRef] [PubMed]
- Lockie, R.G.; Stage, A.A.; Stokes, J.J.; Orjalo, A.J.; Davis, D.L.; Giuliano, D.V.; Moreno, M.R.; Risso, F.G.; Lazar, A.; Birmingham-Babauta, S.A. Relationships and Predictive Capabilities of Jump Assessments to Soccer-Specific Field Test Performance in Division I Collegiate Players. Sports 2016, 4, 56. [Google Scholar] [CrossRef] [PubMed]
- Young, W.B.; James, R.; Montgomery, I. Is Muscle Power Related to Running Speed with Changes of Direction? J. Sports Med. Phys. Fit. 2002, 42, 282–288. [Google Scholar]
- Bishop, C.; Clarke, R.; Freitas, T.T.; Arruda, A.F.; Guerriero, A.; Ramos, M.S.; Pereira, L.A.; Loturco, I. Change-of-Direction Deficit vs. Deceleration Deficit: A Comparison of Limb Dominance and Inter-Limb Asymmetry between Forwards and Backs in Elite Male Rugby Union Players. J. Sports Sci. 2021, 39, 1088–1095. [Google Scholar] [CrossRef]
Figure 1.
Differences in CMRJ metrics measures between the higher and lower groups in JH, RSImod, and RSI. * Significantly different between groups (p < 0.05).
Figure 1.
Differences in CMRJ metrics measures between the higher and lower groups in JH, RSImod, and RSI. * Significantly different between groups (p < 0.05).

Figure 2.
Differences in IMTP force metrics between the higher and lower groups in JH-1 and RSImod during the first jump of the CMRJ test. * Significantly different between groups (p < 0.05).
Figure 2.
Differences in IMTP force metrics between the higher and lower groups in JH-1 and RSImod during the first jump of the CMRJ test. * Significantly different between groups (p < 0.05).

Figure 3.
Differences in 20-metre linear sprint time between the higher and lower groups in JH-1 and RSImod during the first jump of the CMRJ test. * Significantly different between groups (p < 0.05).
Figure 3.
Differences in 20-metre linear sprint time between the higher and lower groups in JH-1 and RSImod during the first jump of the CMRJ test. * Significantly different between groups (p < 0.05).

Figure 4.
Differences in 505 COD time between the higher and lower groups in JH-1 and RSImod during the first jump of the CMRJ test. * Significantly different between groups (p < 0.05).
Figure 4.
Differences in 505 COD time between the higher and lower groups in JH-1 and RSImod during the first jump of the CMRJ test. * Significantly different between groups (p < 0.05).

Figure 5.
Differences in IMTP force metrics between the higher and lower groups in JH-2 and RSI during the second jump of the CMRJ test. * Significantly different between groups (p < 0.05).
Figure 5.
Differences in IMTP force metrics between the higher and lower groups in JH-2 and RSI during the second jump of the CMRJ test. * Significantly different between groups (p < 0.05).

Figure 6.
Differences in 20-metre linear sprint time between the higher and lower groups in JH-2 and RSI during the second jump of the CMRJ test. * Significantly different between groups (p < 0.05).
Figure 6.
Differences in 20-metre linear sprint time between the higher and lower groups in JH-2 and RSI during the second jump of the CMRJ test. * Significantly different between groups (p < 0.05).

Figure 7.
Differences in 505 COD time between the higher and lower groups in JH-2 and RSI during the second jump of the CMRJ test. * Significantly different between groups (p < 0.05).
Figure 7.
Differences in 505 COD time between the higher and lower groups in JH-2 and RSI during the second jump of the CMRJ test. * Significantly different between groups (p < 0.05).


Table 1.
Description statistics and within-session reliability of the measured metrics.
| Test | Metric’s Name | Mean ± SD | ICC (95% CI) | CV (95% CI) |
|---|---|---|---|---|
| CMRJ | CM depth (m) | 0.24 ± 0.07 | 0.94 (0.88, 0.97) | 10.83 (7.94, 13.72) |
| TTTO (s) | 0.61 ± 0.11 | 0.90 (0.82, 0.95) | 8.43 (6.18, 10.68) | |
| JH-1 (m) | 0.36 ± 0.07 | 0.97 (0.94, 0.98) | 6.51 (4.78, 8.25) | |
| RSImod | 0.57 ± 0.11 | 0.95 (0.91, 0.98) | 9.79 (7.18, 12.40) | |
| Kleg (kN/m) | 19.51 ± 9.59 | 0.92 (0.86, 0.96) | 21.13 (15.49, 26.76) | |
| GCT (s) | 0.28 ± 0.09 | 0.97 (0.94, 0.99) | 7.60 (5.57, 9.63) | |
| JH-2 (m) | 0.34 ± 0.07 | 0.96 (0.93, 0.98) | 6.20 (4.55, 7.86) | |
| RSI | 1.28 ± 0.36 | 0.95 (0.90, 0.97) | 9.32 (6.83, 11.81) | |
| IMTP | Peak Force (N) | 1655.58 ± 487.61 | 0.99 (0.99, 1.00) | 4.00 (2.89, 5.11) |
| Force@ 100 ms (N) | 724.89 ± 197.74 | 0.96 (0.93, 0.98) | 10.61 (7.67, 13.55) | |
| Force@ 200 ms (N) | 1192.01 ± 333.19 | 0.98 (0.95, 0.99) | 7.09 (5.13, 9.06) | |
| Force@ 300 ms (N) | 1300.69 ± 334.70 | 0.98 (0.95, 0.99) | 6.42 (4.64, 8.20) | |
| Linear sprint | 10 m time (s) | 1.81 ± 0.12 | 0.88 (0.77, 0.94) | 3.35 (2.42, 4.28) |
| 10–20 m time (s) | 1.37 ± 0.05 | 0.92 (0.85, 0.96) | 2.79 (2.06, 3.57) | |
| 20 m time (s) | 3.18 ± 0.11 | 0.93 (0.86, 0.96) | 2.23 (1.61, 2.85) | |
| 505-COD | Left 505 time (s) | 2.49 ± 0.14 | 0.86 (0.72, 0.93) | 4.59 (3.32, 5.86) |
| Left 505 deficit (s) | 0.63 ± 0.15 | 0.83 (0.68, 0.92) | 29.64 (21.42, 37.39) | |
| Right 505 time (s) | 2.47 ± 0.12 | 0.88 (0.75, 0.94) | 3.85 (2.78, 4.90) | |
| Right 505 deficit (s) | 0.62 ± 0.14 | 0.85 (0.71, 0.93) | 22.23 (16.07, 28.39) |
ICC: intraclass correlation coefficient; CV: coefficient of variation; CMRJ: countermovement rebound jump; CM depth = countermovement depth; TTTO = time to take-off; RSImod = reactive strength index modified; Kleg = leg stiffness; GCT = ground contact time; RSI = reactive strength index; IMTP: isometric mid-thigh pull; COD: change of direction.
Table 2.
Relationships between athletic performance and metrics collected during countermovement rebound jump (r values).
Table 2.
Relationships between athletic performance and metrics collected during countermovement rebound jump (r values).
| Metrics Name | CM Depth | TTTO | JH-1 | RSImod | Kleg | GCT | JH-2 | RSI | |
|---|---|---|---|---|---|---|---|---|---|
| IMTP | Peak Force | 0.61 * | 0.44 | 0.54 * | 0.18 | 0.22 | 0.30 | 0.45 | 0.11 |
| Force@ 100 ms | 0.45 | 0.46 | 0.40 | 0.13 | 0.03 | 0.15 | 0.40 | 0.15 | |
| Force@ 200 ms | 0.55 * | 0.42 | 0.46 | 0.04 | 0.13 | 0.31 | 0.45 | 0.20 | |
| Force@ 300 ms | 0.60 * | 0.50 | 0.55 * | 0.03 | 0.20 | 0.35 | 0.44 | 0.17 | |
| Linear sprint | 10 m time | −0.21 | 0.14 | −0.54 * | −0.60 * | 0.10 | 0.06 | −0.48 | −0.55 * |
| 10–20 m time | −0.08 | 0.12 | −0.38 | −0.55 * | −0.10 | 0.37 | −0.31 | −0.61 * | |
| 20 m time | −0.20 | 0.16 | −0.54 * | −0.66 * | 0.14 | 0.25 | −0.46 | −0.64 * | |
| 505-COD | Left 505 time | −0.26 | 0.21 | −0.68 * | −0.57 * | 0.06 | −0.10 | −0.58 * | −0.43 |
| Left 505 deficit | −0.30 | 0.07 | −0.16 | −0.03 | 0.05 | 0.09 | −0.07 | −0.03 | |
| Right 505 time | −0.25 | 0.22 | −0.63 * | −0.51 * | −0.01 | −0.09 | −0.52 * | −0.47 | |
| Right 505 deficit | −0.21 | 0.02 | −0.17 | −0.03 | −0.02 | 0.03 | −0.10 | −0.02 |
CM depth = countermovement depth; TTTO = time to take-off; RSImod = reactive strength index modified; Kleg = leg stiffness; GCT = ground contact time; RSI = reactive strength index; IMTP: isometric mid-thigh pull; COD: change of direction. * Correlation is significant at the 0.006 level.
Disclaimer/Publisher’s Note: The statements, opinions and data contained in all publications are solely those of the individual author(s) and contributor(s) and not of MDPI and/or the editor(s). MDPI and/or the editor(s) disclaim responsibility for any injury to people or property resulting from any ideas, methods, instructions or products referred to in the content. |
© 2024 by the authors. Licensee MDPI, Basel, Switzerland. This article is an open access article distributed under the terms and conditions of the Creative Commons Attribution (CC BY) license (https://creativecommons.org/licenses/by/4.0/).
Share and Cite
MDPI and ACS Style
Xu, J.; Turner, A.; Comyns, T.M.; Chavda, S.; Bishop, C. The Association between Countermovement Rebound Jump Metrics and Independent Measures of Athletic Performance. Appl. Sci. 2024, 14, 3718. https://doi.org/10.3390/app14093718
AMA Style
Xu J, Turner A, Comyns TM, Chavda S, Bishop C. The Association between Countermovement Rebound Jump Metrics and Independent Measures of Athletic Performance. Applied Sciences. 2024; 14(9):3718. https://doi.org/10.3390/app14093718
Chicago/Turabian StyleXu, Jiaqing, Anthony Turner, Thomas M. Comyns, Shyam Chavda, and Chris Bishop. 2024. "The Association between Countermovement Rebound Jump Metrics and Independent Measures of Athletic Performance" Applied Sciences 14, no. 9: 3718. https://doi.org/10.3390/app14093718
Note that from the first issue of 2016, this journal uses article numbers instead of page numbers. See further details here.