1. Introduction
Spatial self-organizing patterns (SOP) can be effectively exploited for hiding and transmitting secret digital images. A digital fingerprint image is used as the initial condition for the evolution of a pattern in a model of reaction-diffusion cellular automata [
1]. A secure digital image communication scheme based on patterns evolving in a Beddington-DeAngelis-type predator-prey model with self- and cross-diffusion is proposed in [
2]. Considerations on hardware implementation of image steganography based on reaction diffusion models are presented in [
3]. SOP induced by evolutionary spatial
games are exploited for hiding and transmitting secret visual information in [
4]. Competitively and non-diffusively coupled non-linear maps are used for hiding secret visual information in [
5].
However, above-mentioned pattern formation algorithms do exhibit a number of drawbacks in secret image communication applications. The self-organized pattern produced in a model of reaction-diffusion cellular automata [
1] clearly resembles the initial fingerprint image and cannot be considered as an image hiding algorithm. At least 10,000 time forward iterations are required for the formation of an interpretable pattern produced by the reaction-diffusion model in [
2,
3]. The inversion of a single pixel in the initial random image does not result into any changes in the self-organized pattern produced by the communication algorithm proposed in [
4]. Self-organized patterns produced by competitively and non-diffusively coupled non-linear maps [
5] are originated by wave propagation in isotropic media, what predetermines a rather low complexity of the pattern structure.
The main objective of this paper is to develop a computationally effective visual communication scheme which could preserve the security of the communication, but minimize all previously-mentioned drawbacks. It is well known that patterns produced by the atrial fibrillation (AF) model are originated from complex rules of self-organization and wave propagation in anisotropic media. The ability to exploit this complex pattern formation phenomenon in a digital image communication scheme is the main goal of this paper.
Atrial muscle is comprised from myocytes that form the primal structure of the tissue. Observable patterns formed by myocytes are not regular and conform to complex self-organizing rules as proposed in [
6,
7]. Cells within this structure are coupled mainly by longitudinal (end-to-end) connections rather than latitudinal (side-by-side) connections thus resembling a cable-like signal transmission [
6,
8]. Conditions such as fibrosis and scarring processes can weaken and damage the connections [
6], change and adjust the network of functioning cells [
9,
10].
The whole interaction of cells within the network can be modeled as proposed in [
11]. Longitudinal (end-to-end) signals are always transmitted, whereas latitudinal (side-by-side) signals are transmitted only with a probability
ν. This non-symmetrical coupling corresponds to the physical organization of cable-like transmissions. As a simplification, the structure can be presented as a flat entity because the wall of the atrial muscle is relatively thin [
8].
This paper is organized as follows. The model of the system is presented in
Section 2; the formation of SOP is discussed in
Section 3. A communication scheme based on SOP in the AF model is presented in
Section 4; the sensitivity of the proposed communication scheme to perturbations of its parameters is discussed in
Section 5; Concluding remarks are given in the final section.
2. The Model of the System
The general idea of cable like transmissions is implemented on a discrete grid as follows. Three states of cells are considered: the resting state, the excited state and the refractory state. Resting cells and excited cells interact in two directions with different probabilities—probability 1 for the longitudinal direction and probability
ν for the latitudinal (transversal) direction. Right after the cell is excited it enters the refractory state where it remains for the time period equal to
τ (as illustrated in
Figure 1).
In order to recreate some basic topological features of the atrial muscle periodic boundary conditions in the transversal direction can be combined with open boundary conditions in the longitudinal direction. This corresponds to the topology of a cylinder that is useful in order to investigate the effects of spontaneous heterogeneity that take place on the front of the propagating wave.
Figure 1.
The diagram of interaction between cells within the network. Resting cells (black) and excited cells (white) interact in two directions with different probabilities. The resting cell becomes excited if it interacts with another excited cell. An excited cell (white) enters a refractory state (gray) for a time period τ.
In general, once the initial grid is fixed, all the interactions that can be numerically simulated depend only on system parameters ν (the probability of interactions along the transversal direction) and τ (the time spent in the refractory state).
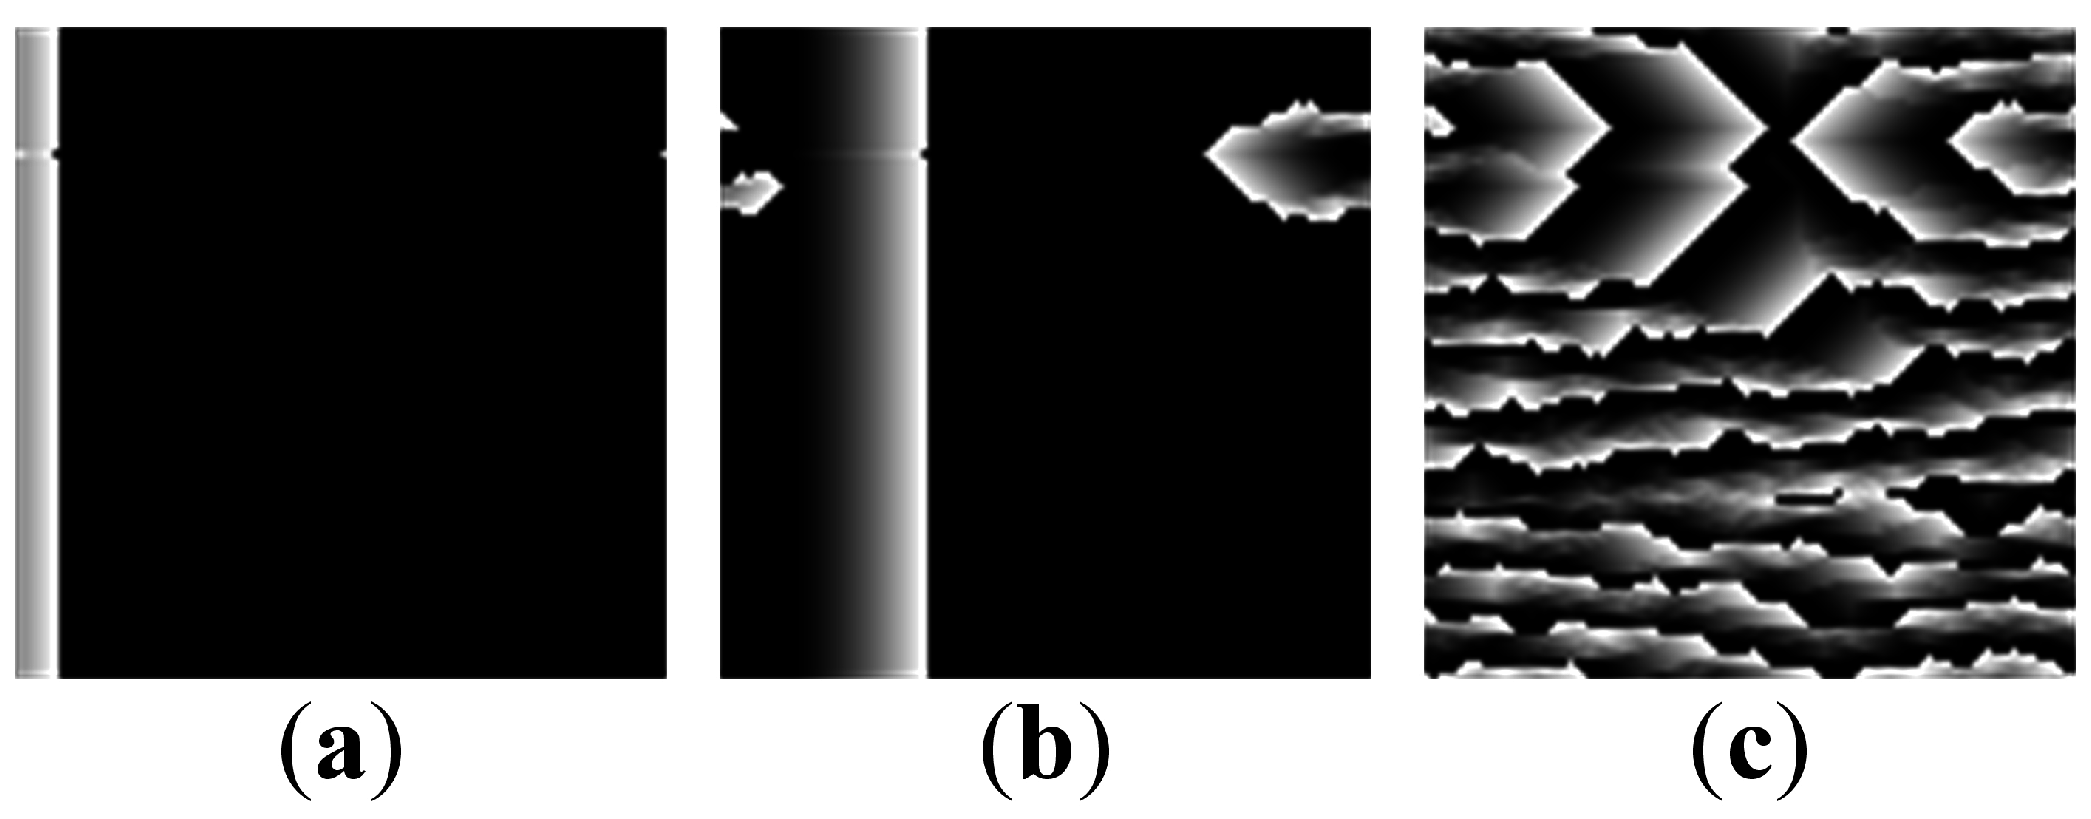
However, the interactions between cells can be seriously complicated by dysfunctional cells. That can be illustrated by a simple computational experiment in
Figure 2. Pacemaker cells are placed at the left boundary of the digital image and initiate the wave front which propagates to the right in all longitudinal cables (
Figure 2a). However, because of dysfunctional cells, this is not always the only wave direction. The dysfunctional cell may block the propagation wave front (
Figure 2b). The interplay between the wave fronts can form different patterns as shown in
Figure 2c. Note that the boundary conditions are periodic.
Figure 2.
Initial plane vertical wave is induced at left side by pacemaker cells (a). However, one cell is dysfunctional and blocks the propagation of the wave front (b). Due to the vertical connections between longitudinal cables, the resulting process forms a pattern (c).
Figure 2.
Initial plane vertical wave is induced at left side by pacemaker cells (a). However, one cell is dysfunctional and blocks the propagation of the wave front (b). Due to the vertical connections between longitudinal cables, the resulting process forms a pattern (c).
However, such computational setup as illustrated in
Figure 2 requires many time-forward interactions for the formation of a well-developed patterns. The wave front must propagate over all plane (and preferably more than once); it has to collide with all dysfunctional cells.
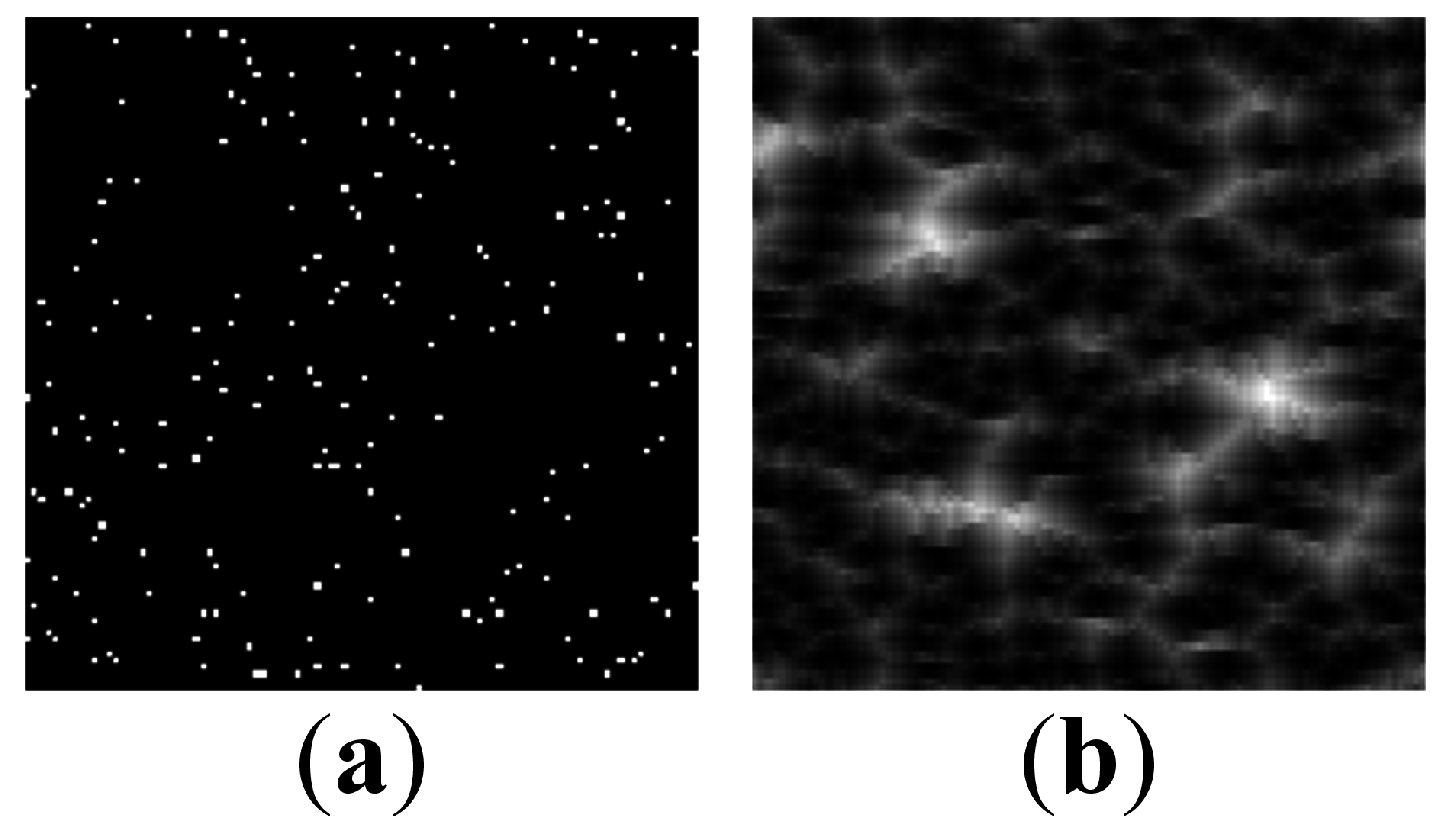
Let us consider an alternative computational setup where pacemaker cells are randomly distributed across 2D plane. Now, wave propagation continues to all directions and collide with each other. The benefit of such AF model implementation is that it requires less than
cells to be initially excited in order to form self-organized patterns (
Figure 3).
Figure 3.
Initial cell state conditions (a) and the resulting pattern after 20 iterations (b). Parameter ν is set to ; .
Figure 3.
Initial cell state conditions (a) and the resulting pattern after 20 iterations (b). Parameter ν is set to ; .
The computational efficiency of the numerical AF scheme can be enhanced even further by decreasing real pacing times τ of the cells. Optimal pacing time τ depends on the number of initially excited cells and the length of simulation. If τ is too small not all plane cells become excited, thus pattern is not fully formed. Otherwise, a too long refractory period results in relatively static pattern, because process cannot evaluate it is stuck in the same place.
4. A Communication Scheme Based on Self-Organizing Patterns
As mentioned previously, SOP can be successfully employed to transmit secret visual information between the communicating parties. A typical communication scenario is presented in a scheme that consists of the following steps.
Initially, Sender and Receiver must use an asymmetric (arbitrary) protocol in order to determine the initial value
and the number of time-forward iterations
n (parameters
ν,
τ,
δ,
,
must be predetermined beforehand).
Sender generates pseudo-random matrices of the initial cell excitation states and the connection map by using the Logistic map with the initial value ; the size of the matrix is set to ; the parameters of the AF model are ν and δ. Initial random matrix is dichotomous (cells contain binary values 0 or 1); connection between cells are random.
Sender modifies the pseudo-random matrix of initial cell excitation states by inverting pixels corresponding to the dot-skeleton representation of the secret image.
Sender executes n time-forward iterations starting from the modified matrix of initial conditions and sends the image of the self-organized pattern to the Receiver.
Receiver generates the identical copy of pseudo-random matrices of initial cell excitation states and the connection map by using the chaotic Logistic map with the initial value and parameters of the AF model (ν and δ); the size of the matrix is (this is an identical copy of the matrix generated by the Sender in Step 1).
Receiver executes n time-forward iterations starting from the non-modified initial conditions.
Finally, the difference between the digital images of the patterns produced by the non-modified and modified initial conditions reveals the secret.
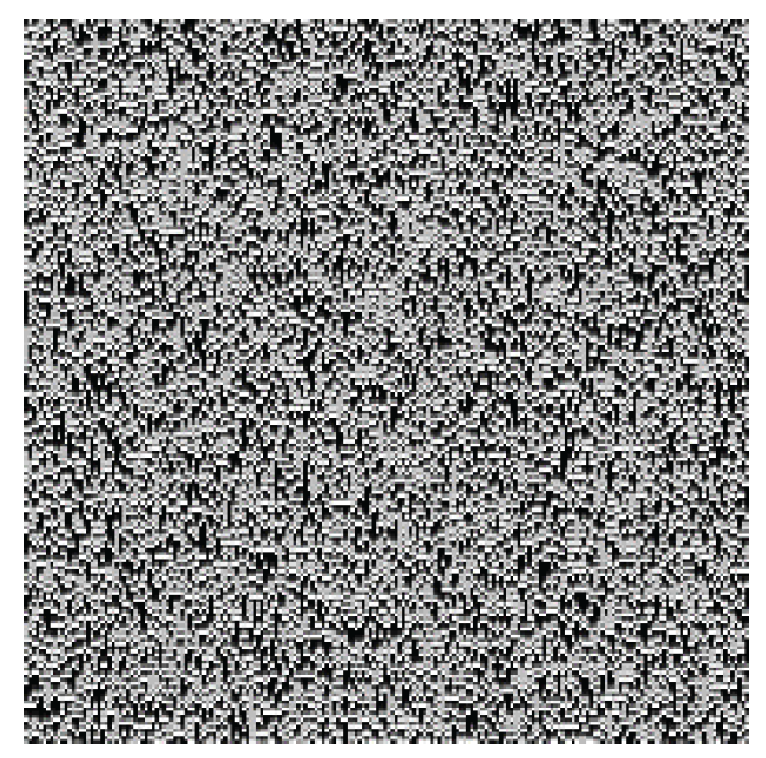
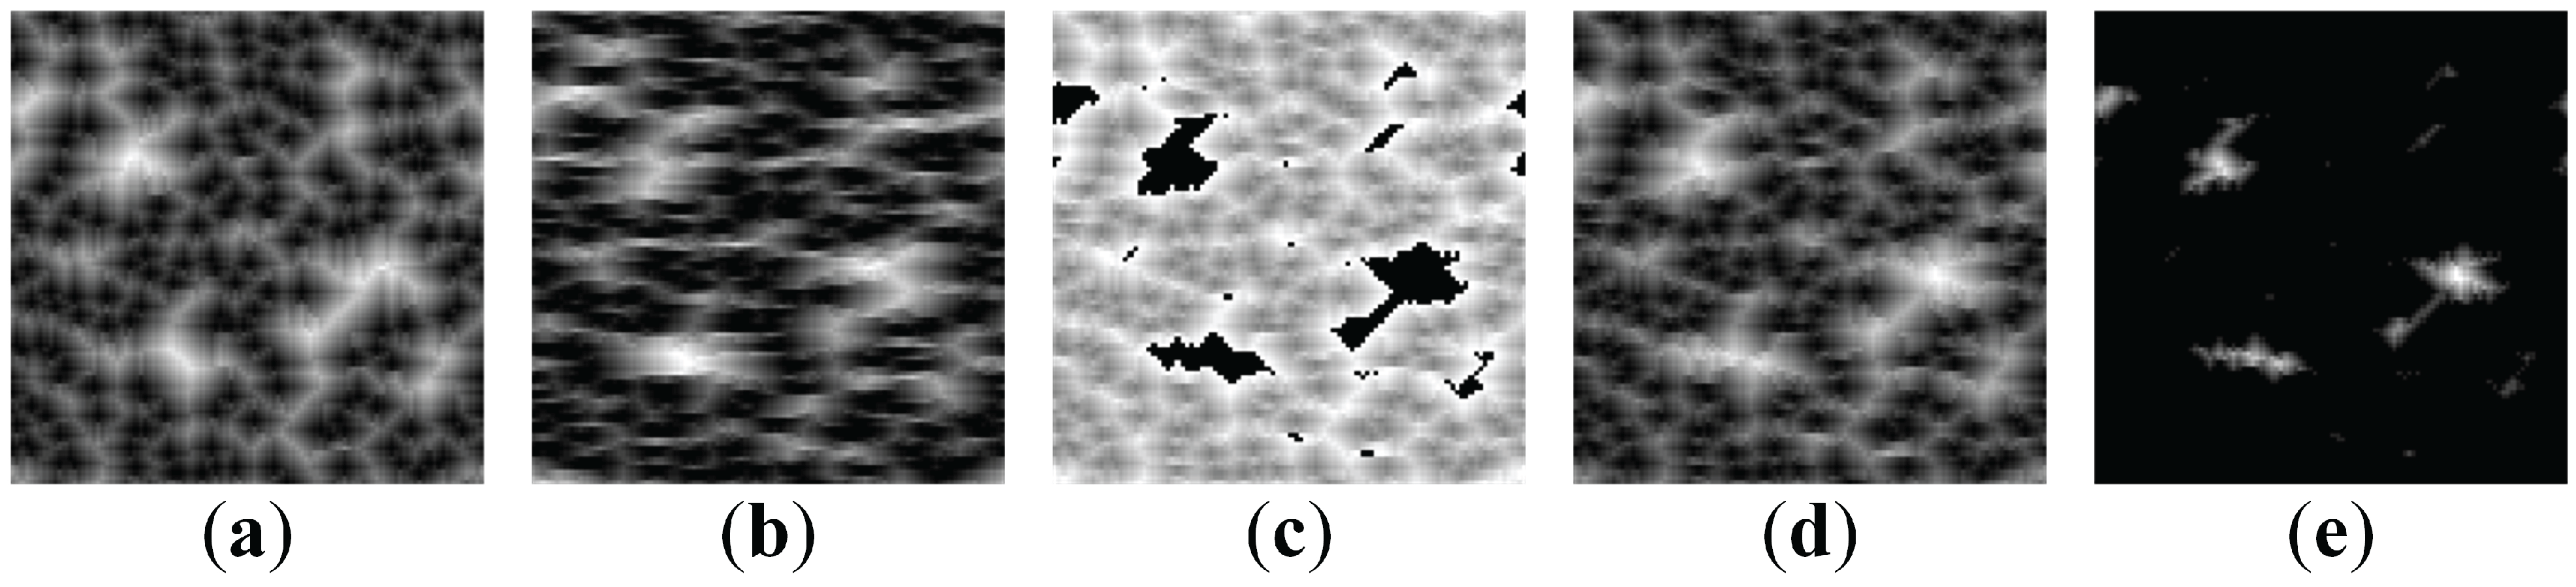
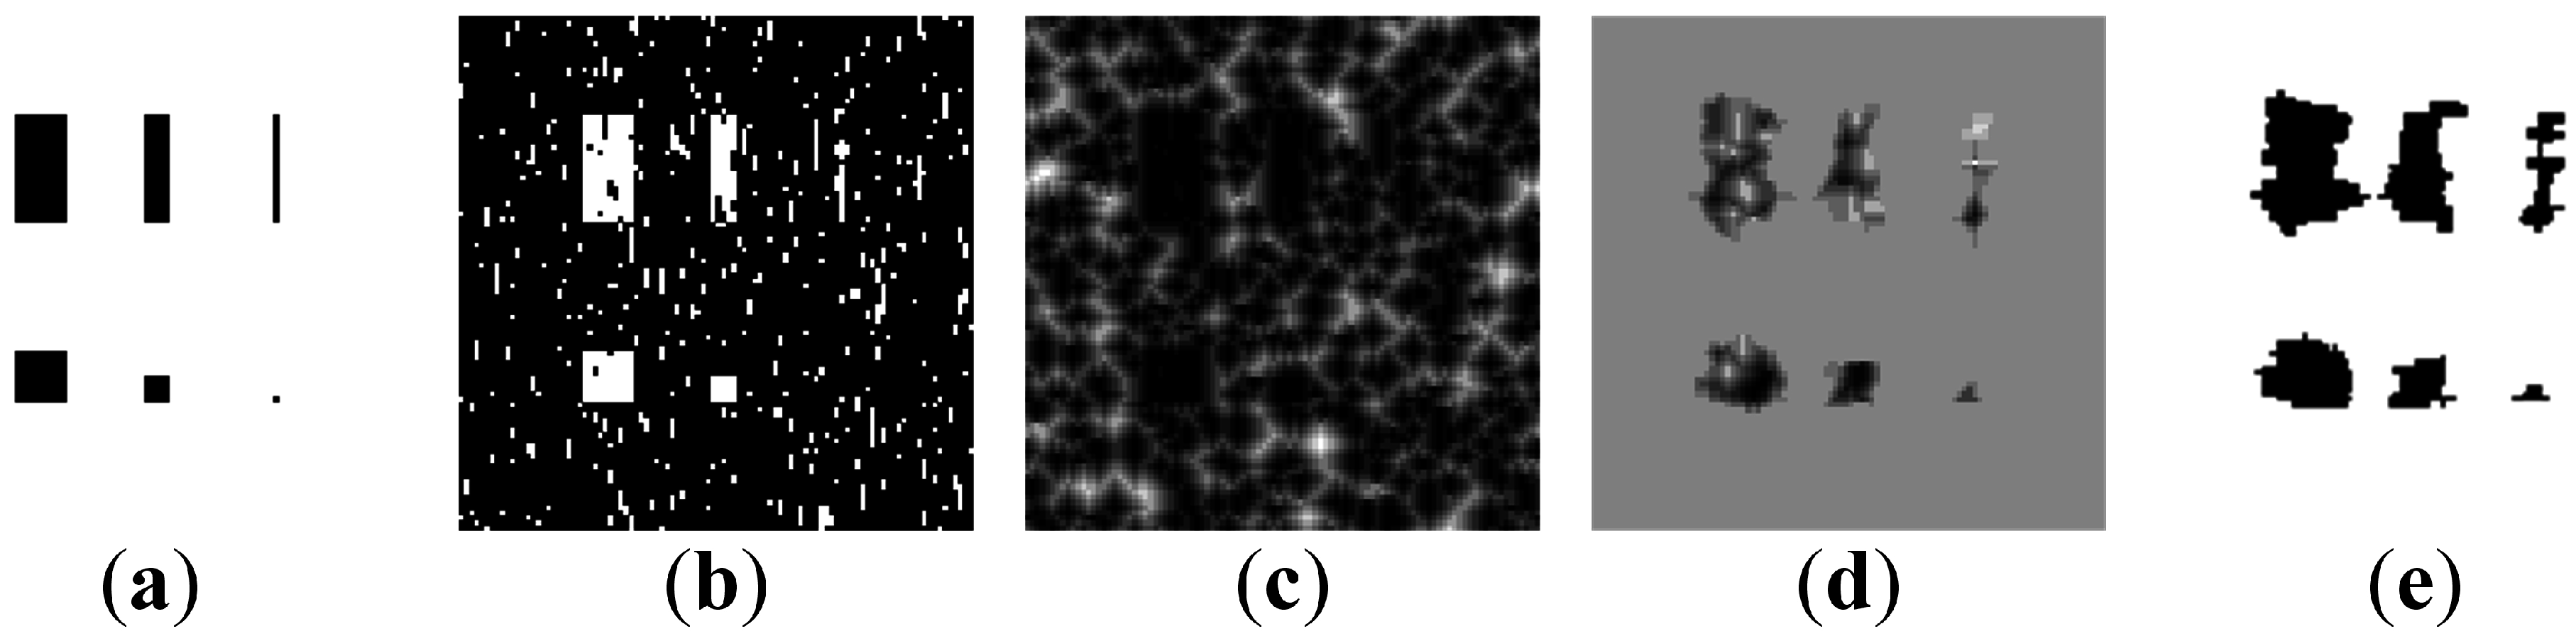
Unfortunately, straightforward inversion of pixel values in the areas occupied by the secret image (in the digital image of initial conditions) does not work well in general (
Figure 7). The “secret” image is shown in
Figure 7a; the digital image representing initial conditions (with inverted pixels in the zones occupied by the secret information)—in
Figure 7b. The self-organized pattern is illustrated in
Figure 7c. It is clear that such pattern is not safe—a naked eye can detect the contours of the secret original image. The difference image is shown in
Figure 7d; the binarized difference image—in
Figure 7e. Thus, the image hiding scheme proposed in [
4] cannot be used with the AF model. However, a single dot (
pixel) inversions in the initial conditions are not interpretable in self-organized patterns (
Figure 7)—thus the further image communication scheme is based on single pixel inversion strategy.
Figure 7.
Big clusters of initially excited cells result in interpretable self-organized patterns (, , ). (a) The secret image (b) Initially excited cells (shown in white) (c) The self-organized pattern (d) The difference image (e) The binarised initially excited cells.
Figure 7.
Big clusters of initially excited cells result in interpretable self-organized patterns (, , ). (a) The secret image (b) Initially excited cells (shown in white) (c) The self-organized pattern (d) The difference image (e) The binarised initially excited cells.
A huge difference in the shape of the “secret” images can be seen between
Figure 7a,e. It is clear that not all of the parameters considered in the SOP model (
,
ν,
δ) are equally applicable for the proposed communication scheme (even if an adequate formation of the self-organizing pattern is ensured). Firstly, the initial random background used for initial excitation should be close to uniform (or homogeneous) in order to avoid empty spaces and larger initial cell clusters. Secondly,
δ directly affects clearness of the resulting image (
Figure 7c) as well as an easier interpretation of the difference image (
Figure 7d). Meanwhile, probability
ν does not have a big effect except stretching—however it is recommended to keep it in the range
and not use the trivial cases (0 or 1).
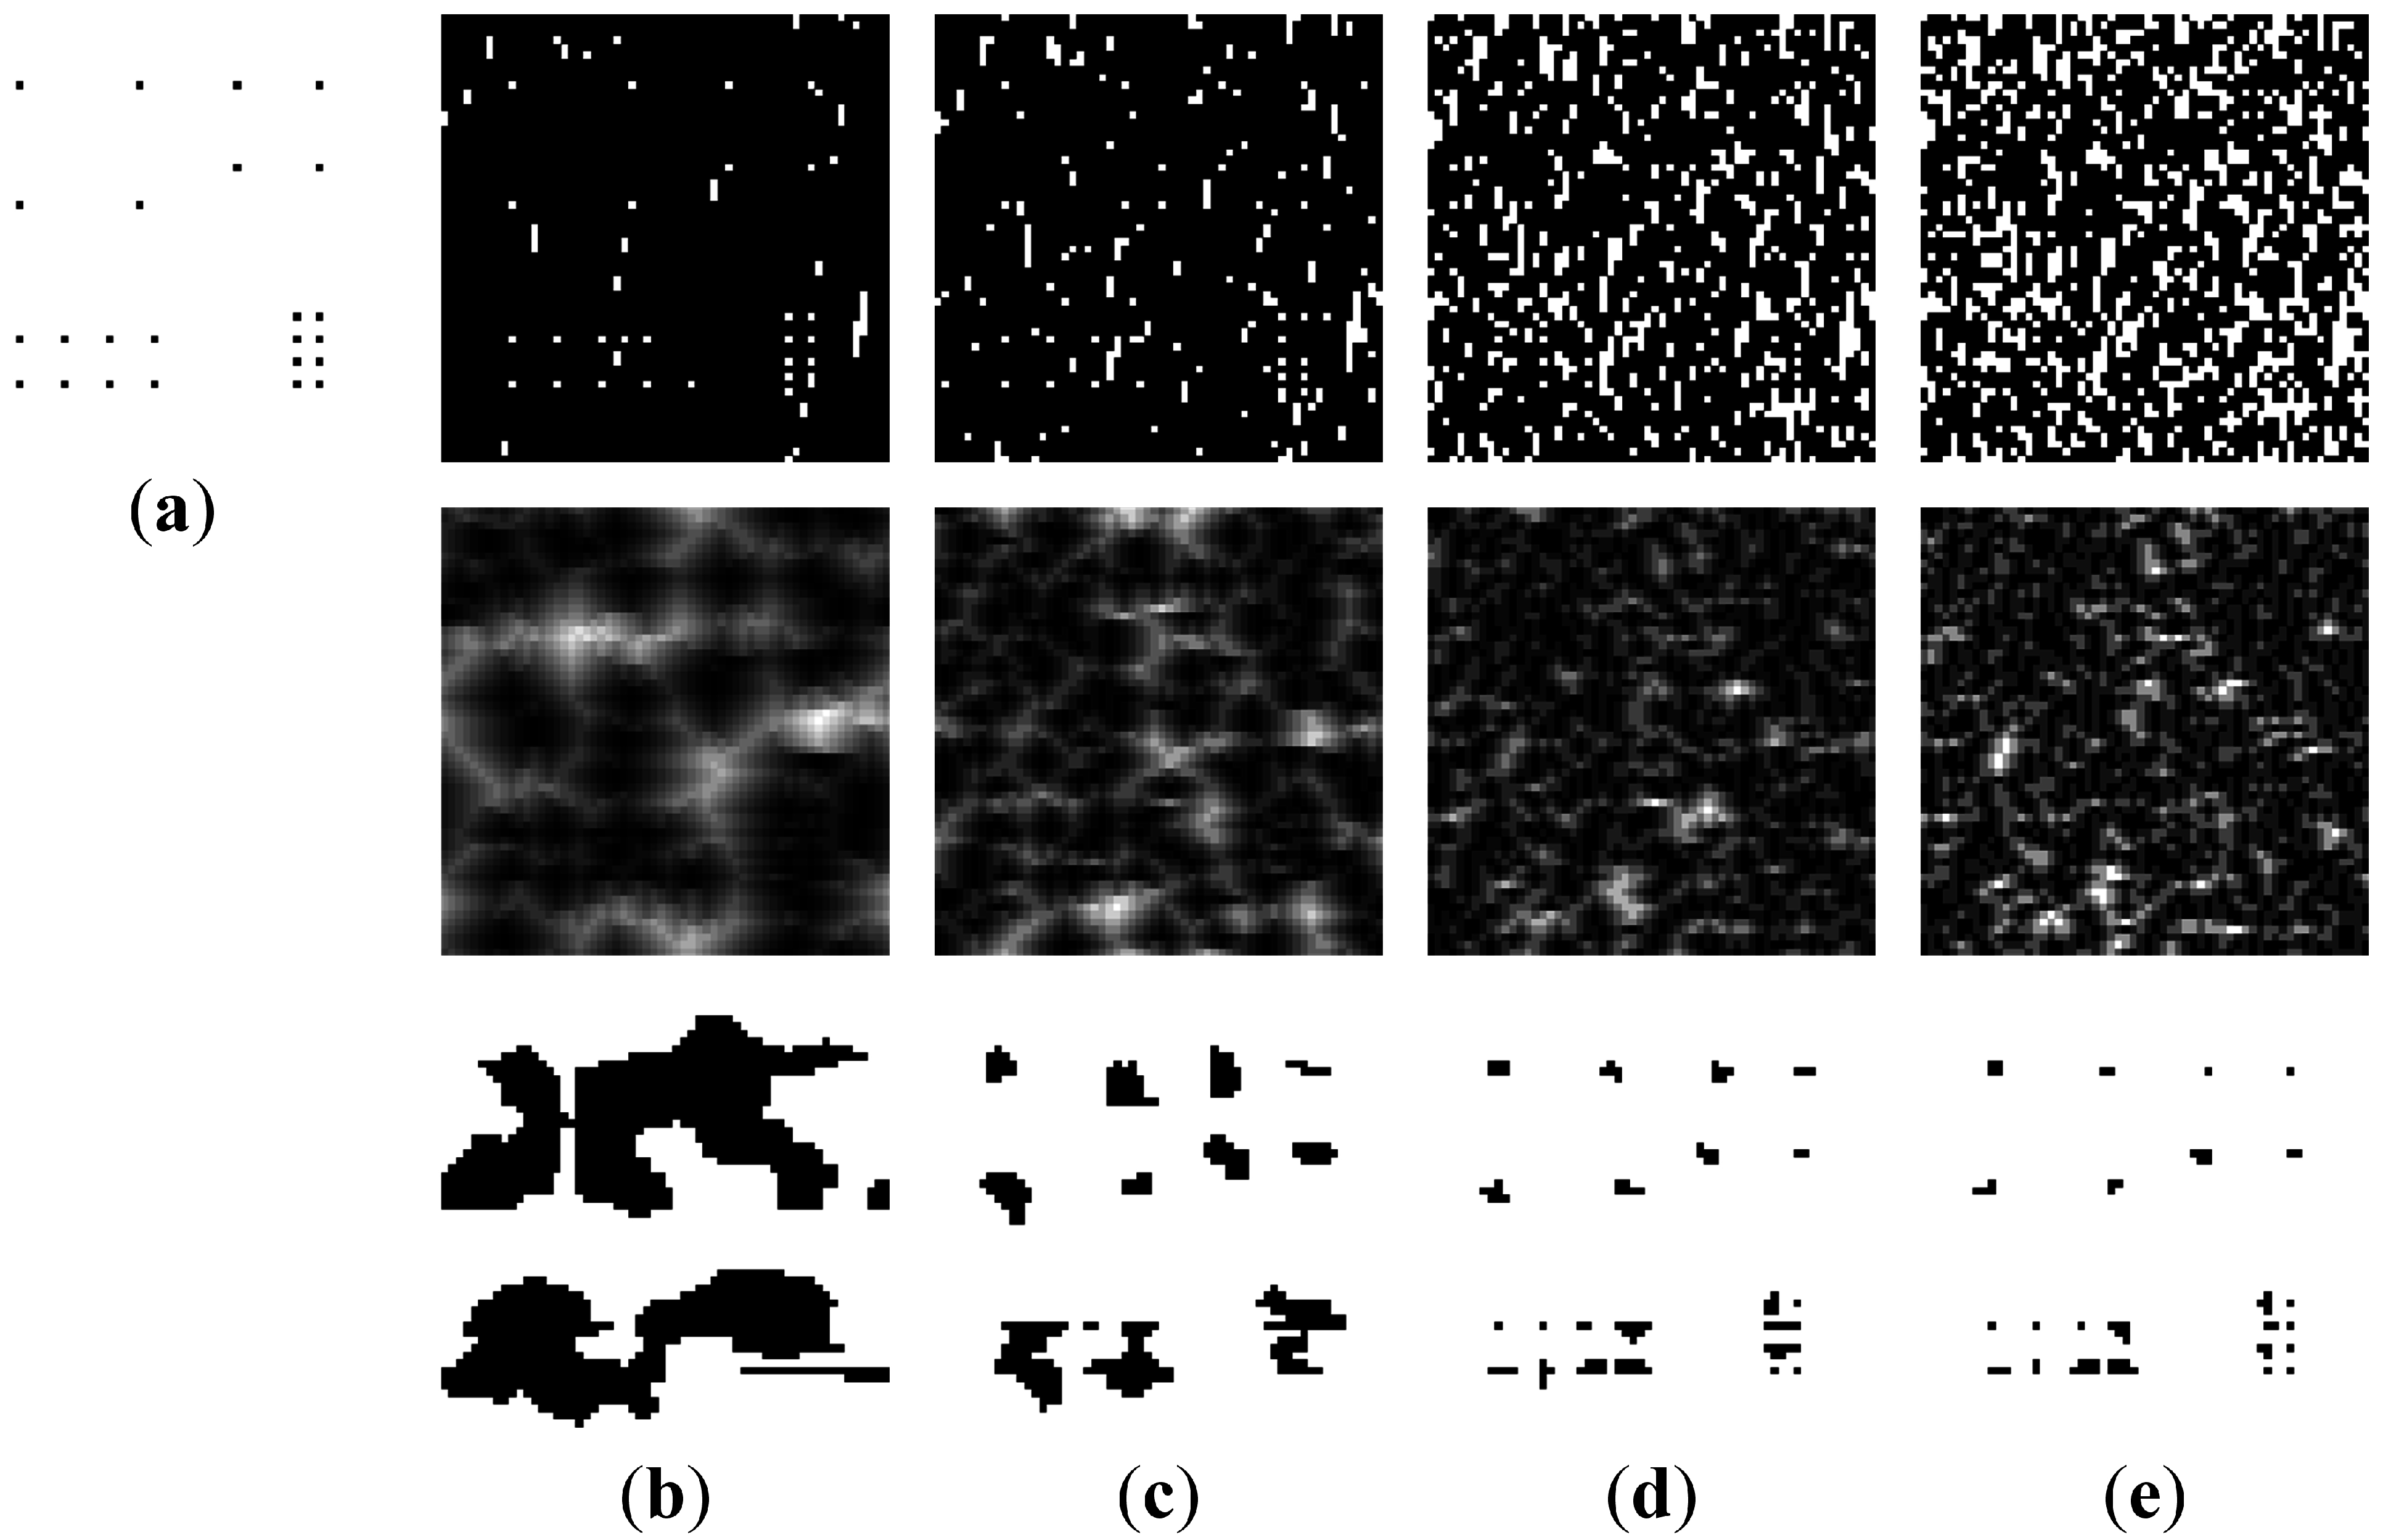
Let us consider four groups of a regular array dots (
Figure 8a). Dots in four groups are respectively 15, 10, 5, 3 pixels away from each.
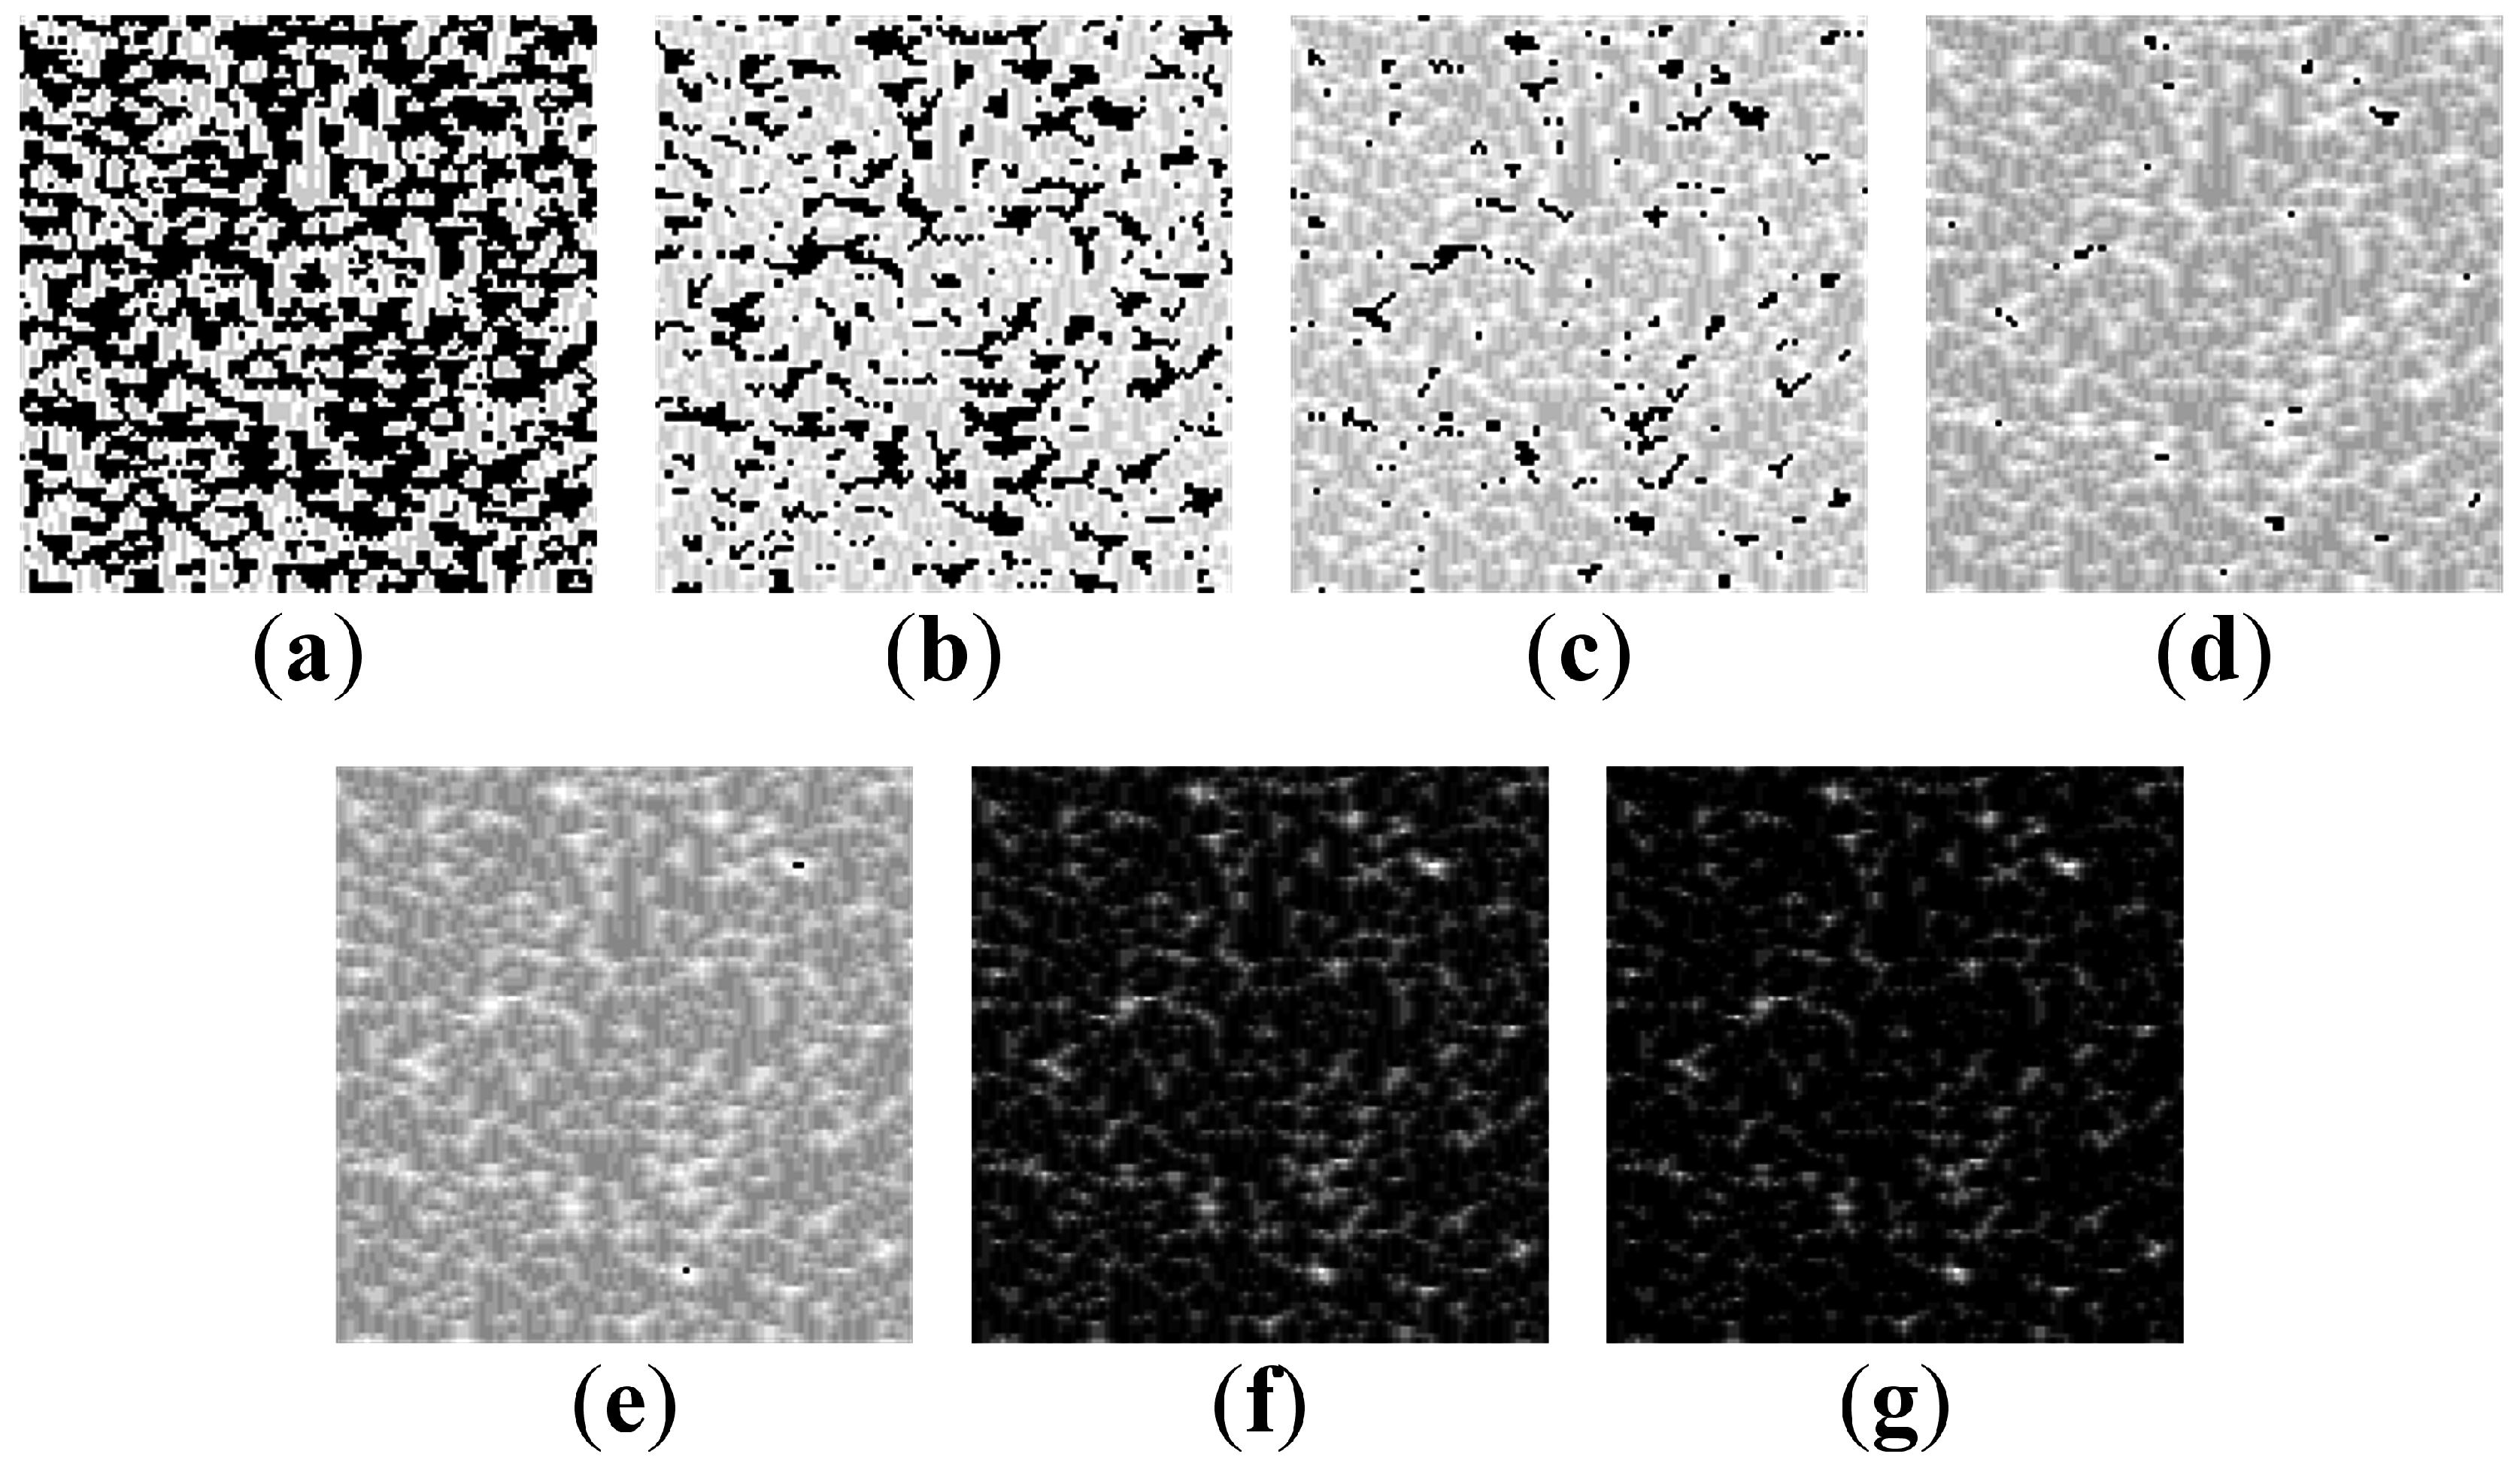
Figure 8 illustrates difference images at different values of parameter
δ. It can be seen that depending on the cell probability to be excited (parameter
δ) the required minimum distance from dots (in the secret image) varies. Better information visibility of the decoded image is ensured by higher values of
δ. However, denser initially exited cells lead to less resting cells—and this results in a less number of iterations required for a fully developed pattern. On the other hand, a smaller number of iterations results into smaller changes in the initial image.
Figure 8.
The initial dot-skeleton image (a) and SOP at different δ: the first row represents initial conditions; the second row—patterns; the third row—difference images. (a) (b) (c) (d) .
Figure 8.
The initial dot-skeleton image (a) and SOP at different δ: the first row represents initial conditions; the second row—patterns; the third row—difference images. (a) (b) (c) (d) .
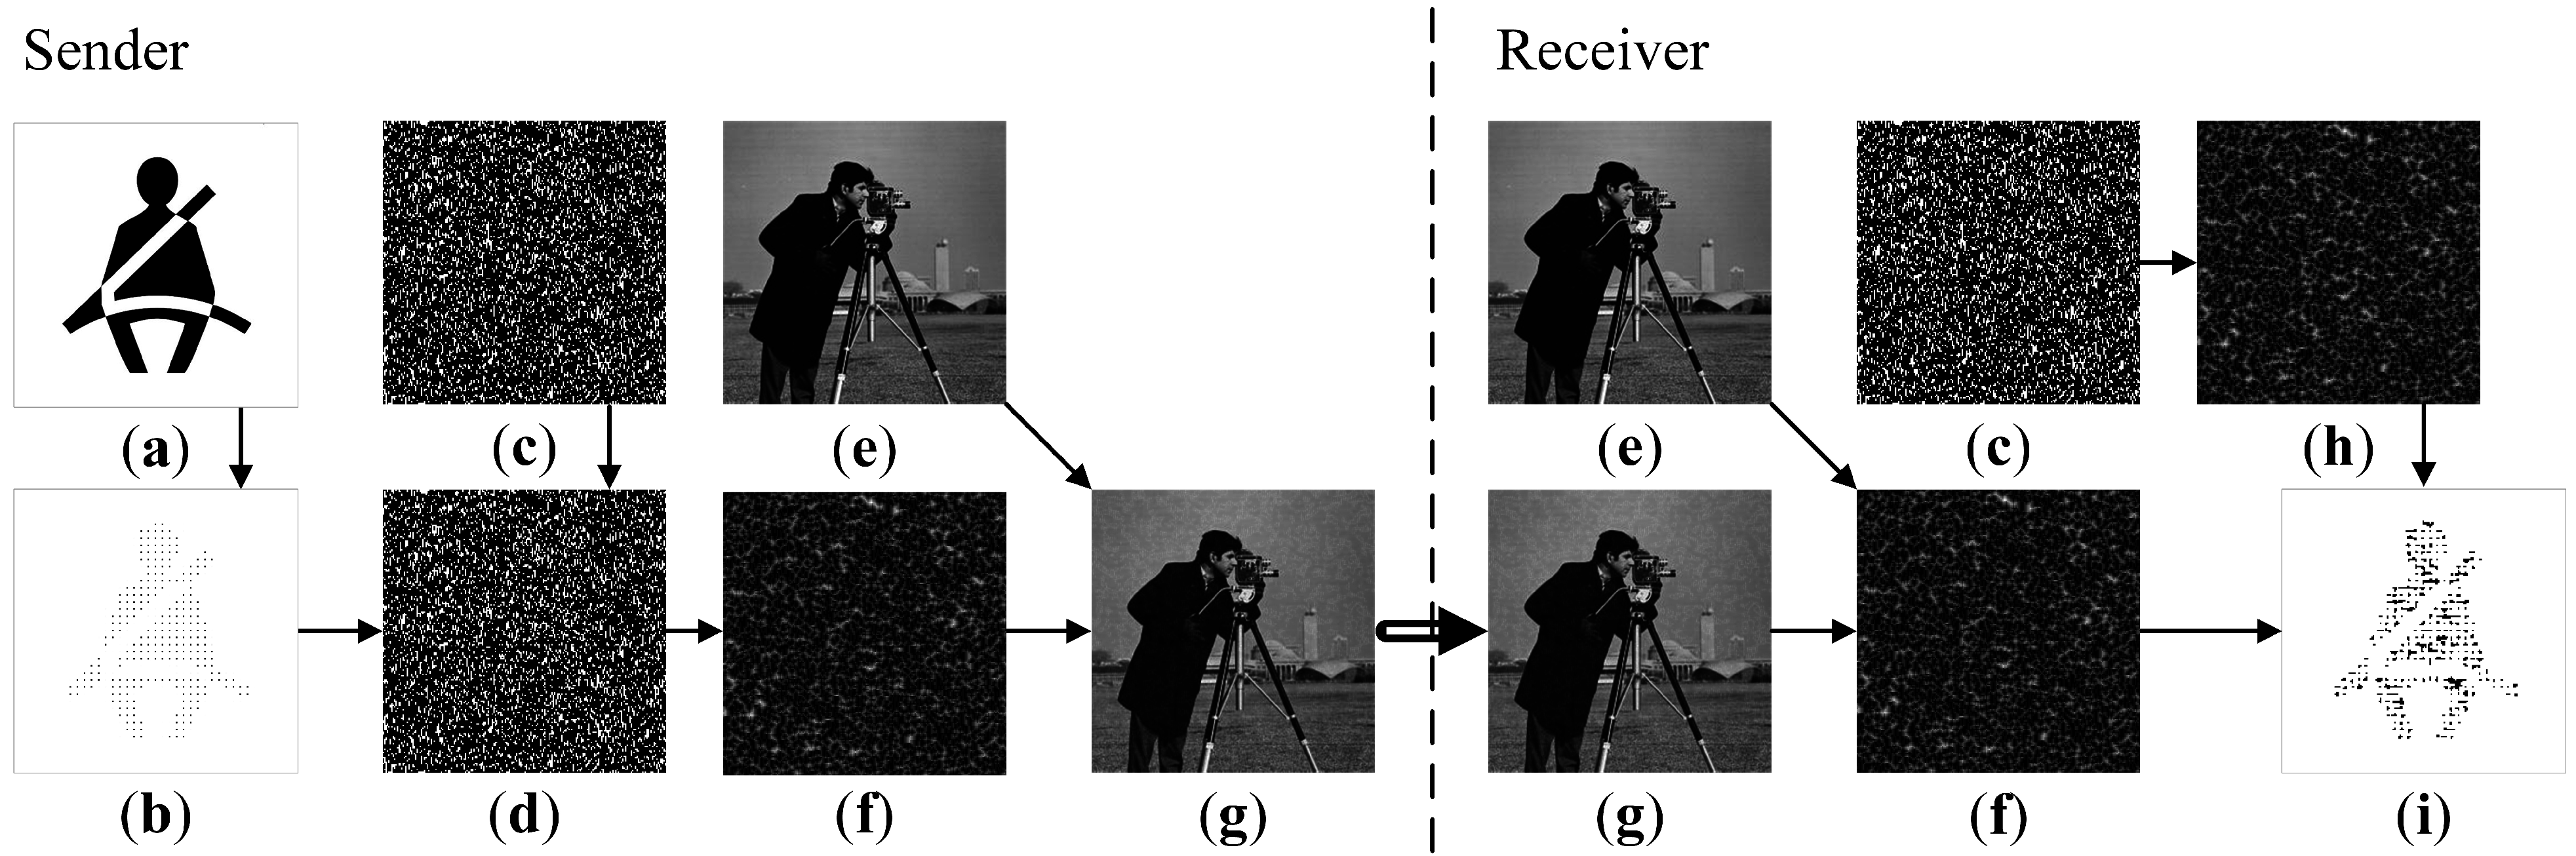
The secret visual communication scheme based on SOP in the AF model can be illustrated in
Figure 9 (
,
,
). Before the transmission takes place, the original secret image is transformed into a dot-skeleton equivalent. The system parameters
ν,
τ,
δ,
,
must be predetermined beforehand. Finally the pseudo-random number seed
and the number of iterations
n is transmitted by using the secure communications channels.
The original secret image is shown in
Figure 9a. Its dot-skeleton equivalent is illustrated in
Figure 9b. Using the parameter
(as well as the parameter
δ) the Sender generates the initially excited cells (
Figure 9c). The initial states of cells are inverted accordingly to the dot-skeleton representation (
Figure 9d). The resulting self-organizing pattern is shown in
Figure 9f. This pattern can be placed on top of a standard cover image (
Figure 9e) by using the least significant bit (LSB) steganographic technique [
16]. This is a standard spatial domain steganographic technique which manipulates LSB of pixels to embed the secret information into the cover image. The final cover image ready to be sent over to the Receiver via an open communication channel is shown in
Figure 9g.
The Received obtains the cover image (
Figure 9g) and reproduces the pattern (
Figure 9f) by using a clean copy of the cover image (
Figure 9e).
The remaining procedure for the Receiver is to simply re-generate the initial array of pseudo-randomly excited cells (as shown in
Figure 9c) and to generate the pattern (the parameters of the AF model are privately known in advance)—the alternative pattern is illustrated in
Figure 9h. Finally, the difference image between the two (
Figure 9f,h) reveals the secret message as shown in
Figure 9i.
Figure 9.
The flow chart diagram of the communication algorithm. Original image (a); dot-skeleton representation (b); initial conditions (c); perturbed initial conditions (d); cover image (e); perturbed self-organizing pattern (f); perturbed cover image (g); self-organizing pattern (h); difference image (i).
5. The Sensitivity of the Communication Scheme to Perturbations of System Parameters
The proposed communication scheme does work well with preselected set of system parameters. Slight changes in parameter values (when the Sender and the Receiver use different parameters) would compromise the communication system.
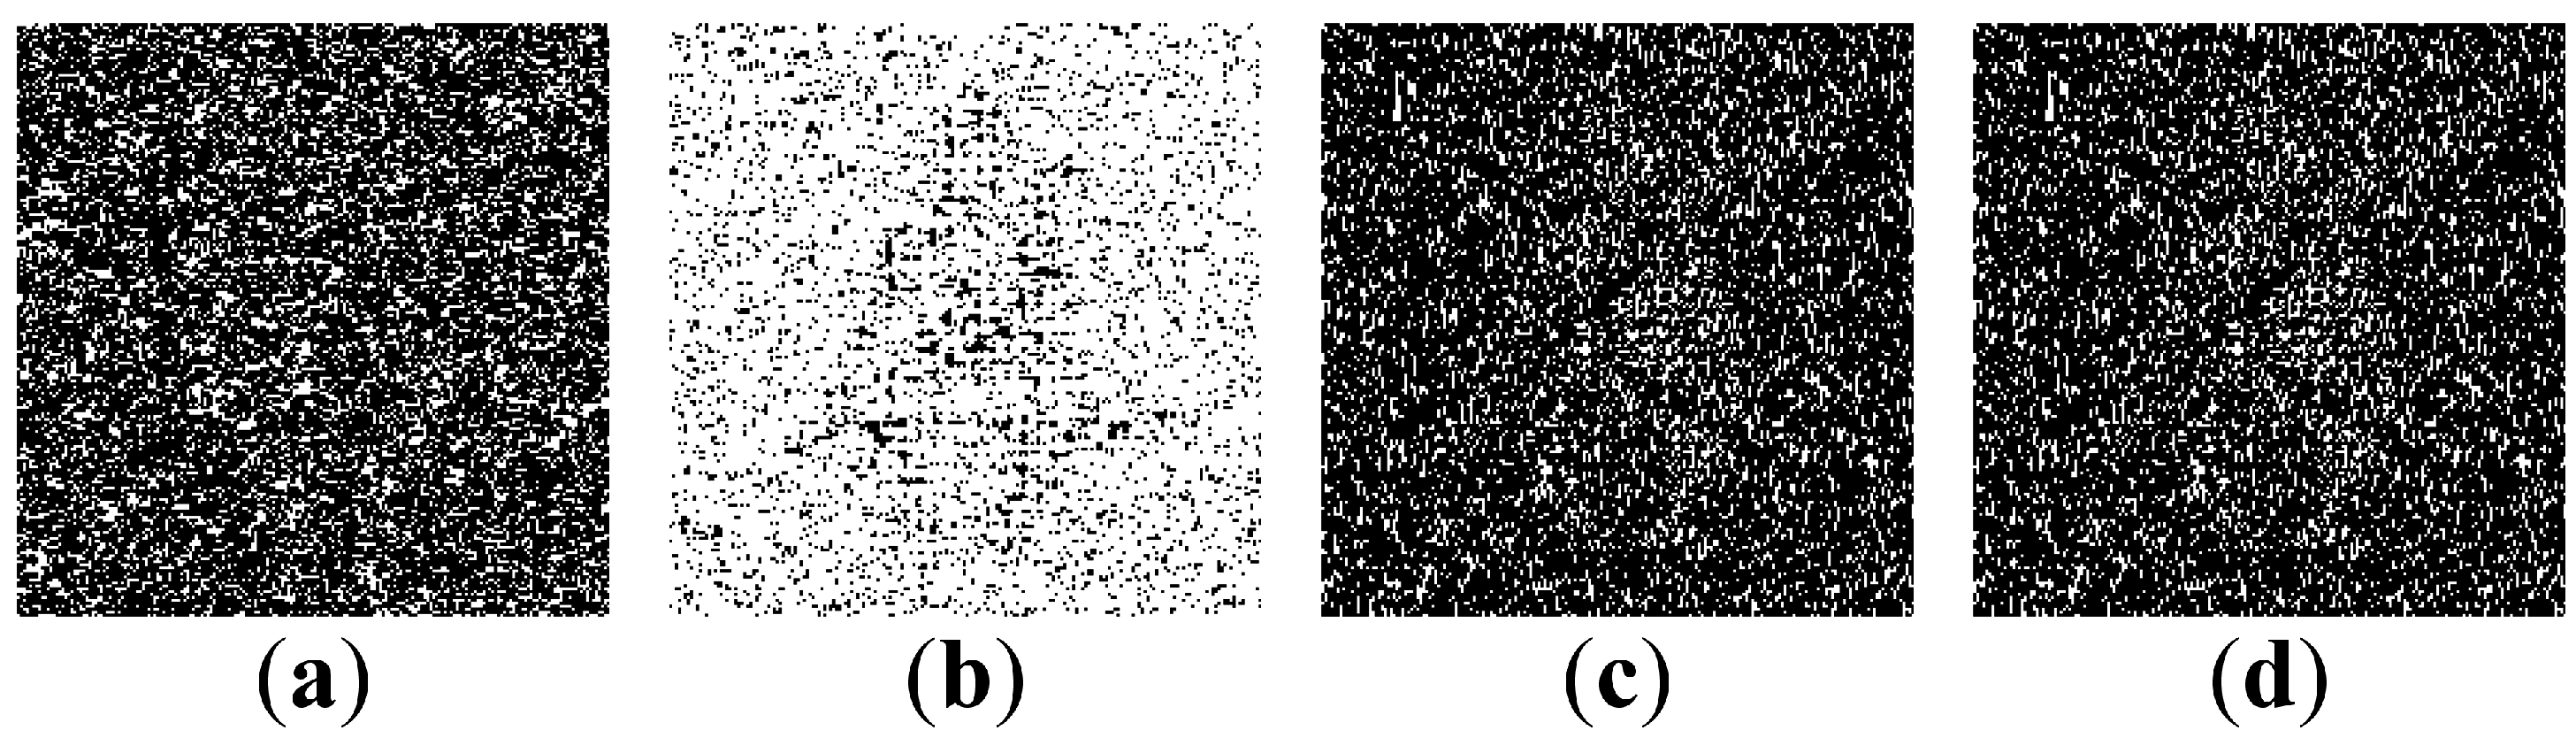
Figure 10 illustrates the sensitivity of the communication system to perturbations; all illustrations represent difference images in the enhanced contrast mode. We set initial parameters to:
,
,
,
,
,
, where
—initial value of chaotic logistic map used to select initially excited cells, and
—for transversal connection map.
Figure 10.
The sensitivity of the communication scheme to the perturbation of system’s parameters. The difference images are shown when: (a) is used instead of ; (b) is used instead of ; (c) is used instead of 20; (d) is used instead of 20.
Figure 10.
The sensitivity of the communication scheme to the perturbation of system’s parameters. The difference images are shown when: (a) is used instead of ; (b) is used instead of ; (c) is used instead of 20; (d) is used instead of 20.
The Sender uses all system’s parameters as preset in the computational experiment illustrated in
Figure 9—but the Receiver uses
instead of
(
Figure 10a). The chaotic Logistic map is sensitive to small perturbations—thus it is natural to expect that the evolving patterns from different initial conditions would result into a different SOP image. Correct initial cell excitation map is essential in order to show the embedded secret (
Figure 9a). However, AF model construction allows some perturbations in connection map (
Figure 10b), thus different map does not completely brake the results and visual interpretation of the embedded secret is still possible.
Perturbations can be introduced in the number of iterations
n and cell’s refractory period
τ. It can be noted that differences are only visible when
. Otherwise the model does not reach the breaking point when cells finish their relaxation period. As it can be seen in
Figure 10c,d, changes by one time-step does hide most of the embedded image, but if the change is higher, the difference image does not reveal any secret.
6. Concluding Remarks
An image hiding scheme based on the atrial fibrillation model is presented in this paper. It appears that complex rules of self-organization and wave propagation in anisotropic AF media help to overcome such drawbacks of digital image communication schemes as long transients, relatively large primitives, the relative simplicity of the cover pattern. The secret image can be embedded into the spatially homogeneous dichotomous initial state by inverting the dot-skeleton representation of the secret, thus enabling an efficient and secure communication scheme based on SOP.
The SOP communication scheme can be used without LSB steganography. However, a transmitted SOP image may draw attention from eavesdroppers. LSB steganography could eliminate this threat. However, LSB steganography alone is prone to steganalysis algorithms. The SOP communication scheme ensures the security of the secret image even if LSB steganography would be compromised. Thus, the synergy of the SOP communication scheme and LSB steganography offers the added security to the transmitted image.
However, one should keep in mind that the presented AF model is a rough approximation of complex biological processes taking place in the tissue of the heart. Complex distribution of cardiac action potentials, spiral waves, arrhythmias, sinoatrial nodes and many other phenomena taking place in the heart cannot be modeled using this AF model. Therefore, the extension of the presented communication scheme by introducing more complex interactions between cells is a natural objective of future research.


