Abstract
This paper proposes an optimal control scheme based on a synchronized phasor (synchrophasor) for power system secondary voltage control. The framework covers voltage stability monitoring and control. Specifically, a voltage stability margin estimation algorithm is developed and built in the newly designed adaptive secondary voltage control (ASVC) method to achieve more reliable and efficient voltage regulation in power systems. This new approach is applied to improve voltage profile across the entire power grid by an optimized plan for VAR (reactive power) sources allocation; therefore, voltage stability margin of a power system can be increased to reduce the risk of voltage collapse. An extensive simulation study on the IEEE 30-bus test system is carried out to demonstrate the feasibility and effectiveness of the proposed scheme.
1. Introduction
Voltage instability has been regarded as one of the primary threats to the security of modern power network operation during the past few decades. Power system disturbances such as a continuous load increase and/or a major change in network topology can result in voltage collapse. The voltage collapse problem, which is characterized by the loss of voltage magnitude at certain locations of the power grid, has caused several severe blackout events worldwide [1,2].
A number of planning and operation technologies have been proposed to mitigate the risk of voltage collapse [3]. Among these technologies, phasor measurement unit (PMU) based schemes to secure power systems have become one of the enabling techniques which are under active investigations. Indeed, the use of PMUs in modern power systems becomes popular [4,5].
In order to provide a better voltage support in transmission networks, the coordinated voltage control has been developed. It is organized as a hierarchical structure with three levels: the primary, secondary, and tertiary voltage control. Significant attention has been given to the study of the secondary level, which is an automatic regulation of voltage and reactive power for power systems [6,7,8,9,10,11,12,13,14,15,16,17,18,19]. The task of the secondary voltage control (SVC) is to regulate system voltage profile and to protect against potential voltage instability scenario at an early stage. The conventional approaches use only the voltage information at the observed buses (the so-called pilot nodes) as a triggering signal, but just monitoring voltage magnitudes alone may give the wrong indication in static voltage stability study [20]. In other words, voltage stability issues cannot be fully prevented by the traditional SVC methods; therefore, an additional accepted measure of static voltage stability is required for a more reliable SVC scheme.
The voltage stability margin (VSM), which is defined to be the distance between the given operating point and the voltage-collapse point, can serve as the static voltage stability indicator. A wide variety of approaches have been proposed for static VSM evaluation [21,22,23,24,25,26], wherein the measurement-based methods [25,26] address such problem by using the impedance-matching concept, i.e., at the maximum loading condition, load impedance is equal to Thevenin equivalent impedance in magnitude. Due to the elegance and simplicity of the measurement-based method, it becomes an attractive alternative in static voltage stability monitoring. In this paper, a VSM index computed from synchrophasor data is utilized.
This paper is concerned with designing an optimal voltage control scheme using synchrophasor measurements. In the proposed technique, the voltage magnitude and static voltage stability margin are considered as two key criteria for activating the proposed control strategy; therefore, a more efficient secondary voltage control can be accomplished. The rest of the paper is organized as follows: In Section 2, the proposed scheme based on the PMU technique is presented. Section 3 describes the fundamental theories and mathematical principles of the proposed scheme. Numerical simulations and test results are given and discussed in Section 4. Section 5 concludes the paper.
2. Overview of the Proposed Scheme
The overall architecture of the proposed scheme is shown in Figure 1. The functions and principles of the scheme are briefly described in this section.
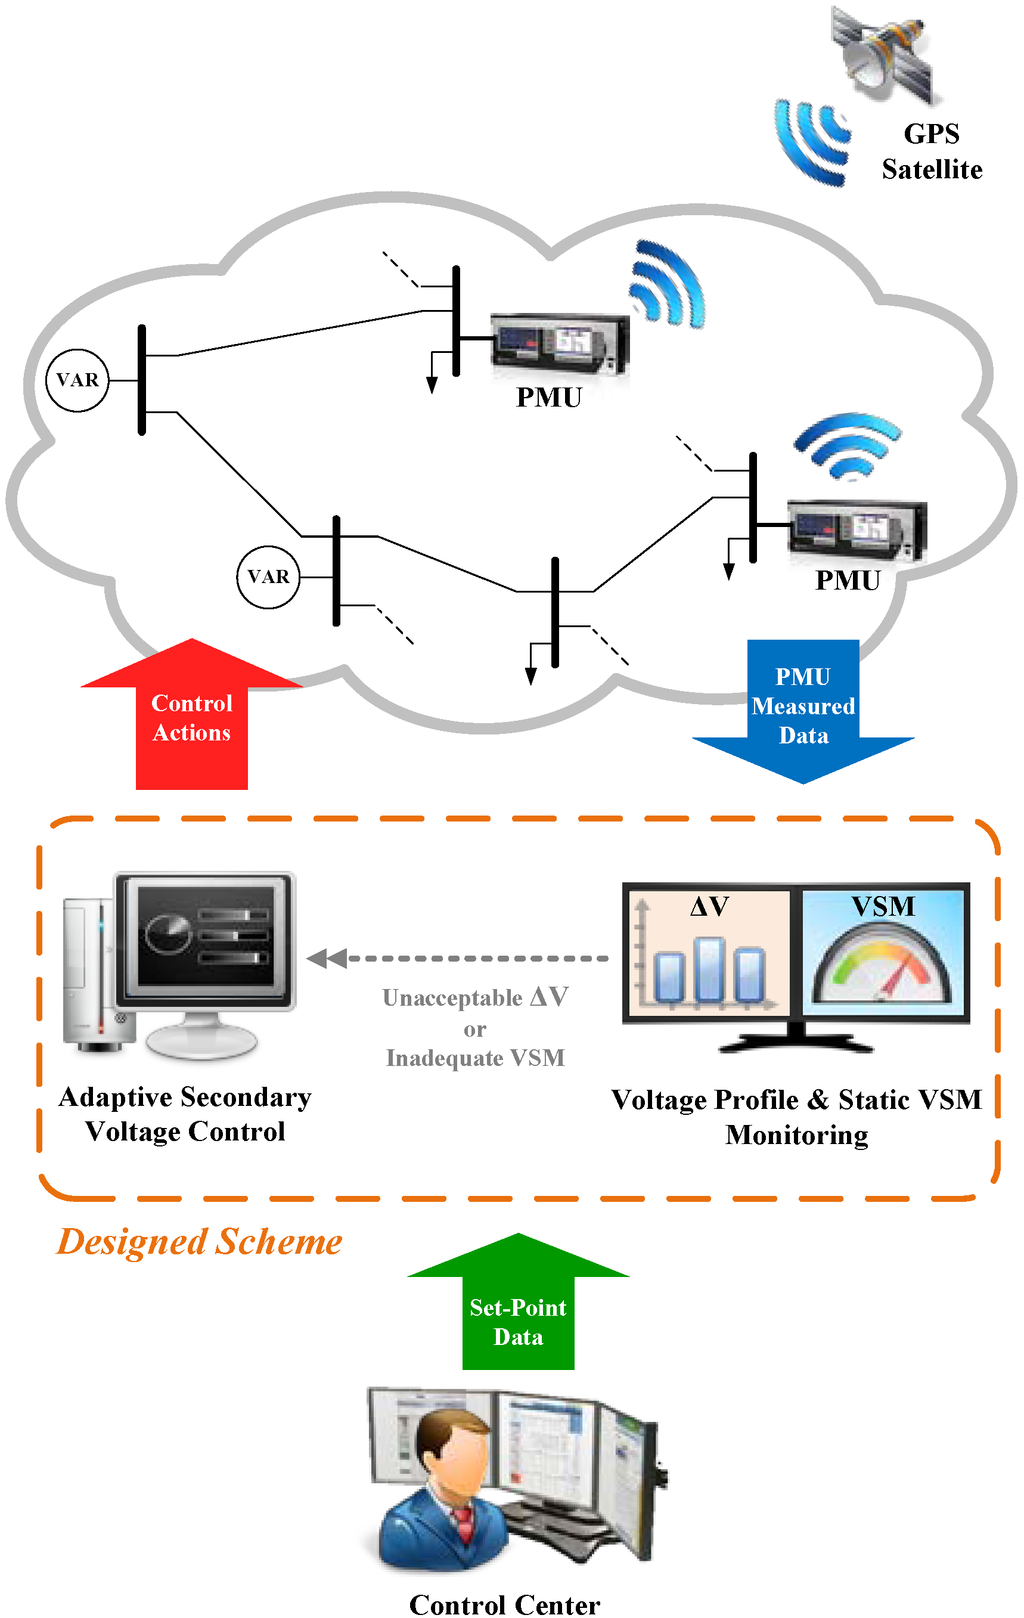
Figure 1.
Schematic view of the proposed scheme.
The designed scheme is illustrated with the part enclosed by the dashed line shown in Figure 1. Indeed, it consists of two primary functions: (i) voltage profile and static VSM monitoring function, which monitors not only voltage magnitudes but static VSM as well using synchrophasor data from PMUs; and (ii) adaptive secondary voltage control (ASVC) function which provides appropriate control actions to the controllers. The proposed scheme aims to regulate voltage profiles and to enlarge static voltage stability margin by means of a proper adjustment of VAR sources when the power grid has poor voltage profile and/or shows the risk to voltage collapse.
The flowchart of the proposed scheme is illustrated in Figure 2 and is described in the following:
Step 1: In this study, we assume that PMUs are installed at the selected pilot buses. Using the precise timing signal provided by GPS as the common time base for PMUs, both magnitude and phase angle of voltage and current signals at different PMU locations can be measured, at exactly the same time instant from all observable system buses. Once the PMU measurements with time tags are entered into the designed scheme, these coherent and real-time measured quantities are then used to process the tasks of the proposed scheme.
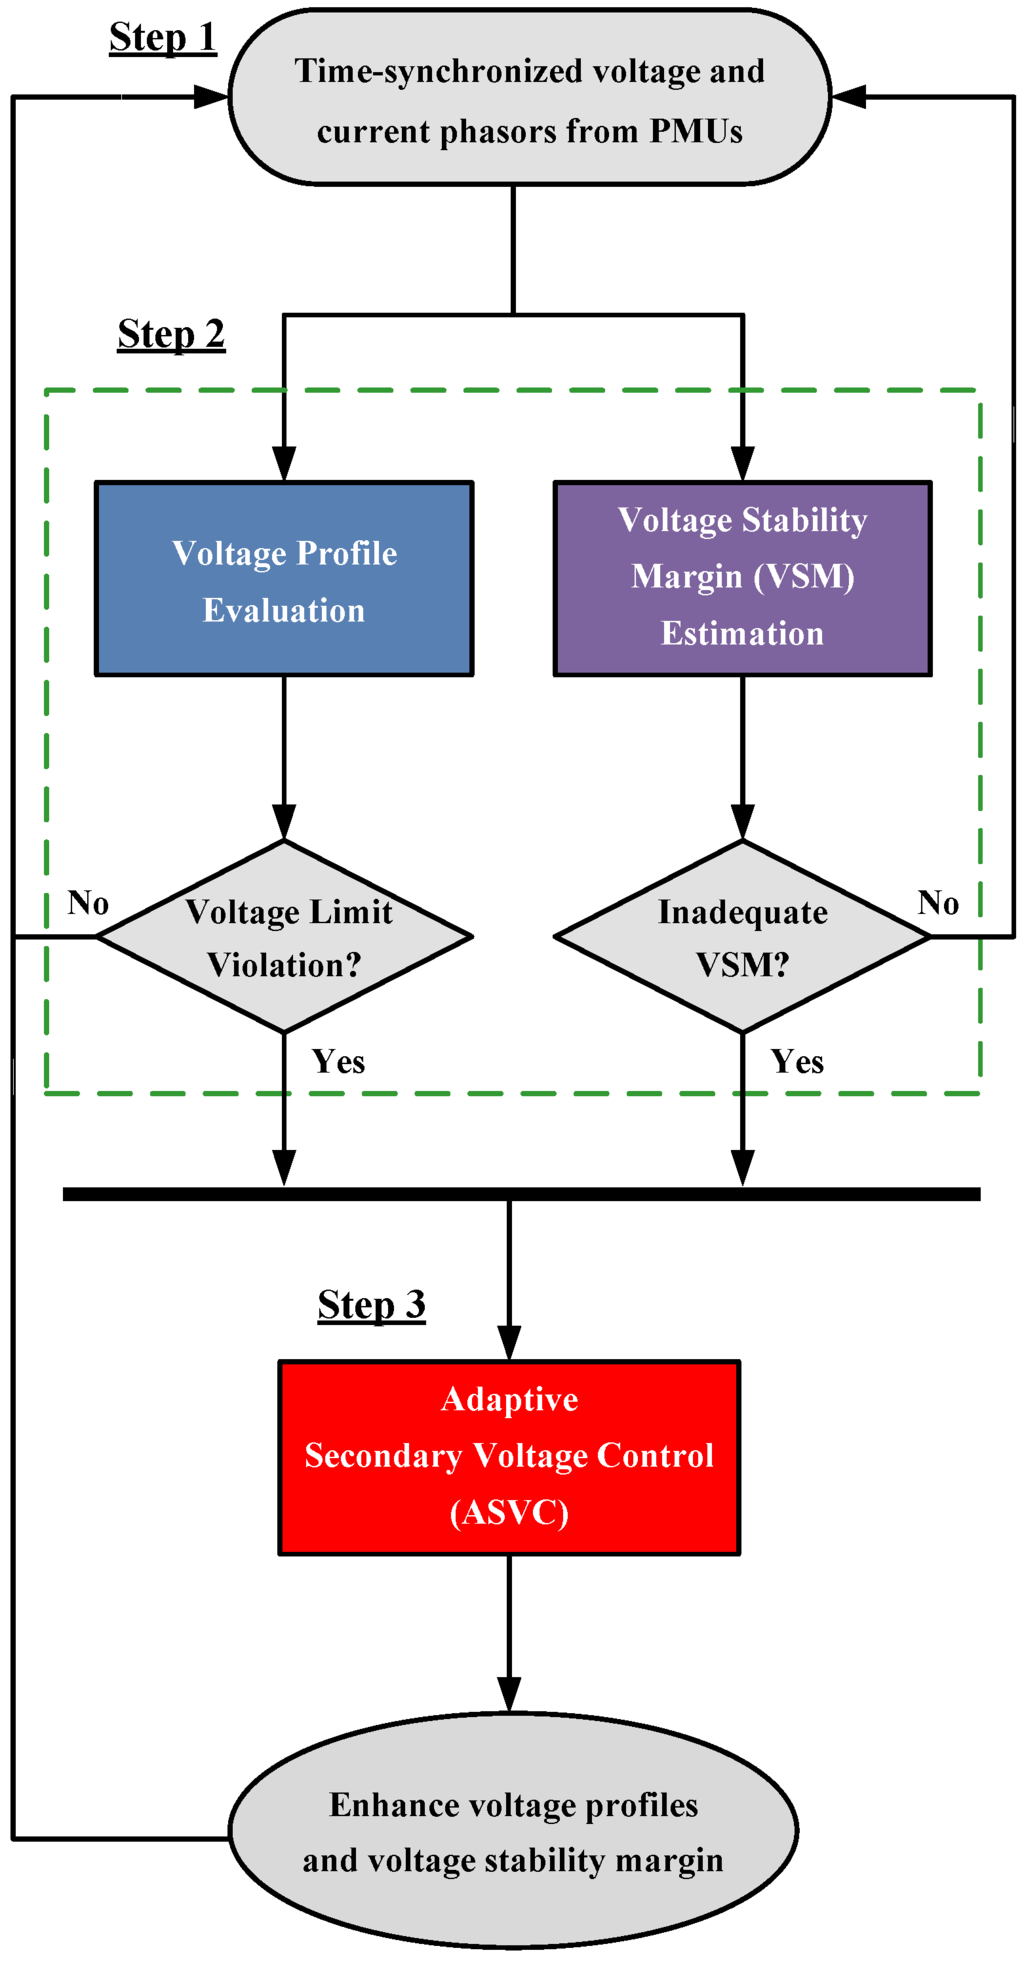
Figure 2.
Flowchart of the proposed scheme.
Step 2: At this stage, the proposed scheme performs voltage profile evaluation and static voltage stability margin estimation simultaneously.
- (1)
- The voltage magnitudes, which are extracted from the PMUs in step 1, are used to evaluate the voltage magnitudes of the monitored buses. As long as the measured voltages are not within the specified limit, voltage violation is confirmed. Then, the scheme will issue a trigger signal to the ASVC function. Otherwise, the scheme will go back to Step 1.
- (2)
- As mentioned before, depending on bus voltages for the activation of control actions is not a very reliable strategy to be adopted. Another important index, which measures the proximity of an operating point to voltage instability, is the voltage stability margin (VSM). Therefore, the scheme needs to further check to see whether the current power system state is operated within a sufficient safety margin or not. If the computed value VSM is less than the predetermined security margin, inadequate VSM is identified. This will initiate the ASVC action accordingly.
Step 3: When critical voltage level or inadequate VSM is detected, the ASVC method will be activated automatically. The proposed control strategy can provide appropriate control actions to improve voltage profiles as well as voltage stability margin of the power system. That is, the proposed scheme is capable of preventing the system from possible voltage collapse.
The following section shows the detailed principles and methods used in the proposed scheme.
3. Principles of the Scheme
The proposed scheme is intended to automatically improve power system voltage profiles and static voltage stability margin simultaneously. The basic principles of the scheme will be derived in the following subsections.
3.1. Adaptive Secondary Voltage Control (ASVC) Function
First, consider that the approximate model of the small disturbance voltage-var control is represented by
where and are the reactive power and voltage magnitude change vectors; B stands for the system susceptance matrix; and the subscripts L and G denote the load and the voltage-controlled buses, respectively. In the above matrix equation, load voltage changes can be expressed as
where
Notice that q and u are considered as reactive power load disturbances and control variables, respectively.
In this study, the feedback control law is used to develop the secondary voltage controller. The control vector is determined by using the worst-case design, the technique which addresses the problem by applying the minimization of the maximum load voltage deviation as an objective function for the optimal control model. Mathematically, the problem is to search an optimal set of control solutions such that the norm of load voltage changes is minimized.
Suppose that PMUs are placed at the chosen pilot nodes; the voltage deviations at the observed buses can be elaborated by
where and denote the pilot-node set-point voltages determined by tertiary level and pilot-node measured voltages obtained from installed PMUs, respectively. In the proposed secondary voltage control, both voltage profile and static voltage stability margin are adopted to serve as trigger signals, as shown in Figure 3. It utilizes pilot-bus voltage changes as input signals, and generates control actions u as output signals.
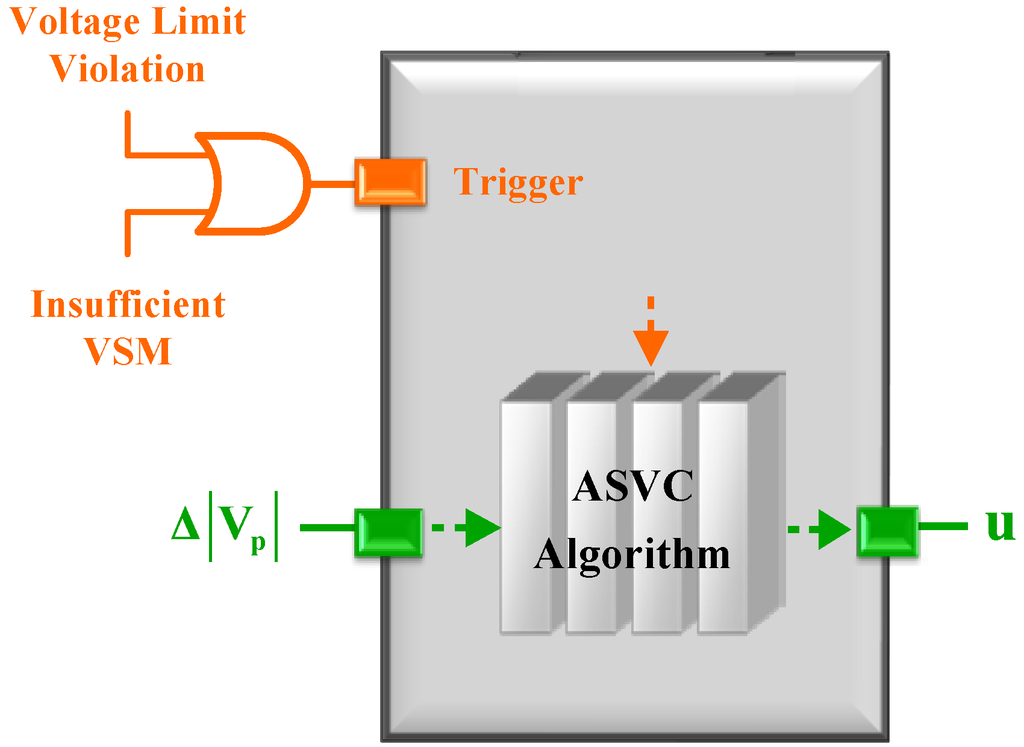
Figure 3.
Block diagram of the proposed ASVC method. Once voltage limit violation or insufficient VSM is identified, the ASVC algorithm will be triggered automatically.
Based on different numbers of pilot buses being used, the following conditions are considered.
(1) All Load Buses as Pilot Buses: This means that voltage measurements are available at all load buses. Under this circumstance, the first term in Equation (2) can be replaced by ; therefore, the problem formulation of the voltage control strategy is stated as
where and are the lower and upper bounds of generator voltage magnitudes, respectively.
(2) Partial Load Buses as Pilot Buses: This means that voltage measurements are only available at the given pilot buses, and thus only has some elements of the vector under this situation. Indeed, can be related to q by the equation , in which Jp is the matrix with the rows of corresponding to the pilot points selected.
Since there are fewer measurements than variables to be estimated, the equation is underdetermined. In the proposed method, however, any reactive power disturbance variable vector q that satisfies can be utilized to determine feasible control signals that minimize . The least-norm technique [27], which is the most commonly used for solving an underdetermined set of linear equations, is applied to approximate q. In this case, the problem is to find q that satisfies and minimizes . Thus, the estimate of q is given by
With the optimal q*, the proposed control strategy can be formulated in the following search problem:
The constrained optimization problems in Equations (6) and (8) can be reformulated as linear programming problems [27] and be solved by using a linear programing solver such as linprog function in the MATLAB optimization toolbox [28]. The optimal control actions, which are obtained from Equations (6) or (8), ensure that the resulting worst load voltage change can precisely remain within the range of the predefined constraint regardless of any unexpected load disturbances acting on the system.
3.2. Voltage Stability Margin Estimation Function
A common static voltage stability index is expressed by the voltage stability margin which shows how far the system is away from a possible instability event. In order to rapidly assess static voltage stability of a power grid, the local measurement-based methods have been presented in the works [25,26]. The key idea of these techniques is provided here.
To start with, consider a load at bus i connected to a complex power system, which can be simplified to a single-machine-infinite-bus system by an estimated Thevenin equivalent network as shown in Figure 4, where , , and correspond to Thevenin equivalent voltage, Thevenin equivalent impedance, and load impedance in phasor representation at bus i, respectively. When the power transmitted is maximum at bus i, is identical to . Based on the impedance match theory, tracking and plays an important role in real-time voltage instability detection.
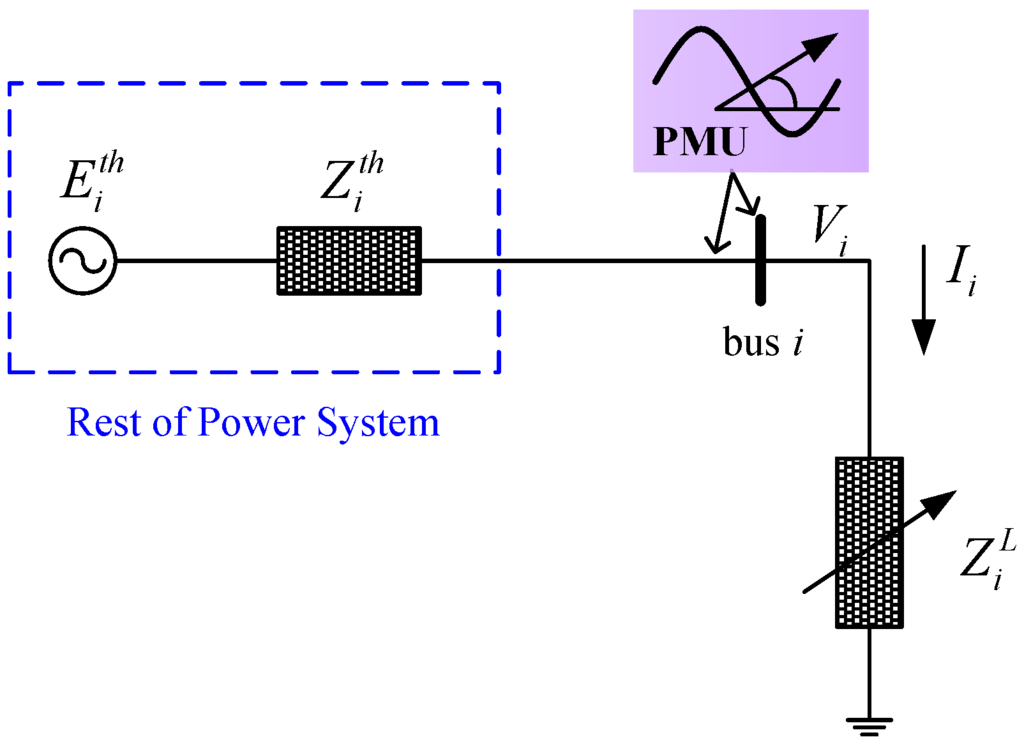
Figure 4.
Thevenin equivalent network at bus i with PMU installed.
Using the approach above, the impedance based VSM index of bus i is defined as
where and can be obtained by using the local measured voltage and current phasors which are available from the installed PMU [25,26]. The static voltage stability margin for the entire power system is defined to be
where p represents the set of numbers of pilot buses. Note that the value of VSM is between 0 and 1. At the voltage-collapse point, the VSM is equal to 0. Although the approach proposed in [25] was employed to estimate VSM, it is noteworthy that any other measurement-based method of VSM analysis can be applied for this purpose, for example, the one proposed in [26].
The index VSM incorporated with the voltage magnitudes at the monitored buses will be used as the triggering signals for activating the proposed ASVC approach. Figure 5 illustrates the proposed control strategy, where and are the threshold levels for voltage change and security margin, respectively. In Figure 5, if the power system is operated at the critical state with poor voltage profile or insufficient VSM, then the ASVC function will be automatically initiated to steer the power system away from the point which is prone to voltage collapse.
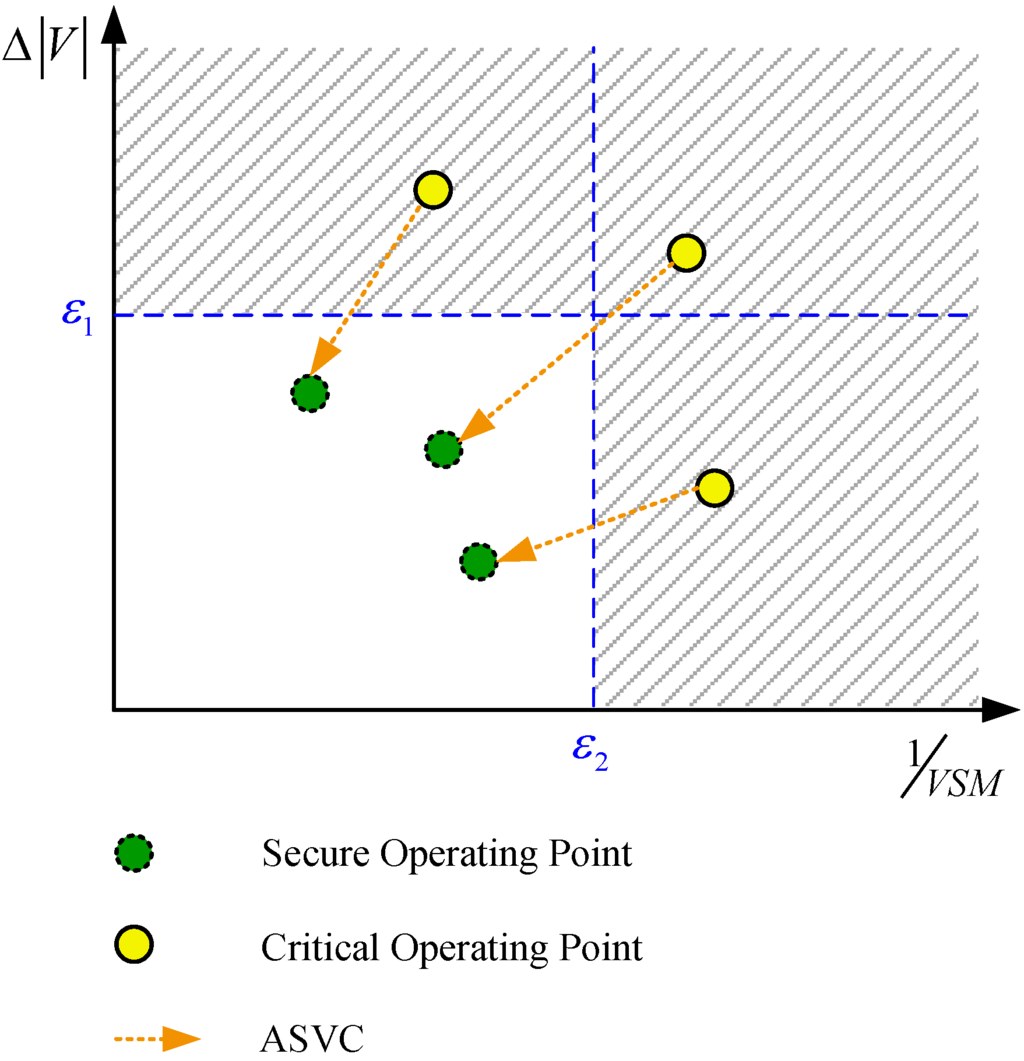
Figure 5.
Illustration of the proposed control scheme.
4. Simulation Results
This section presents numerical examples of the developed control scheme, i.e., simultaneous system voltage profiles improvement as well as static voltage stability margin enlargement, on a sample power network. The simulation program is coded using MATLAB® and implemented on a personal computer which has a CPU with Intel® Core™2 Duo 2.66 GHz and a memory with 4 GB.
The IEEE 30-bus system is used as an example to show the effectiveness of the proposed scheme. This sample system consists of 41 transmission lines, 6 VAR sources, and 24 loads. The system data including line parameters and bus data are given in [29]. For all examples, the permissible value adopted for voltage magnitude is set at p.u., and the security margin for the test system is set as p.u.. These are the threshold levels for triggering the proposed control algorithm. The voltage profile improvement index used in this research is expressed by the root mean square value of voltage changes at all load buses, i.e.,
where m is the number of load buses in the test system, and for each denotes the resulting voltage change at each of the load buses. In this test system, m is set to be 24. Note that the smaller the value of , the better the voltage profile will be.
In order to verify the performance of the presented methodology to power system secondary voltage control, we have studied a lot of experiments. These simulation cases include different load levels, different load patterns, various pilot-bus selections, and various branch outage contingencies. Among those investigated cases, some typical test results for the scenarios given in Table 1 are briefly summarized in the following.

Table 1.
Case studies for the IEEE 30-bus system (“#” Indicates” number” & ”/” indicates ”None”).
| Case | PMU Locations at | Load Change Pattern | Line Outage Contingency |
|---|---|---|---|
| I | #30 | Single bus | / |
| II | #3, #12 | All buses | / |
| III | #24, #29 | Several buses | Line #27–#28 |
| IV | All | Several buses | / |
4.1. Case I
In the first case, bus load change pattern is considered. The load at bus #30 is gradually increased by 15% of its initial load level from the time instant 1 min to 2.5 min of the simulation.
In this test, the voltage magnitude p.u. of pilot bus #30 drops below the constraint of 0.95 p.u. at min. This low voltage violation activates the proposed ASVC immediately, and Figure 6a illustrates the voltage trace at pilot bus #30 during the simulation test of case I. When the proposed scheme is used to carry out the secondary voltage control, voltage violation will be eliminated effectively. In addition, the value of VSM is increased from 0.51 to 0.72 p.u., as shown in Figure 6b. This demonstrates that larger VSM can be achieved simultaneously with improvement of overall network voltage.
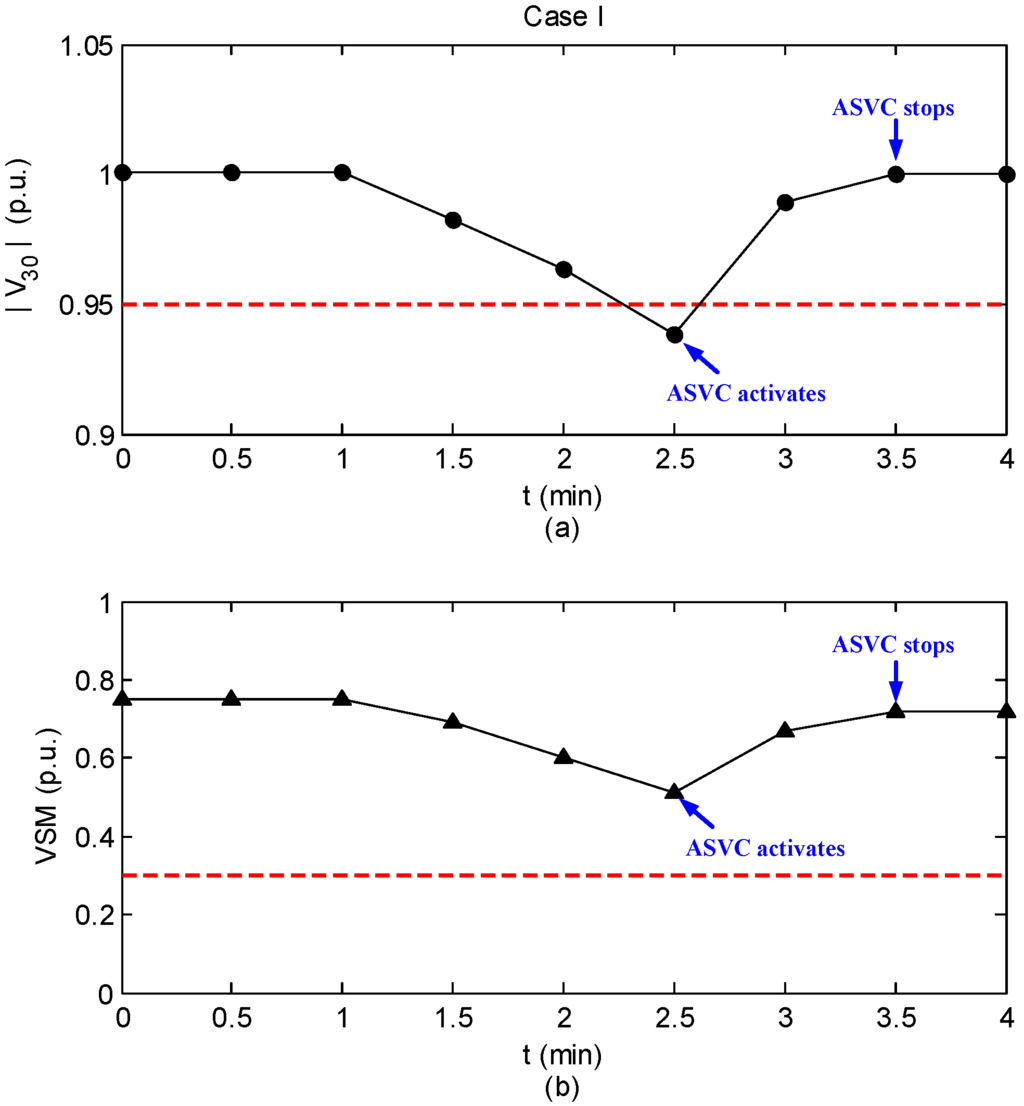
Figure 6.
Simulation result of case I. (a) The trace of ; (b) The trace of VSM.
4.2. Case II
In case II, a new operating condition and new load change pattern are investigated. From the time instant 0.5 min to 2 min of the simulation, all the loads in the IEEE 30-bus system are increased by 20% based on the initial load levels.
During the load increase, the voltage magnitudes at the monitored buses (bus #3 and #12 in this case) are within the pre-determined voltage limits, but static voltage stability margin of the power system is less than the threshold level of 0.3 p.u. at min. This means that the system has a great potential of voltage collapse without any remedial control. Under such situation, however, no control actions will be initiated by the traditional SVC methods which consider only bus voltages as trigger signal. Instead, the proposed scheme employs not only voltage magnitudes but also static voltage stability margin as criteria; therefore, inadequate VSM ( p.u.) is identified.
After applying the proposed ASVC, all the voltage magnitudes are maintained within the range of predefined constraint and the static voltage stability margin is enlarged as well. The simulation result is illustrated in Figure 7, showing that the VSM is significantly increased from 0.23 to 0.57 p.u.. The enlargement of the static voltage stability margin is a result of the improvement in the system voltage profile.
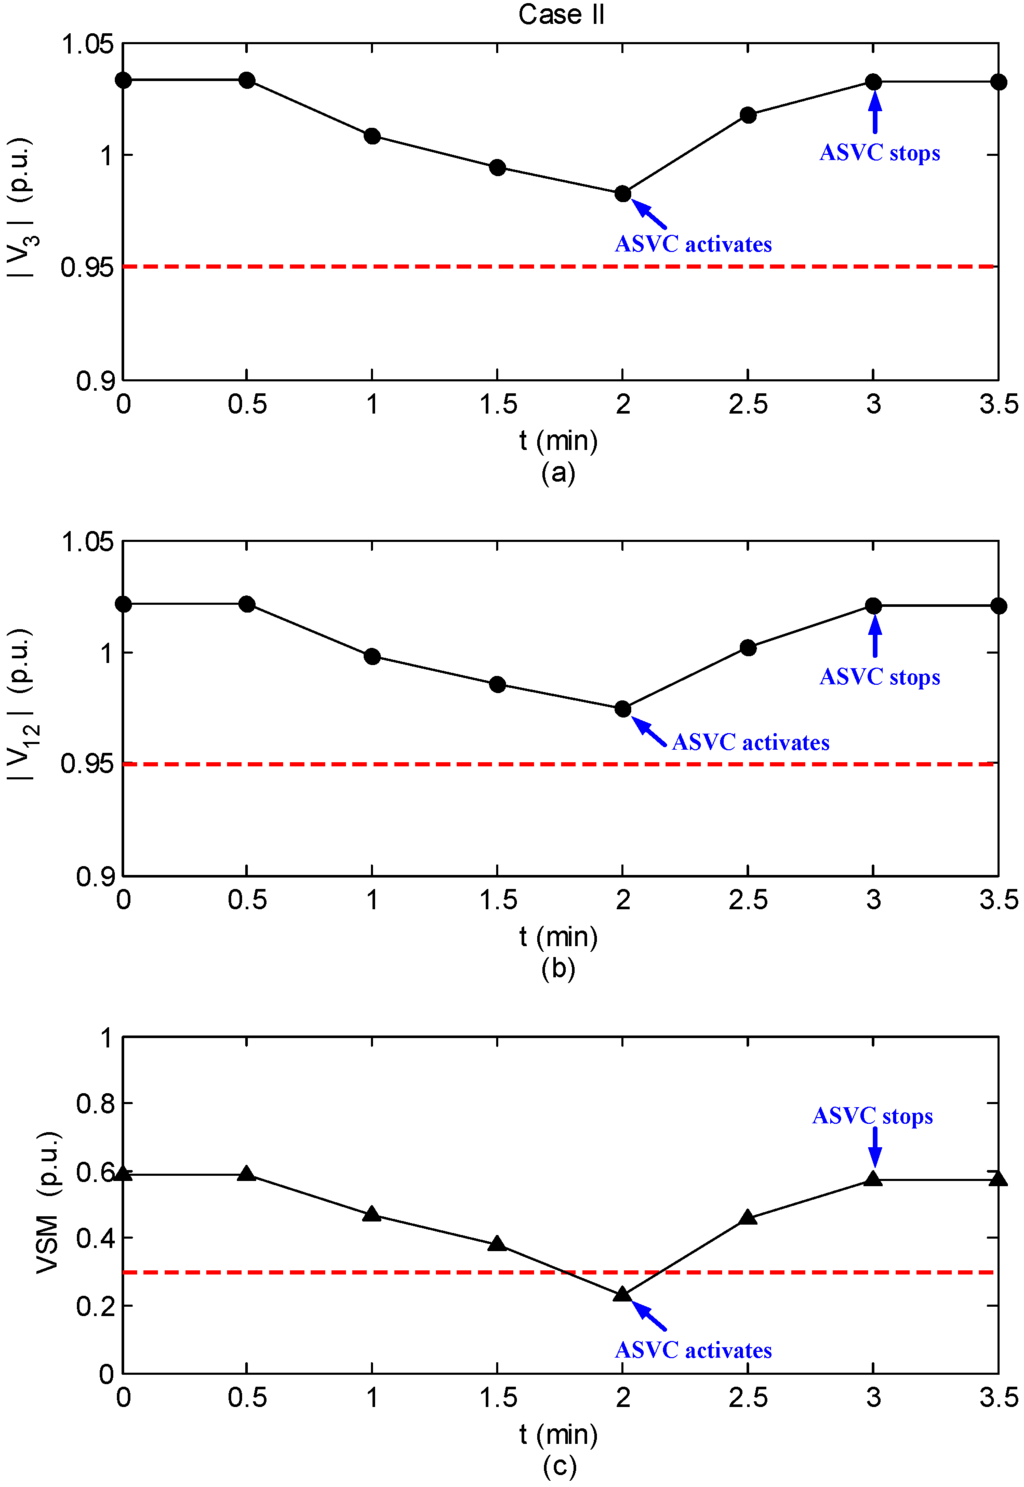
Figure 7.
Simulation result of case II. (a) The trace of ; (b) The trace of ; (c) The trace of VSM.
4.3. Case III
This example is to demonstrate the performance of the proposed scheme with respect to branch outage contingency following several loads increase condition. In this case, the loads at bus #12, #24, and #29 are increased by 20% from the time instant 0.5 min to 2 min, and the transmission line connected between bus #27 and #28 is tripped in a contingency at 2 min.
As can be expected, the system has poor voltage profile and unsecure margin due to the disturbances of both load increase and line outage. Figure 8 shows the simulation result of case III. One can observe that the proposed scheme works satisfactorily in this case.
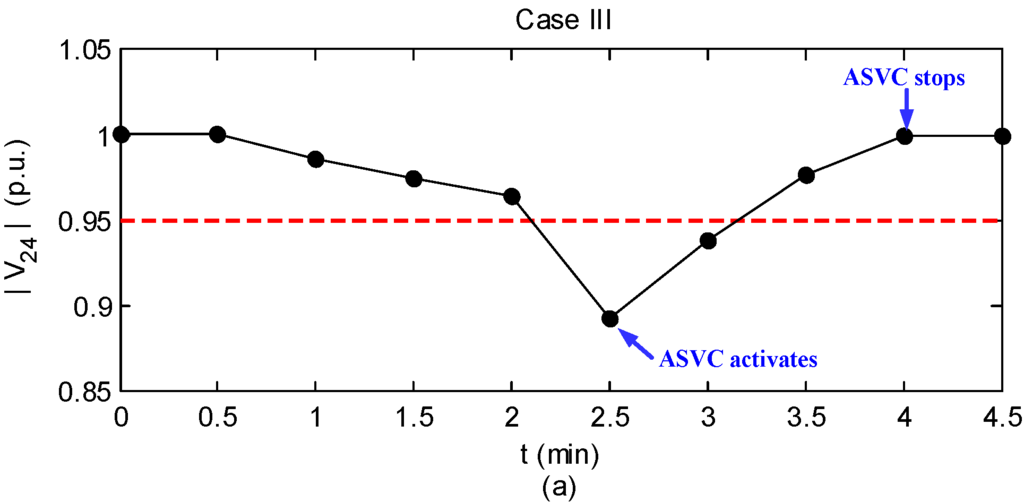
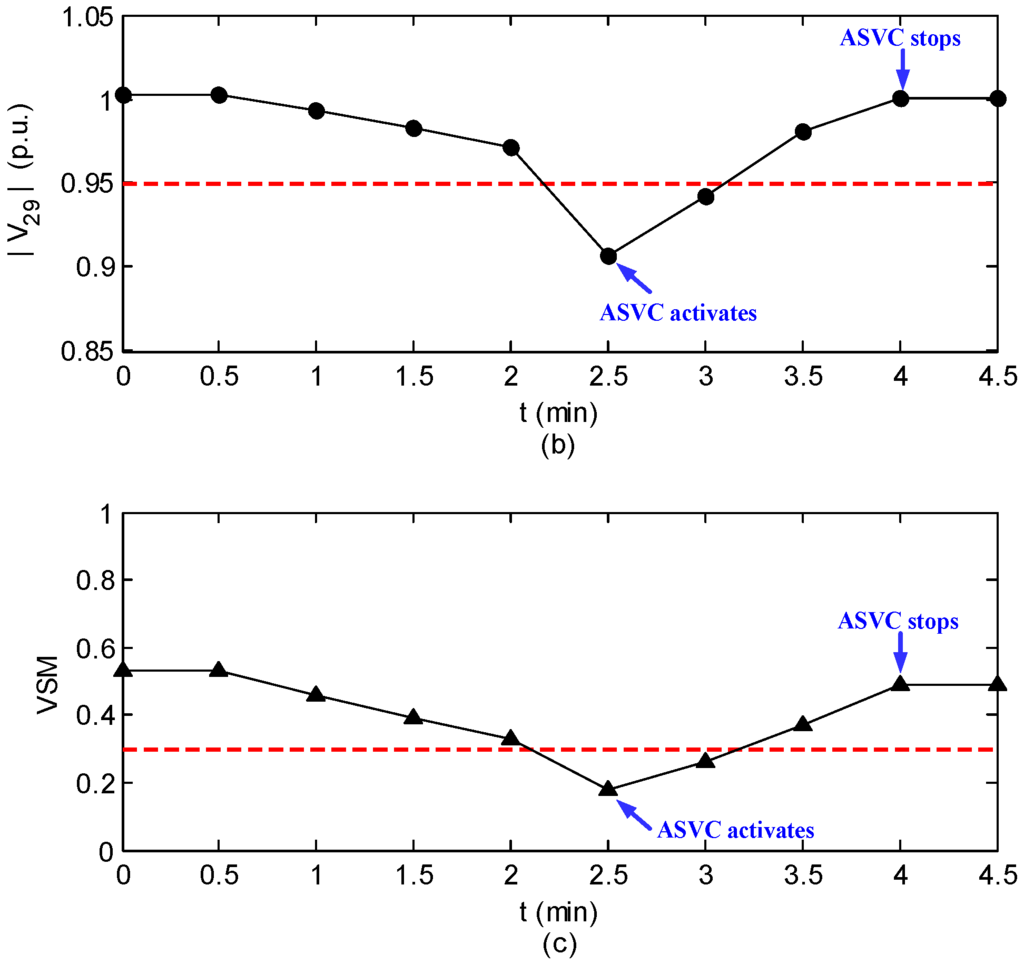
Figure 8.
Simulation result of case III. (a) The trace of ; (b) The trace of ; (c) The trace of VSM.
4.4. Case IV
In the fourth case, we assume that PMUs are installed at all load buses. In addition, several loads change is considered. The loads at bus #3, #16, and #20 are gradually increased by 15% from the time instant 0.5 min to 1.5 min of the simulation.
Figure 9 shows the traces of the selected pilot buses (bus #23 and #26 in this case) and VSM during the simulation of case IV. Since insufficient VSM () is detected at min, the control strategy will be activated accordingly. Thus, the voltage levels and voltage stability margin are considerably enhanced after ASVC. This can be regarded clearly in Figure 9.
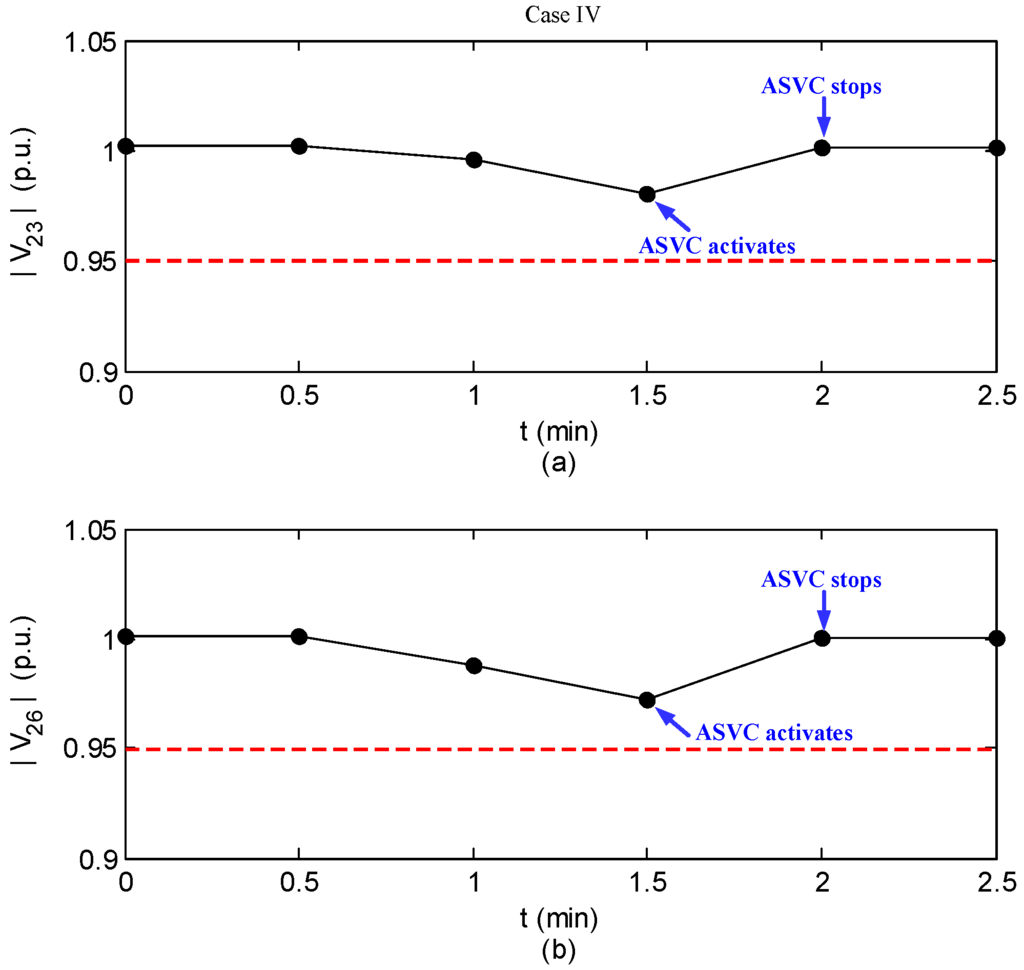
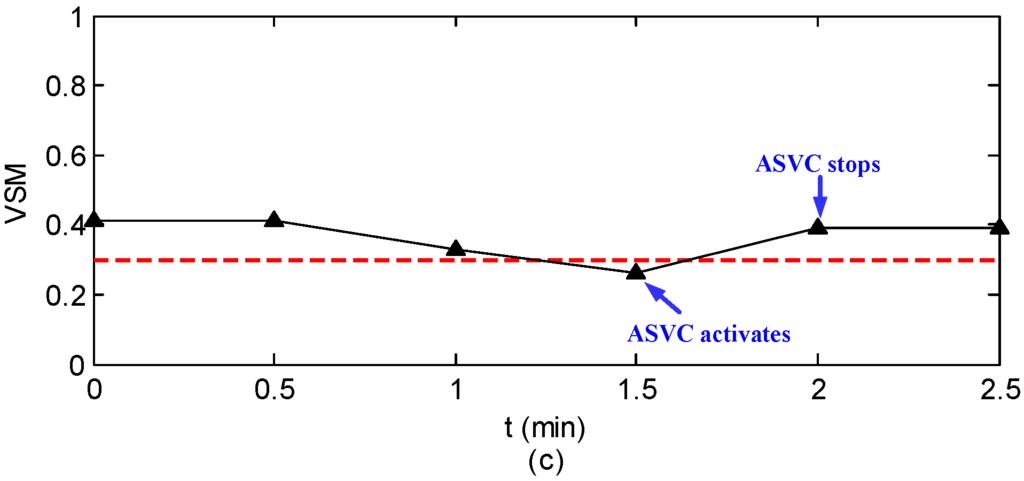
Figure 9.
Simulation result of case IV. (a) The trace of ; (b) The trace of ; (c) The trace of VSM.
Table 2 summarizes the test results for the above three cases. An inspection from the shown table indicates that both voltage profile and static voltage stability margin are greatly improved after applying the proposed control scheme.

Table 2.
Performance evaluation for the proposed scheme on the IEEE 30-bus system.
| Case | xrms (p.u.) | VSM (p.u.) | ||
|---|---|---|---|---|
| Before | After | Before | After | |
| I | 0.0601 | 0.0355 | 0.51 | 0.72 |
| II | 0.0348 | 0.0205 | 0.23 | 0.57 |
| III | 0.0803 | 0.0411 | 0.18 | 0.49 |
| IV | 0.0416 | 0.0194 | 0.26 | 0.39 |
5. Conclusions
A synchrophasor based optimal voltage control scheme, which considers both voltage profile and static voltage stability margin, is developed in order to achieve secure grid operations. A detailed derivation of the principles used in the scheme is presented with illustrated figures. An extensive simulation studies on the IEEE 30-bus test system is carried out to demonstrate the feasibility and effectiveness of the proposed scheme.
Acknowledgments
This work was supported by the Ministry of Science and Technology of Taiwan, ROC., under Contracts MOST 104-2221-E-035-041 and MOST 104-2119-M-035-002.
Author Contributions
Heng-Yi Su proposed the approach and wrote the manuscript with input from Yi-Chung Chen and Yi-Liang Hsu.
Conflicts of Interest
The authors declare no conflict of interest.
References
- Kundur, P. Power System Stability and Control; McGraw-Hill: New York, NY, USA, 1994. [Google Scholar]
- Kundur, P.; Paserba, J.; Ajjarapu, V.; Andersson, G.; Bose, A.; Canizares, C.; Hatziargyriou, N.; Hill, D.; Stankovic, A.; Taylor, C.; et al. Definition and classification of power system stability IEEE/CIGRE joint task force on stability terms and definitions. IEEE Trans. Power Syst. 2004, 19, 1387–1401. [Google Scholar]
- Morison, G.K.; Gao, B.; Kundur, P. Voltage stability analysis using static and dynamic approaches. IEEE Trans. Power Syst. 1993, 8, 1159–1171. [Google Scholar] [CrossRef]
- Phadke, A.G.; Thorp, J.S. Synchronized Phasor Measurements and Their Applications; Springer-Verlag: New York, NY, USA, 2008. [Google Scholar]
- De La Ree, J.; Centeno, V.; Thorp, J.S.; Phadke, A.G. Synchronized phasor measurement applications in power systems. IEEE Trans. Smart Grid. 2010, 1, 20–27. [Google Scholar] [CrossRef]
- Thorp, J.S.; Ilic-Spong, M.; Varghese, M. An optimal secondary voltage-var control technique. Automatica 1986, 22, 217–222. [Google Scholar] [CrossRef]
- Ilic, M.; Christensen, J.; Eichorn, K.L. Secondary voltage control using pilot point information. IEEE Trans. Power Syst. 1988, 3, 660–668. [Google Scholar] [CrossRef]
- Stankovic, A.; Ilic, M.; Maratukulam, D. Recent results in secondary voltage control of power systems. IEEE Trans. Power Syst. 1991, 6, 94–101. [Google Scholar] [CrossRef]
- Zobian, A.; Ilic, M.D. A steady state voltage monitoring and control algorithm using localized least square minimization of load voltage deviations. IEEE Trans. Power Syst. 1996, 11, 929–938. [Google Scholar] [CrossRef]
- Wang, H.; Li, H.; Chen, H. Coordinated secondary voltage control to eliminate voltage violations in power system contingencies. IEEE Trans. Power Syst. 2003, 18, 588–595. [Google Scholar] [CrossRef]
- Berizzi, A.; Marannino, P.; Merlo, M.; Pozzi, M.; Zanellini, F. Steady-state and dynamic approaches for the evaluation of loadability margin in the presence of secondary voltage regulation. IEEE Trans. Power Syst. 2004, 9, 1048–1057. [Google Scholar] [CrossRef]
- Paul, J.P.; Leost, J.T.; Tesseron, J.M. Survey of the secondary voltage control in France: Present realization and investigations. IEEE Trans. Power Syst. 1987, 2, 505–511. [Google Scholar] [CrossRef]
- Lagonotte, P.; Sabonnadiere, J.C.; Leost, J.Y.; Paul, J.P. Structural analysis of the electrical system: Application to the secondary voltage control in France. IEEE Trans. Power Syst. 1989, 4, 1477–1484. [Google Scholar] [CrossRef]
- Corsi, S.; Marannino, P.; Losignore, N.; Moreschini, G.; Piccini, G. Coordination between the reactive power scheduling function and the hierarchical voltage control of the EHV ENEL system. IEEE Trans. Power Syst. 1995, 10, 686–694. [Google Scholar] [CrossRef]
- Sancha, J.L.; Fernandez, J.L.; Cortes, A.; Abarca, J.T. Secondary voltage control: Analysis, solutions, simulation results for the Spanish transmission system. IEEE Trans. Power Syst. 1996, 11, 630–638. [Google Scholar] [CrossRef]
- Corsi, S.; Pozzi, M.; Sabelli, C.; Serrani, A. The coordinated automatic voltage control of the Italian transmission grid-Part I: Reasons of the choice and overview of the consolidated hierarchical system. IEEE Trans. Power Syst. 2004, 19, 1723–1732. [Google Scholar] [CrossRef]
- Corsi, S.; Pozzi, M.; Sforna, M.; Dell’Olio, G. The coordinated automatic voltage control of the Italian transmission grid-part II: Control apparatuses and field performance of the consolidated hierarchical system. IEEE Trans. Power Syst. 2004, 19, 1733–1741. [Google Scholar] [CrossRef]
- Conejo, A.; Aguilar, M.J. Secondary voltage control: Nonlinear selection of pilot buses, design of an optimal control law, and simulation results. IEE Proc. Gen. Trans. Distrib. 1998, 145, 77–81. [Google Scholar] [CrossRef]
- Yu, C.; Yoon, Y.T.; Ilic, M.D.; Catelli, A. On-line voltage regulation: The case of New England. IEEE Trans. Power Syst. 1995, 10, 631–638. [Google Scholar]
- Begovic, M.; Fulton, D.; Gonzalez, M.R.; Goossens, J.; Haas, R.W.; Henville, C.F.; Michel, G.L.; Postforoosh, J.; Williams, J.B.; Zimmerman, K. Summary of system protection and voltage stability. IEEE Trans. Power Syst. 2004, 19, 1387–1401. [Google Scholar] [CrossRef]
- Flatabo, N.; Ognedal, R.; Carlsen, T. Voltage stability condition in a power transmission system calculated by sensitivity methods. IEEE Trans. Power Syst. 1990, 5, 1286–1293. [Google Scholar] [CrossRef]
- Flatabo, N.; Fosso, O.; Ognedal, R.; Carlsen, T. A method for calculation of margins to voltage instability applied on the Norwegian system for maintaining required security level. IEEE Trans. Power Syst. 1993, 8, 920–928. [Google Scholar] [CrossRef]
- Lof, P.A.; Semed, T.; Andersson, G.; Hill, D.J. Fast calculation of a voltage stability index. IEEE Trans. Power Syst. 1992, 7, 54–64. [Google Scholar] [CrossRef]
- Lof, P.A.; Andersson, G.; Hill, D.J. Voltage stability indices for stressed power systems. IEEE Trans. Power Syst. 1993, 8, 326–335. [Google Scholar] [CrossRef]
- Vu, K.; Begovic, M.M.; Novosel, D.; Saha, M.M. Use of local measurements to estimate voltage-stability margin. IEEE Trans. Power Syst. 1999, 14, 1029–1035. [Google Scholar] [CrossRef]
- Smon, I.; Verbic, G.; Gubina, F. Local voltage-stability index using Tllegen’s theorem. IEEE Trans. Power Syst. 2006, 21, 1267–1275. [Google Scholar] [CrossRef]
- Boyd, S.; Vandenberghe, L. Convex Optimization; Cambridge University Press: Cambridge, UK, 2004. [Google Scholar]
- MathWorks, Inc. MATLAB Optimization Toolbox. Available online: http://www.mathworks.com/products/ optimization/ (accessed on 4 March 2005).
- University of Washington College of Engineering. Power Systems Test Case Archive. Available online: http://www.ee.washington.edu/re-serach/pstcal/ (accessed on 17 September 2005).
© 2016 by the authors; licensee MDPI, Basel, Switzerland. This article is an open access article distributed under the terms and conditions of the Creative Commons by Attribution (CC-BY) license (http://creativecommons.org/licenses/by/4.0/).