1. Introduction
Single cell analysis has become an important field of research in which cell properties are studied for an improved understanding of cellular processes. Cell intracellular temperature has been proven a vital element in most cellular activates. Recently, many attempts by researchers focused on developing sensors that have high accuracy and do not cause any damages to the cells, such as nanogap biosensors [
1], nanoneedle biosensors [
2,
3], and sensors using extended-gate field-effect transistors [
4,
5].
Micro total analysis system (µTAS) and lab on chip (LOC) attracted many researchers towards improving traditional detection techniques in many chemical, biological and medical areas. The added advantages that these systems provide, such as the ability to combine and automate all the analysis steps from sampling to obtaining data in a single chip, reduce total analysis time and are very cost effective encouraged the development of techniques that support many clinical applications including single cell analysis [
6,
7,
8].
Single cell analysis is the type of study that considers the identity of individual cells and cell heterogeneity that made it an expanding field of research worldwide. Different cell properties include chemical, electrical, mechanical and thermal properties. The intracellular temperature of cells has shown to have important roles in cell functions, metabolisms, divisions and many other vital cellular activities [
9,
10,
11]. In addition, cells that are characterized with an abnormality such as cancer tend to have higher heat production rates compared to normal cells [
12].
Over the years, there have been many attempts to measure internal cellular temperature using different approaches [
13]. Some relied on the luminescent change of materials to obtain the temperature gradient, e.g., quantum dots [
14], nanoparticles [
15], and thermosensitive materials [
16,
17]. These methods showed a high level of sensitivity. Yet, photo-bleaching, material movement inside the cell and toxicity are some critical disadvantages [
18]. Other methods relied on material properties that were affected by temperature change. A nanoneedle based on thermocouple was one of the pioneer example that had an ability to detect 0.1 °C change in temperature [
19]. A multi-walled carbon nanotube was suggested as a temperature detector for biological cells [
20], as was photo acoustic microscopy (PAM), which measured the ultrasound signals induced by light absorption [
21]. Another interesting idea was the incorporation of a microfluidic system with a resonant thermal sensor that measured heat generation in living cells, however, the application diversity was limited to a certain type of cells, i.e., brown fat cell (BFC) [
22]. These non-luminescent sensors open the door for new fields of single cell thermal property studies which have the potential to produce highly sensitive measurements accurately.
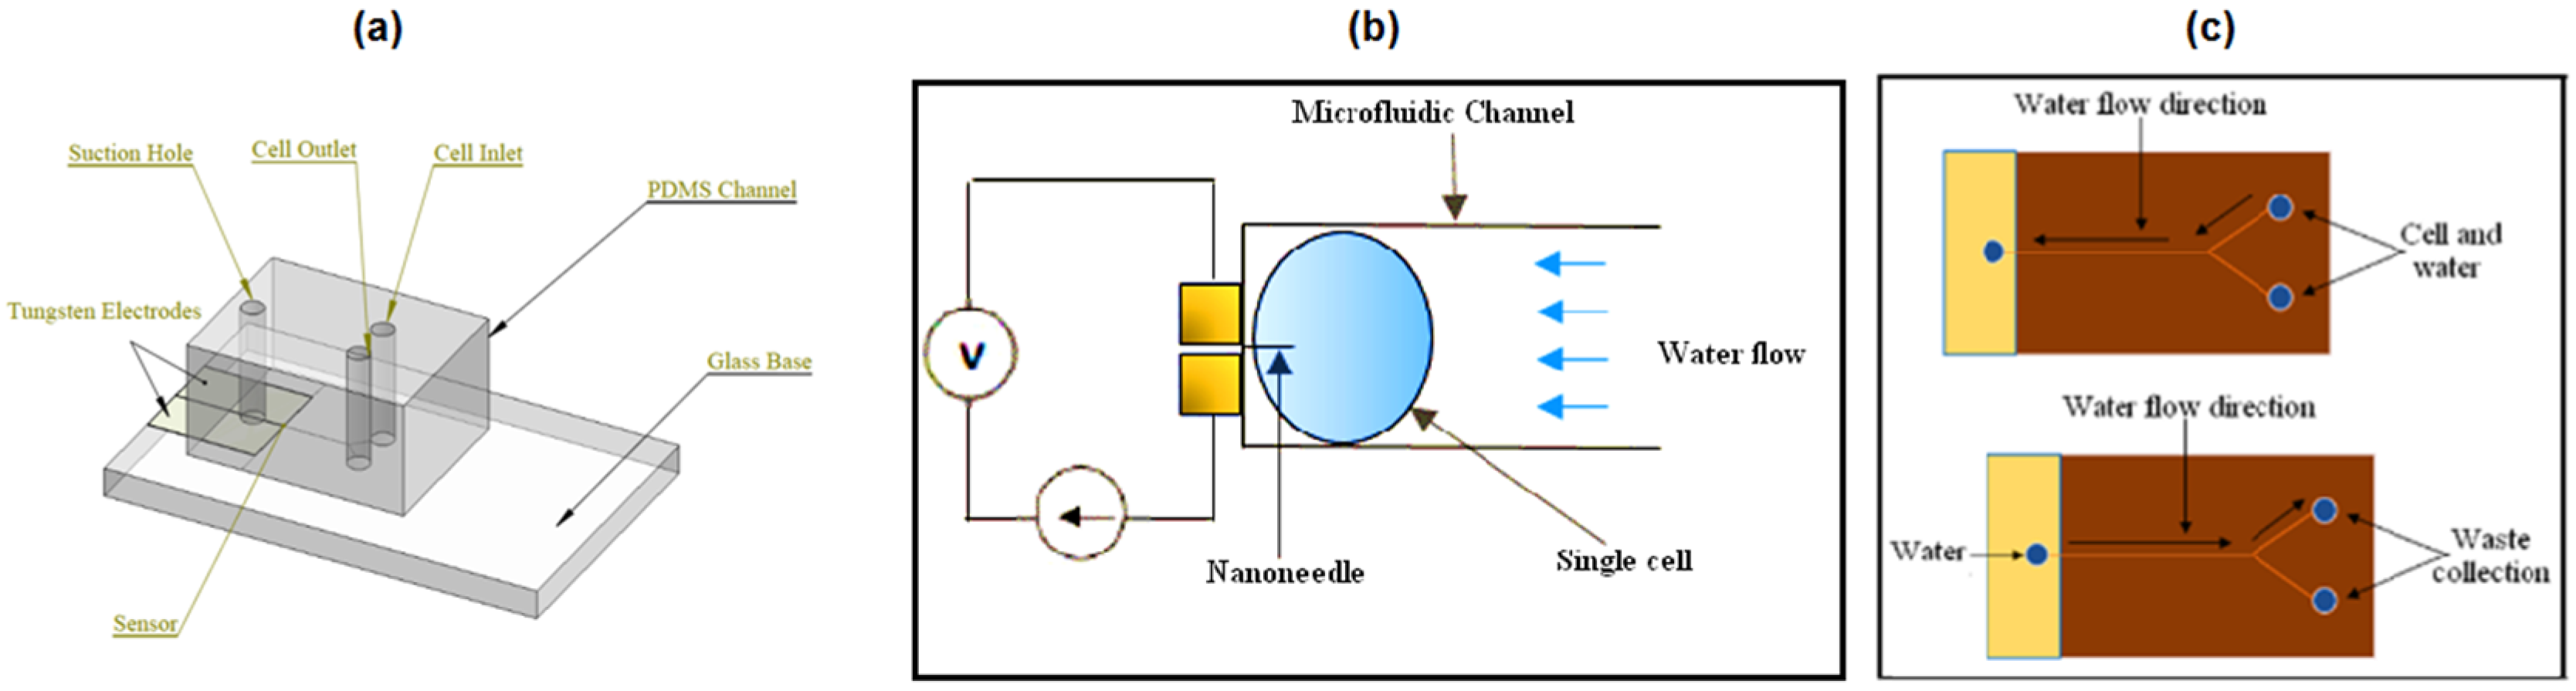
In this study, a tungsten-based nanoneedle-microfluidic system is proposed for single cell temperature measurement. The nanoneedle design, characterizations, intracellular temperature detection and nanoneedle–microfluidic channel integration are studied. Considering the importance of finite element analysis as the initial step in designing a system, a thorough study was performed to optimize the necessary parameters that were believed to influence the final performance of the proposed system.
The nanoneedle design included a study on two parameters: the shape and size of the sensor, which had the best current density distribution and caused minimal damage on the saccharomyces cerevisiae cell under study. Then, the characterization analysis were on thermal-electric and mechanical characterizations to assess the ability of the nanoneedle to respond to temperature change as well as the nanoneedle’s sustainability against external forces. Furthermore, the ability of nanoneedle to measure the temperature of a single cell was performed. Two factors were analyzed to effectively characterize the intracellular temperature of a single cell. The first factor was to test the effect of the cell conductivity on the nanoneedle performance, and the second was to evaluate the sensor sensitivity and response time to temperature change in the range of 24–60 °C. Lastly, the integration of the nanoneedle to a microfluidic channel required a study on the cell flow rate which was influenced by the microfluidic channel cross-sectional area and the fluid velocity.
3. Results and Discussion
The analysis covered the design, characterizations, intracellular temperature detection and nanoneedle-microfluidic channel integration.
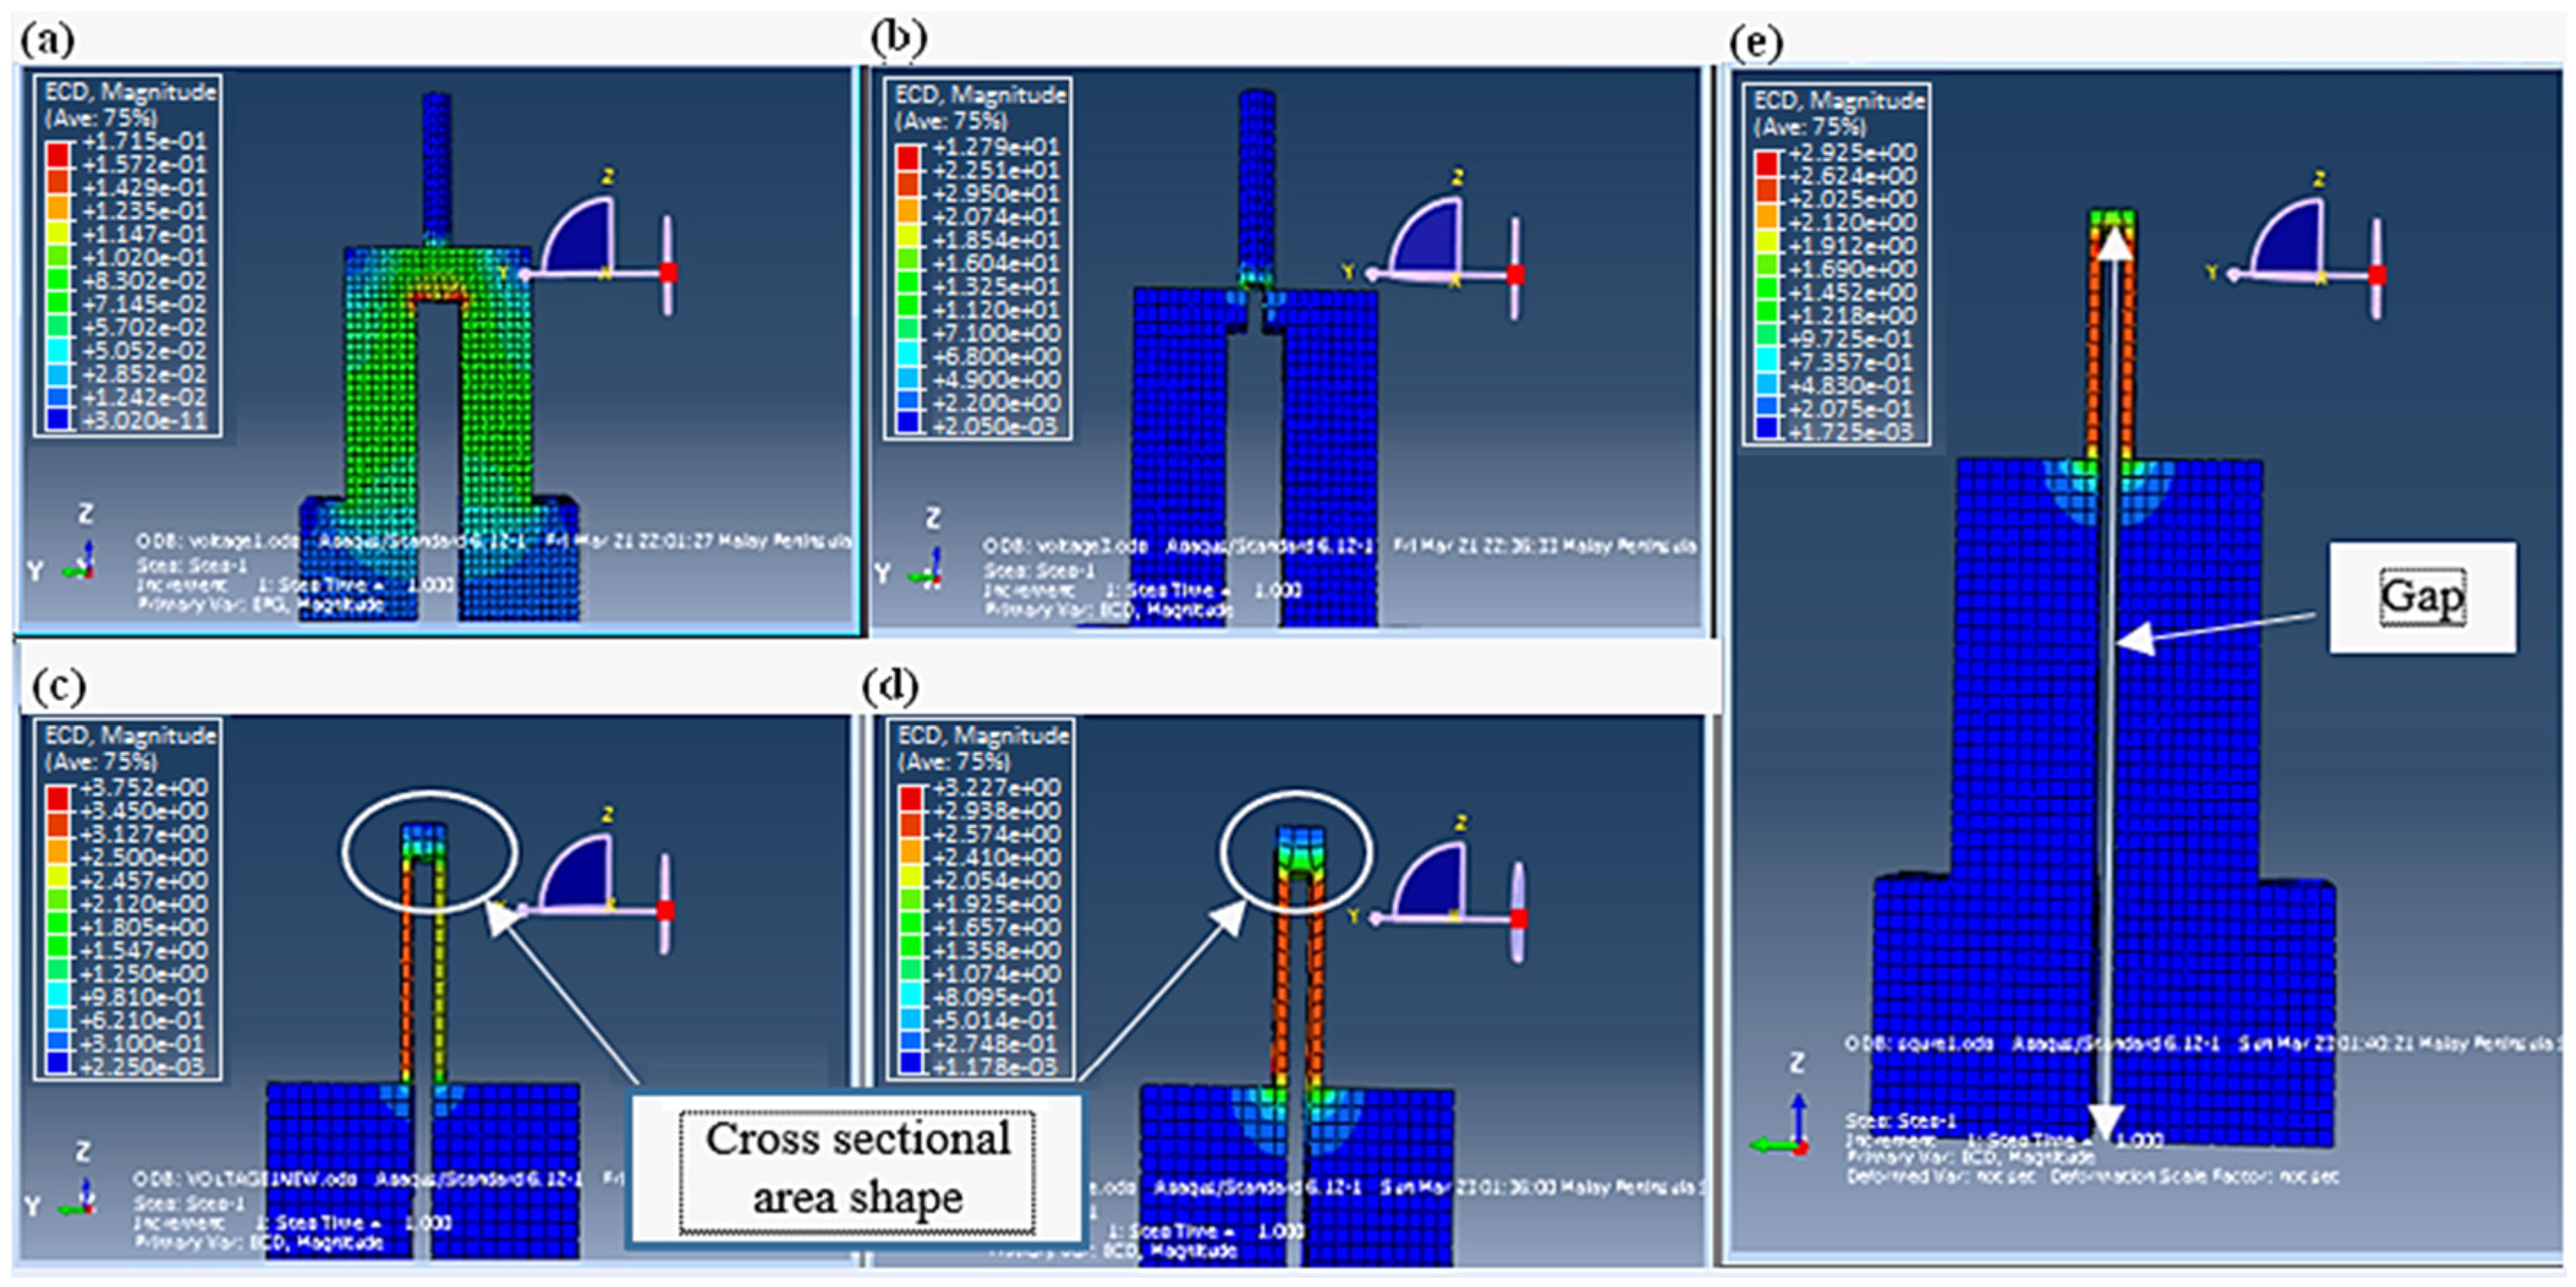
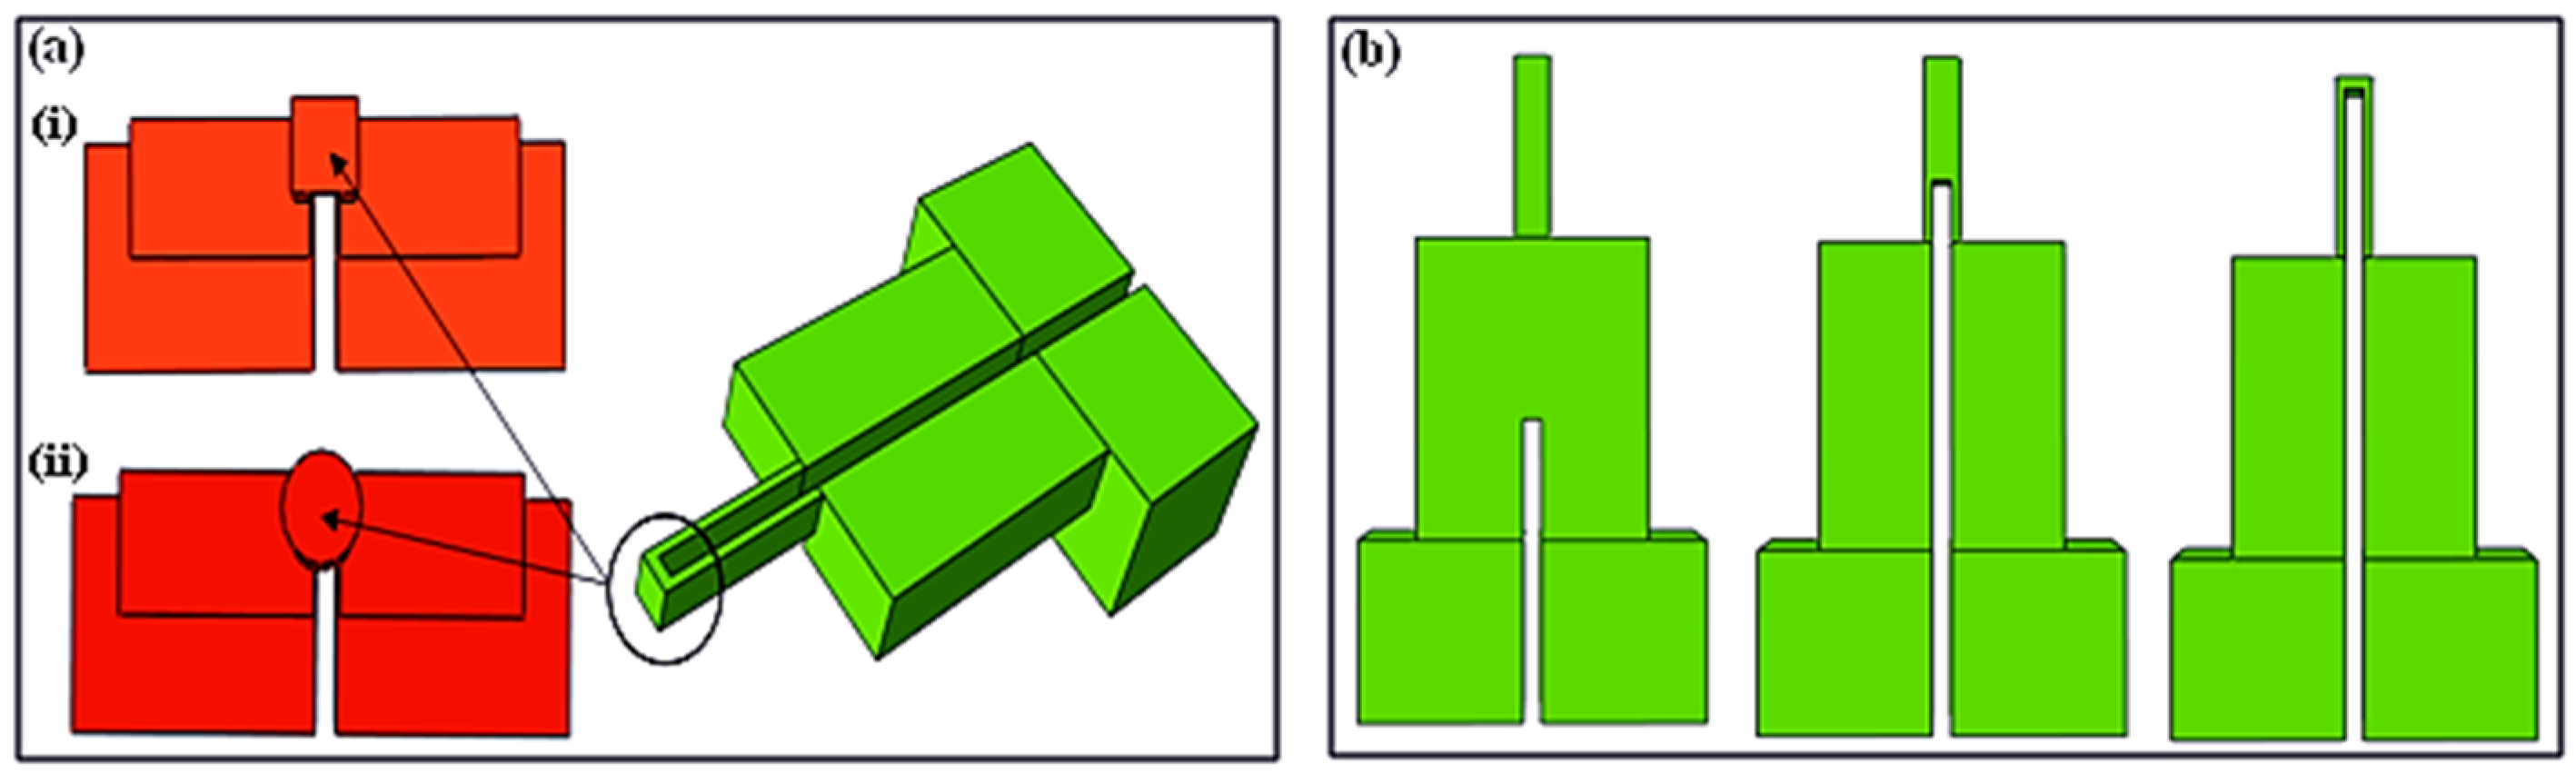
Figure 8 illustrates the simulation results of the first stage of the designing process, covering mainly the nanoneedle design. The gap was the first factor considered in the analysis, as it is evident in
Figure 8a,b.
The current density shown by the color bar did not flow to the tip of nanoneedle (where the detection would happen after penetration) when the gap was only at the electrodes. As the gap increased towards the tip, the current density distribution was more noticeable within the nanoneedle. However, the current density did not achieve uniformity, which would affect the accuracy of the measurement. This was solved by manipulating the cross-sectional area shape from being circular to a square (
Figure 8c,d). The final selected design (
Figure 8e) had an even current density distribution throughout the sensor, a gap of 10.8 μm and a square cross-sectional area.
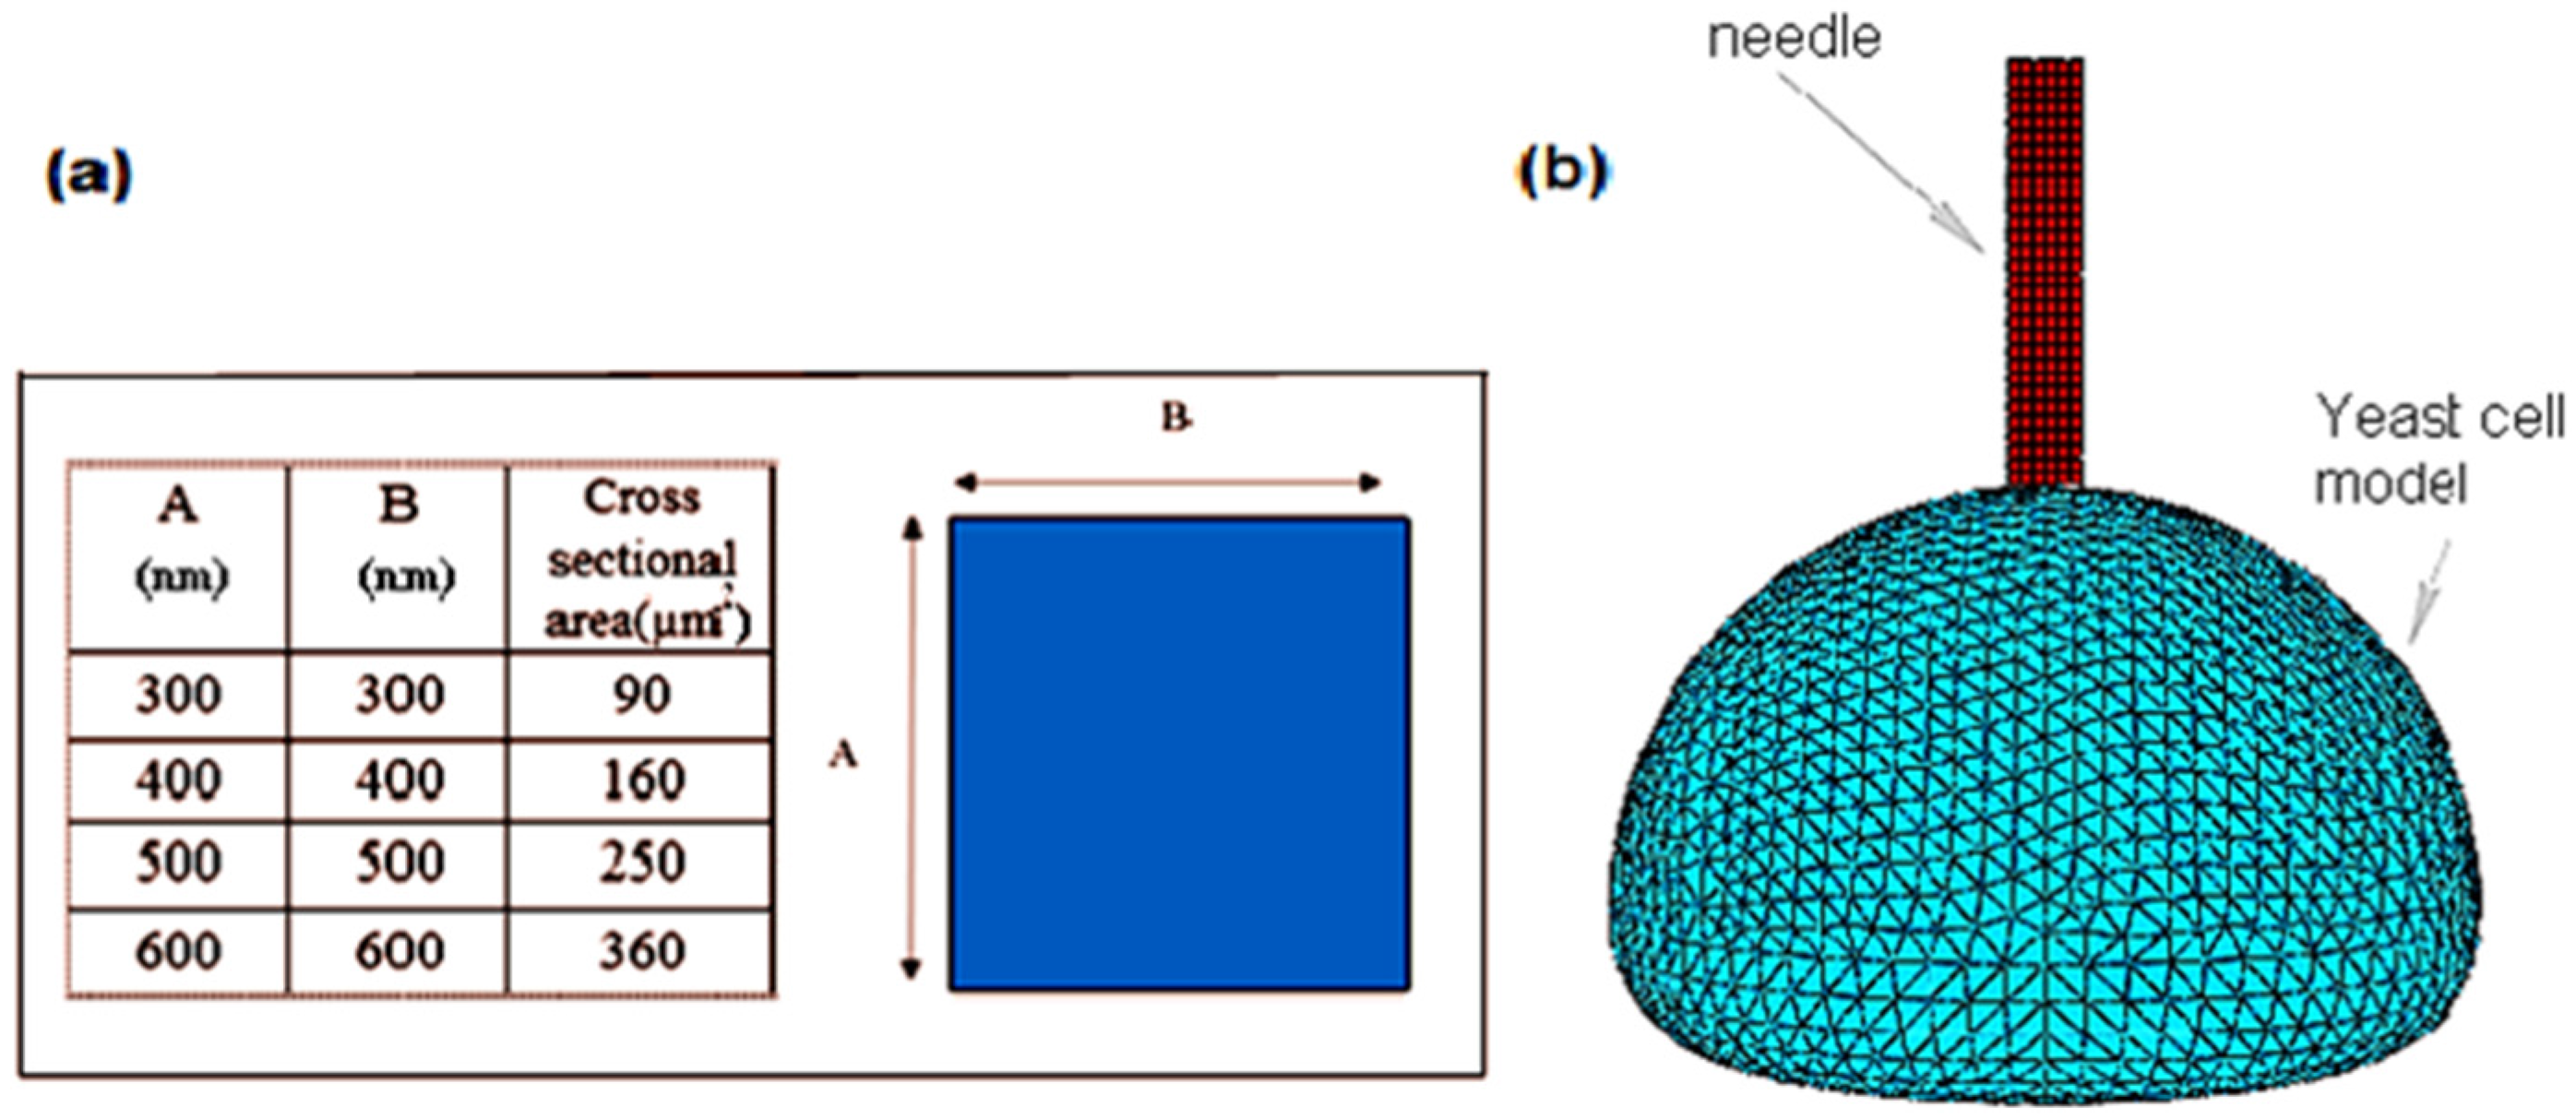
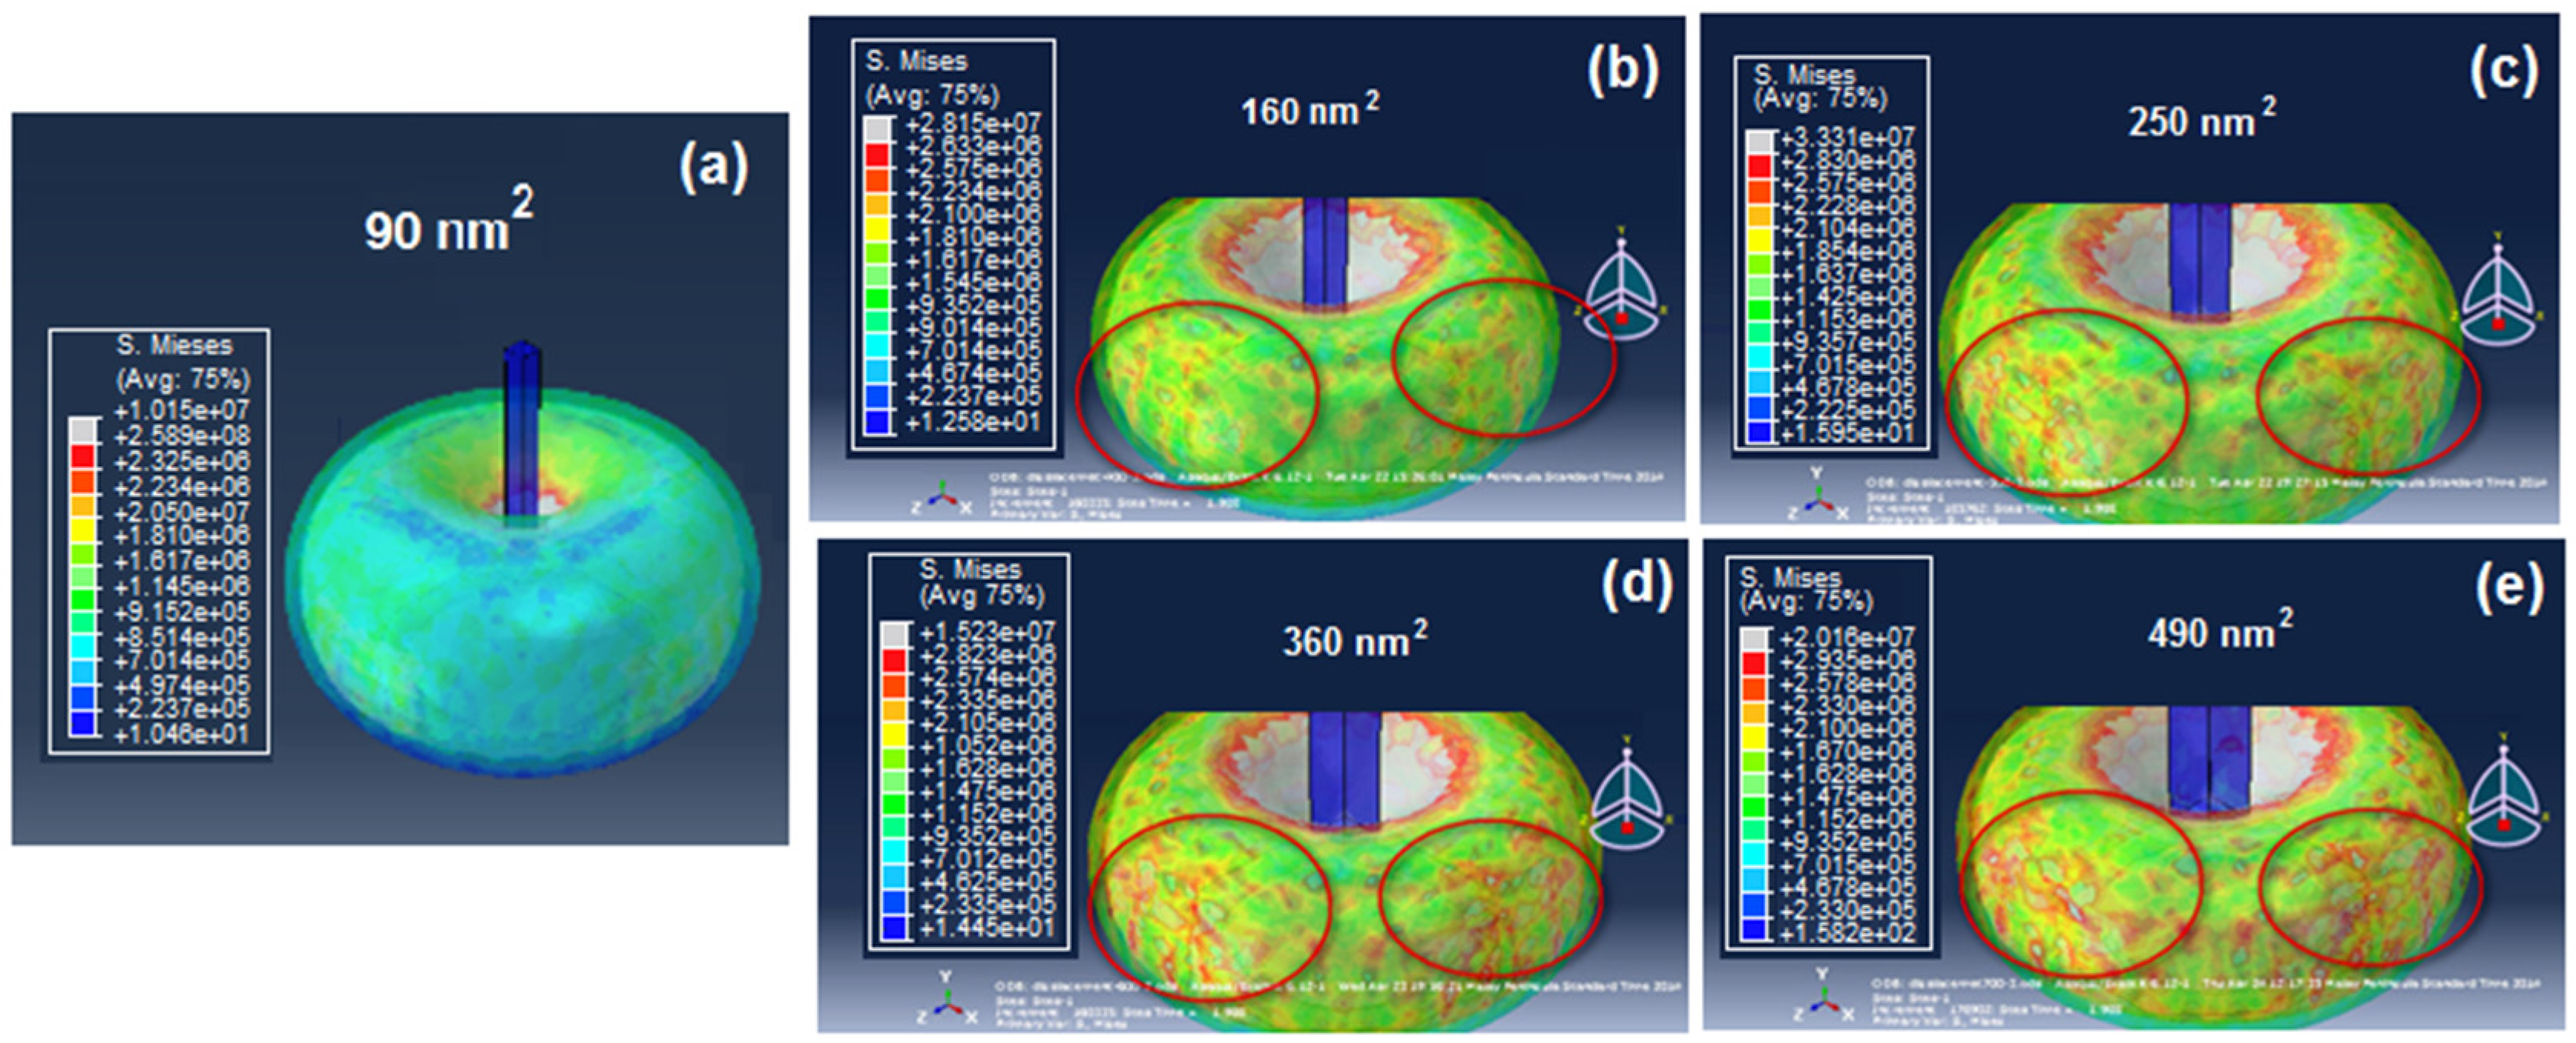
After the cross-sectional area shape was decided, the size was analyzed by viewing the effect of the penetration of different nanoneedle sizes (90, 160, 250, 360, 490 nm
2) into a yeast cell (
Figure 9a–e). As can be seen, all the nanoneedle sizes could penetrate the cell with the same applied force without causing any immediate bursting. However, the damage (scale of 0 in blue color and 1 in red color) of the inner part of the cell wall (marked in red circles) increased as the cross-sectional area of the nanoneedle increased. This can be explained by the increased pressure on the cell when a larger surface is pressing against it. From the
Figure 9a, the damage caused by the 90 nm
2 cross-sectional area was the most reasonable as it did not cause any tearing of the inner cell wall. Thus, the final design was chosen with a gap of 10.8 μm and a 90 nm
2 square shaped cross-sectional area.
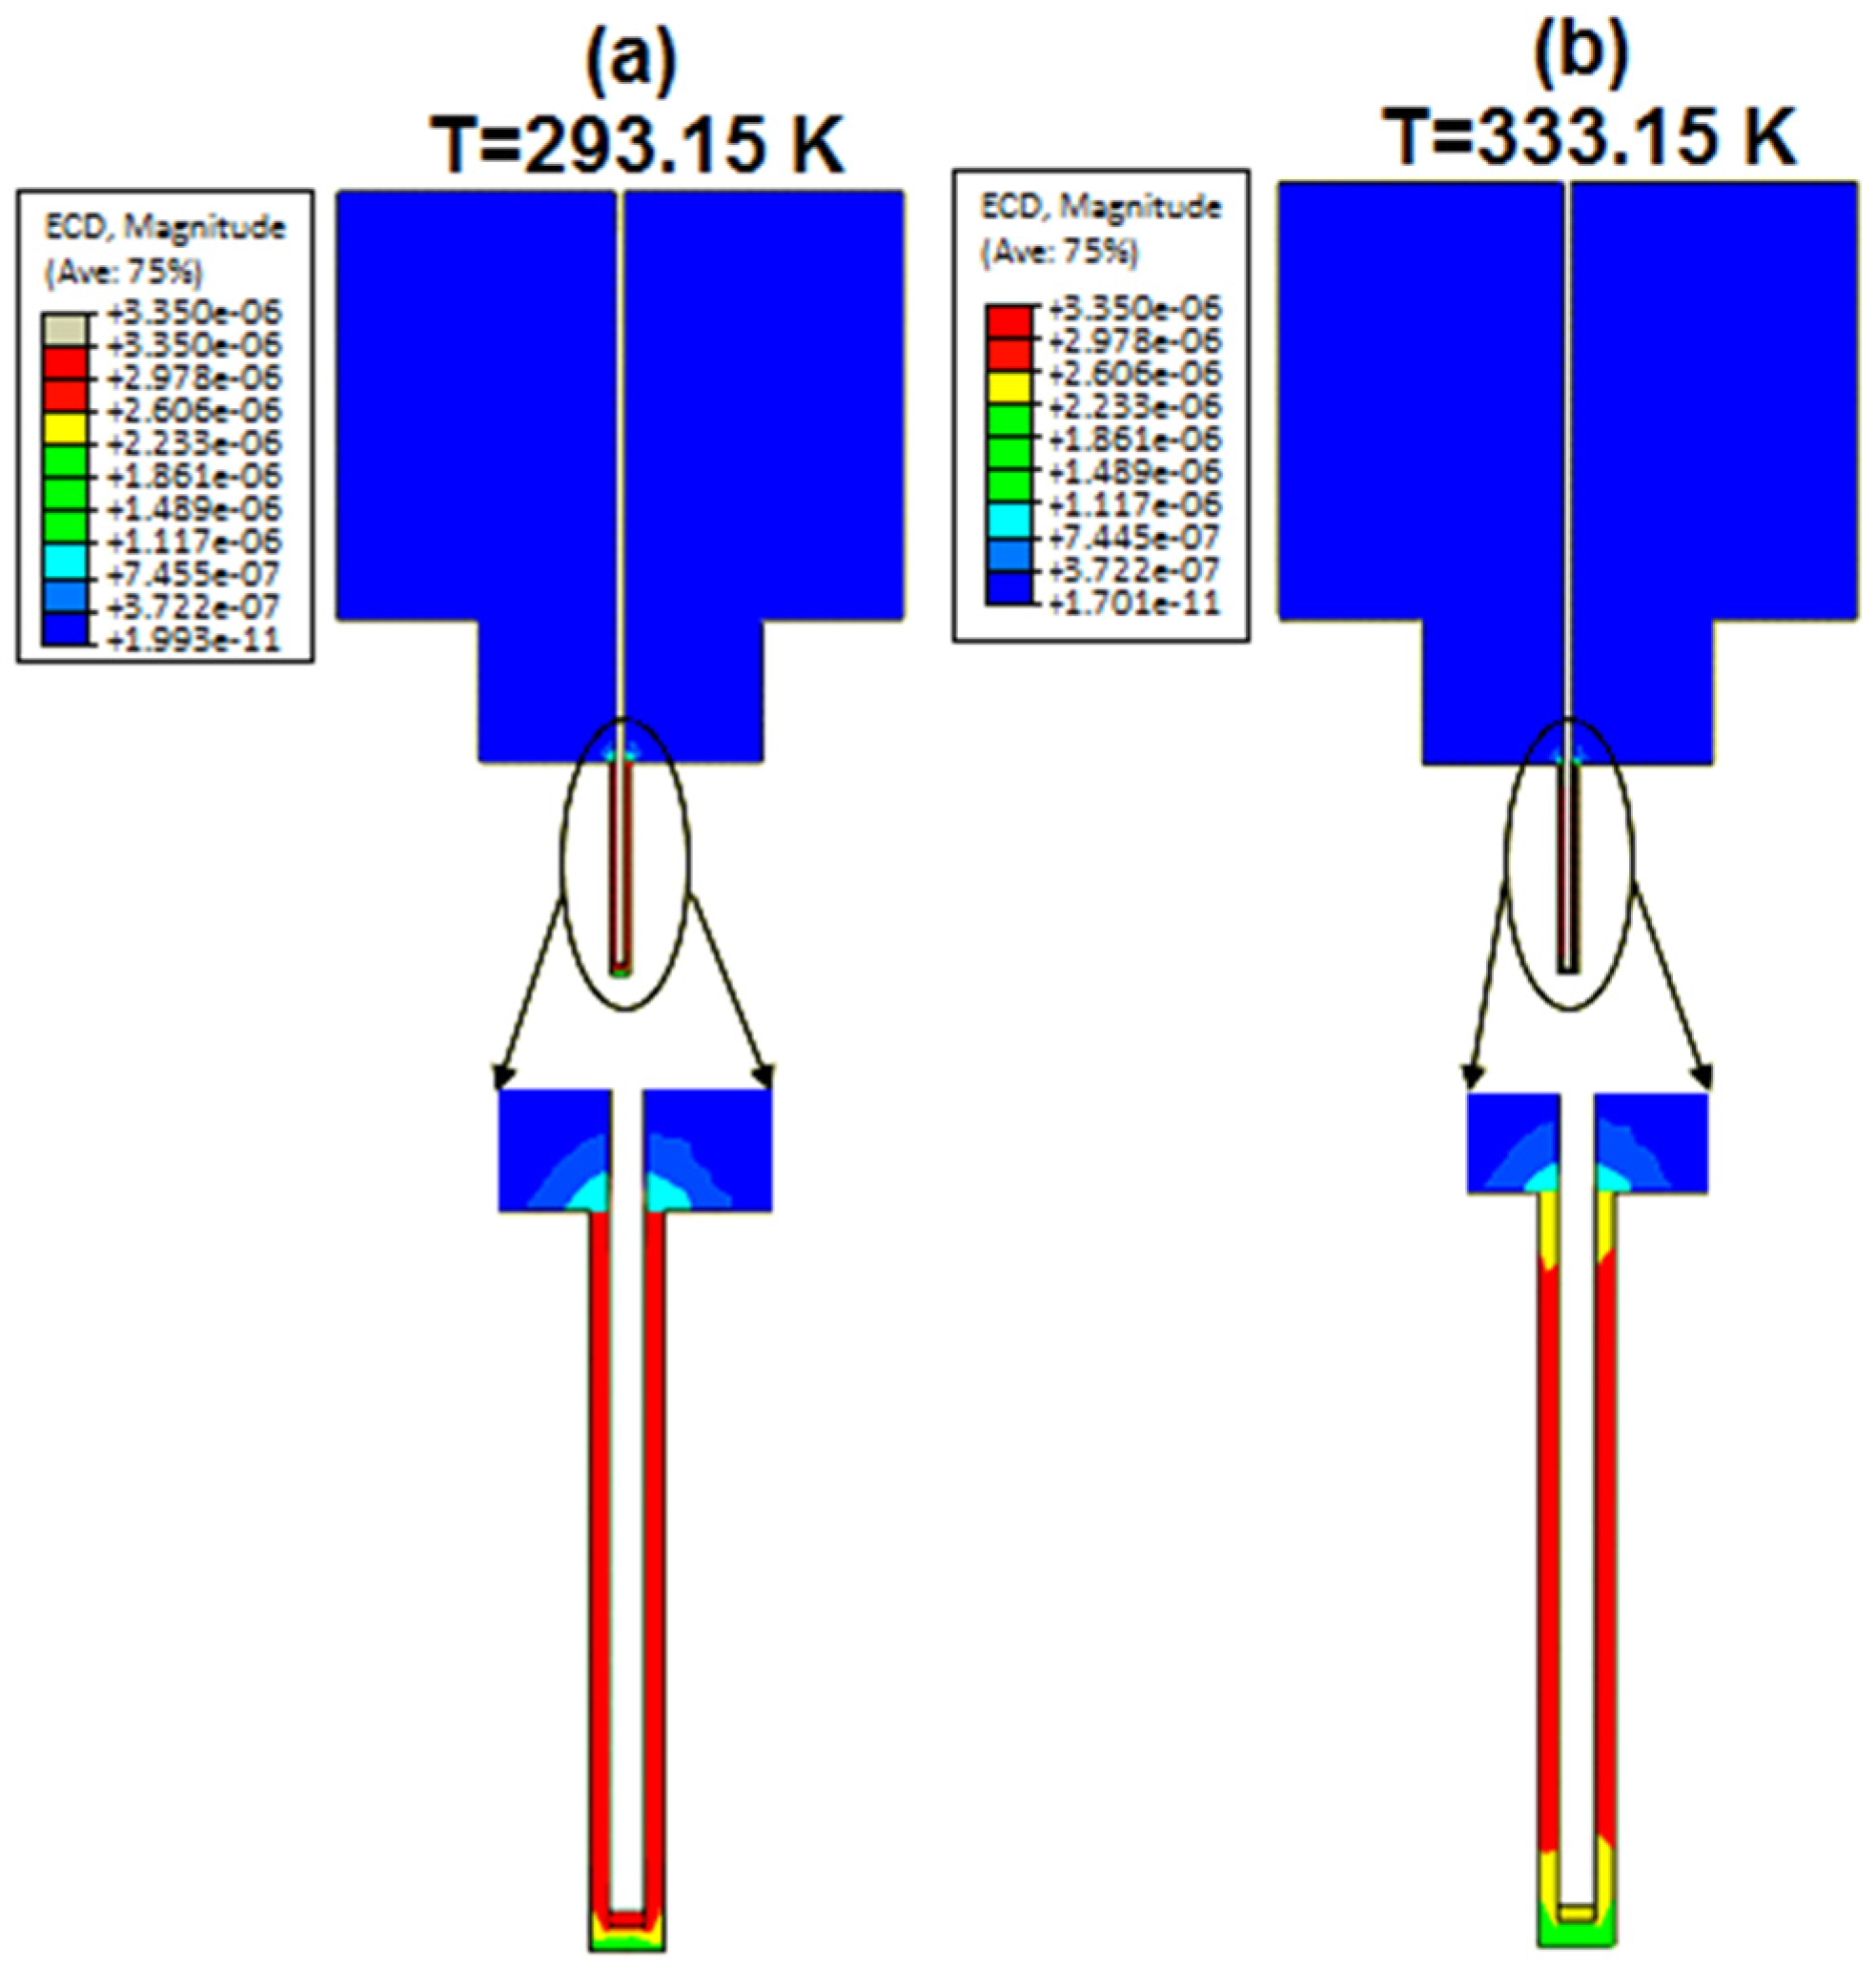
The second stage of the designing was the characterization of the nanoneedle. Thermal/electric characterization was performed in order to characterize the nanoneedle response to temperature and validate whether it follows the concept of the resistance temperature detectors that the design was based on.
Figure 10a,b present the simulation results of the current density of the nanoneedle defined at 293.15 K (room temperature) and 333.15 K. It was observed from the results that the intensity of current density decreased as the temperature increased. The behavior was the same as the resistance temperature detector’s (RTD) response to temperature, which confirms the concept.
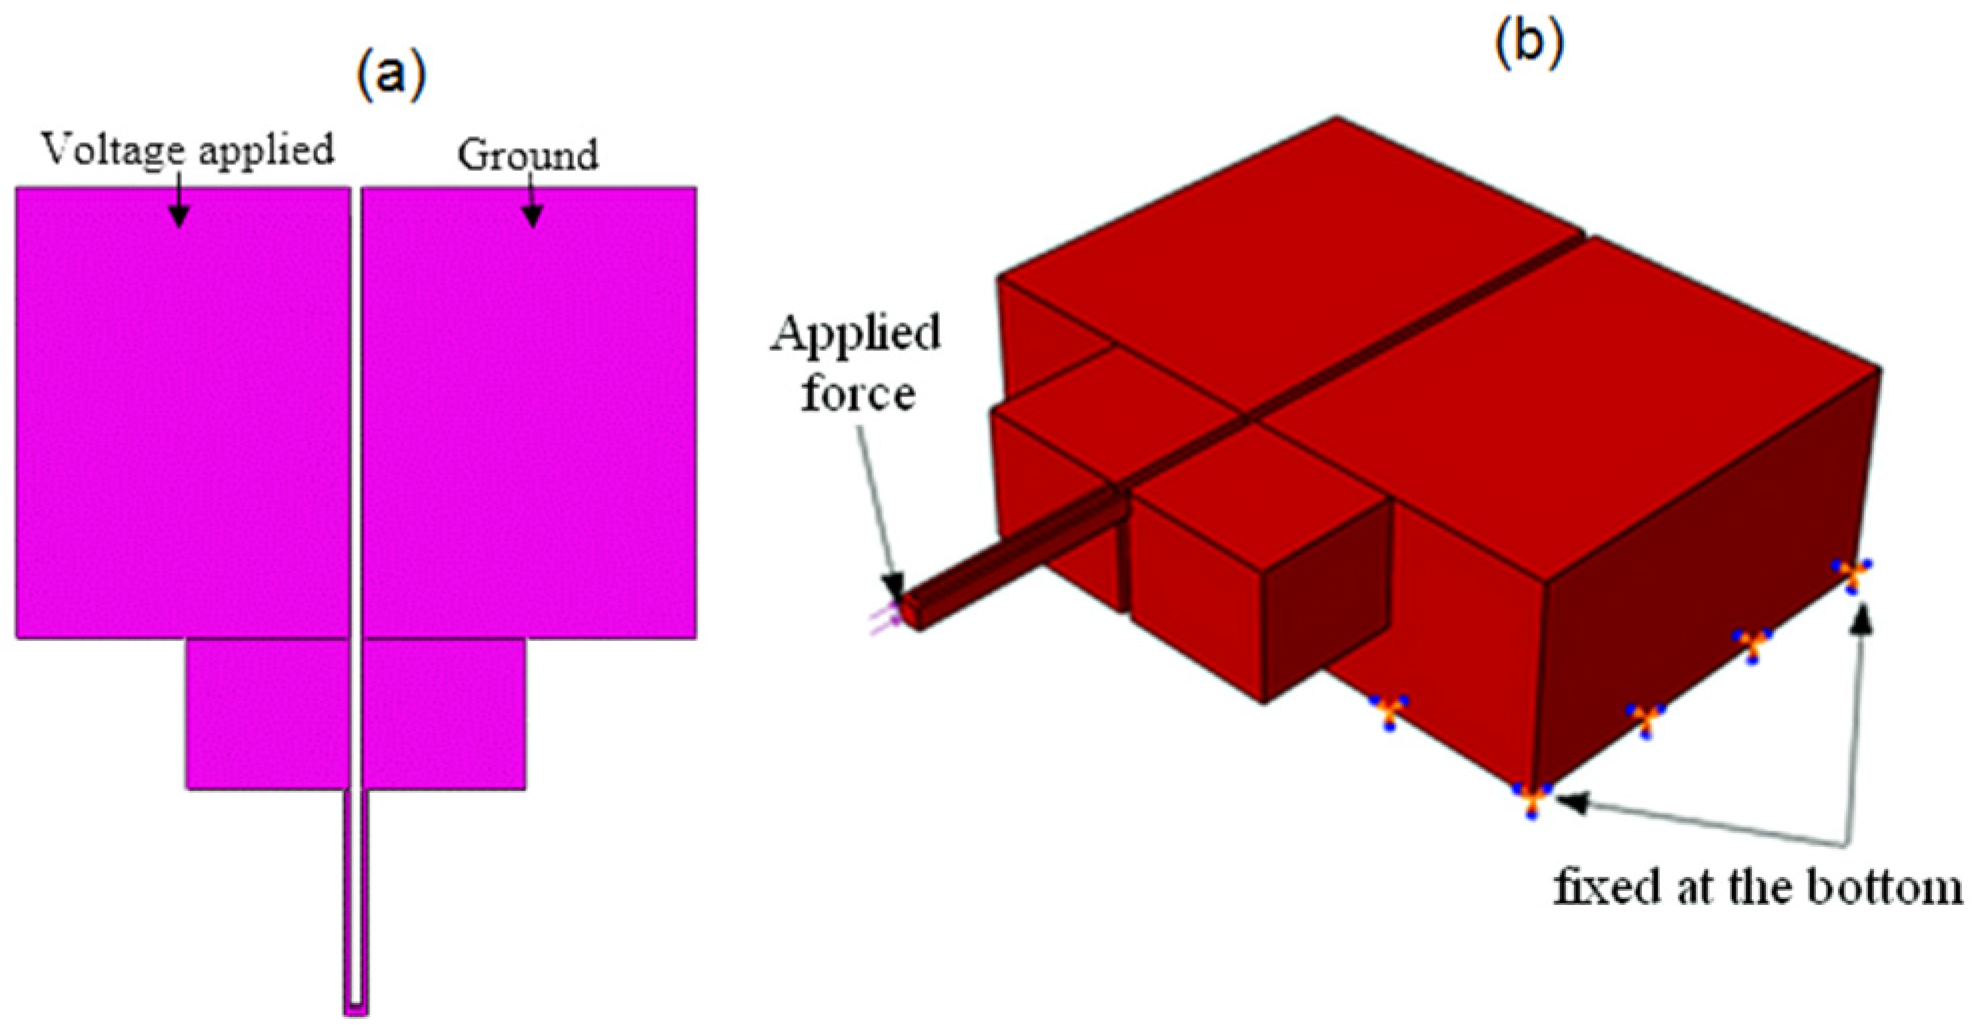
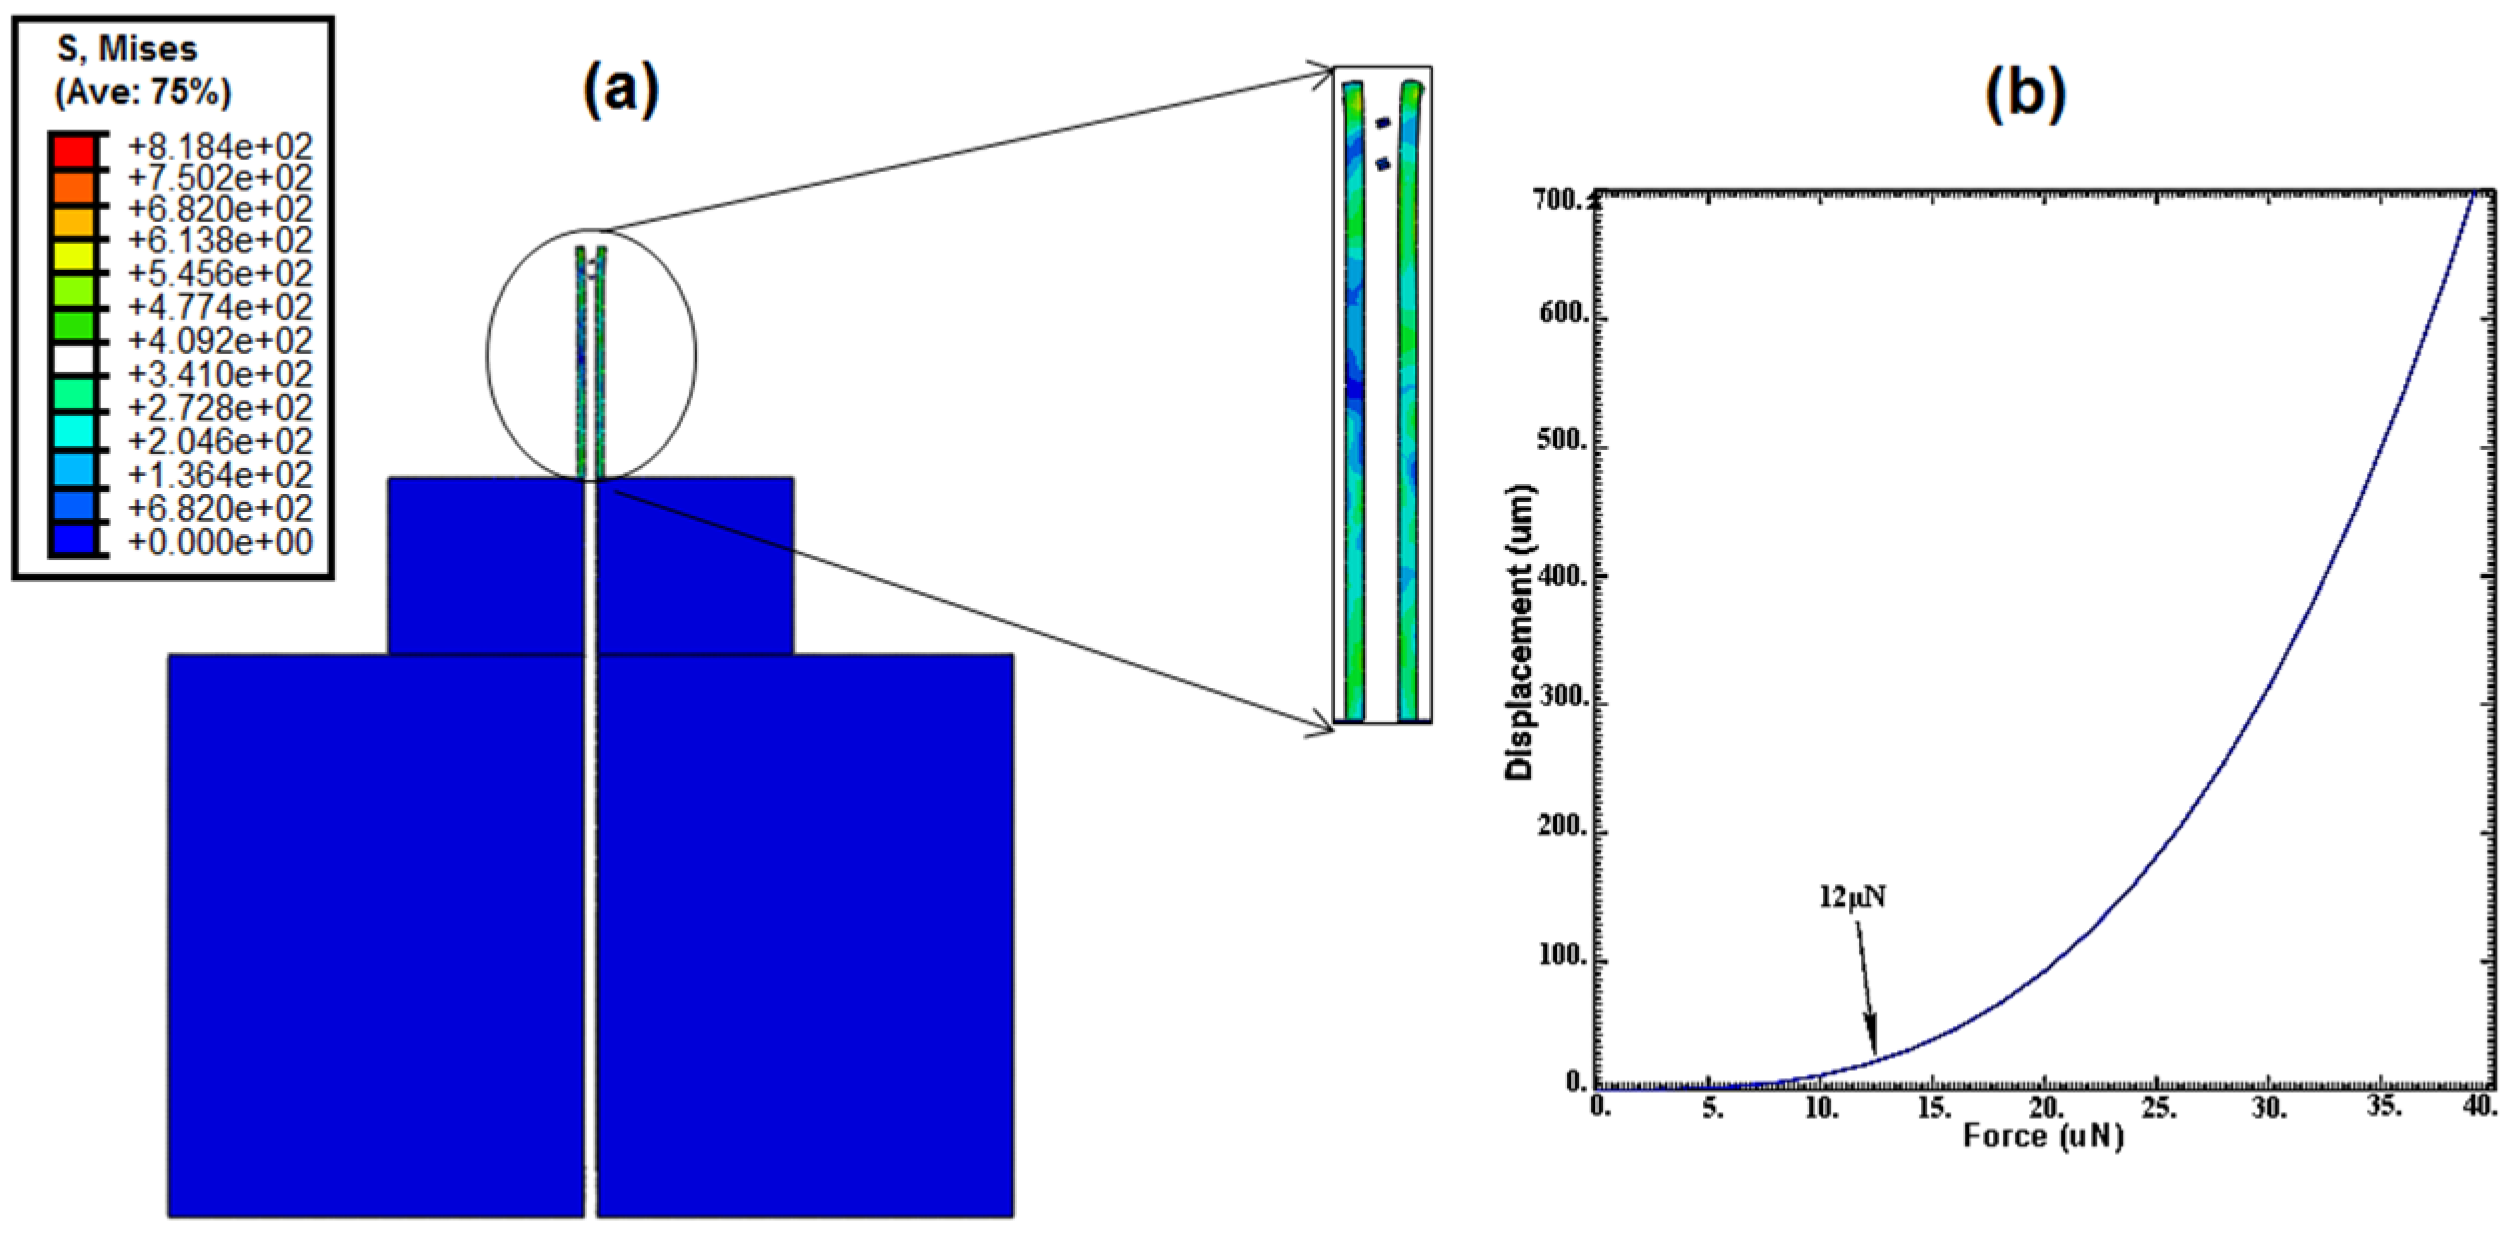
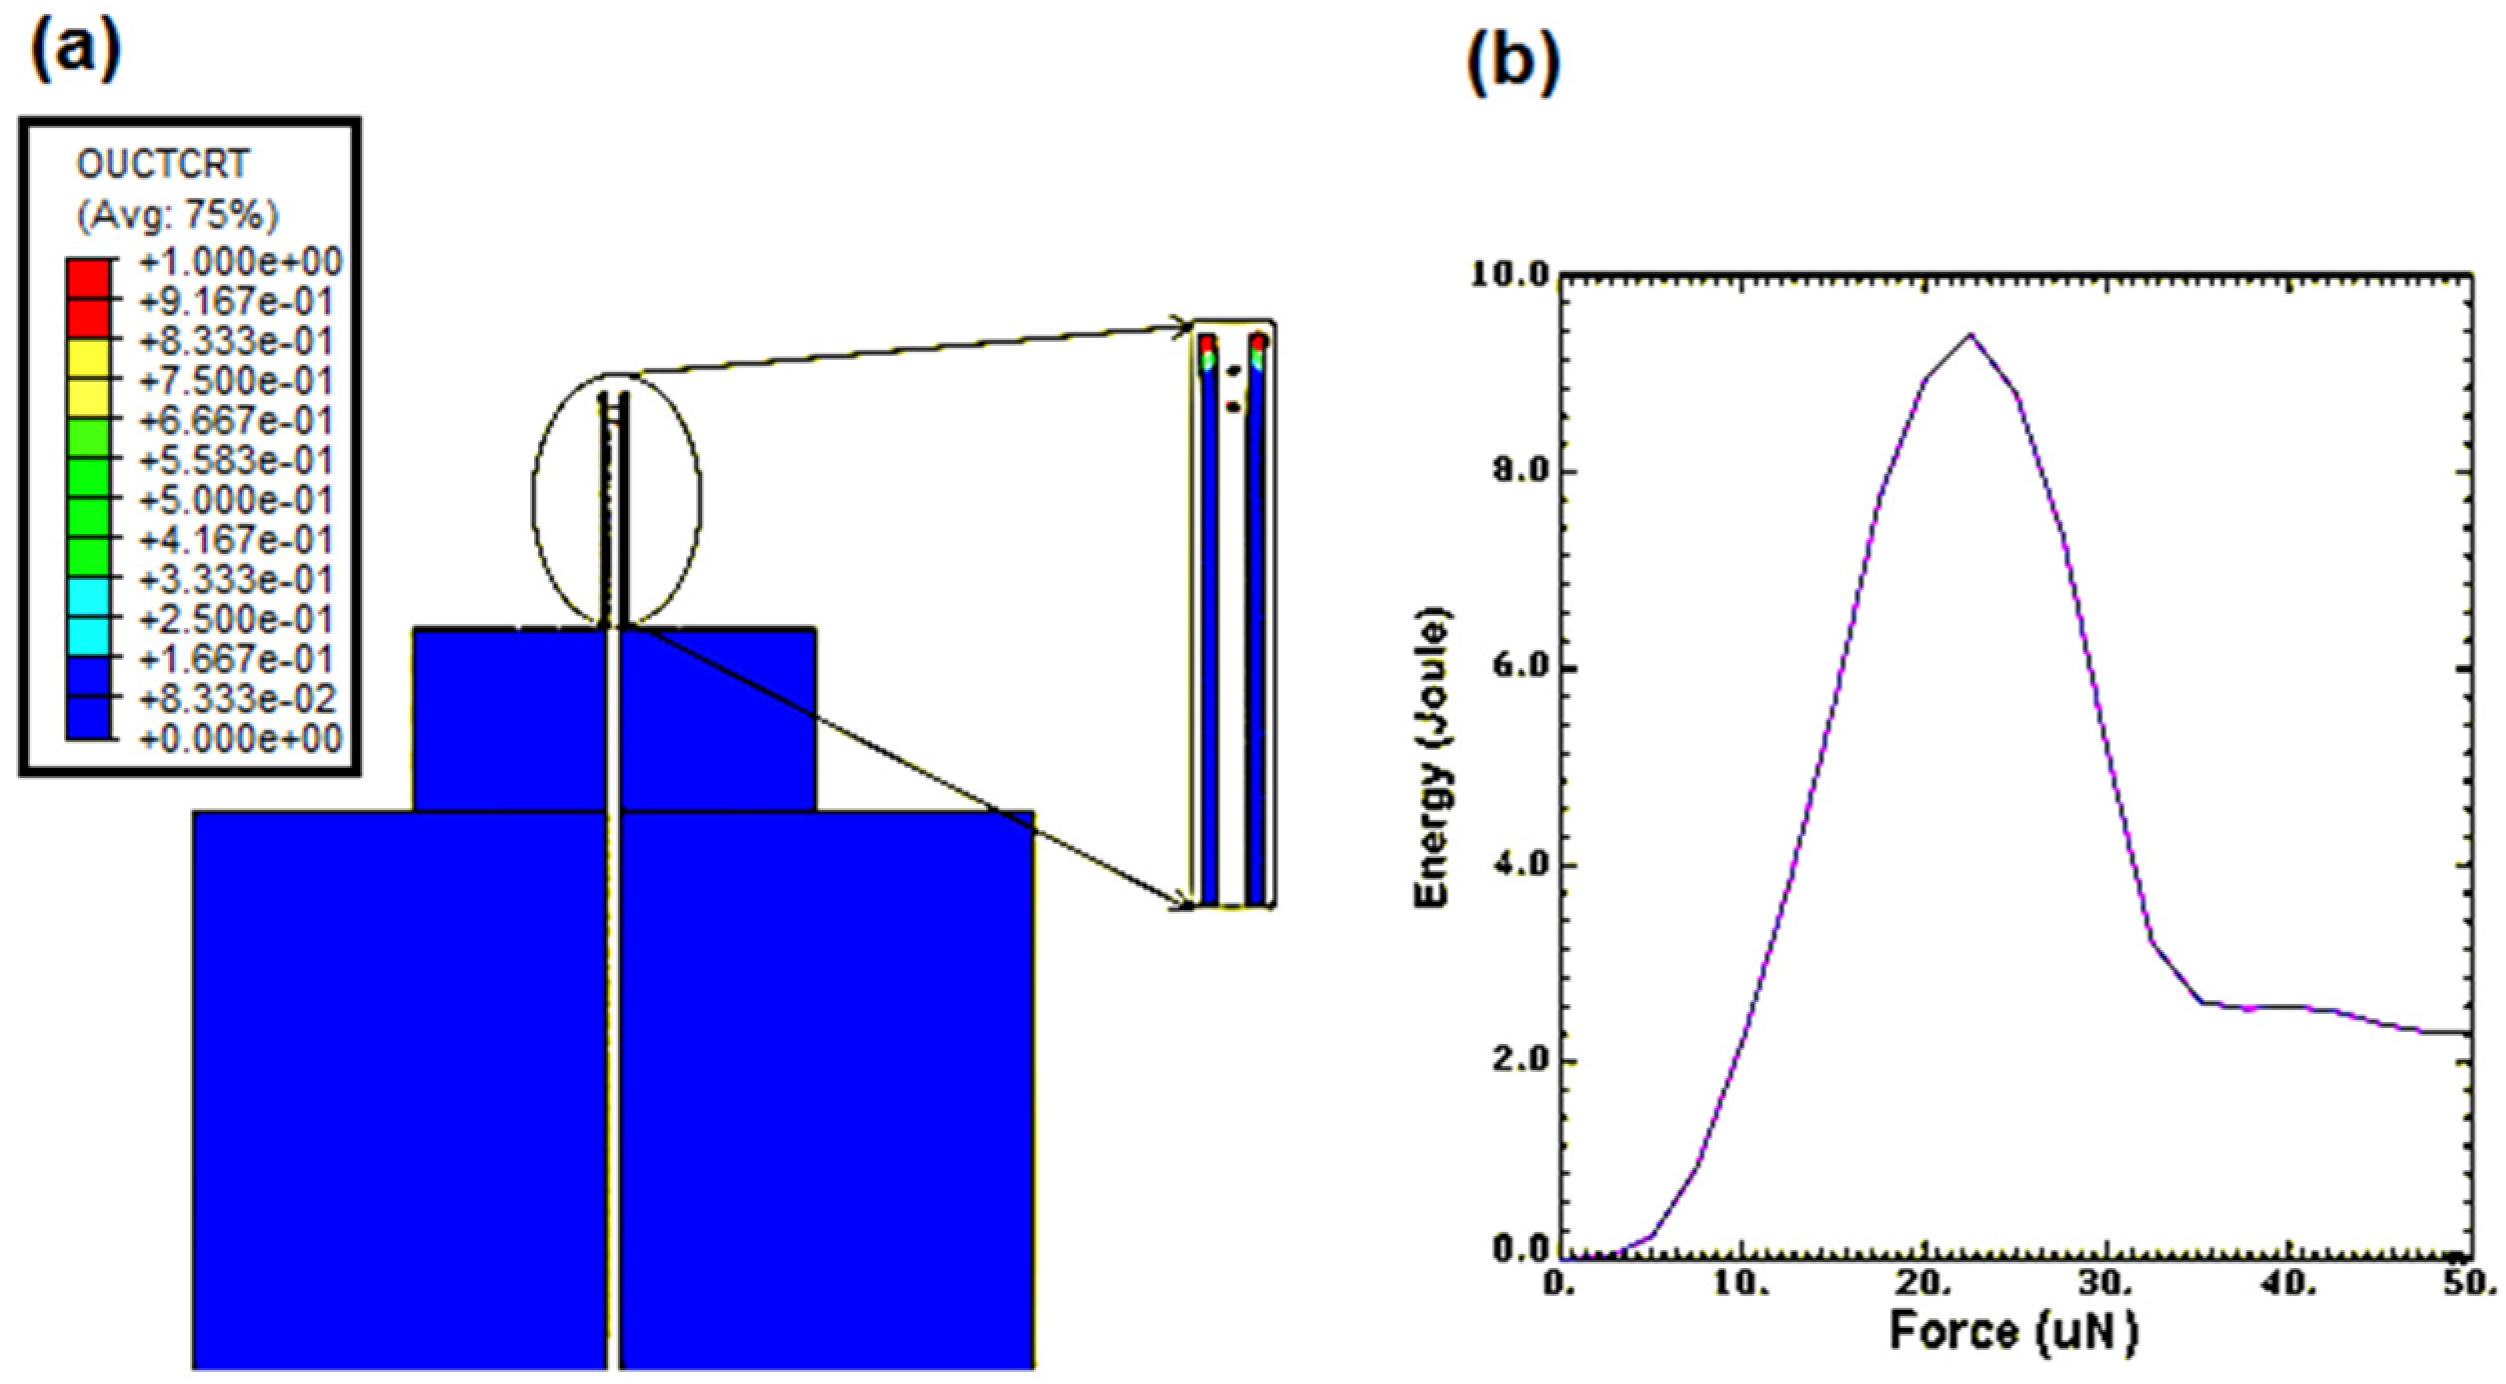
Mechanical characterization of the nanoneedle was done to characterize the needle performance under the effect of external forces. When an external force was applied, pressure was clearly observed at the nanoneedle tip, which indicated the location prone to damage (
Figure 11a). Furthermore, displacement of the nanoneedle tip study was done to determine the effects of the forces applied on the nanoneedle, which will cause it to start to bend (
Figure 11b). The graph showed that as the forces gradually increased, the displacement increased, and would overshoot when the force approximately reached 12 μN. This could be explained that the nanoneedle started to undergo permanent deformation and the bonds between the molecules weakened, which will need to be calibrated to perform successful measurements.
Figure 12a shows the results of the nanoneedle damage. The maximum force that can be applied to the nanoneedle was 22.5 μN. This is sufficient for the purpose of cell penetration in particular yeast cell, as it has been proven that a force of up to 1 μN was needed for yeast cell penetration [
23]. The plot of the strain energy versus the force applied in
Figure 12b further confirmed the force at which the damage occurred since the strain drastically dropped when the force reached 22.5 μN.
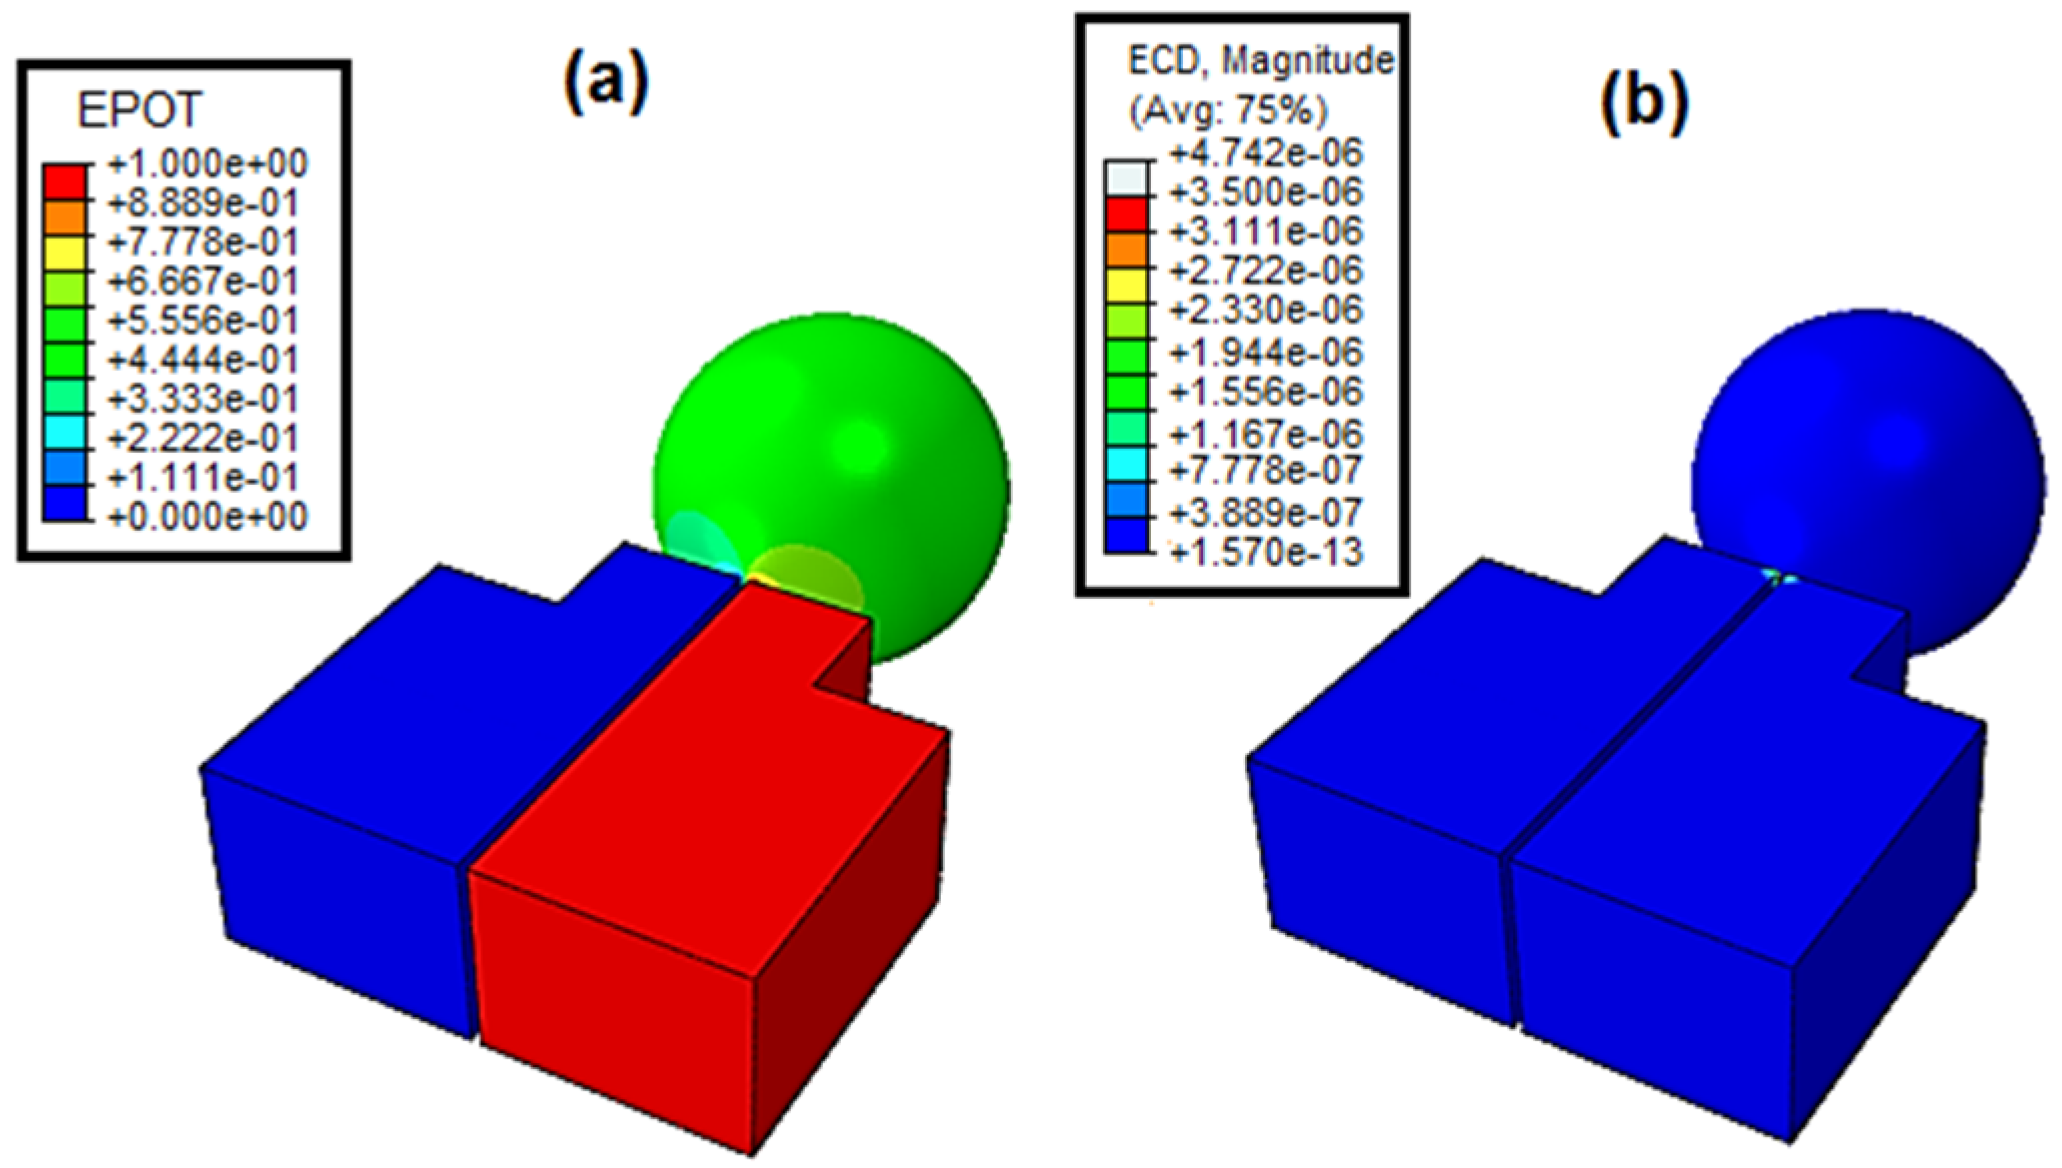
The third stage was the electrical measurement on
S. cerevisiae cell.
Figure 13a,b show the simulation results of the voltage and the current density obtained from the
S. cerevisiae cell electrical measurement.
As shown, the voltage clearly passed through the cell, which means that the voltage drop direction passed through the cell, confirming that the current had a path through the cell. From the current density shown in
Figure 13b, the current density value was not different than the value obtained in
Figure 10, which was done independent of the cell. This confirms that the cell conductivity had no effect on the nanoneedle conductivity. This also could be validated by comparing it to the current measurement of yeast cell obtained in [
23] that was only in 262 pA. To further understand the analysis, a cross-sectional view was taken and presented in
Figure 14a,b. From the results, the color legend clearly showed that the current passed through the nanoneedle and was absolutely independent of the cell conductivity. In addition, the direction the current took to reach the ground shown in
Figure 14b was only within the nanoneedle. This further confirms that the measurement of the temperature is independent of the cell and it is only dependent on the nanoneedle conductivity characteristic and its intrinsic properties that change with the temperature.
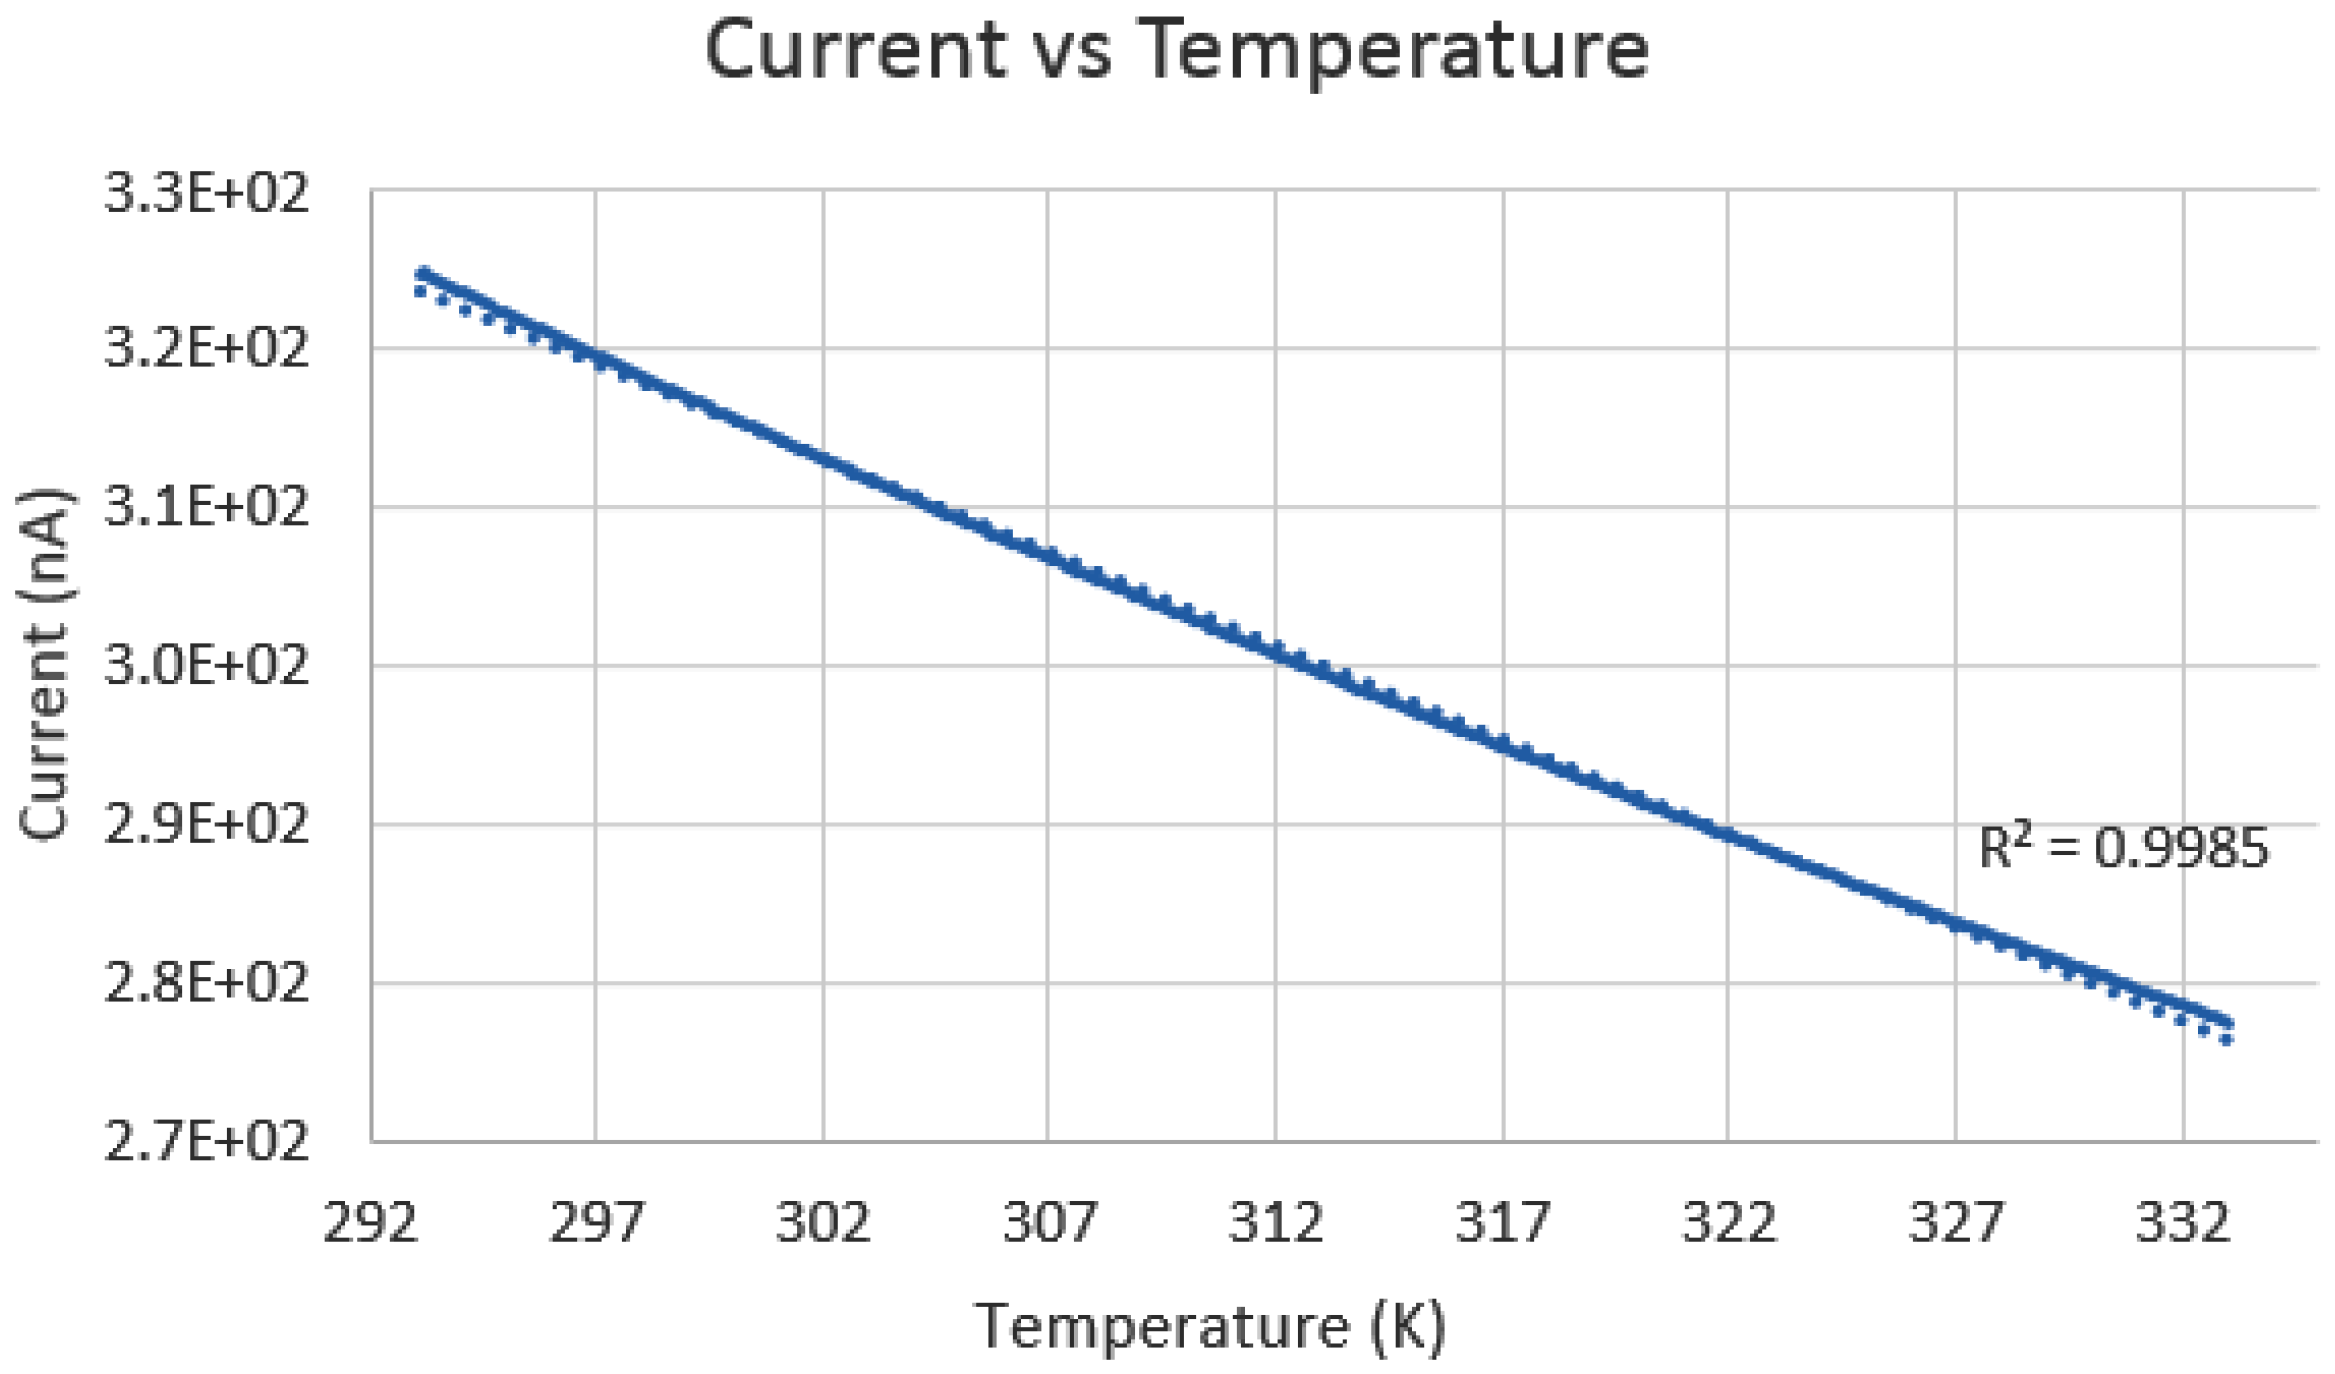
The second analysis was done to determine the temperature detection abilities of the nanoneedle. A plot of the current change as a function of temperature ranging from 293.15–333.15 K is shown in
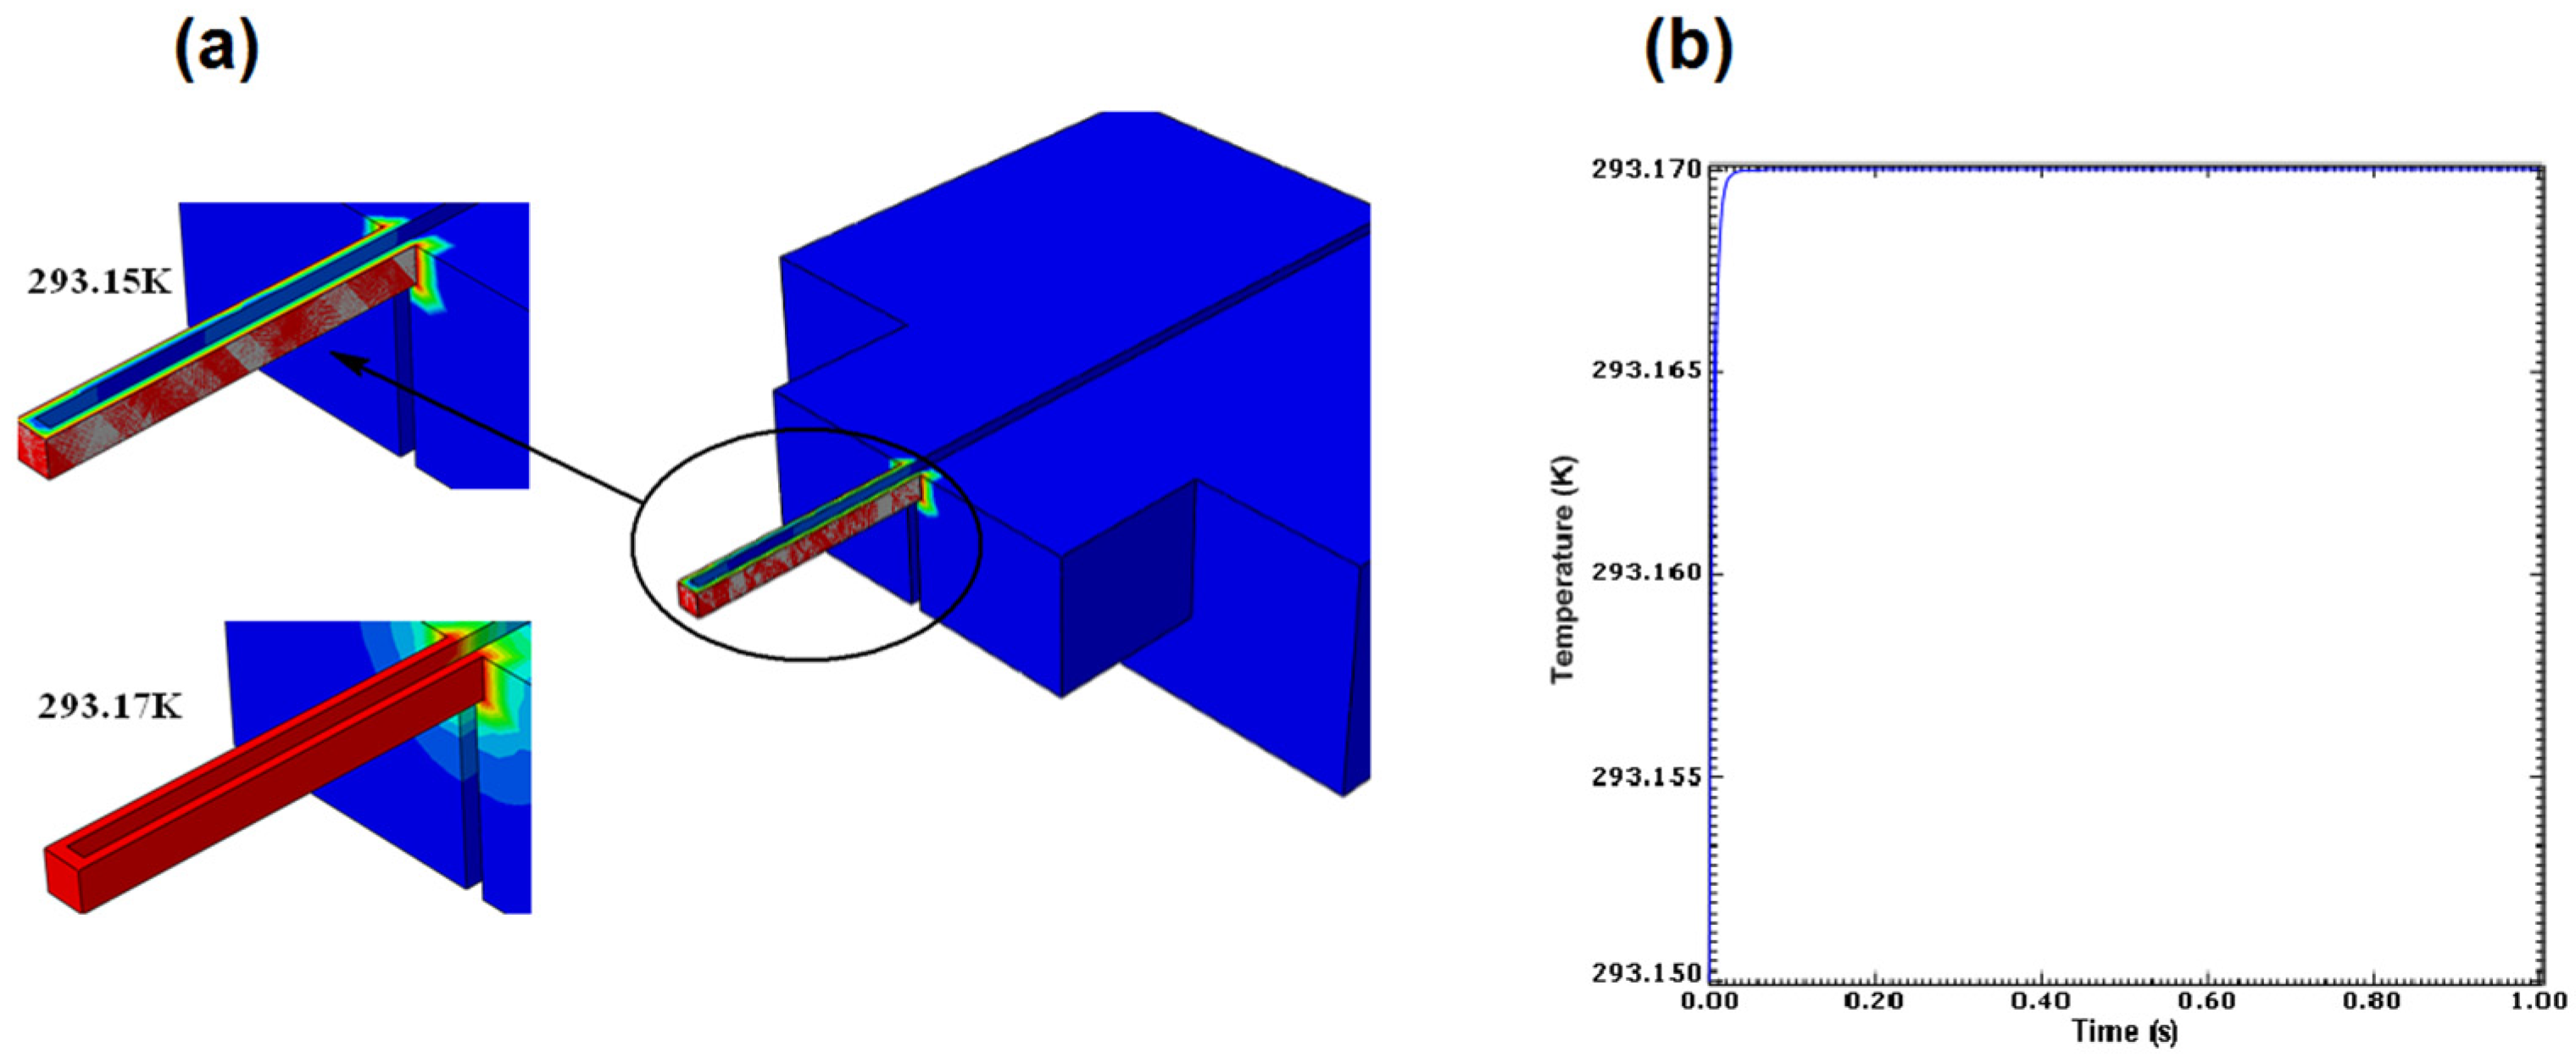
Figure 15. The behavior of the graph showed the same behavior as an RTD with a positive TCR: a decrease in the current as the temperature increased, which has an inverse relation to the resistance. The results confirmed that the nanoneedle was able to detect the temperature in the required range with a sensitivity of 0.015 °C having a difference of approximately 50 nA between the minimum and the maximum temperature. Another study was to examine how fast the nanoneedle responded to temperature change in the surrounding. The temperature difference was set to be 0.02 °C by setting the surrounding temperature to 293.17 K and the temperature of the nanoneedle at 293.15 K.
Figure 16a illustrates the transition the nanoneedle undertook while attempting to come in equilibrium with the surrounding temperature.
Figure 16b shows the temperature response after it came into equilibrium with the surrounding temperature; the plot showed that the nanoneedle took 10 ms to come in equilibrium with the surrounding temperature. The results presented show that the nanoneedle can react to temperature in a very fast time with high sensitivity, which is very important in single cell temperature measurements.
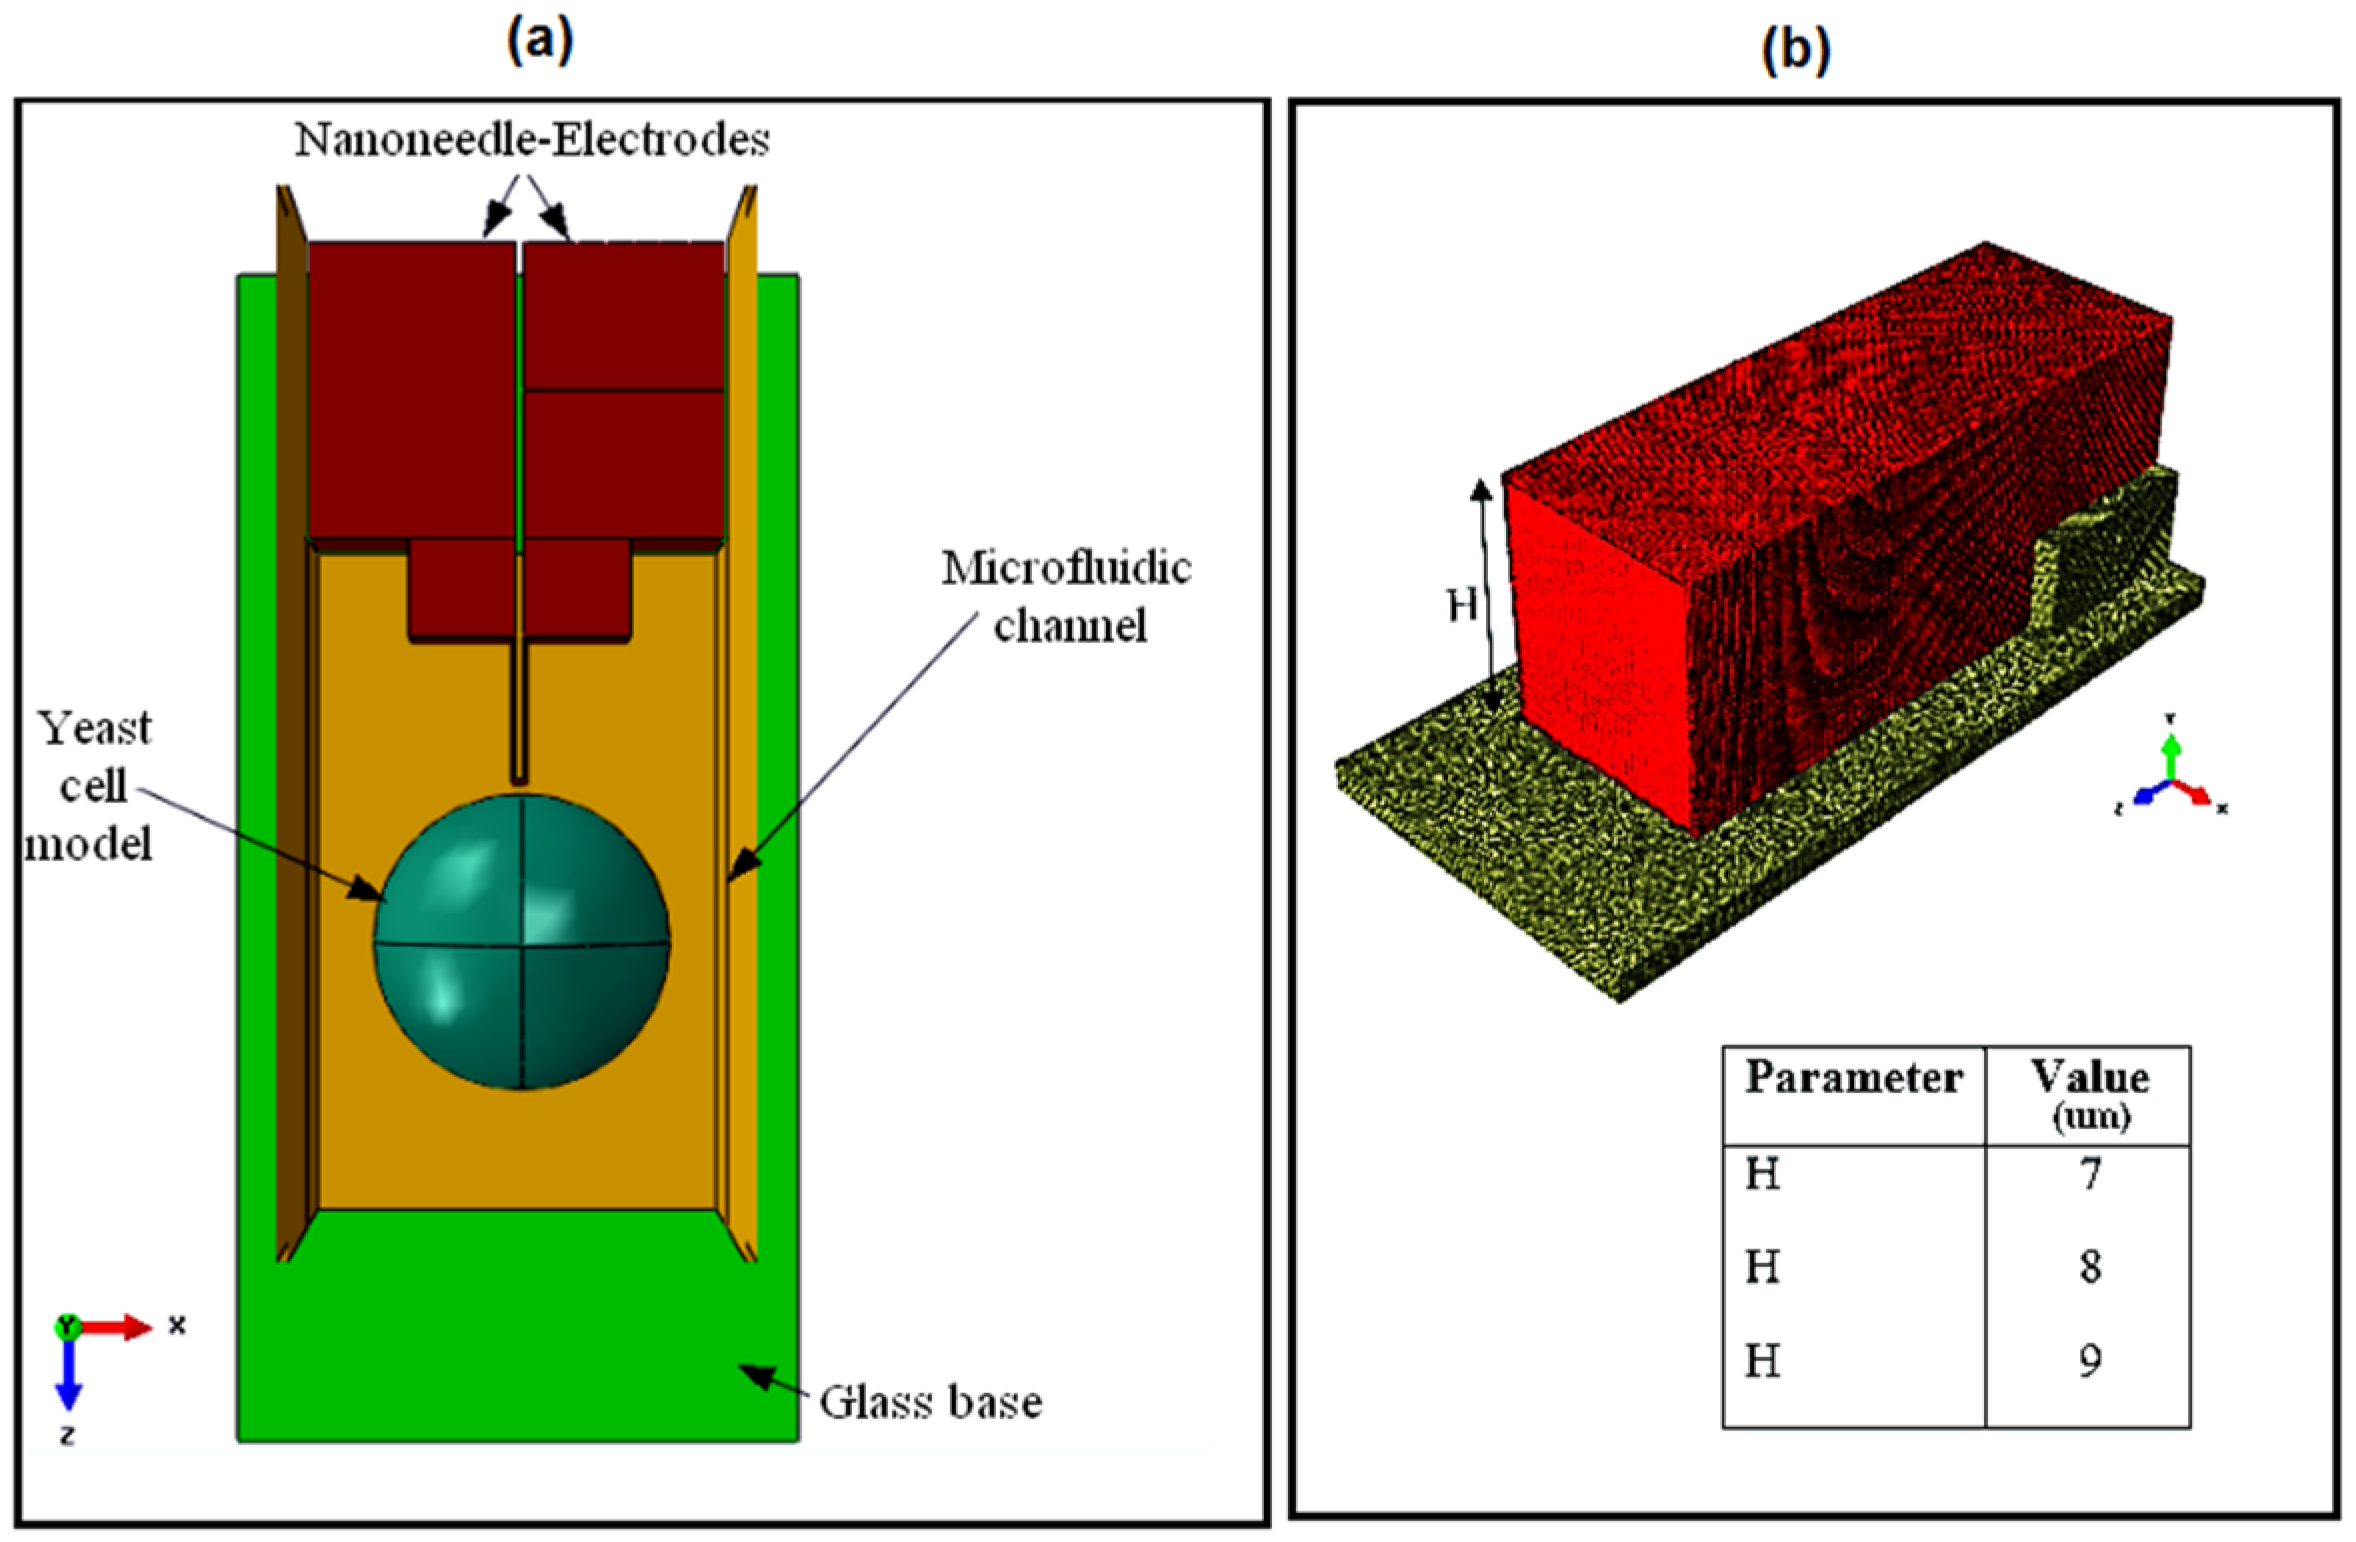
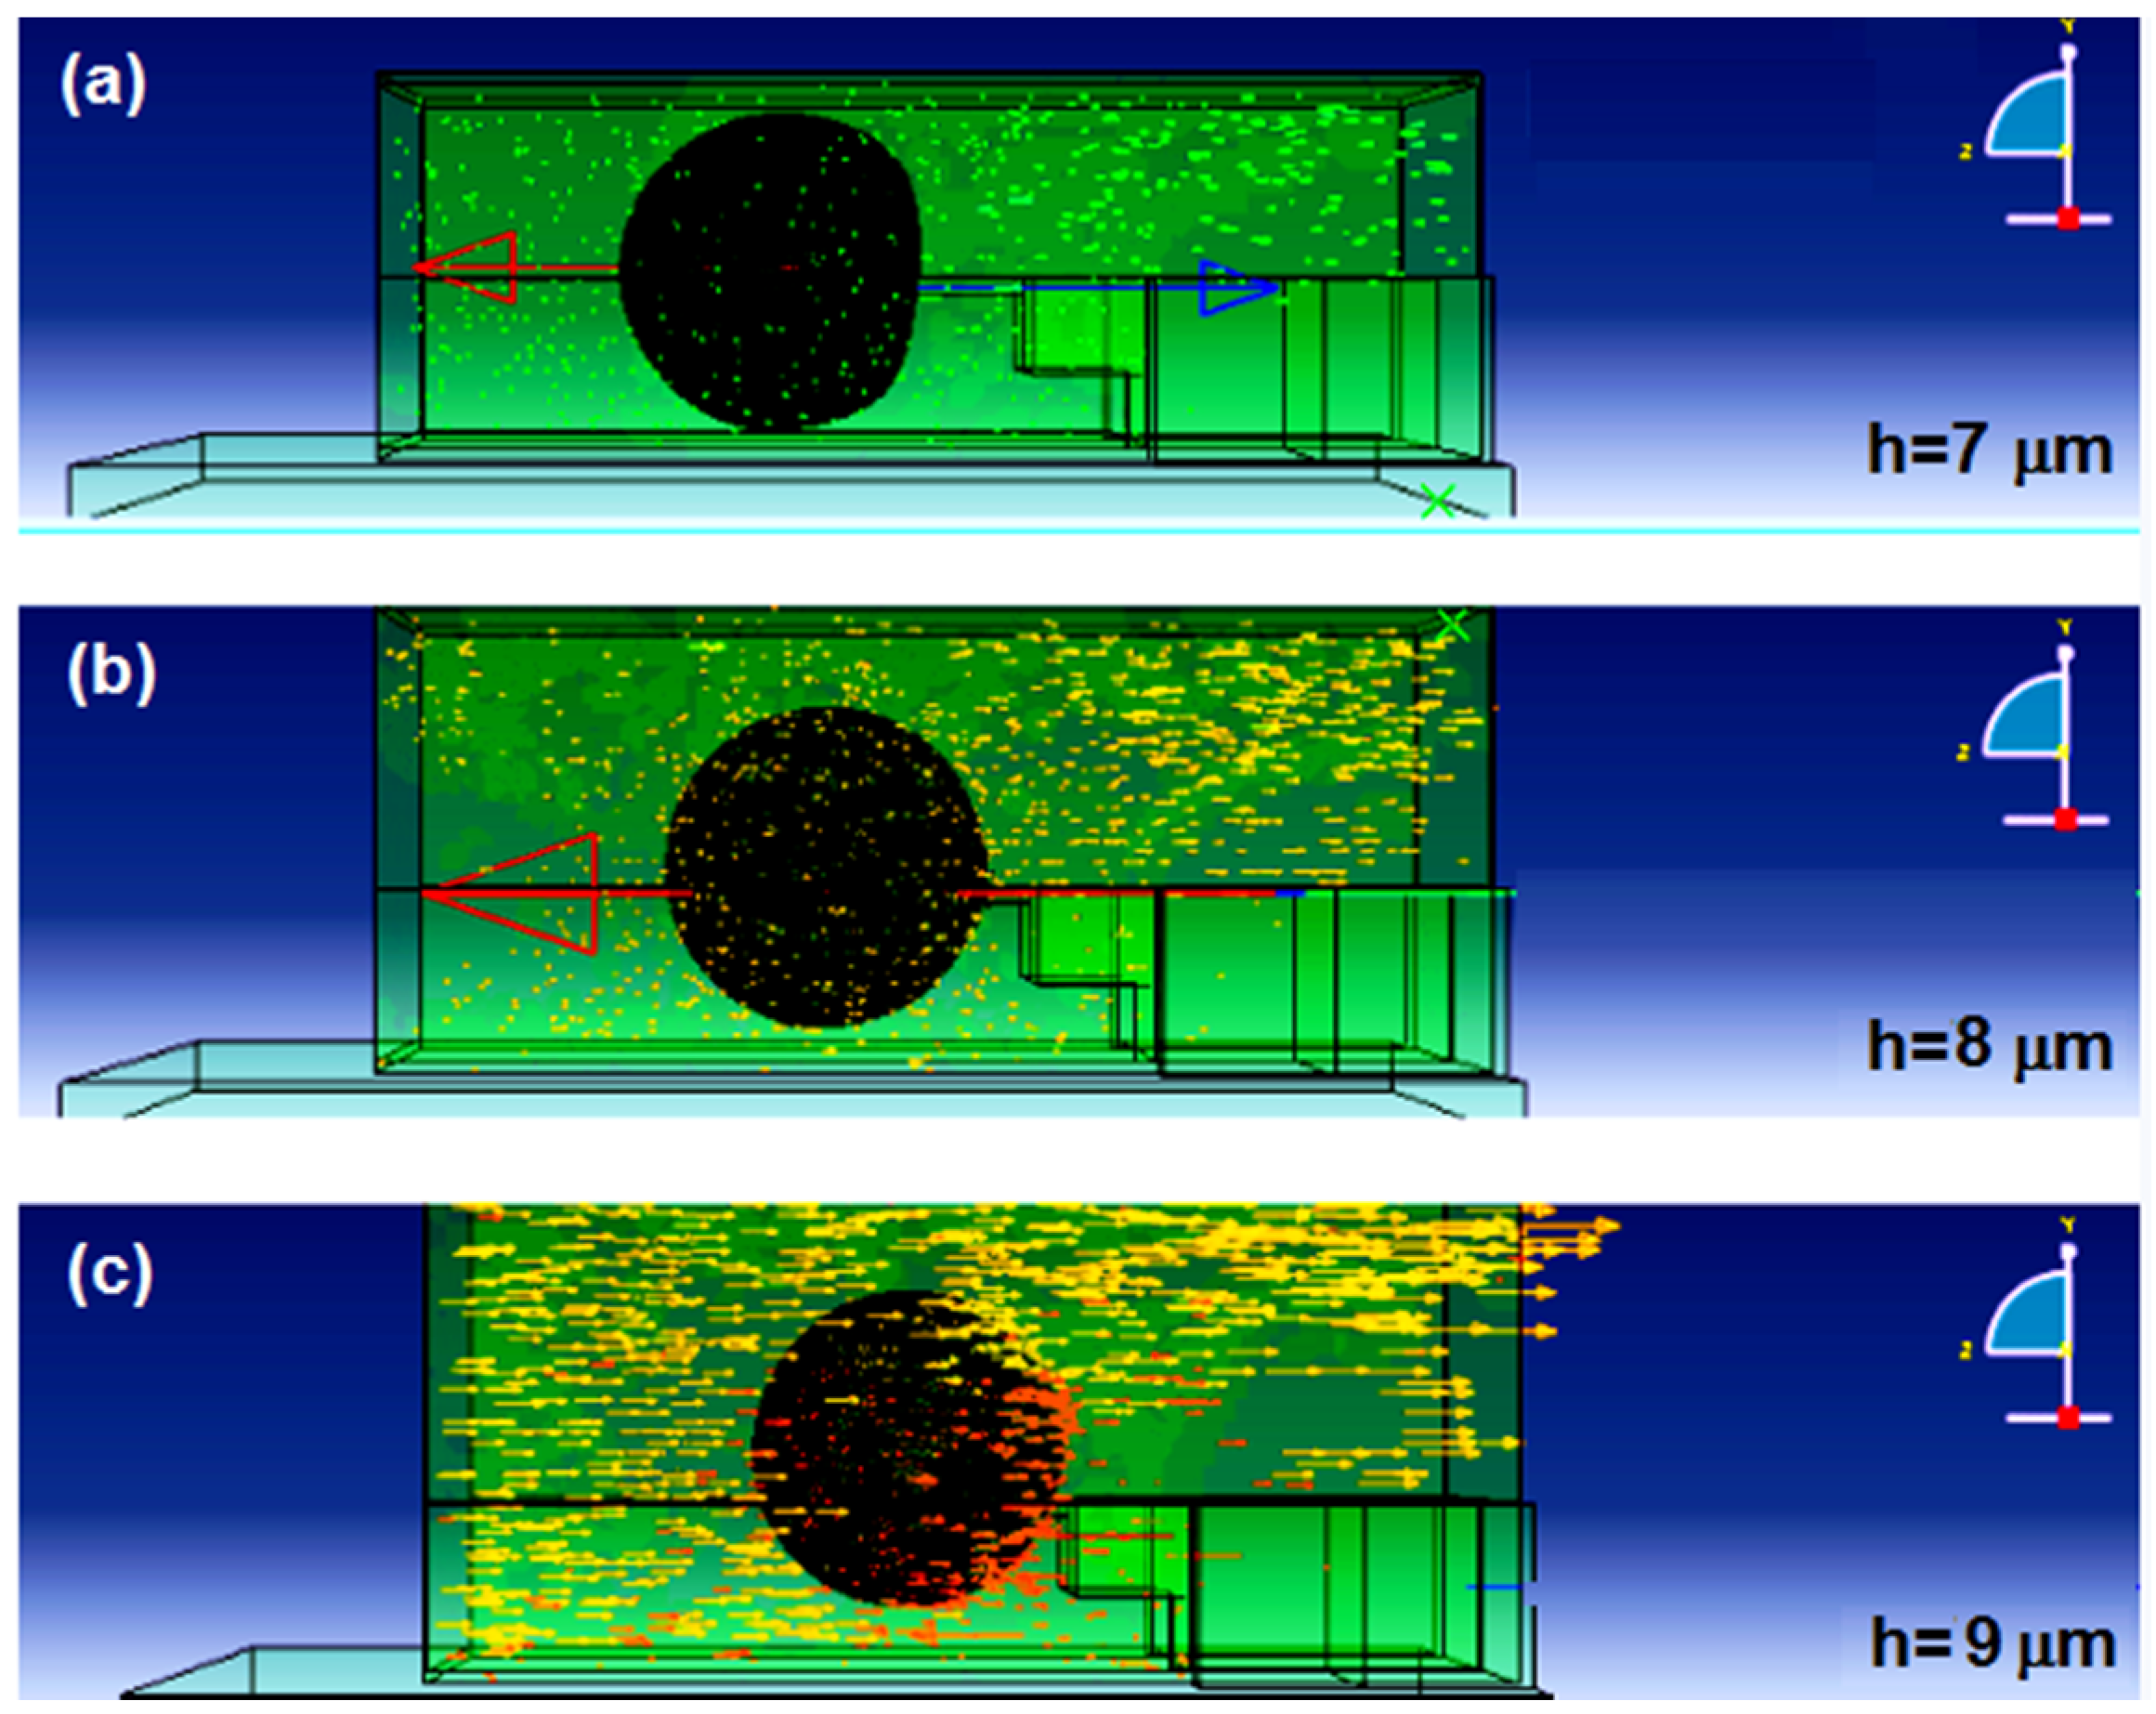
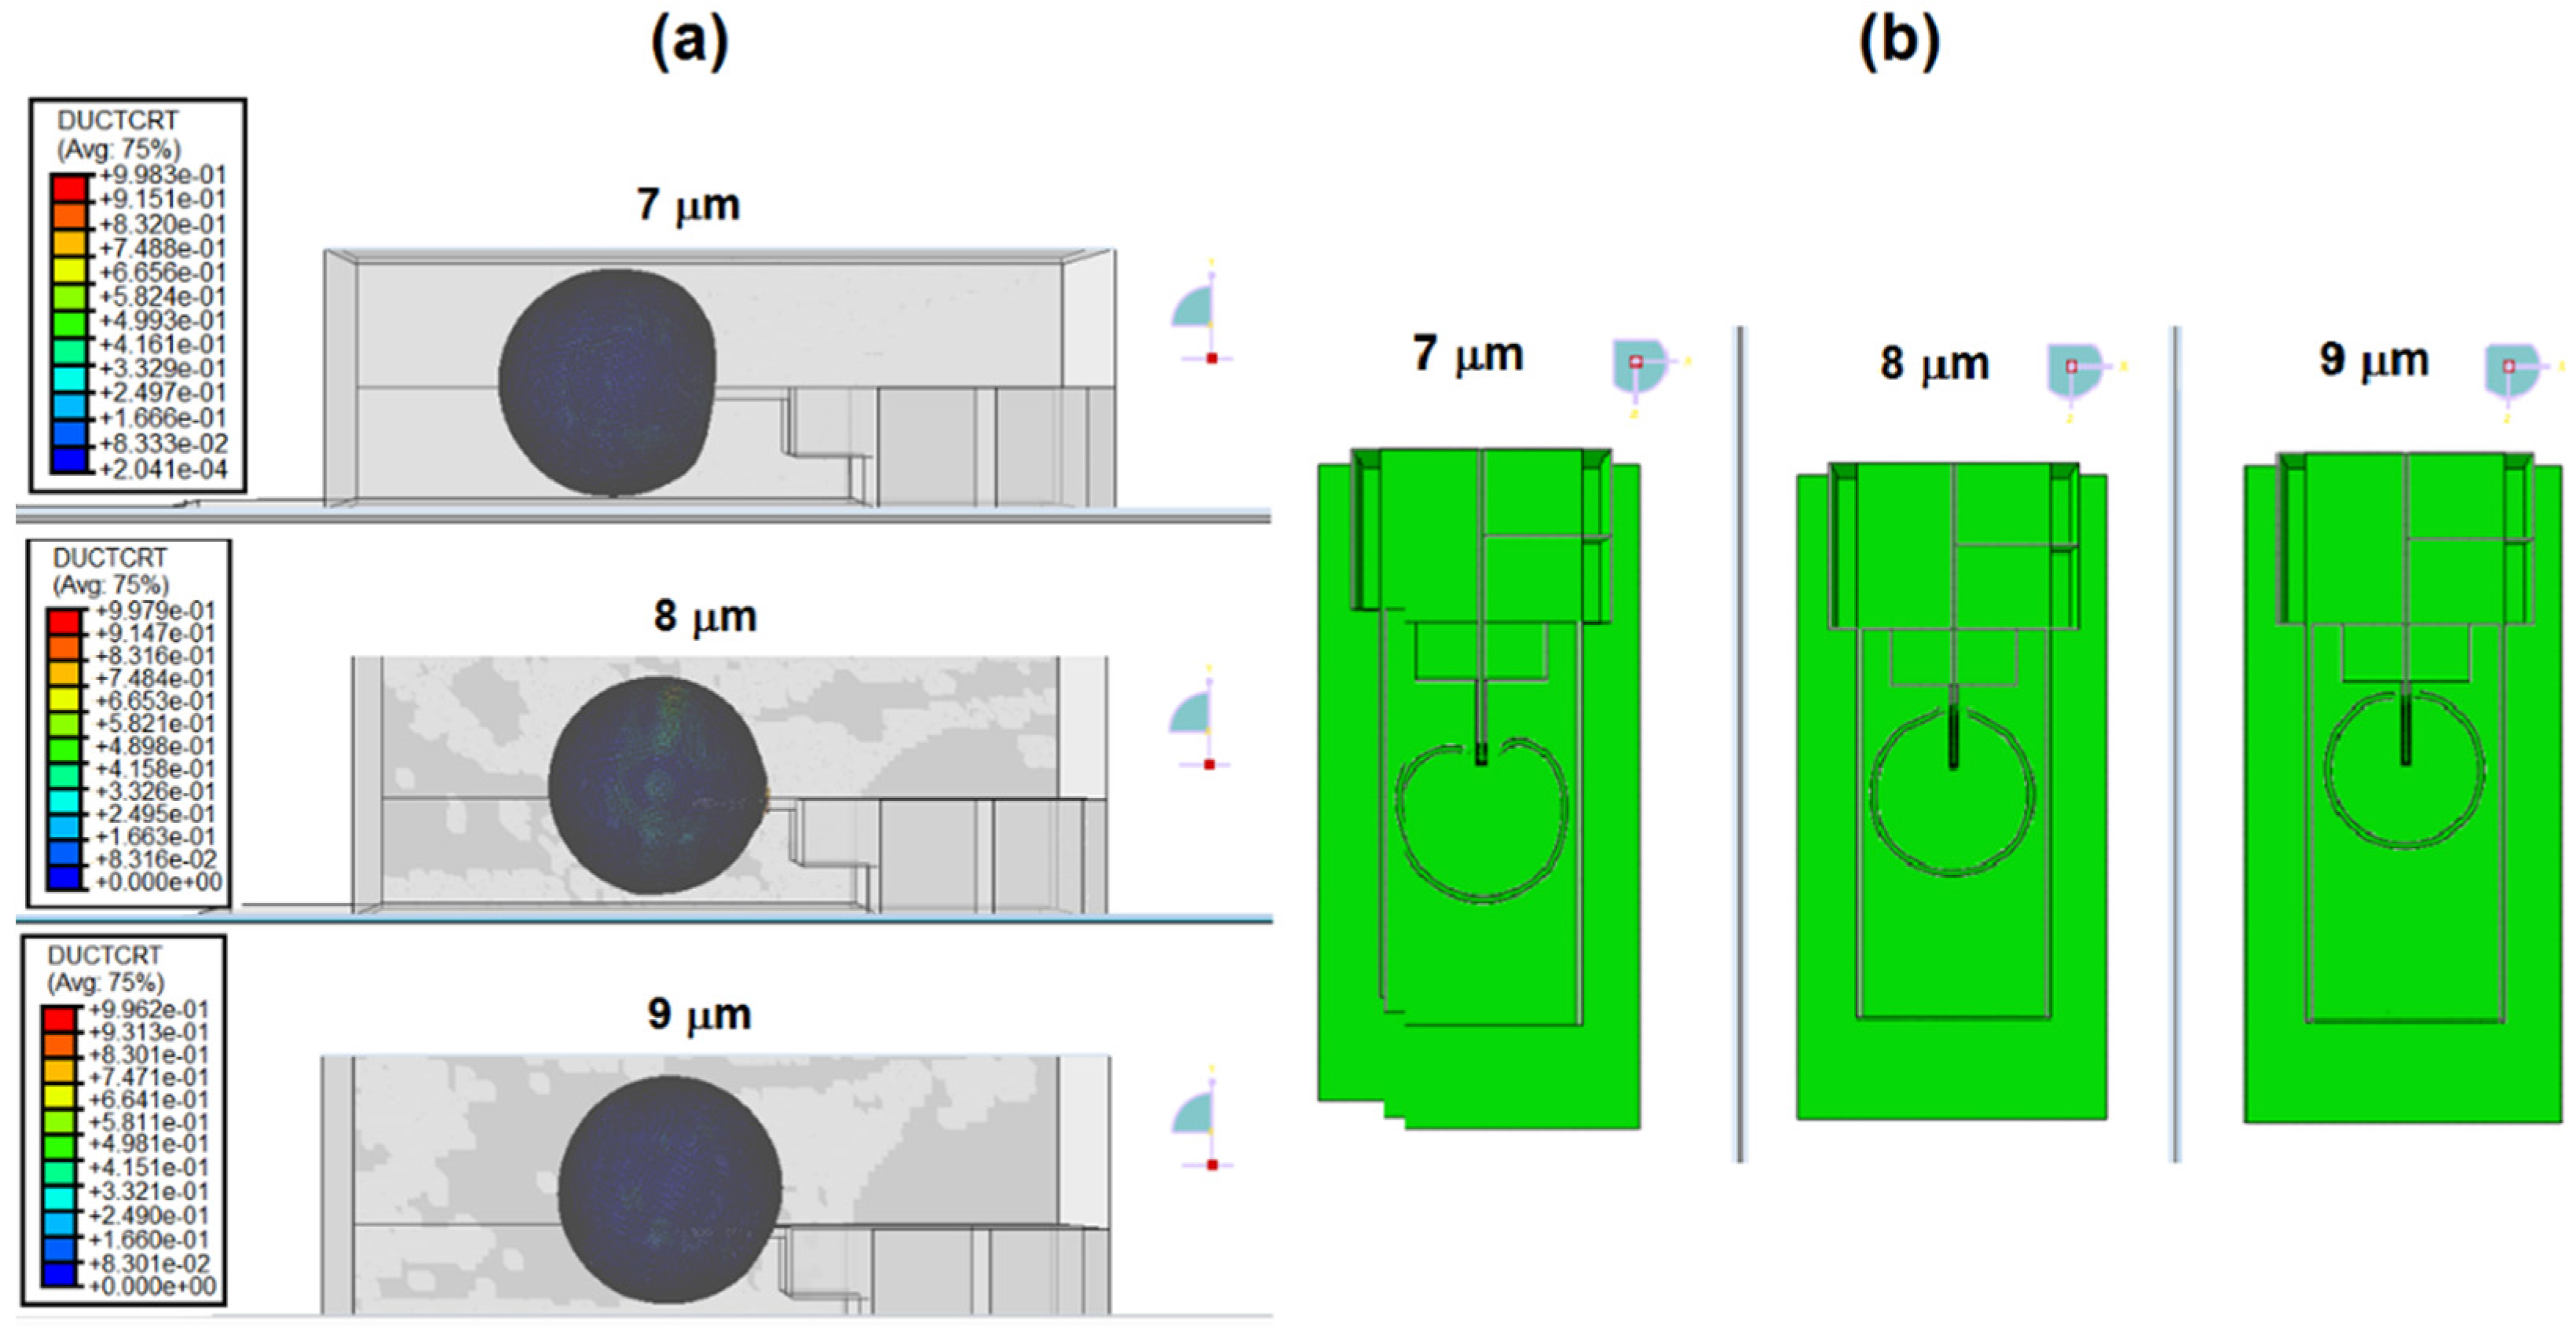
The fourth stage of the analysis was to optimize the microchannel height and the velocity for successful penetration.
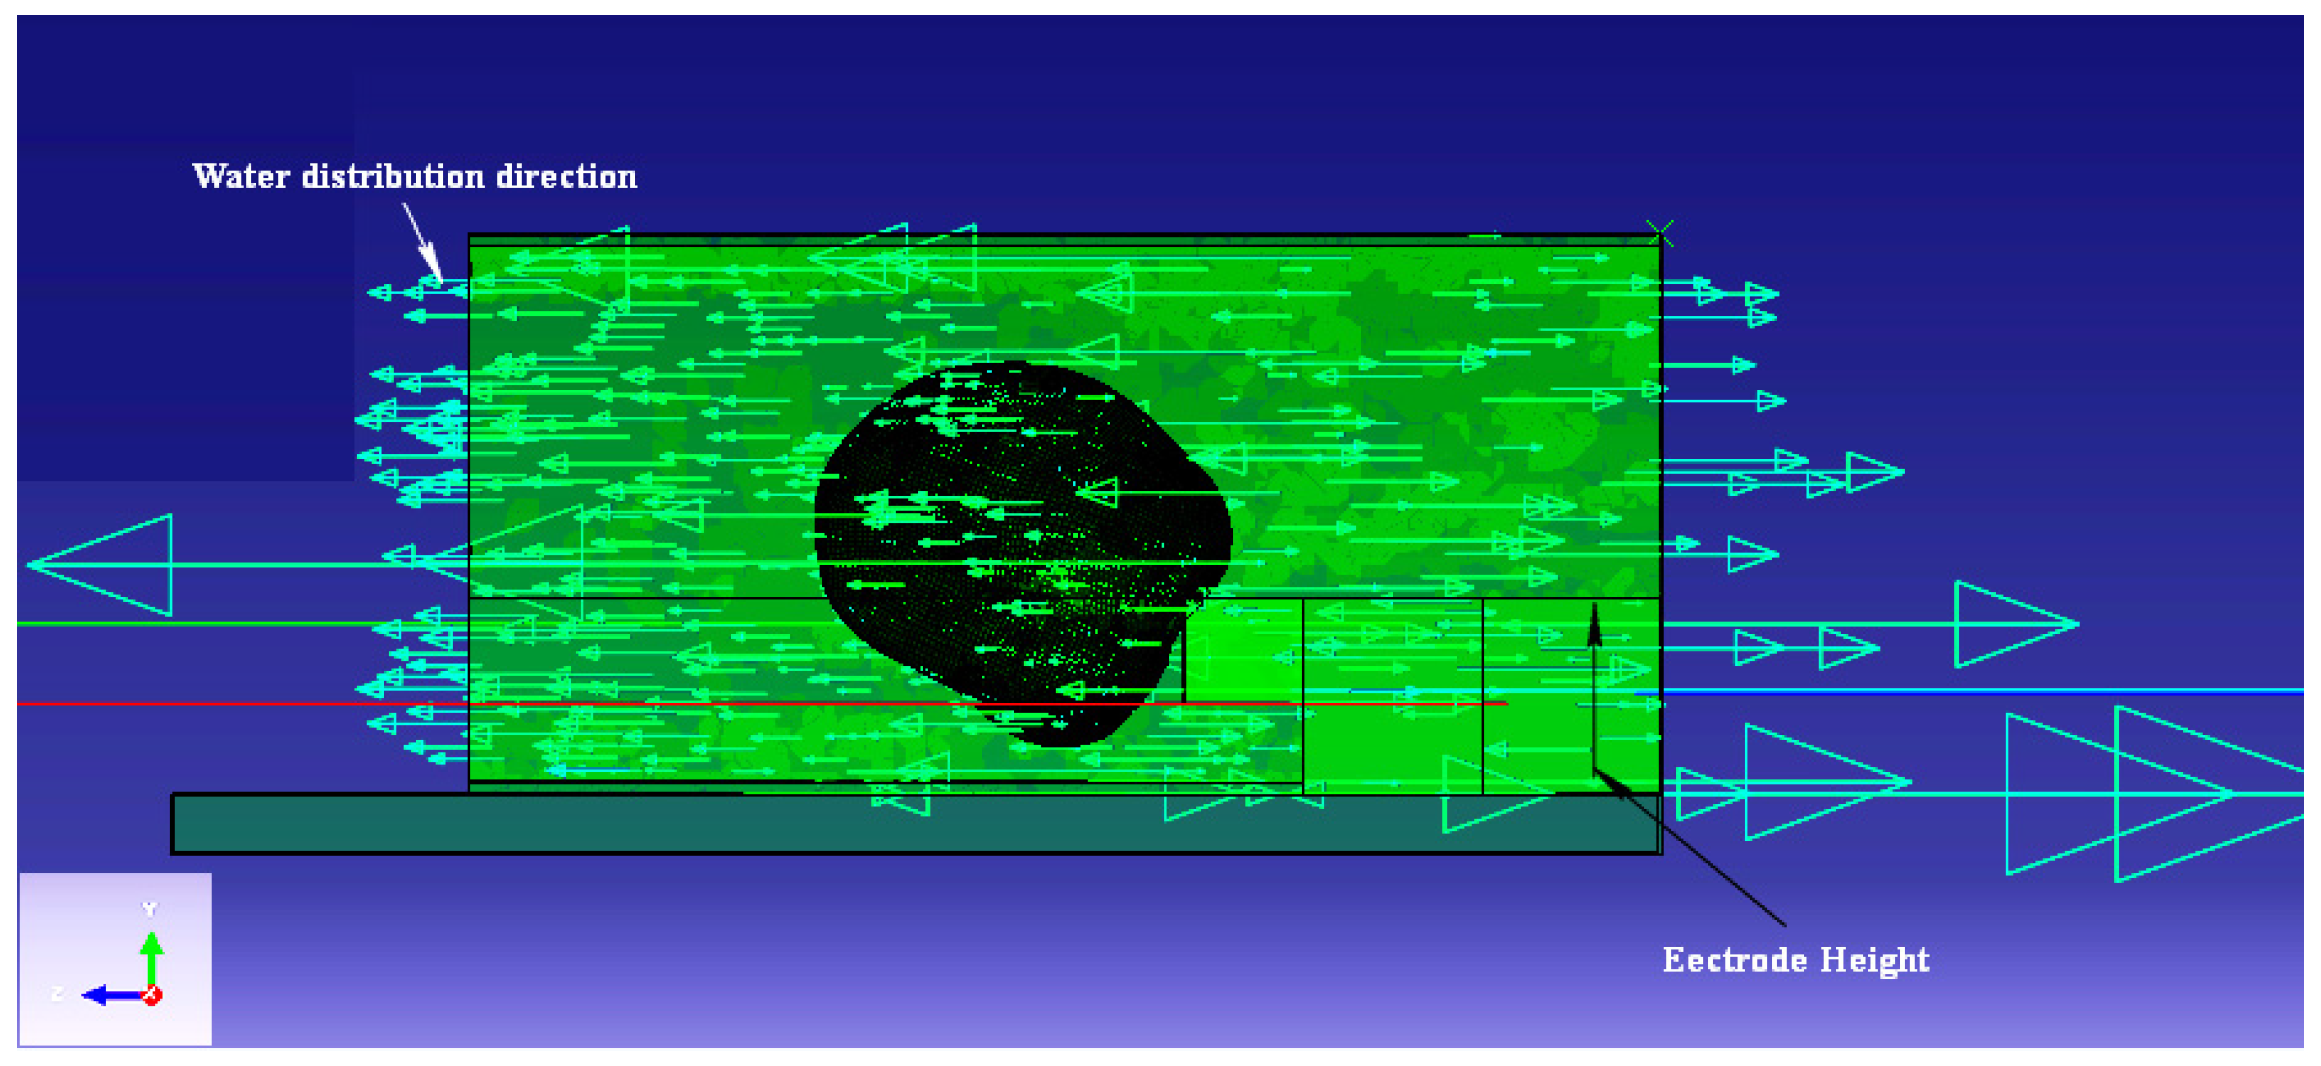
Figure 17 shows the simulation results of the microchannel height optimization analysis. The channel height had a strong effect on the cell flow and penetration into the nanoneedle. The higher the height, the better the flow was and the more penetration was observed on the cell. This could be explained by the effect of the water flow distribution that was disturbed by the electrode structure in the microchannel (
Figure 18). By comparing the backward velocities in channel heights of 7, 8 and 9 μm, the velocity flow in the opposite direction of the nanoneedle was higher as the channel height decreased (indicated by the red arrow and the highest legend value in
Figure 18). Furthermore, there was a noticeable forward velocity flowing towards the nanoneedle in the all heights. However, the 8 μm channel height had more forward flow distribution towards the nanoneedle compared to the 7 μm but with clear backward velocity. The 9 μm channel height, had no obvious backwards velocity and more forward velocity flow in the channel.
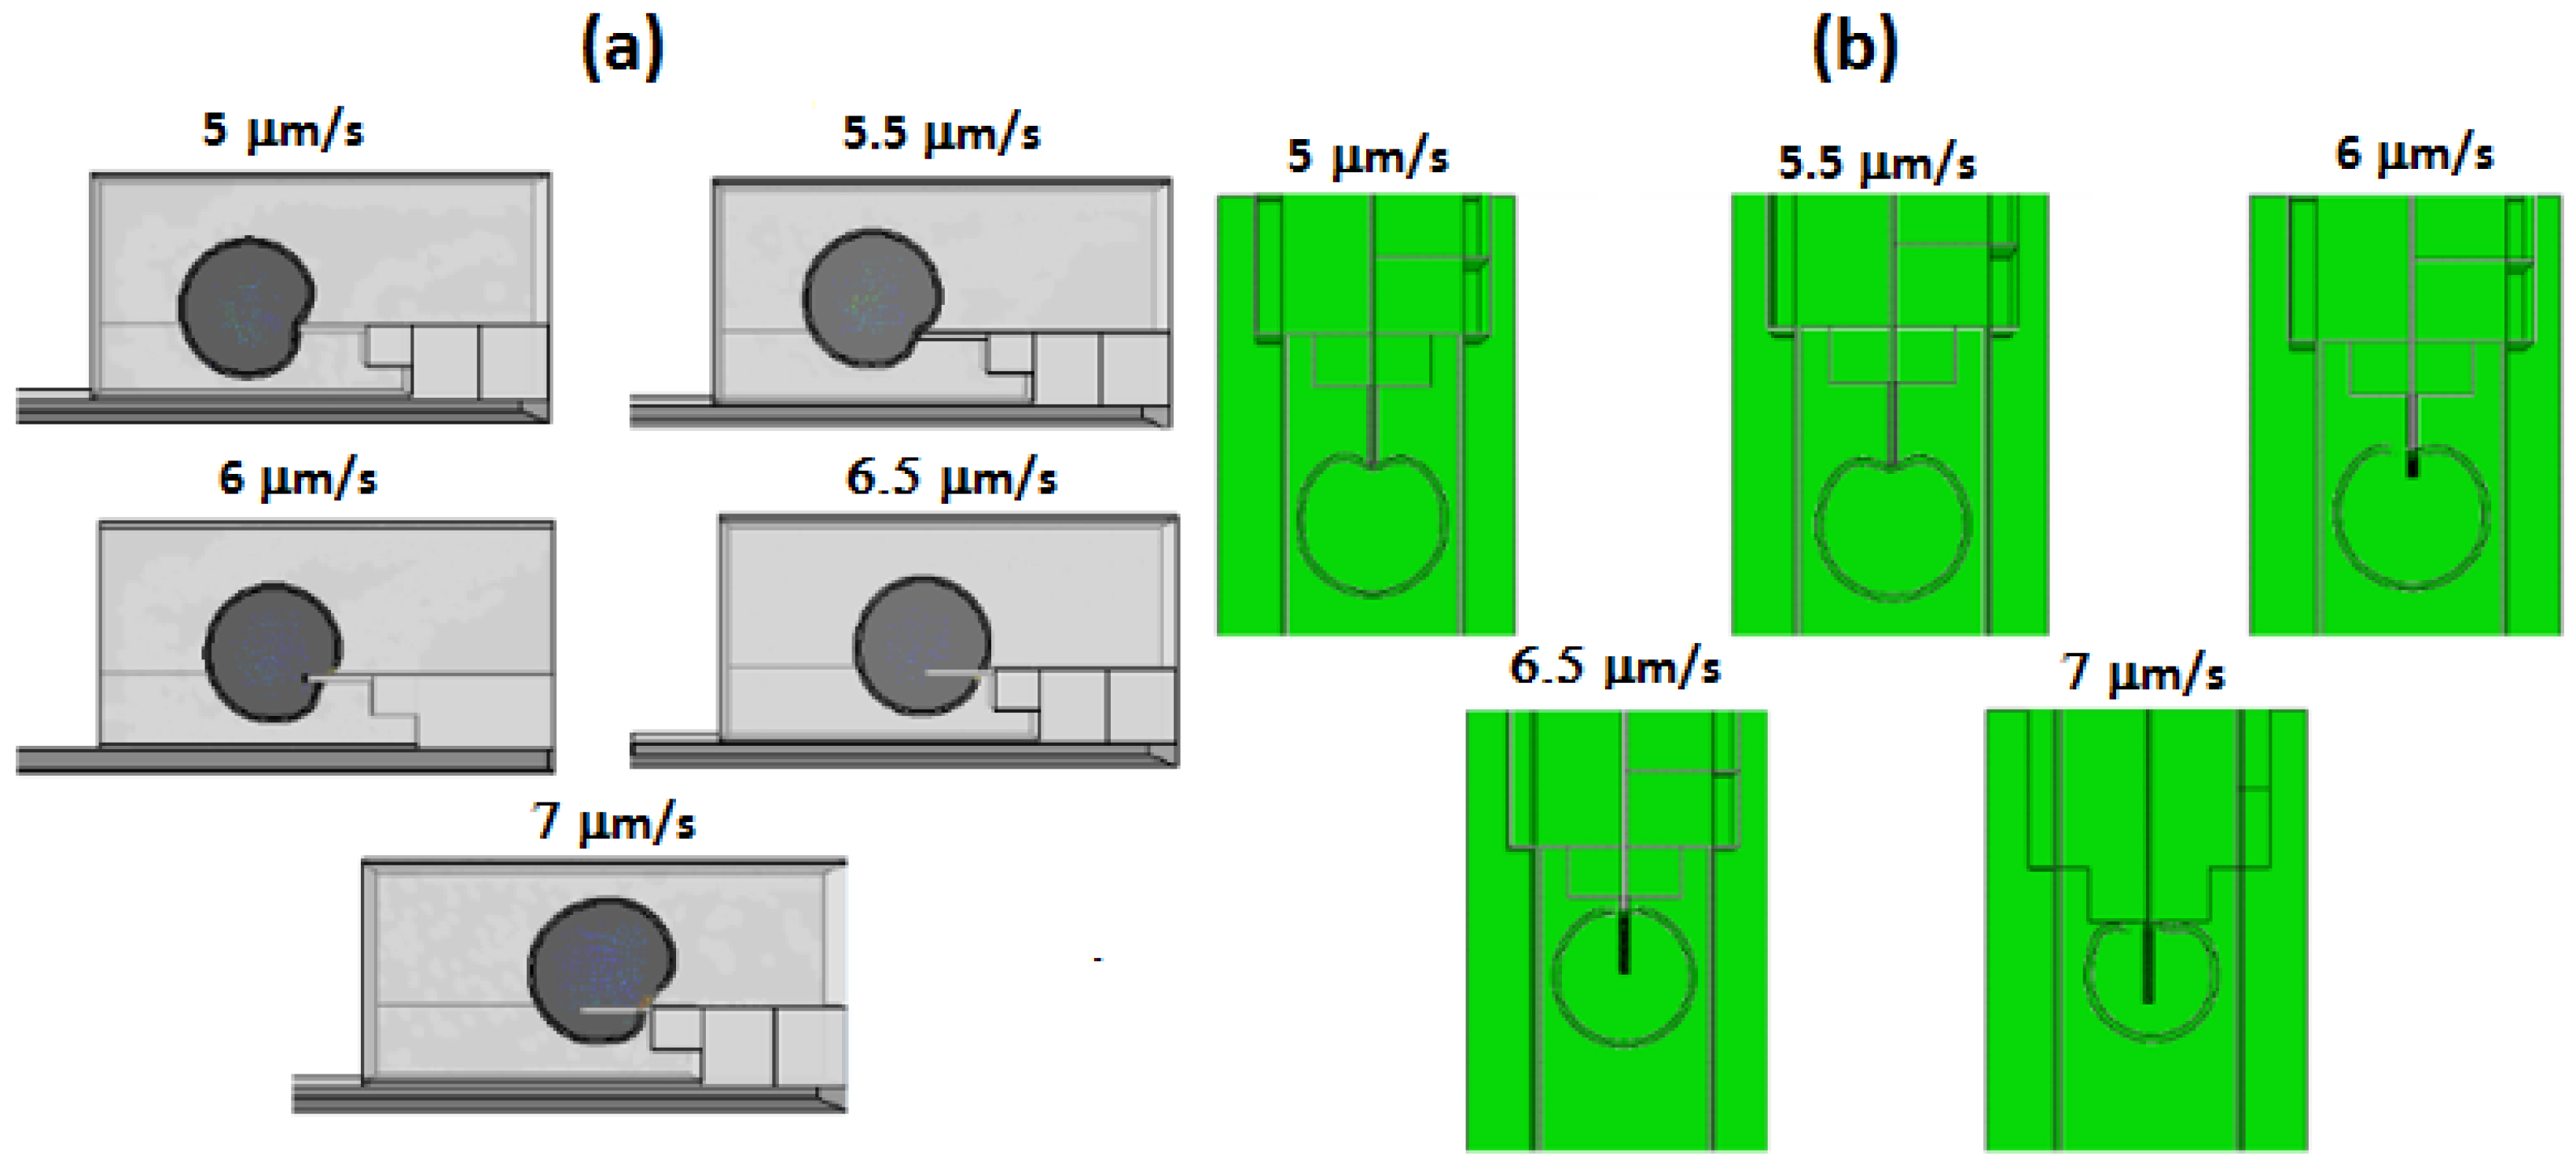
After optimizing the channel height, the velocity range at which successful penetration could be achieved had to be determined in order to optimize the flow rate range to be used by the external micropump for the nanoneedle-microfluidic system.
Figure 19 presents the simulation results for flow rate optimization.
Figure 19a displays the side view of the penetration, while
Figure 19b shows the top view of the penetration depth. At first, the velocity was set to 5 μm/s, which was equivalent to 18.9 pL/min and was gradually increased to 7 μm/s to study the penetration behavior. From the results, velocities 5 and 5.5 μm/s did not show any signs of penetration, in fact, velocity 5.5 μm/s overtook the nanoneedle and flew towards the upper part of the microchannel. Velocity 6 μm/s showed some penetration; however, it was insufficient as the cell penetrated to the center of the nanoneedle and stopped due to the backward velocity pushing the cell, when the aim was to penetrate and to fully cover the nanoneedle. The most suitable velocity was 6.5 μm/s, which displayed successful penetration. Lastly, velocity 7 μm/s caused excessive penetration and the cell was squashed into the nanoneedle electrodes, which caused the shape to slightly deform. Consequently, the optimum velocity range for cell penetration would be between 6.5 to 6.9 μm/s. Below that range, the cell will not penetrate to the desired location, and above that range, the cell will over-penetrate and may lead to cell damaged.
Table 1 summarizes the results of flow rate optimization.
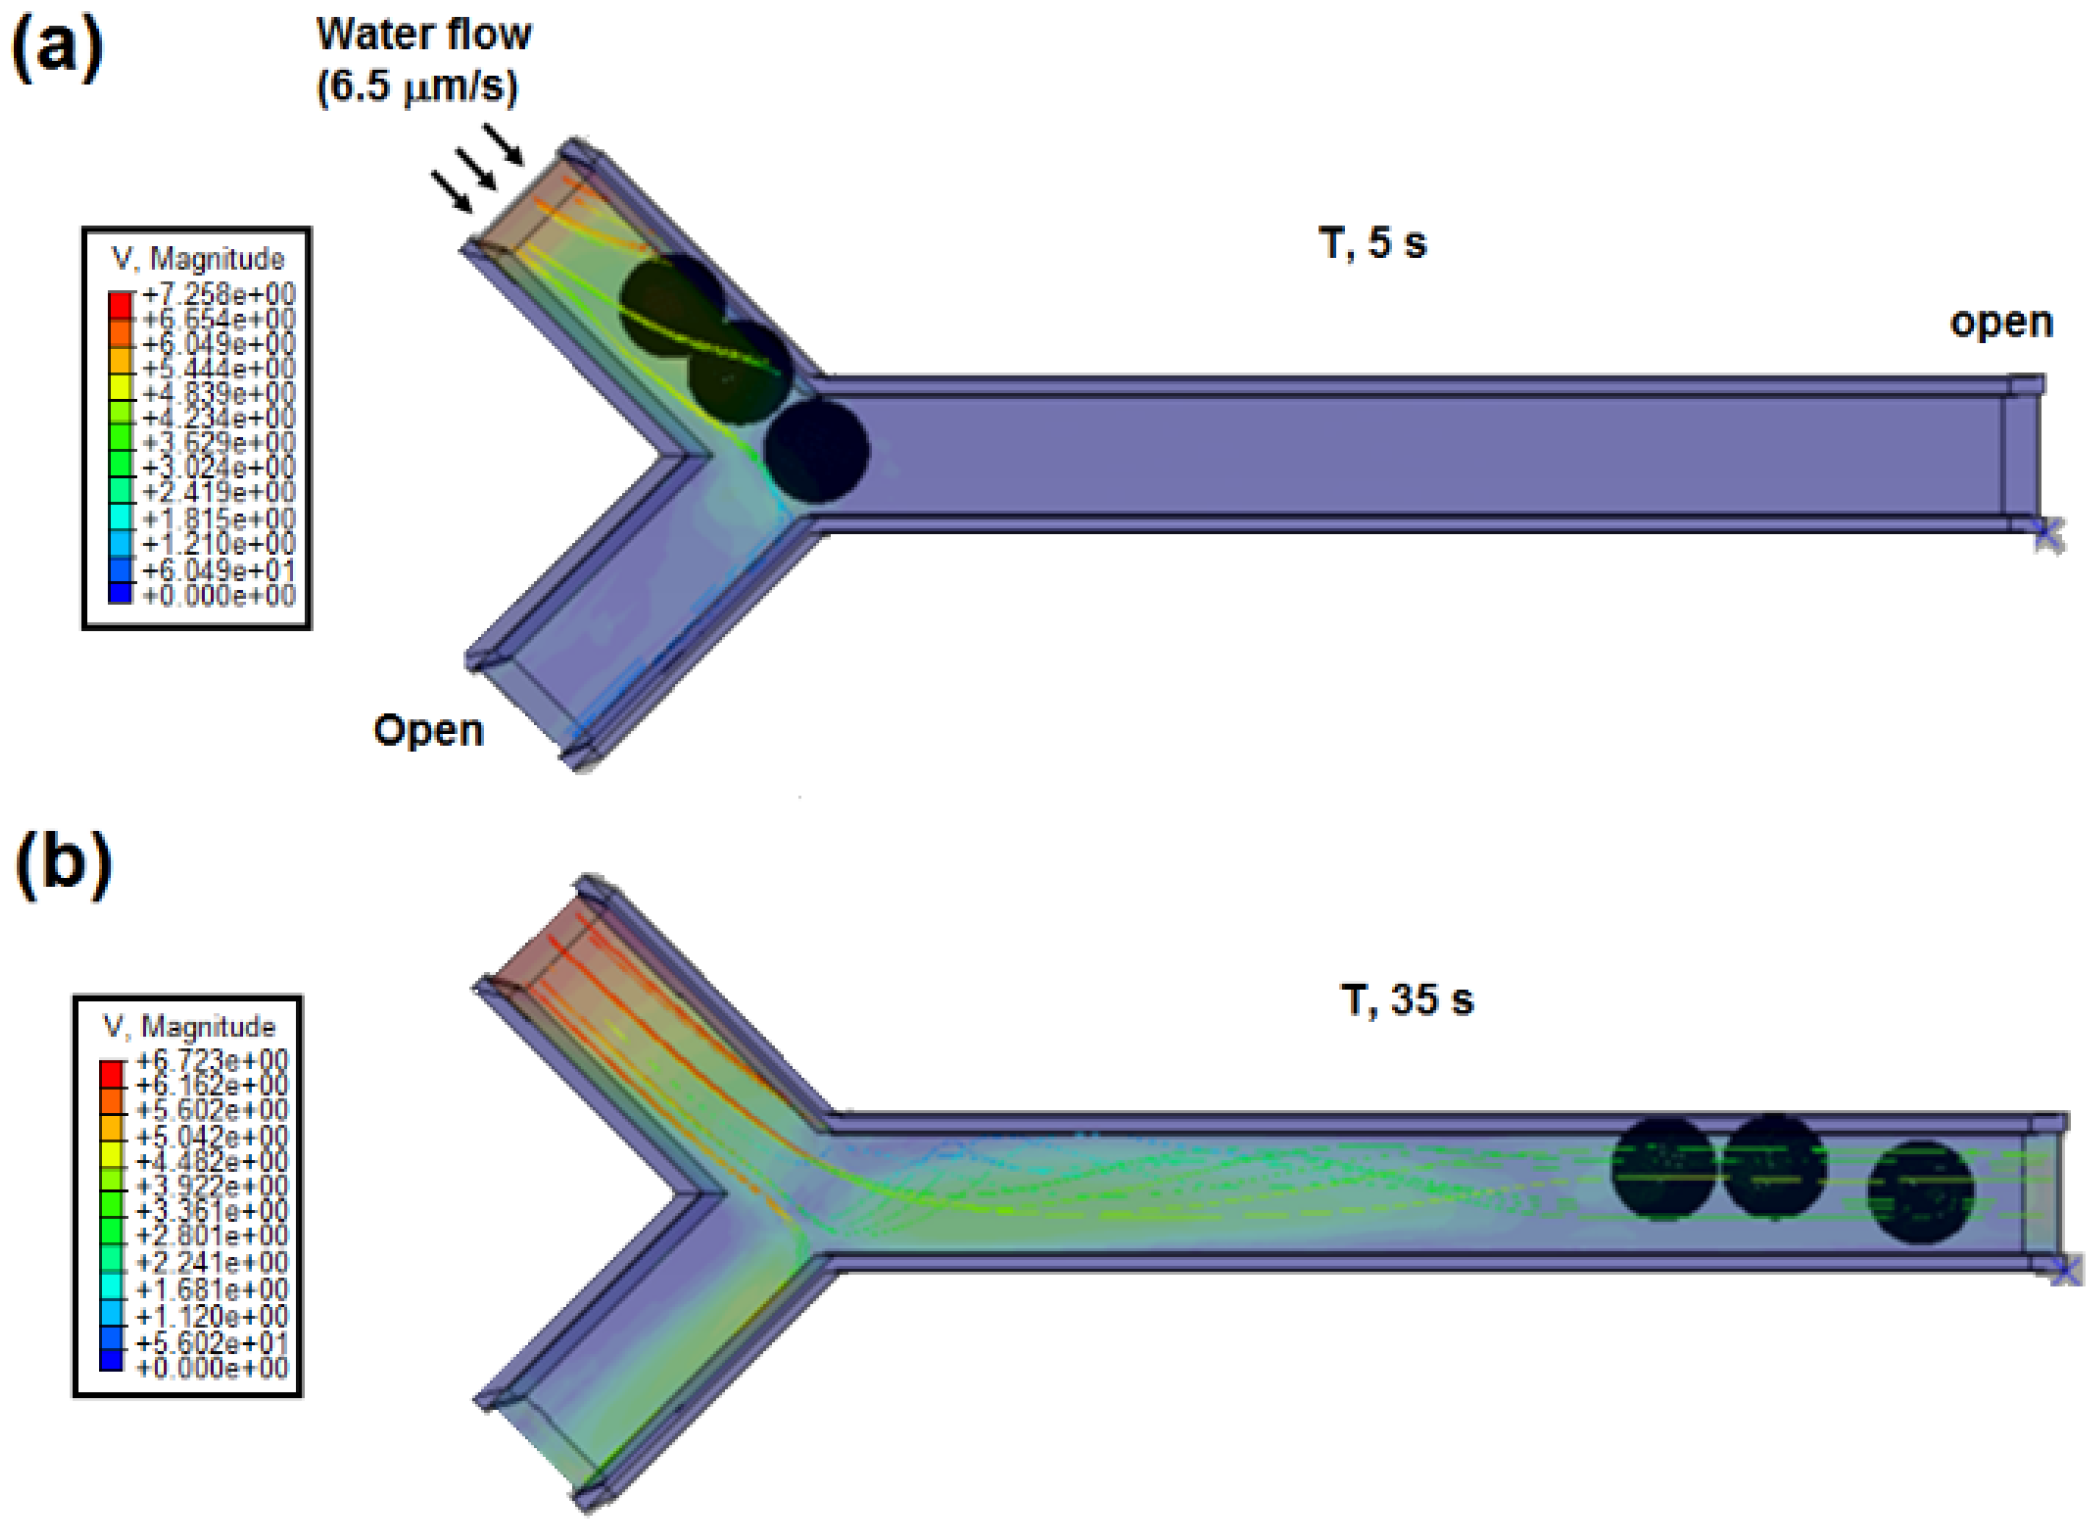
Finally, the velocity of 6.5 μm/s that was optimized in the last section was applied at the inlet. The streamline plot of the water flow in the Y-shaped microchannel at the time of 5 and 35 s are shown in
Figure 20. At 35 s, the highest flow was moving toward the long side of the microchannel, which led to migration of cell to nanoneedle side. From the results, the cells flew in a queue towards the long side of the Y-shaped microchannel, which leads to the cells migrating to the nanoneedle. The results show that the single cell can reach to the nanoneedle for penetration. Since the cell wall of the yeast cell is harder than the plasma membrane, the nanoneedle penetration in the cell wall ensures the penetration into plasma membrane.
The cell extraction process in the microfluidic device was also simulated at different time (
Figure 21). It is important to analyze two or more cells by the same microfluidic device. Velocity of 6.5 μm/s was used since it showed no effect on the nanoneedle at the inlet, and the other ends were set to open. It was clearly observed that the cells were moved toward the both outlets one after another, which indicated the advantages of two holes to extract the cells fast without clogging of cells.


