
A Novel Method for Estimation of Femoral Neck Bone Mineral Density Using Forearm Images from Peripheral Cone Beam Computed Tomography

 and
and 
Abstract
:1. Introduction
2. Materials and Methods
2.1. Subjects and Measurements
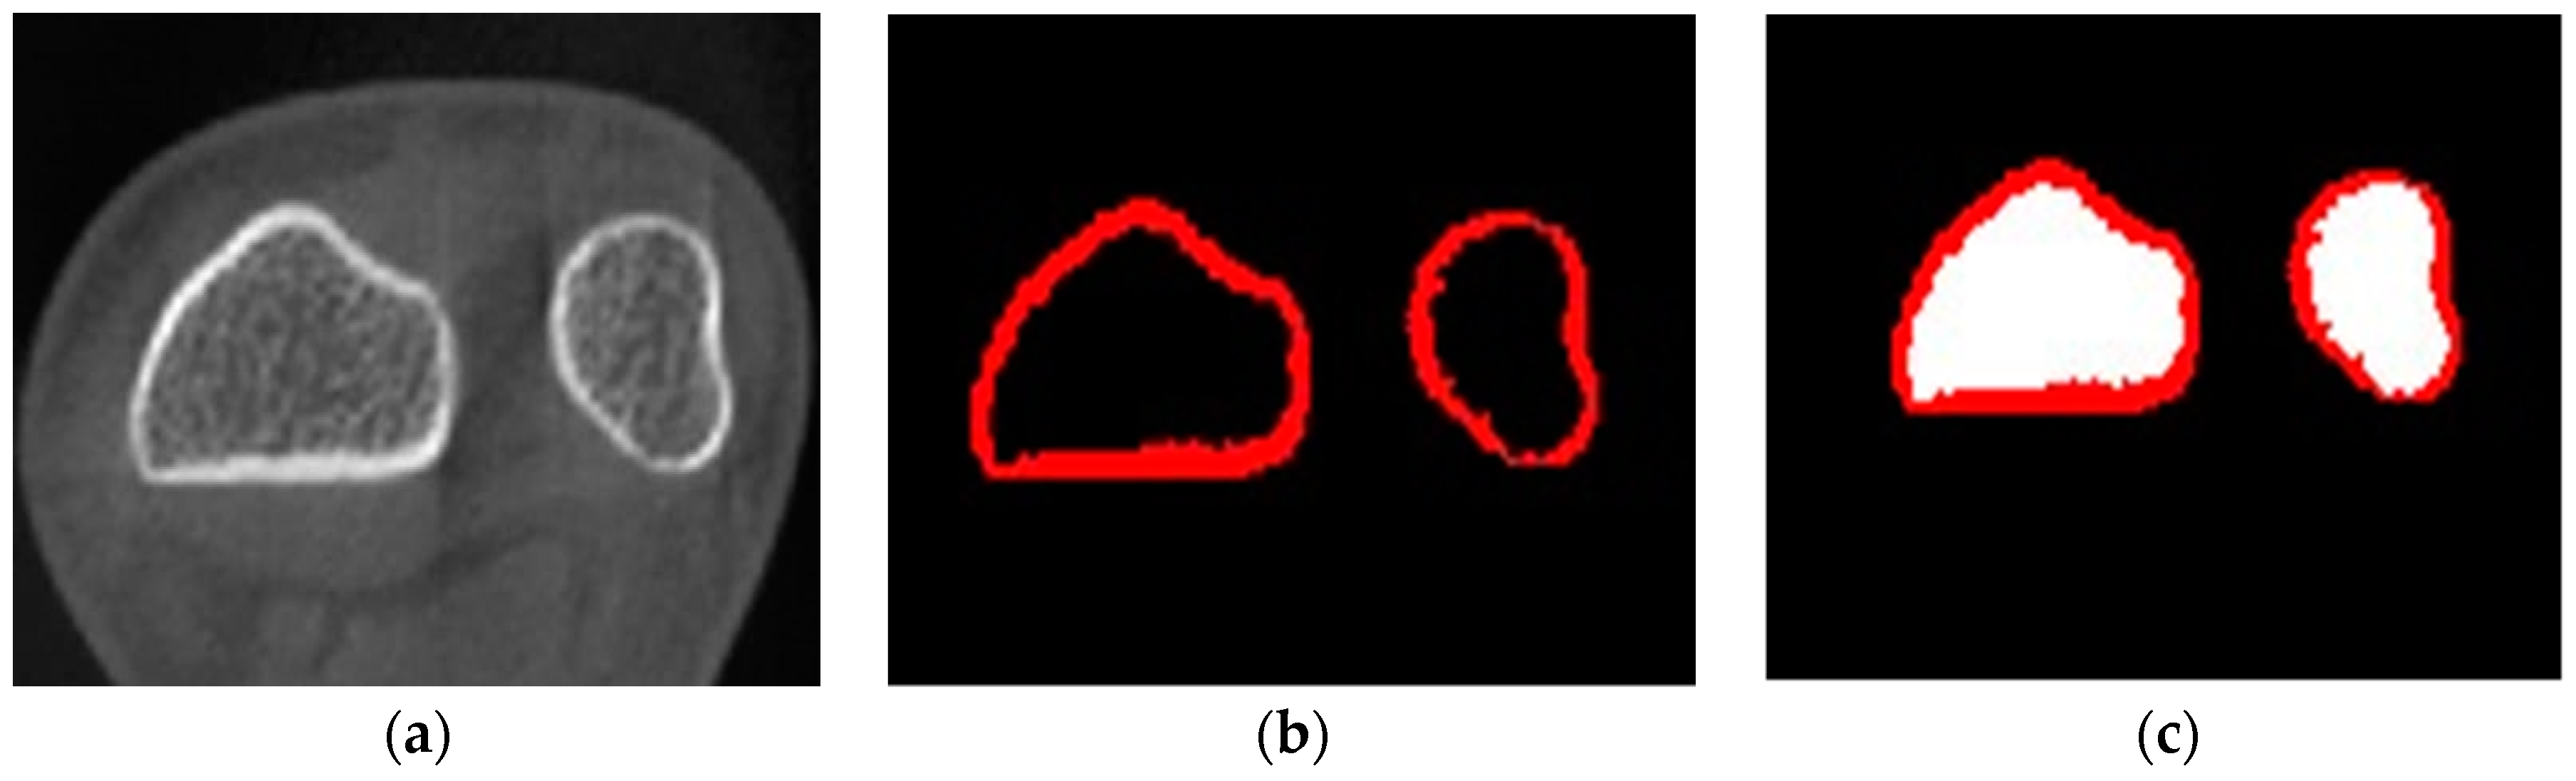
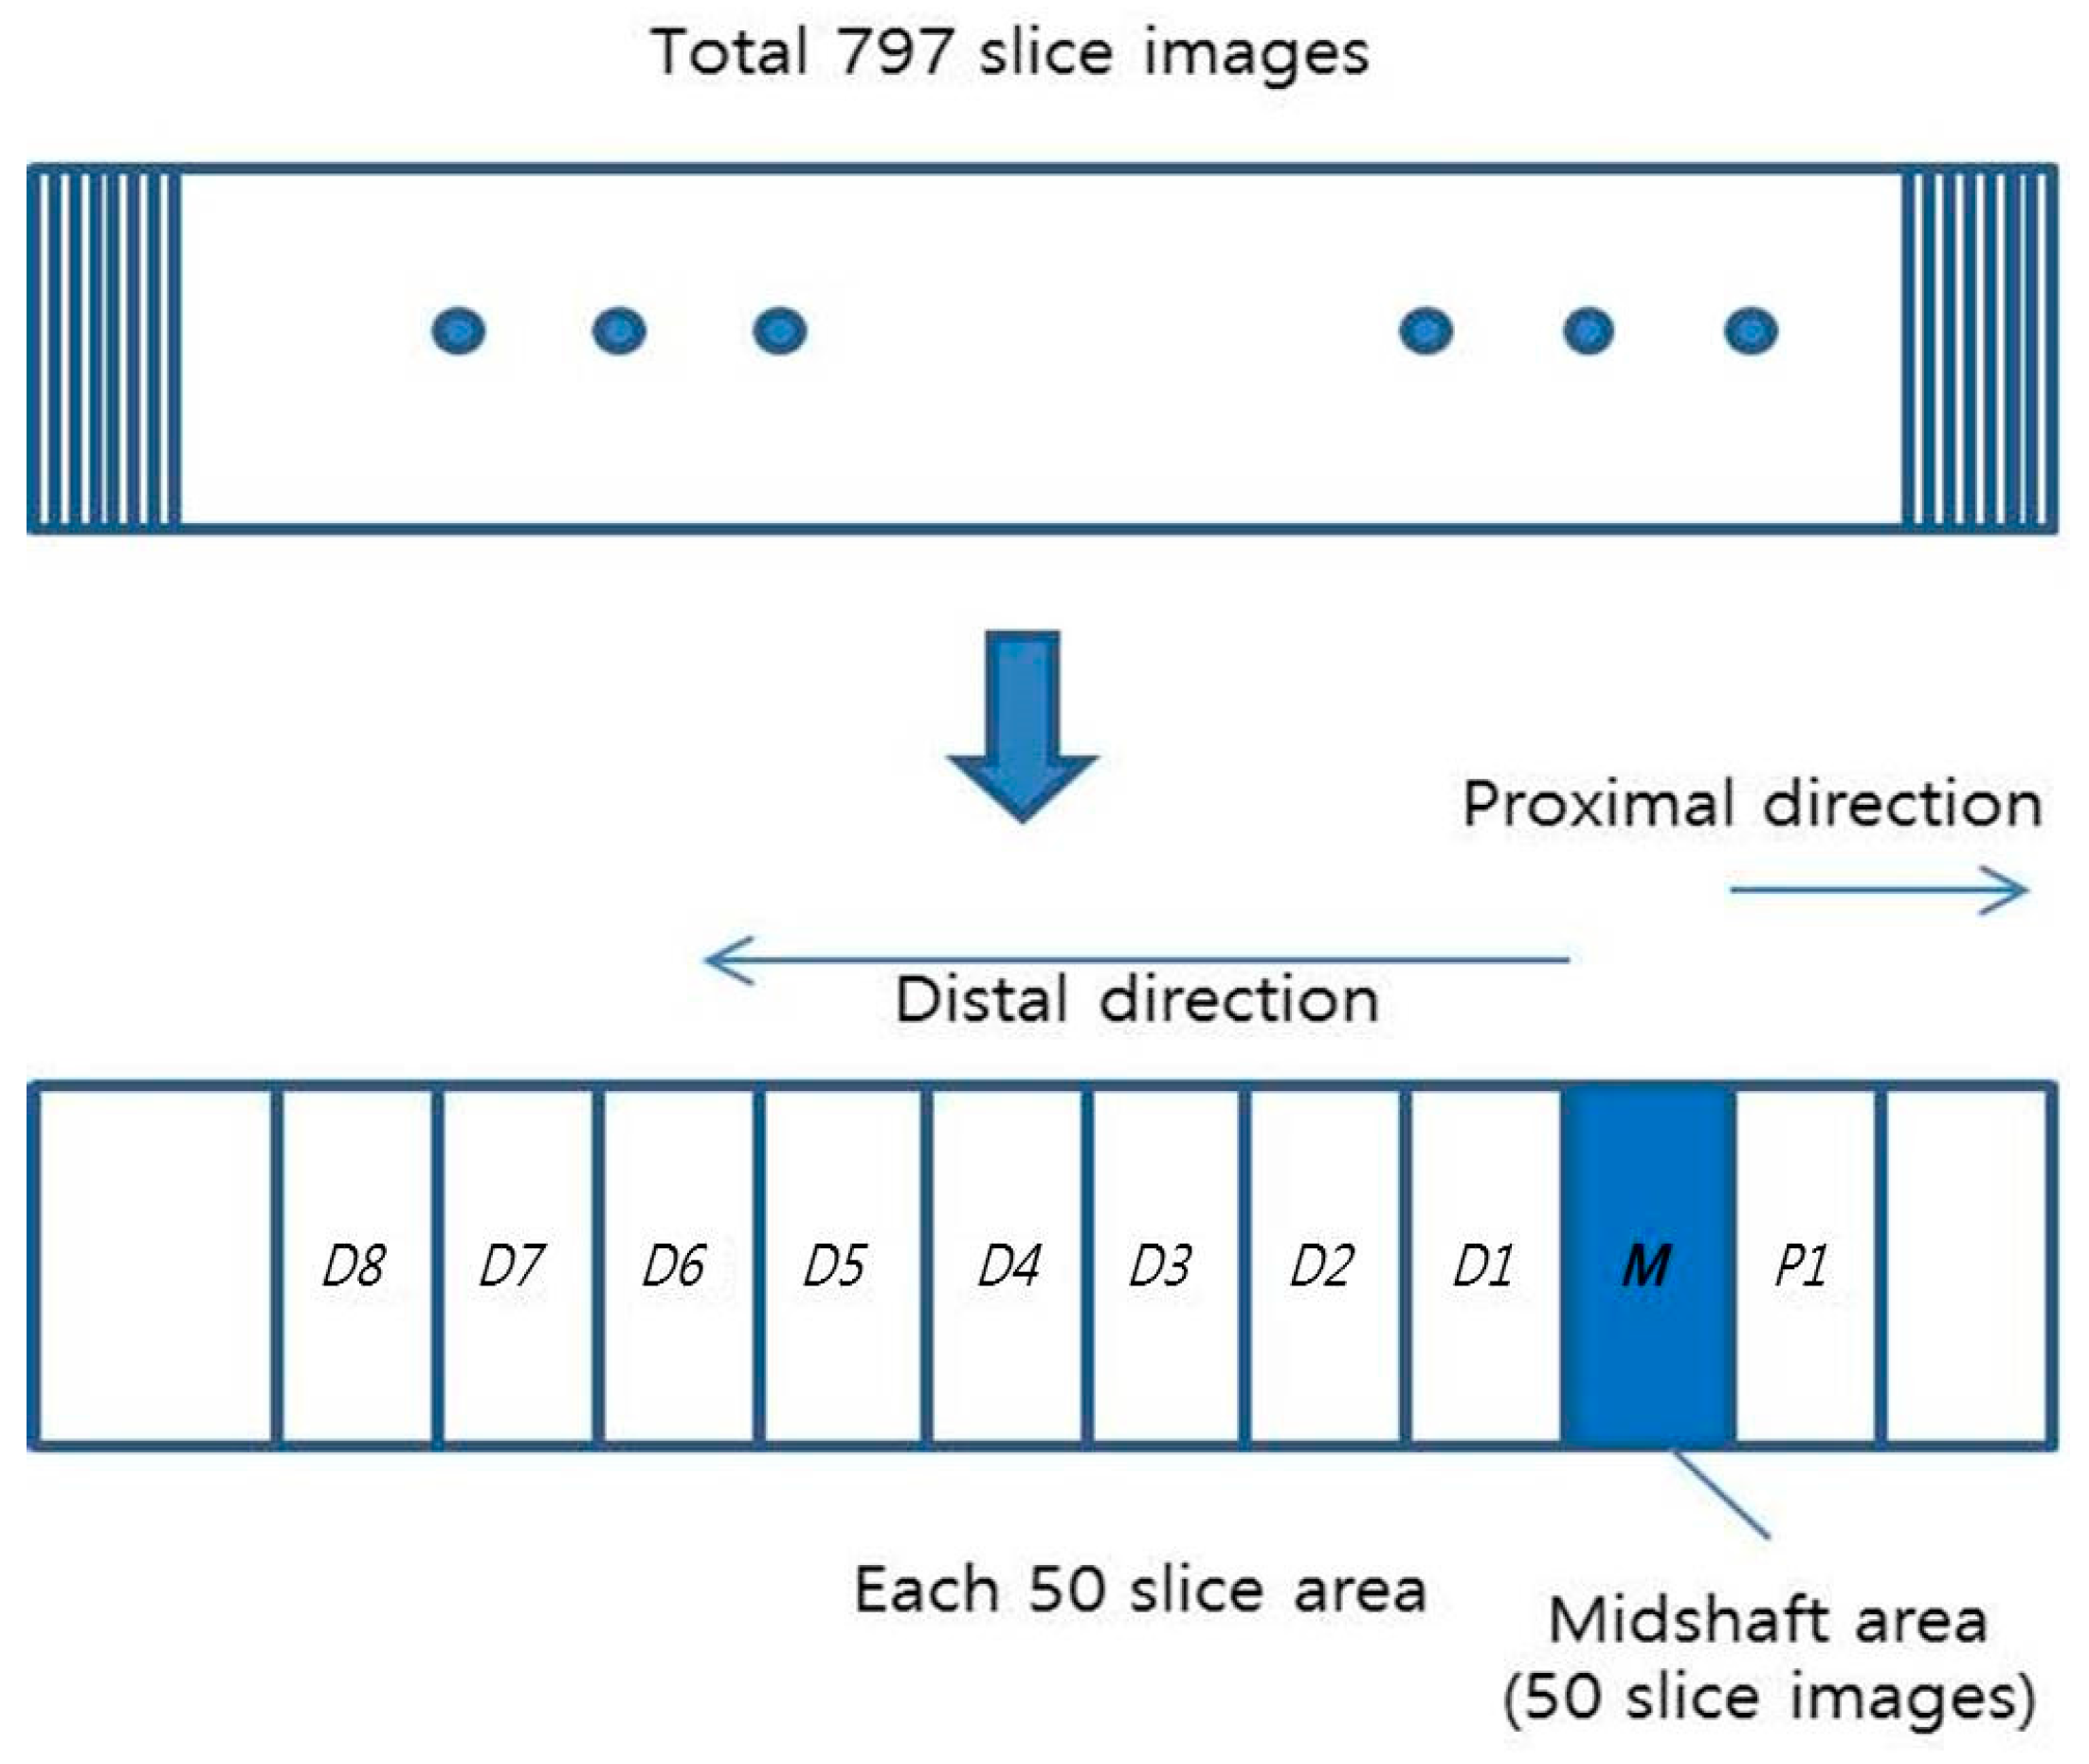
2.2. Computation of Forearm Rca/ta from Peripheral Cone Beam Computed Tomography (CBCT) Images
2.3. Regression of Femoral Neck BMD from RGca/ta(type)
2.4. Statistical Analyses
3. Results
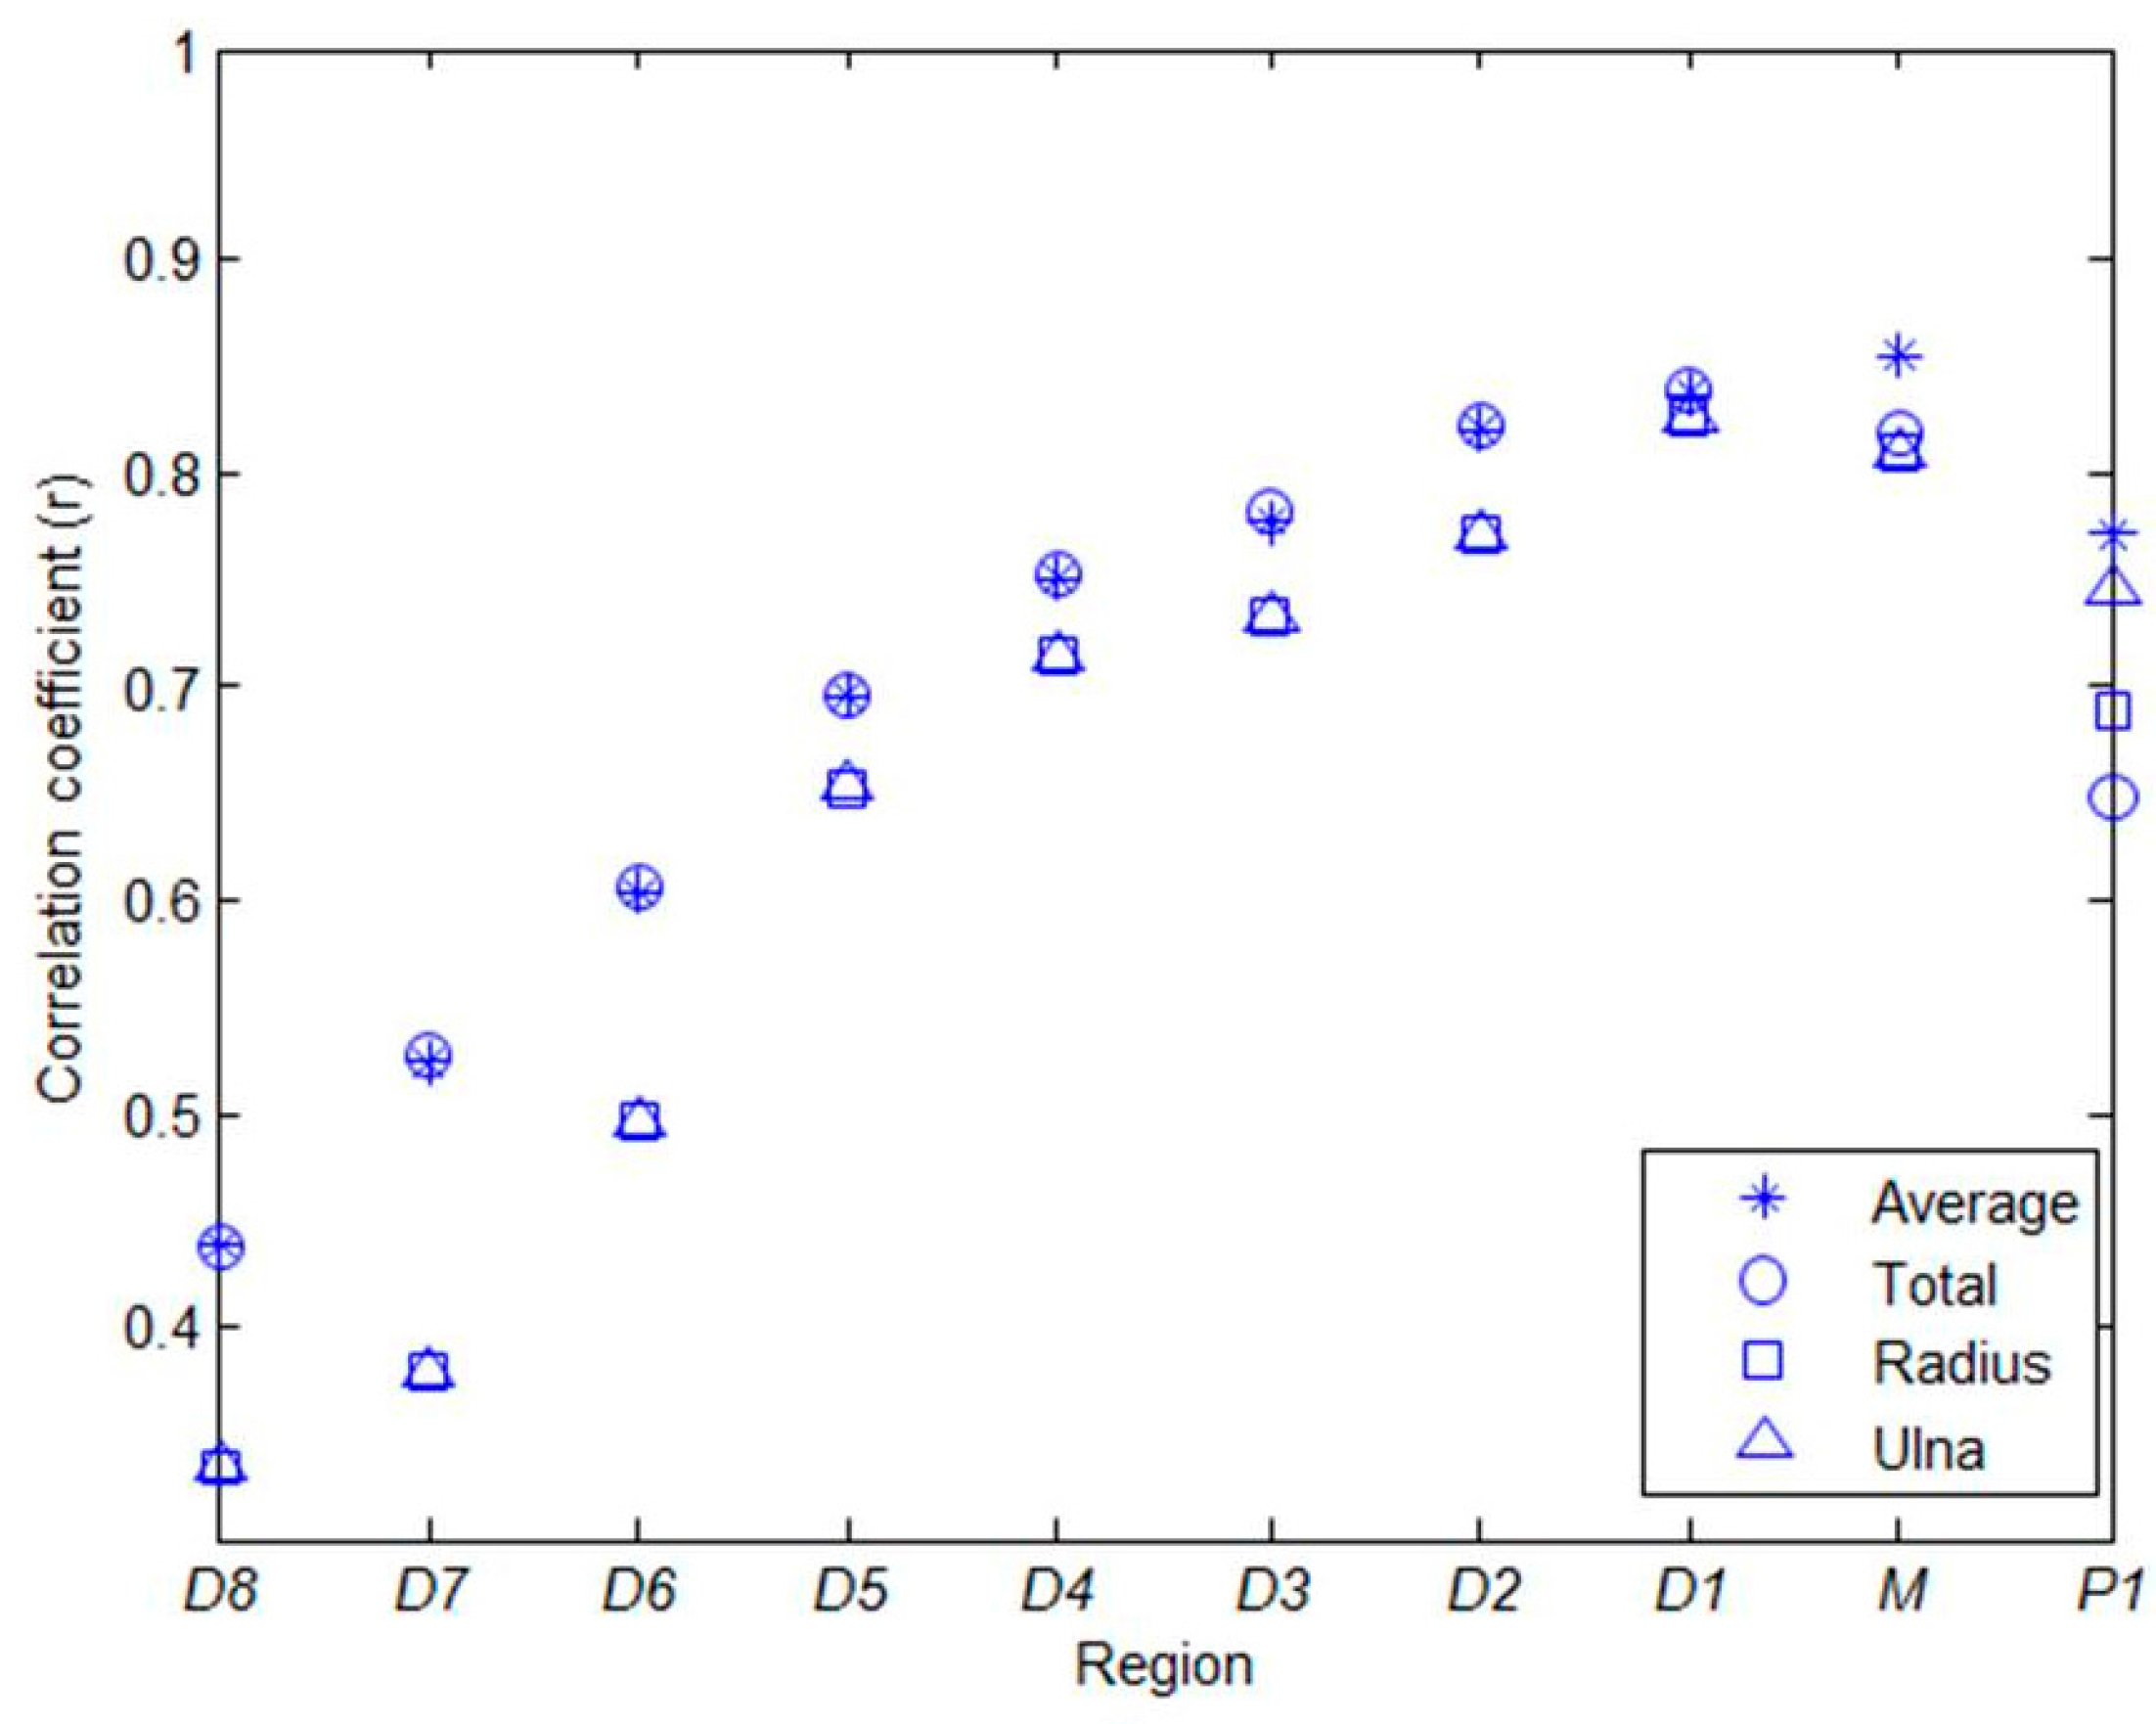
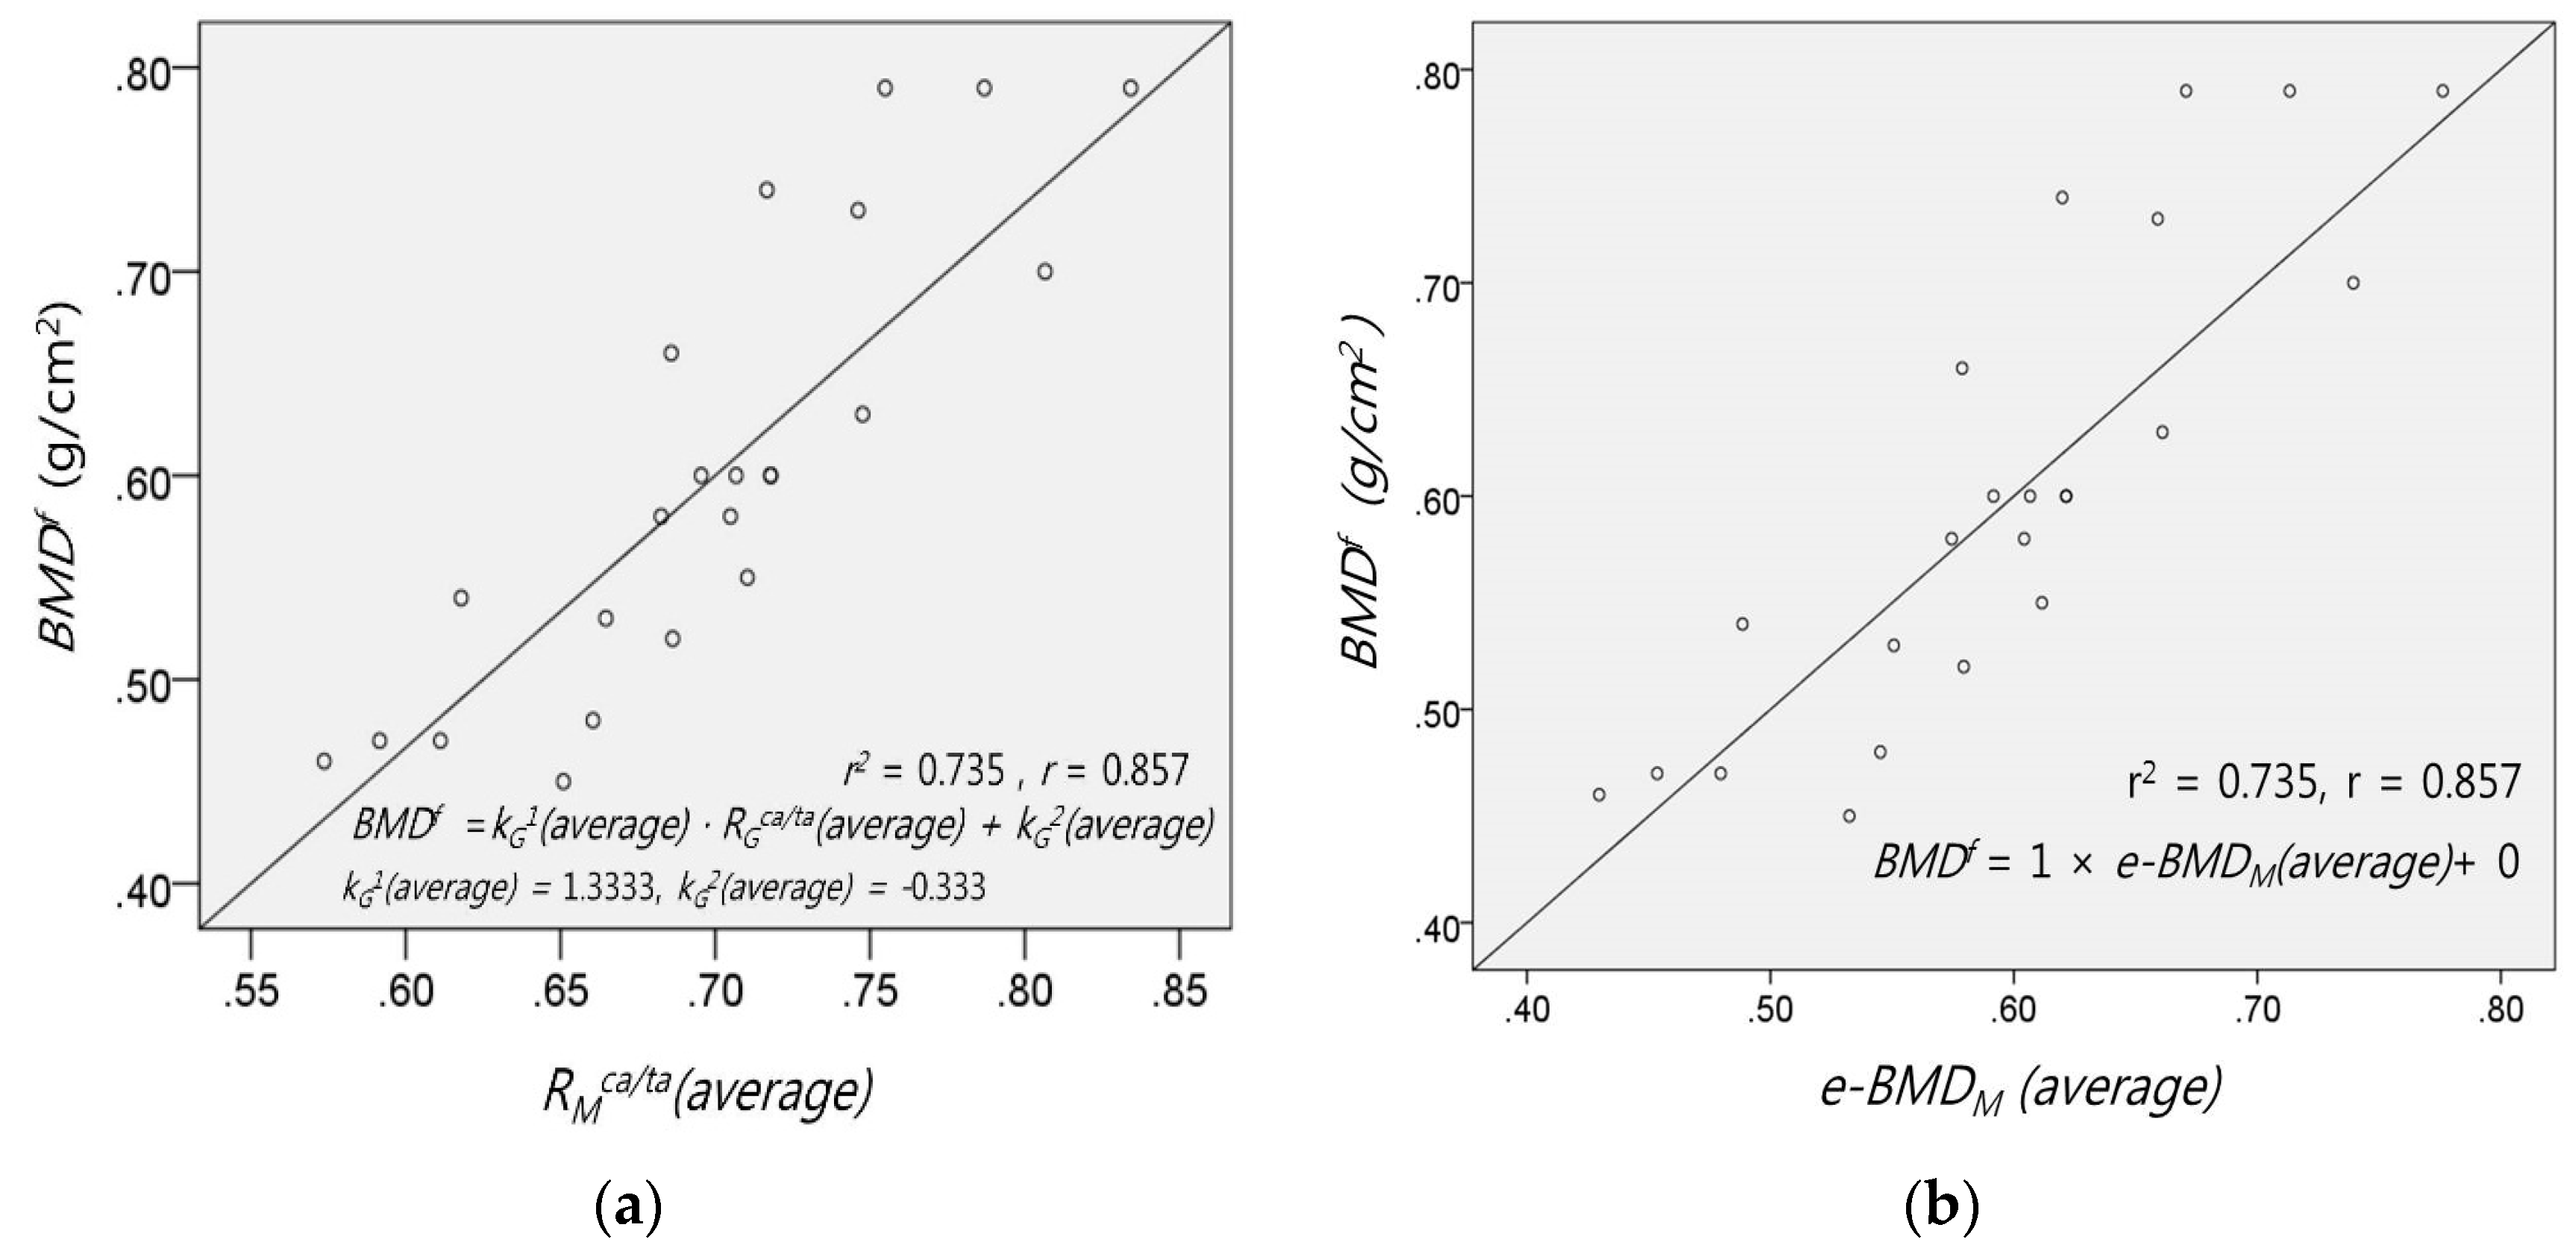
3.1. Correlation between BMDf and RGca/ta(type)
3.2. Estimation of e-BMDG(type) from RGca/ta(type)
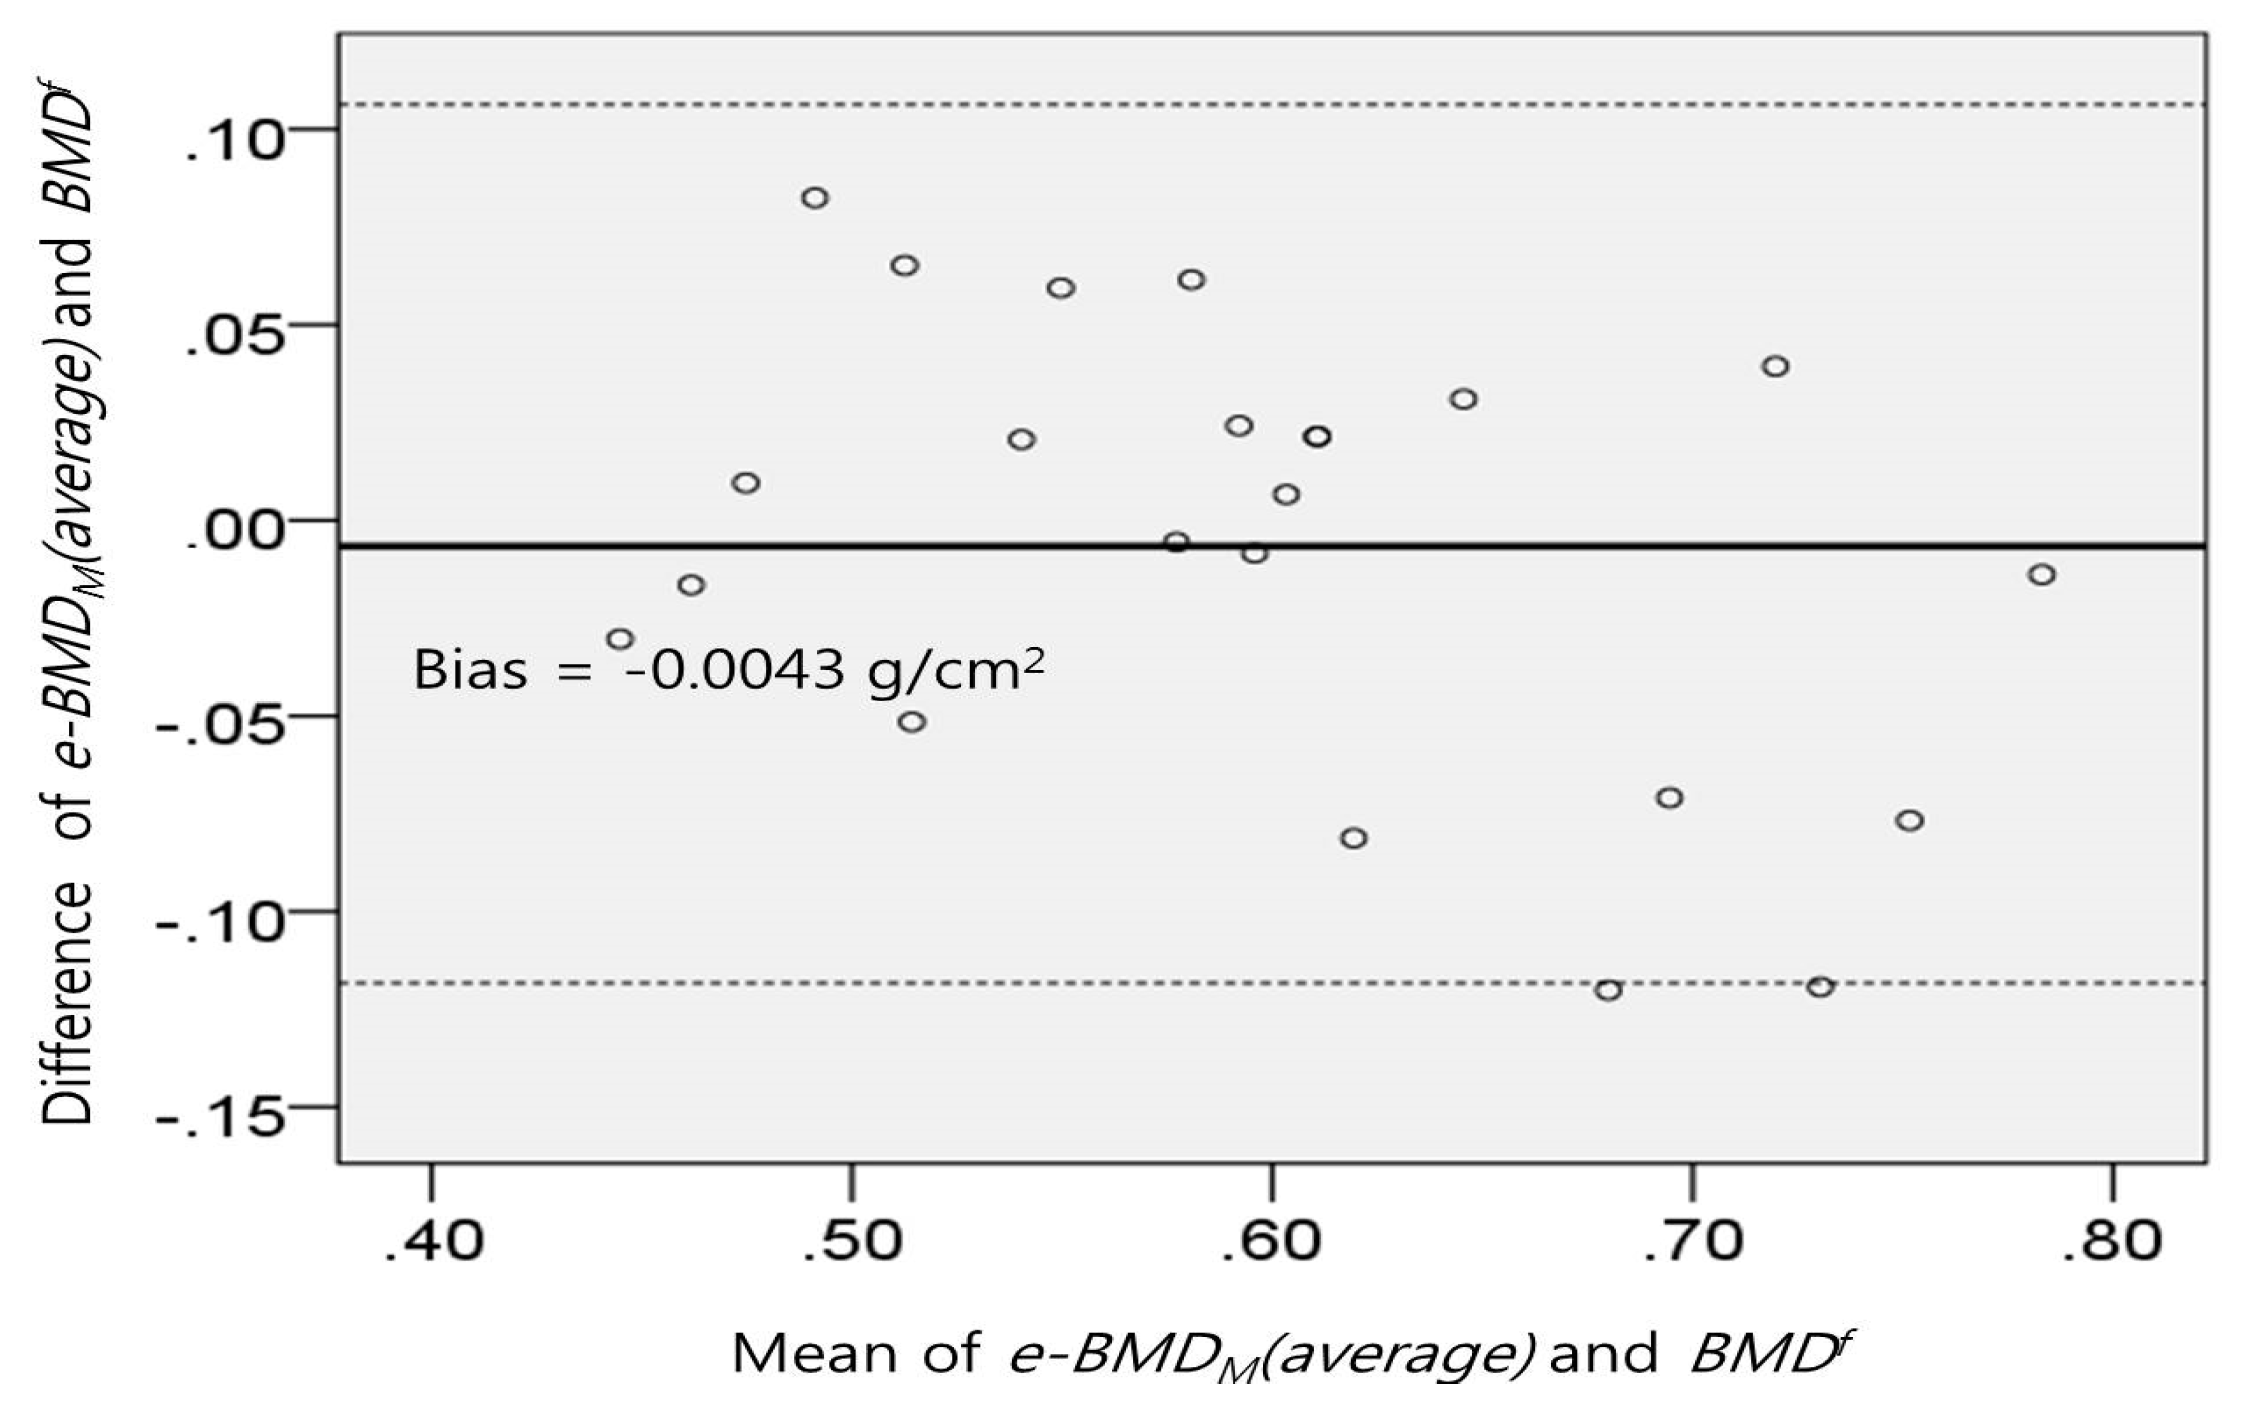
3.3. Analysis of e-BMDG(type)
4. Discussion
5. Conclusions
Acknowledgments
Author Contributions
Conflicts of Interest
References
- Kanis, J.A. Diagnosis of osteoporosis and assessment of fracture risk. Lancet 2002, 359, 1929–1936. [Google Scholar] [CrossRef]
- Schuit, S.; van der Klift, M.; Weel, A.; de Laet, C.; Burger, H.; Seeman, E.; Hofman, A.; Uitterlinden, A.; van Leeuwen, J.; Pols, H. Fracture incidence and association with bone mineral density in elderly men and women: The rotterdam study. Bone 2004, 34, 195–202. [Google Scholar] [CrossRef] [PubMed]
- Guglielmi, G.; Muscarella, S.; Bazzocchi, A. Integrated imaging approach to osteoporosis: State-of-the-art review and update. Radiographics 2011, 31, 1343–1364. [Google Scholar] [CrossRef] [PubMed]
- Aitken, J. Relevance of osteoporosis in women with fracture of the femoral neck. BMJ 1984, 288, 597–601. [Google Scholar] [CrossRef] [PubMed]
- Christodoulou, C.; Cooper, C. What is osteoporosis? Postgrad. Med. J. 2003, 79, 133–138. [Google Scholar] [CrossRef] [PubMed]
- Yang, J.Y.; Kim, Y.M. Correlation analysis of BMD in proximal femur and spine. J. Korean Soc. Fract. 2003, 16, 570–576. [Google Scholar]
- Blake, G.M.; Fogelman, I. Bone densitometry and the diagnosis of osteoporosis. Semin. Nucl. Med. 2001, 31, 69–81. [Google Scholar] [CrossRef] [PubMed]
- Jang, J.; Yang, S.; Kim, D.; Jo, Y.; Lee, S.; Kim, K. Comparative study of femur BMD and lumbar BMD measurement using dual energy X-ray absorptiometry in proximal femur fractures. Korean J. Bone Metab. 1996, 3, 170–173. [Google Scholar]
- Ralston, S.H. Bone densitometry and bone biopsy. Best Pract. Res. Clin. Rheumatol. 2005, 19, 487–501. [Google Scholar] [CrossRef] [PubMed]
- Engelke, K.; Libanati, C.; Liu, Y.; Wang, H.; Austin, M.; Fuerst, T.; Stampa, B.; Timm, W.; Genant, H.K. Quantitative computed tomography (QCT) of the forearm using general purpose spiral whole-body CT scanners: Accuracy, precision and comparison with dual-energy X-ray absorptiometry (DXA). Bone 2009, 45, 110–118. [Google Scholar] [CrossRef] [PubMed]
- Black, D.M.; Bouxsein, M.L.; Marshall, L.M.; Cummings, S.R.; Lang, T.F.; Cauley, J.A.; Ensrud, K.E.; Nielson, C.M.; Orwoll, E.S. Proximal femoral structure and the prediction of hip fracture in men: A large prospective study using QCT. J. Bone Miner. Res. 2008, 23, 1326–1333. [Google Scholar] [CrossRef] [PubMed]
- Lang, T.; Guglielmi, G.; van Kuijk, C.; de Serio, A.; Cammisa, M.; Genant, H. Measurement of bone mineral density at the spine and proximal femur by volumetric quantitative computed tomography and dual-energy X-ray absorptiometry in elderly women with and without vertebral fractures. Bone 2002, 30, 247–250. [Google Scholar] [CrossRef]
- Guglielmi, G.; Schneider, P.; Lang, T.; Giannatempo, G.; Cammisa, M.; Genant, H. Quantitative computed tomography at the axial and peripheral skeleton. Eur. Radiol. 1997, 7. [Google Scholar] [CrossRef]
- Mochizuki, N.; Sugino, N.; Ninomiya, T.; Yoshinari, N.; Udagawa, N.; Taguchi, A. Association of cortical shape of the mandible on panoramic radiographs with mandibular trabecular bone structure in japanese adults: A cone-beam CT-image analysis. Oral Radiol. 2014, 30, 160–167. [Google Scholar] [CrossRef]
- Engelke, K.; Adams, J.E.; Armbrecht, G.; Augat, P.; Bogado, C.E.; Bouxsein, M.L.; Felsenberg, D.; Ito, M.; Prevrhal, S.; Hans, D.B. Clinical use of quantitative computed tomography and peripheral quantitative computed tomography in the management of osteoporosis in adults: The 2007 ISCD official positions. J. Clin. Densitom. 2008, 11, 123–162. [Google Scholar] [CrossRef] [PubMed]
- Vijay, A.; Shankar, N.; Ligesh, C.; Anburajan, M. Evaluation of osteoporosis using CT image of proximal femur compared with dual energy X-ray absorptiometry (DXA) as the standard. In Proceedings of the 2011 3rd International Conference on Electronics Computer Technology (ICECT), Kanyakumari, India, 8–10 April 2011; pp. 334–338.
- Mosekilde, L. Age-related changes in bone mass, structure, and strength—Effects of loading. Z. Rheumatol. 2000, 59 (Suppl. S1), 1–9. [Google Scholar] [CrossRef] [PubMed]
- Laval-Jeantet, A.-M.; Bergot, C.; Carroll, R.; Garcia-Schaefer, F. Cortical bone senescence and mineral bone density of the humerus. Calcif. Tissue Int. 1983, 35, 268–272. [Google Scholar] [CrossRef] [PubMed]
- Ma, W.-Y.; Manjunath, B.S. Edgeflow: A technique for boundary detection and image segmentation. IEEE Trans. Image Process. 2000, 9, 1375–1388. [Google Scholar] [PubMed]
- Shah, S.; Abaza, A.; Ross, A.; Ammar, H. Automatic tooth segmentation using active contour without edges. In Proceedings of the 2006 Biometrics Symposium: Special Session on Research at the Biometric Consortium Conference, Baltimore, MD, USA, 19 September–21 August 2006; pp. 1–6.
- DeFreitas, S.C. Computer Method for Filling a Selected Region in a Target Image. U.S. Patent 5870100, 9 February 1999. [Google Scholar]
- Burghardt, A.J.; Buie, H.R.; Laib, A.; Majumdar, S.; Boyd, S.K. Reproducibility of direct quantitative measures of cortical bone microarchitecture of the distal radius and tibia by HR-PQCT. Bone 2010, 47, 519–528. [Google Scholar] [CrossRef] [PubMed]
- Buie, H.R.; Campbell, G.M.; Klinck, R.J.; MacNeil, J.A.; Boyd, S.K. Automatic segmentation of cortical and trabecular compartments based on a dual threshold technique for in vivo micro-CT bone analysis. Bone 2007, 41, 505–515. [Google Scholar] [CrossRef] [PubMed]
- Trivitayaratana, W.; Trivitayaratana, P. The accuracy of bone mineral density at distal radius on non-forearm osteoporosis identification. J. Med. Assoc. Thail. 2001, 84, 566–571. [Google Scholar]
- Rausch, S.; Klos, K.; Gras, F.; Skulev, H.K.; Popp, A.; Hofmann, G.O.; Mückley, T. Utility of the cortical thickness of the distal radius as a predictor of distal-radius bone density. Arch. Trauma Res. 2013, 2. [Google Scholar] [CrossRef] [PubMed]
- Barngkgei, I.; Al Haffar, I.; Khattab, R. Osteoporosis prediction from the mandible using cone-beam computed tomography. Imaging Sci. Dent. 2014, 44, 263–271. [Google Scholar] [CrossRef] [PubMed]
- Webber, T.; Patel, S.P.; Pensak, M.; Fajolu, O.; Rozental, T.D.; Wolf, J.M. Correlation between distal radial cortical thickness and bone mineral density. J. Hand Surg. 2015, 40, 493–499. [Google Scholar] [CrossRef] [PubMed]
- Chen, B.; Ning, R. Cone-beam volume CT mammographic imaging: Feasibility study. Med. Imaging 2001, 4320, 655–664. [Google Scholar]
- Scarfe, W.C.; Farman, A.G. What is cone-beam CT and how does it work? Dent. Clin. N. Am. 2008, 52, 707–730. [Google Scholar] [CrossRef] [PubMed]
- Casselman, J.; Gieraerts, K.; Volders, D.; Delanote, J.; Mermuys, K.; de Foer, B.; Swennen, G. Cone beam CT: Non-dental applications. JBR-BTR 2013, 96, 333–353. [Google Scholar] [CrossRef] [PubMed]
- Cho, P.S.; Johnson, R.H.; Griffin, T.W. Cone-beam CT for radiotherapy applications. Phys. Med. Biol. 1995, 40. [Google Scholar] [CrossRef]
- Arisan, V.; Karabuda, Z.C.; Avsever, H.; Özdemir, T. Conventional multi-slice computed tomography (CT) and cone-beam CT (CBCT) for computer-assisted implant placement. Part І: Relationship of radiographic gray density and implant stability. Clin. Implant Dent. Relat. Res. 2013, 15, 893–906. [Google Scholar] [CrossRef] [PubMed]


| Subjects | Non-Osteoporosis (n = 9) | Osteoporosis (n = 14) | All Subjects (n = 23) |
|---|---|---|---|
| Sex (n) | Male 2 | Male 1 | Male 3 |
| Female 7 | Female 13 | Female 20 | |
| Age (years) | 63.3 ± 9.57 | 69.7 ± 6.62 | 67.2 ± 8.32 |
| 50–59 (n) | 3 | 1 | 4 |
| 60–69 (n) | 5 | 5 | 10 |
| 70–79 (n) | 1 | 8 | 9 |
| Height (cm) | 159.7 ± 8.81 | 151.9 ± 8.34 | 155 ± 9.20 |
| Weight (kg) | 62.2 ± 7.68 | 51.2 ± 8.80 | 55.5 ± 9.85 |
| BMI (kg/m2) | 24.4 ± 3.14 | 22.1 ± 2.19 | 23.0 ± 2.81 |
| BMDf (g/cm2) | 0.698 ± 0.09 | 0.5 ± 0.07 | 0.6 ± 0.11 |
| Correlation Coefficients | Region D1 | Region M |
|---|---|---|
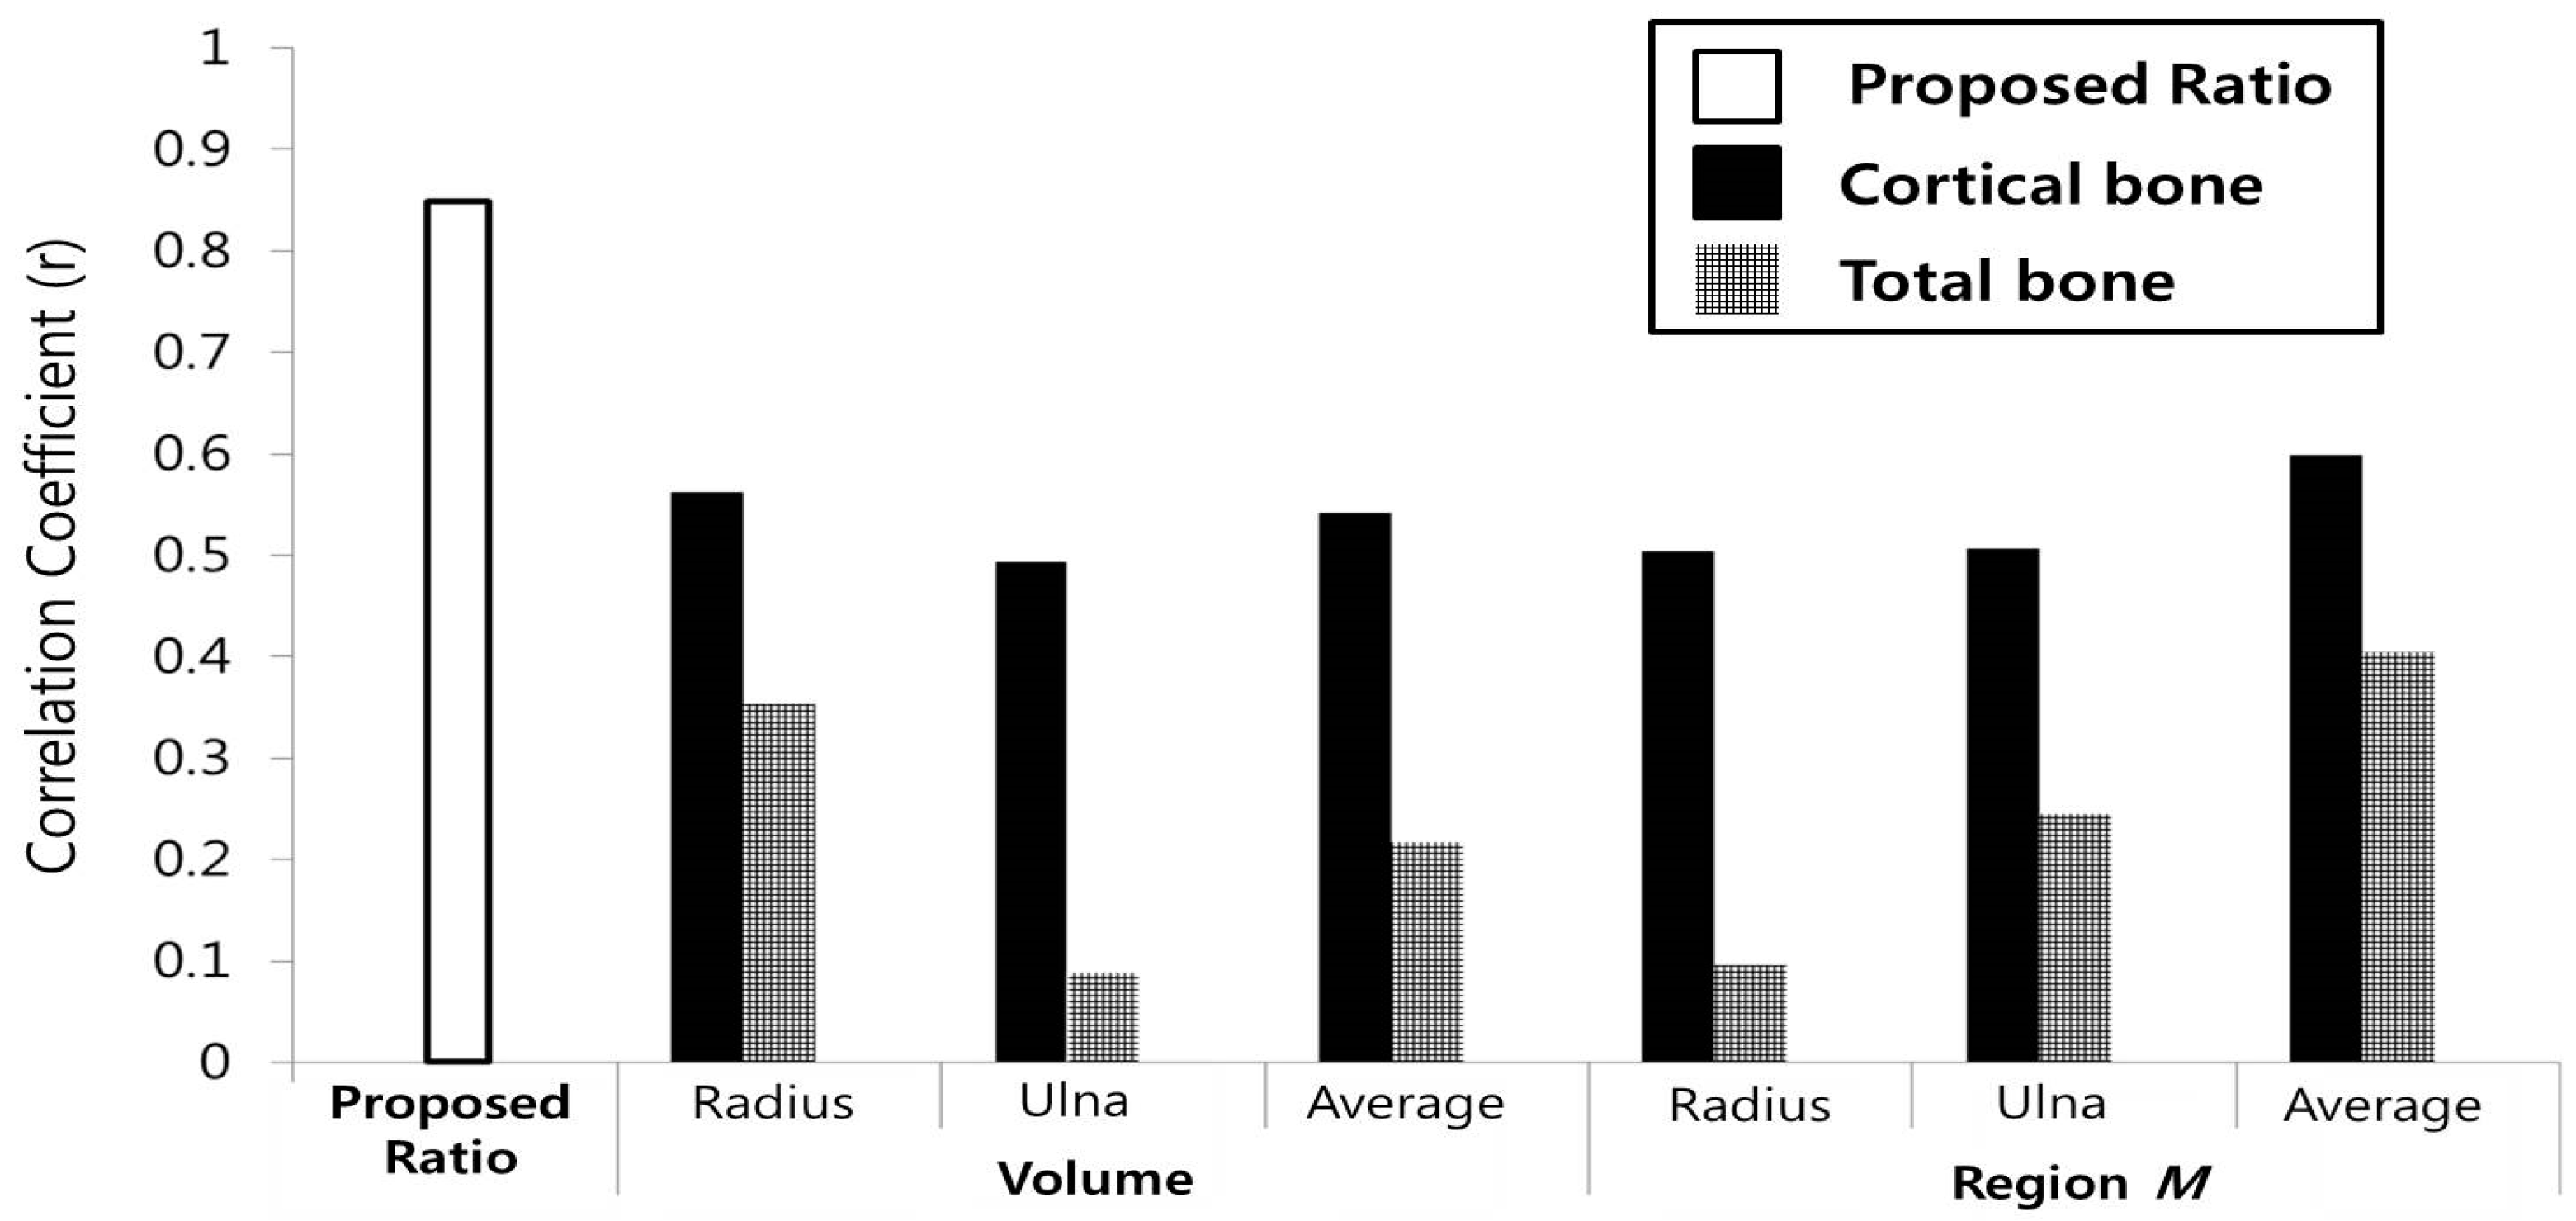
| Rca/ta(radius) | 0.823 | 0.815 |
| Rca/ta(ulna) | 0.785 | 0.807 |
| Rca/ta(total) | 0.835 | 0.827 |
| Rca/ta(average) | 0.834 | 0.857 |
| Errors | RMSE (Root Mean Square Error) | MAPE (Mean Absolute Percentage Error) | ||
|---|---|---|---|---|
| Region (G) | D1 | M | D1 | M |
| RGca/ta(total) | 0.0609 | 0.0615 | 4.7091 | 4.9510 |
| RGca/ta(average) | 0.0609 | 0.0564 | 4.7175 | 4.5105 |
| Correlation Coefficients | BMDls | BMDtf | BMDf |
|---|---|---|---|
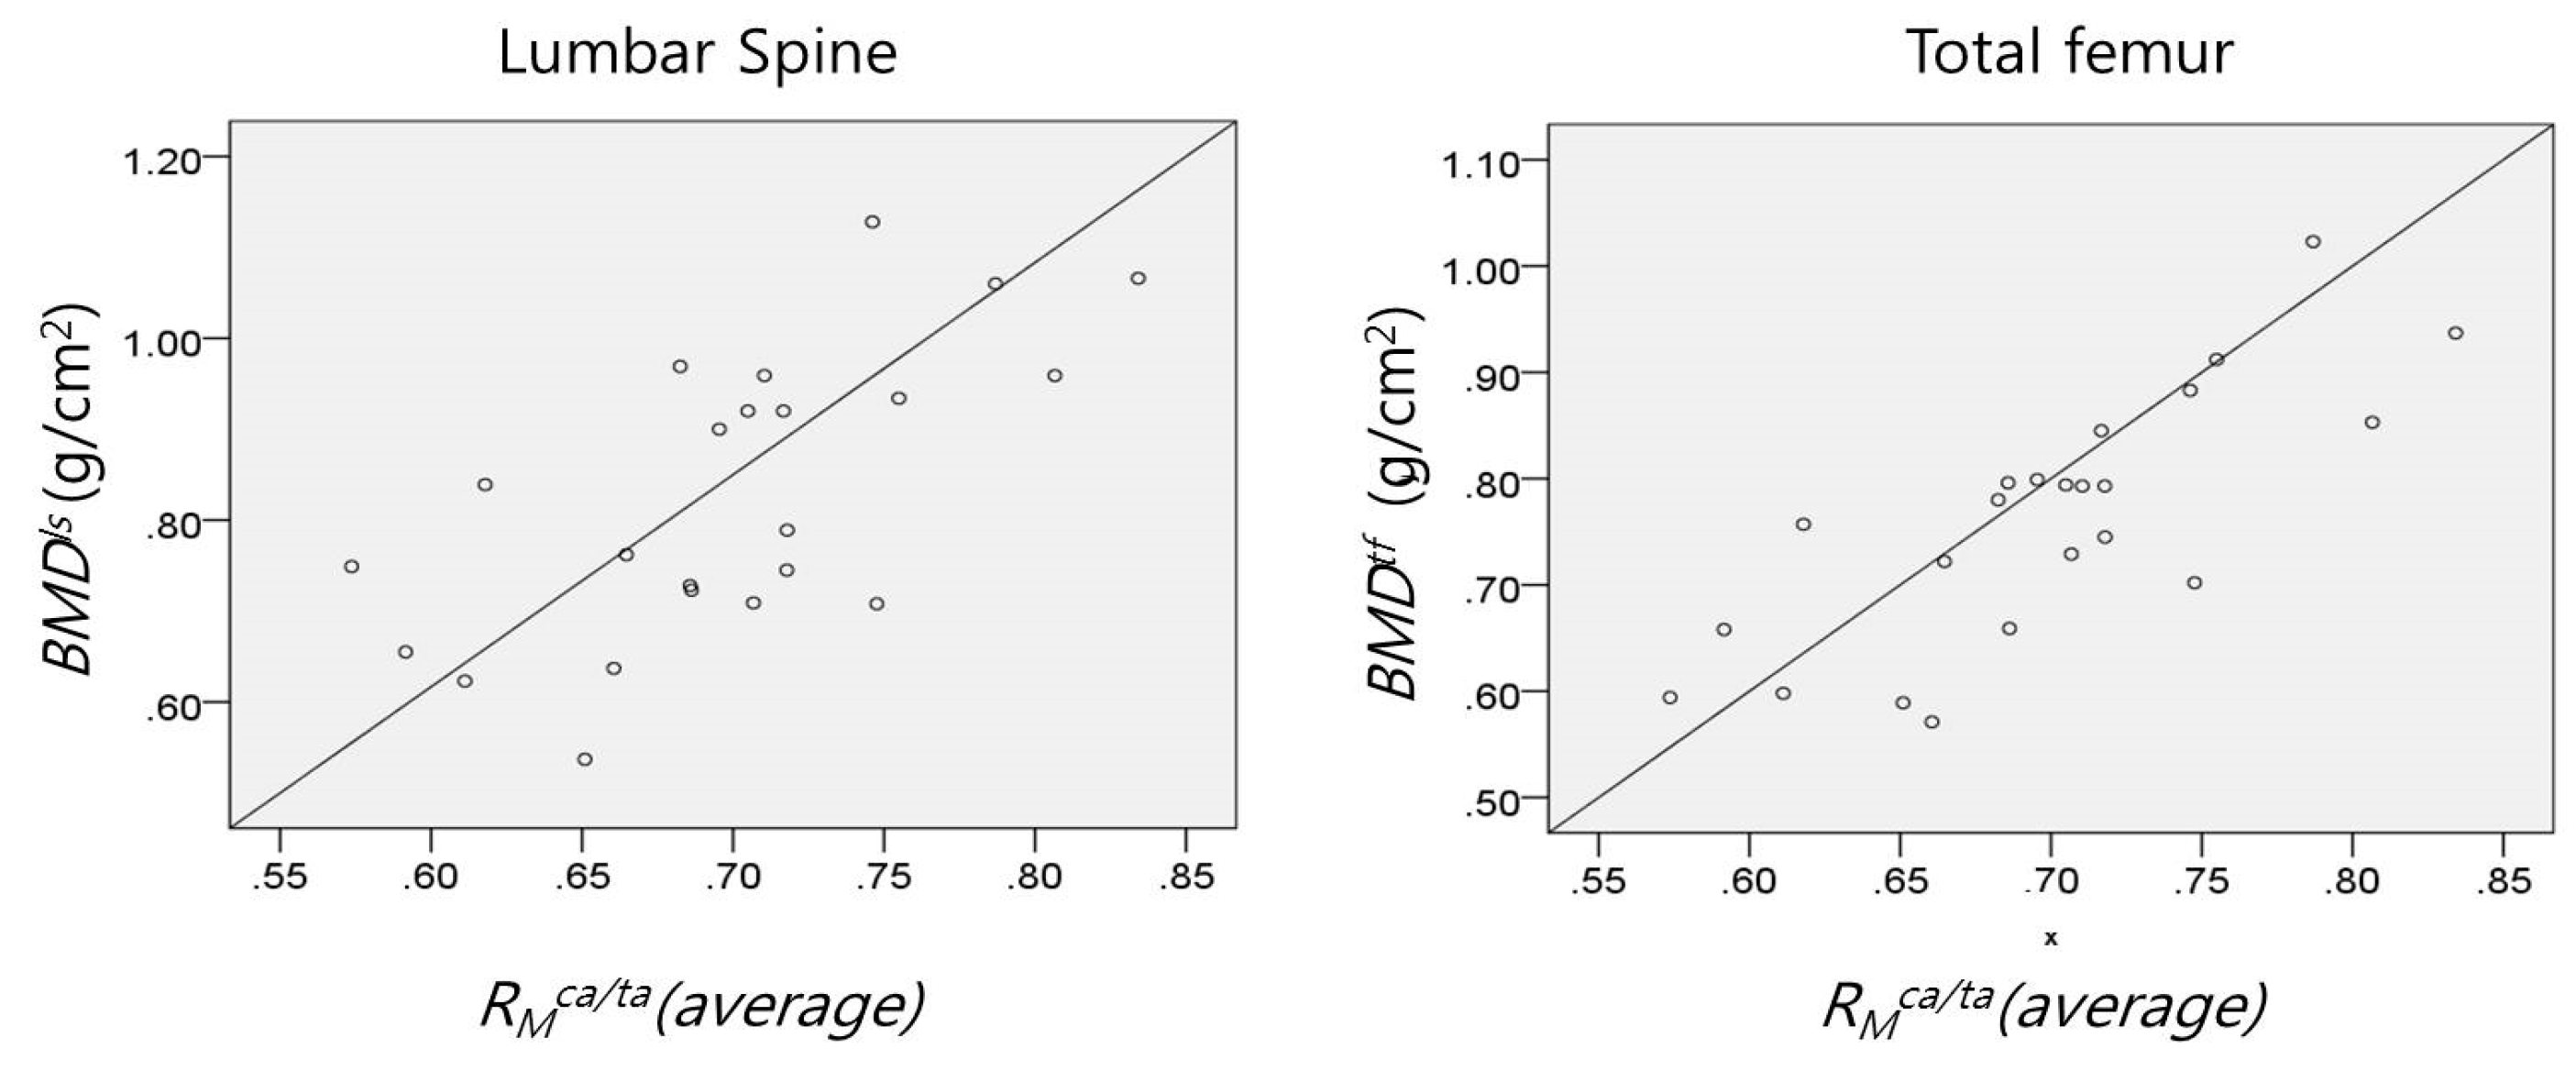
| RMca/ta(average) | 0.647 | 0.792 | 0.857 |
© 2016 by the authors; licensee MDPI, Basel, Switzerland. This article is an open access article distributed under the terms and conditions of the Creative Commons by Attribution (CC-BY) license (http://creativecommons.org/licenses/by/4.0/).
Share and Cite
Jeong, K.; Ko, H.; Lee, C.-H.; Lee, M.S.; Yoon, K.-H.; Lee, J. A Novel Method for Estimation of Femoral Neck Bone Mineral Density Using Forearm Images from Peripheral Cone Beam Computed Tomography. Appl. Sci. 2016, 6, 113. https://doi.org/10.3390/app6040113
Jeong K, Ko H, Lee C-H, Lee MS, Yoon K-H, Lee J. A Novel Method for Estimation of Femoral Neck Bone Mineral Density Using Forearm Images from Peripheral Cone Beam Computed Tomography. Applied Sciences. 2016; 6(4):113. https://doi.org/10.3390/app6040113
Chicago/Turabian StyleJeong, Kwanmoon, Hoon Ko, Chang-Hoon Lee, Myeung Su Lee, Kwon-Ha Yoon, and Jinseok Lee. 2016. "A Novel Method for Estimation of Femoral Neck Bone Mineral Density Using Forearm Images from Peripheral Cone Beam Computed Tomography" Applied Sciences 6, no. 4: 113. https://doi.org/10.3390/app6040113
APA StyleJeong, K., Ko, H., Lee, C.-H., Lee, M. S., Yoon, K.-H., & Lee, J. (2016). A Novel Method for Estimation of Femoral Neck Bone Mineral Density Using Forearm Images from Peripheral Cone Beam Computed Tomography. Applied Sciences, 6(4), 113. https://doi.org/10.3390/app6040113