Article

Evaluation of Reaction Parameters of the Phenol Steam Reforming over Ni/Co on ZrO2 Using the Full Factorial Experimental Design

1
Centre of Hydrogen Energy, Institute of Future Energy, Universiti Teknologi Malaysia, 81310 Skudai, Johor, Malaysia
2
Department of Chemical Engineering, Faculty of Chemical and Energy Engineering, Universiti Teknologi Malaysia, 81310 Skudai, Johor, Malaysia
*
Author to whom correspondence should be addressed.
Appl. Sci. 2016, 6(8), 223; https://doi.org/10.3390/app6080223
Submission received: 2 June 2016 / Revised: 21 July 2016 / Accepted: 3 August 2016 / Published: 10 August 2016

Abstract

:
Full factorial experimental design with 32 runs was used to investigate the significant and interaction variable of the reaction parameters on phenol steam reforming toward hydrogen production. Effects of selected factors on the phenol conversion (Y1) and hydrogen yield (Y2) were evaluated. These factors were as follows: (A) temperature (500 and 800 °C); (B) feed flow rate (0.16–0.46 mL/min); (C) catalyst weight (0.1–0.3 g); (D) Ni-Co ratio (0–1); and (E) phenol concentration in the feed (2–10 wt %). Ni and Co over ZrO2 support for catalytic performance of phenol steam reforming (SRP) was prepared by the impregnation method. The result indicated that all the main independent variables had significant influence on the dependent variable of Y1 and Y2 with a range of 2.7%–96.8% and 21.4%–72.4%, respectively. Additionally, some interaction variables like AE, BE, CE, and DE have also influenced the Y1 and Y2 responses. This design showed that the best initial conditions that produced maximum Y1 and Y2 responses were at 800 °C, 0.16 mL/min feed flow rate, 0.3 g of catalyst, 0 ratio of Ni-Co (Co/ZrO2), and 10 wt % of phenol in the feed, where the phenol conversion was predicted to be 94.98% and the hydrogen yield was predicted to be 67.4%. Within the limits the variables were examined, a regression model which well-fitted the experimental data was proposed. The regression model were reduced to simplify and to get the significant regression coefficient with p-value less than 0.05.

Graphical Abstract

1. Introduction

Due to fossil fuels exhaustion, the growth of concern about global warming, and the increase in major air toxics, hydrogen has emerged as one of the best clean energy vectors [1]. H2 can be produced from maintainable liquid fuels or phenols that consist of around 38 wt % [2] of the unwanted component of pyrolysis oil. However, this component can be transformed into H2 rich gas, which makes phenol an ideal potential H2 source. Based on previous research, there are two successive reactions that may take place in the steam reforming of phenol [3]. One of the reactions for H2 production from phenol is steam reforming of phenol (SRP), which can produce more H2 yield based on stoichiometry in Equations (1) and (2):
C 6 H 5 OH + 5 H 2 O     6 CO + 8 H 2 ,   Δ H o = 710.91  kJ / mol
CO + H 2 O CO 2 + H 2 ,   Δ H o = 41.15  kJ / mol
Ni-based catalysts with a high activity for the phenol steam reforming process have been investigated extensively in recent years [4,5,6] due to the ability to cleave C–C, O–H, and C–H bonds [7]. In addition, cobalt can assist with C–C bond cleaving at temperatures as low as 400 °C; this shows high production of H2 and CO2 [8] due to the highly favourable water gas shift reaction [9,10,11]. However, there are a few items that can be identified as the catalyst in the reforming of phenol: the conversion of phenol, and the yield of H2, CO or CO2. Many issues affect this performance, such as the steam to phenol (S/P) ratio, catalyst composition, flow rate of carrier gas, operating temperature, reactant feed rate and space time, preparation method, catalyst particle size, amount of catalyst, and ratio of active metals in multiple active metal catalyst use. Exothermic reactions, high phenol conversion, and the rate of gas production all occur at a high temperature. The same results were found in previous works regarding the temperature effect on phenol conversion. Some researchers have found that the conversion of phenol increased with the increasing of temperature [6,12,13,14]. Based on the works of Rioche et al. [13] and Shurong et al. [15], the increase in catalyst activity is based on the increasing temperature. They have found that a complete phenol conversion occurs at high temperatures. There has been no research studying the amount of catalyst, the feed reactant flow, or the metal ratio in the steam reforming of phenol. However, some previous works did use other feeds like methanol, acetic acid, glycerol, and alcohol.
Regarding previous works, increasing the space time [16,17] or expanding the contact time by increasing the amount of the catalyst [18,19] can result in an increase in the activity of the catalyst. However, the catalytic performance also depends on the kind of catalyst [17,20,21] and the technique of catalyst preparation [17].
DOE methods are more suitable than one-factor-at-a-time techniques because by studying multiple factors at the same time, a high efficiency can be obtained. These techniques have the following common benefits [22]: (1) more information per experiment than accidental methods; (2) a decrease in the number and fee of experiments; (3) making the calculation of the interaction amongst possible variables within the series studied, leading to better facts about the process; and (4) simplifying the description of the significant operation conditions for the scale-up process. Therefore, these techniques have been considered as powerful tools for process examination [23,24,25,26,27].
A numerical design of experiment (DOE) was applied in order to investigate the interaction amongst factors and the significance of factors on phenol conversion. The DOE capabilities improve the processes by screening the factors to determine which are important for explaining the process variation. After screening the factors, DOE helped to understand how these factors interact during the process. It can then find the factor settings that produced optimal process performance. Thus the DOE method is a great tool for process performance testing [28,29,30].
The aim of the current study is to investigate the relationship between the five control parameters, significant variables, and the interaction between variables via full factorial design. Therefore, a detailed study of DOE in the catalytic performance of steam reforming of phenol (SRP) for hydrogen production was carried out. The performance of the catalyst was stated according to the phenol conversion and hydrogen yield.

2. Experimental

2.1. Catalyst Preparation

The impregnation method was applied to produce the Ni or Co over ZrO2 catalyst. The advantage of the impregnation method is that is produces a high concentration of active materials on the catalyst surface [31]. The procedure of this method was reported by Athanasios et al. [32]. The techniques used to make the catalyst were as follows: firstly, 9 g of Zirconium oxide (ZrO2) was dispersed in 250 mL of deionized water and stirred for 2 h at 90 °C. While stirring the slurry, 4.94 g of active metal (nickel nitrate hexahydrate (Ni(NO3)2·6H2O) or cobalt nitrate hexahydrate (Co(NO3)2·6H2O) was added to the slurry. The mixture was held until it became an extremely viscous paste. The paste was dried at 110 °C for 24 h and the catalyst was calcined at 750 °C for about three hours. Then, the catalyst was pelletized and sieved on two layers of 35 and 34 mesh to acquire particles sizes between 1.0 mm and 1.4 mm.

2.2. Catalyst Characterization

The crystalline structure of the reduced catalyst was determined by X-ray diffraction (High-Resolution X-ray Diffractometer brand Bruker D8 Advance, BRUKER AXS INC., Fitchburg, WI, USA) using a Cu Kα radiation at 40 kV and 30 mA. Diffraction angles were measured in steps of 0.02°, at 1 s/step in the range of 20 to 80 (2θ). The size of the metal crystallites was calculated from line broadening with the help of the Scherrer equation [33]. The total surface area of catalysts was measured using the multipoint BET-N2 on a surface area analyzer (Micromeritics, Gemini 2360, Norcross, GA, USA). Prior to the analysis, the samples were degassed at 200 °C for 2 h to remove unwanted components on the surface before outgassing the samples.
A chemisorption analyser (Micromeritics, Chemisorb 2720, Norcross, GA, USA), was used to evaluate the reducibility of the active metals (nickel and cobalt) on the support by applying a temperature-programmed reduction of hydrogen (TPR-H2). Before the reduction, 25 mg of the catalyst was treated at 300 °C under high purity 99.99% helium with the flow rate of 20 mL/min for an hour to remove moisture and other gas impurities. The TPR-H2 profile was obtained by ramping up the temperature at 10 °C/min, 20 mL/min of 10% (vol.) H2/Ar between 50 °C and 800 °C.
Thermogravimetric analysis (TGA) profiles were carried out in a Perkin Elmer TGA instrument (Waltham, MA, USA) operated under nitrogen flowing in the heating rate of 10 °C/min. Exothermic weight loss was observed at the temperature range between 30 and 950 °C.

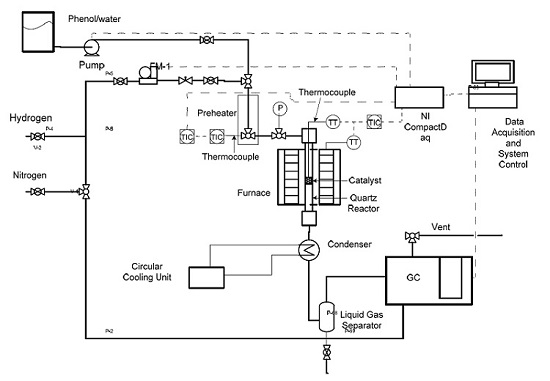
2.3. Catalyst Performance Test

A 0.2 g weight of catalyst was employed to investigate the performance of the catalyst. The catalyst bed was located inside a 6-mm ID quartz tubular reactor. A coaxially centred thermocouple was incorporated into the reactor. The nitrogen stream passed through the catalyst at 300 °C and subsequently reduced in situ with a 30 mL/min stream of pure hydrogen for 1 hour at 600 °C. The mixture of phenol and water was fed into the pre-heater by means of an HPLC pump (Bio-RadTM, Series 1350, Berkeley, CA, USA) before mixing with carrier N2. The samples in reduced forms were tested in the steam reforming of phenol (H2O/phenol(mol/mol) = 9:1) at an atmospheric pressure and a temperature range of 500 to 800 °C, maintaining the reaction for 6 h in order to check if there was any deactivation of the catalysts. The reaction products were analysed on-line by GC with TCD (Agilent 6890N, Agilent Technologies, Santa Clara, CA, USA ) equipped with Carboxen Plot 1010 capillary column (Fused Silica, 30 m × 0.53 mm, Sigma-Aldrich Corporation, St. Louis, MO, USA) connected in series, using argon as the carrier gas. The 95% level of confidence interval was chosen for the uncertainty in figure values for gas production and phenol conversion. The flow diagram of this work was the same as the study done by Abdullah et al. [34] and is shown in Figure 1. As a result of the products variation, the catalyst performance was characterized by two parameters; phenol conversion percentage and product yield. They were calculated according to Equations (3) and (4):
Phenol conversion  ( % ) = [ Phenol ] in [ Phenol ] out [ Phenol ] in × 100
H 2  yield  ( % ) = moles of  H 2  obtained moles of  H 2  stochiometric potential × 100 .

2.4. Statistical Design of Experiment

A full experiment was carried out in order to study the relationship between the control variables, significant variables, and the interactions between the test parameters. A 25-factorial design was applied in the present investigation. This required a selection of appropriate responses, factors, and levels. Phenol conversion and hydrogen yield were the responses selected. The factors and the experimental levels for each factor were selected based on literature values, available resources, and results from preliminary experiments. The selection of the factors was based on the operating conditions that had a significant influence on the SRP, according to previous experiments (with different feeds) [12,13,14,16,17,18]. The considered factors chosen were temperature, A, Feed flow rate, B, Catalyst amount, C, the catalyst ratio of Ni to Co over ZrO2, D, and phenol concentration in the feed, E. The factors and their levels were assigned in Table 1. A Minitab statistical software (®16.2.4 , Minitab, Inc., Pennsylvania State University, University Park, PA, USA, 2013) was used to generate the design matrix and to conduct the data analysis. Also, the interaction among the factors was determined using the same software. The design matrix of un-coded values for the factors and the response for all the experimental runs are given in Table 2. Five factors were analyzed at two levels, using a full factorial 25 resulting in 32 runs, in a random order to minimize the effect of uncontrolled variables on responses (Y1 and Y2).
Since one of the aims of this study was to establish a relationship between the five control variables and the responses of the system (phenol conversion and hydrogen yield) a linear regression model was fitted to predict the responses as a function of independent variables and their interactions. In general, the response for the linear regression model is described in Equation (5):
Y i = β 0 + β 1 A + β 2 B + β 3 C + β 4 D + β 5 E + β 6 A B + β 7 A C + β 8 A D + β 9 A E + β 10 B C + β 11 B D + β 12 B E + β 13 C D + β 14 C E + β 15 D E + β 16 A B C + β 17 A B D + β 18 A B E + β 19 A C D + β 20 A C E + β 21 A D E + β 22 B C D + β 23 B C E + β 24 B D E + β 25 C D E + β 26 A B C D + β 26 A B C E + β 28 A B D E + β 29 A C D E + β 30 B C D E + β 31 A B C D E + ε ,
where Yi is the predicted response, β0 is the offset term, βn is the regression coefficient that corresponds to the main effects and interaction effects, and ε is the error term. The level of significance of each coefficient was considered by comparing the smaller p-value (<0.05) or greater t-value. The t-test was used to determine the significance of the regression coefficients of the parameters. The p-values were used as tools to check the significance of each variable and the interaction among the variables. As the first step, a significance test was performed on all the possible terms in models for phenol conversion (Y1) and hydrogen yield (Y2). The results are illustrated in Pareto charts and Normal plots. Then a reduced model was obtained by removing the insignificant terms from the first model with a new reduced regression equation. The R2 value was used to determine the fitting quality of the observed results to the proposed model. The regression analysis, linear regression plots (observed versus predicted value), and Pareto chart of the dependent variables, main effect and interaction plots, surface and contour plots, and response optimizer plots were plotted.

3. Results and Discussion

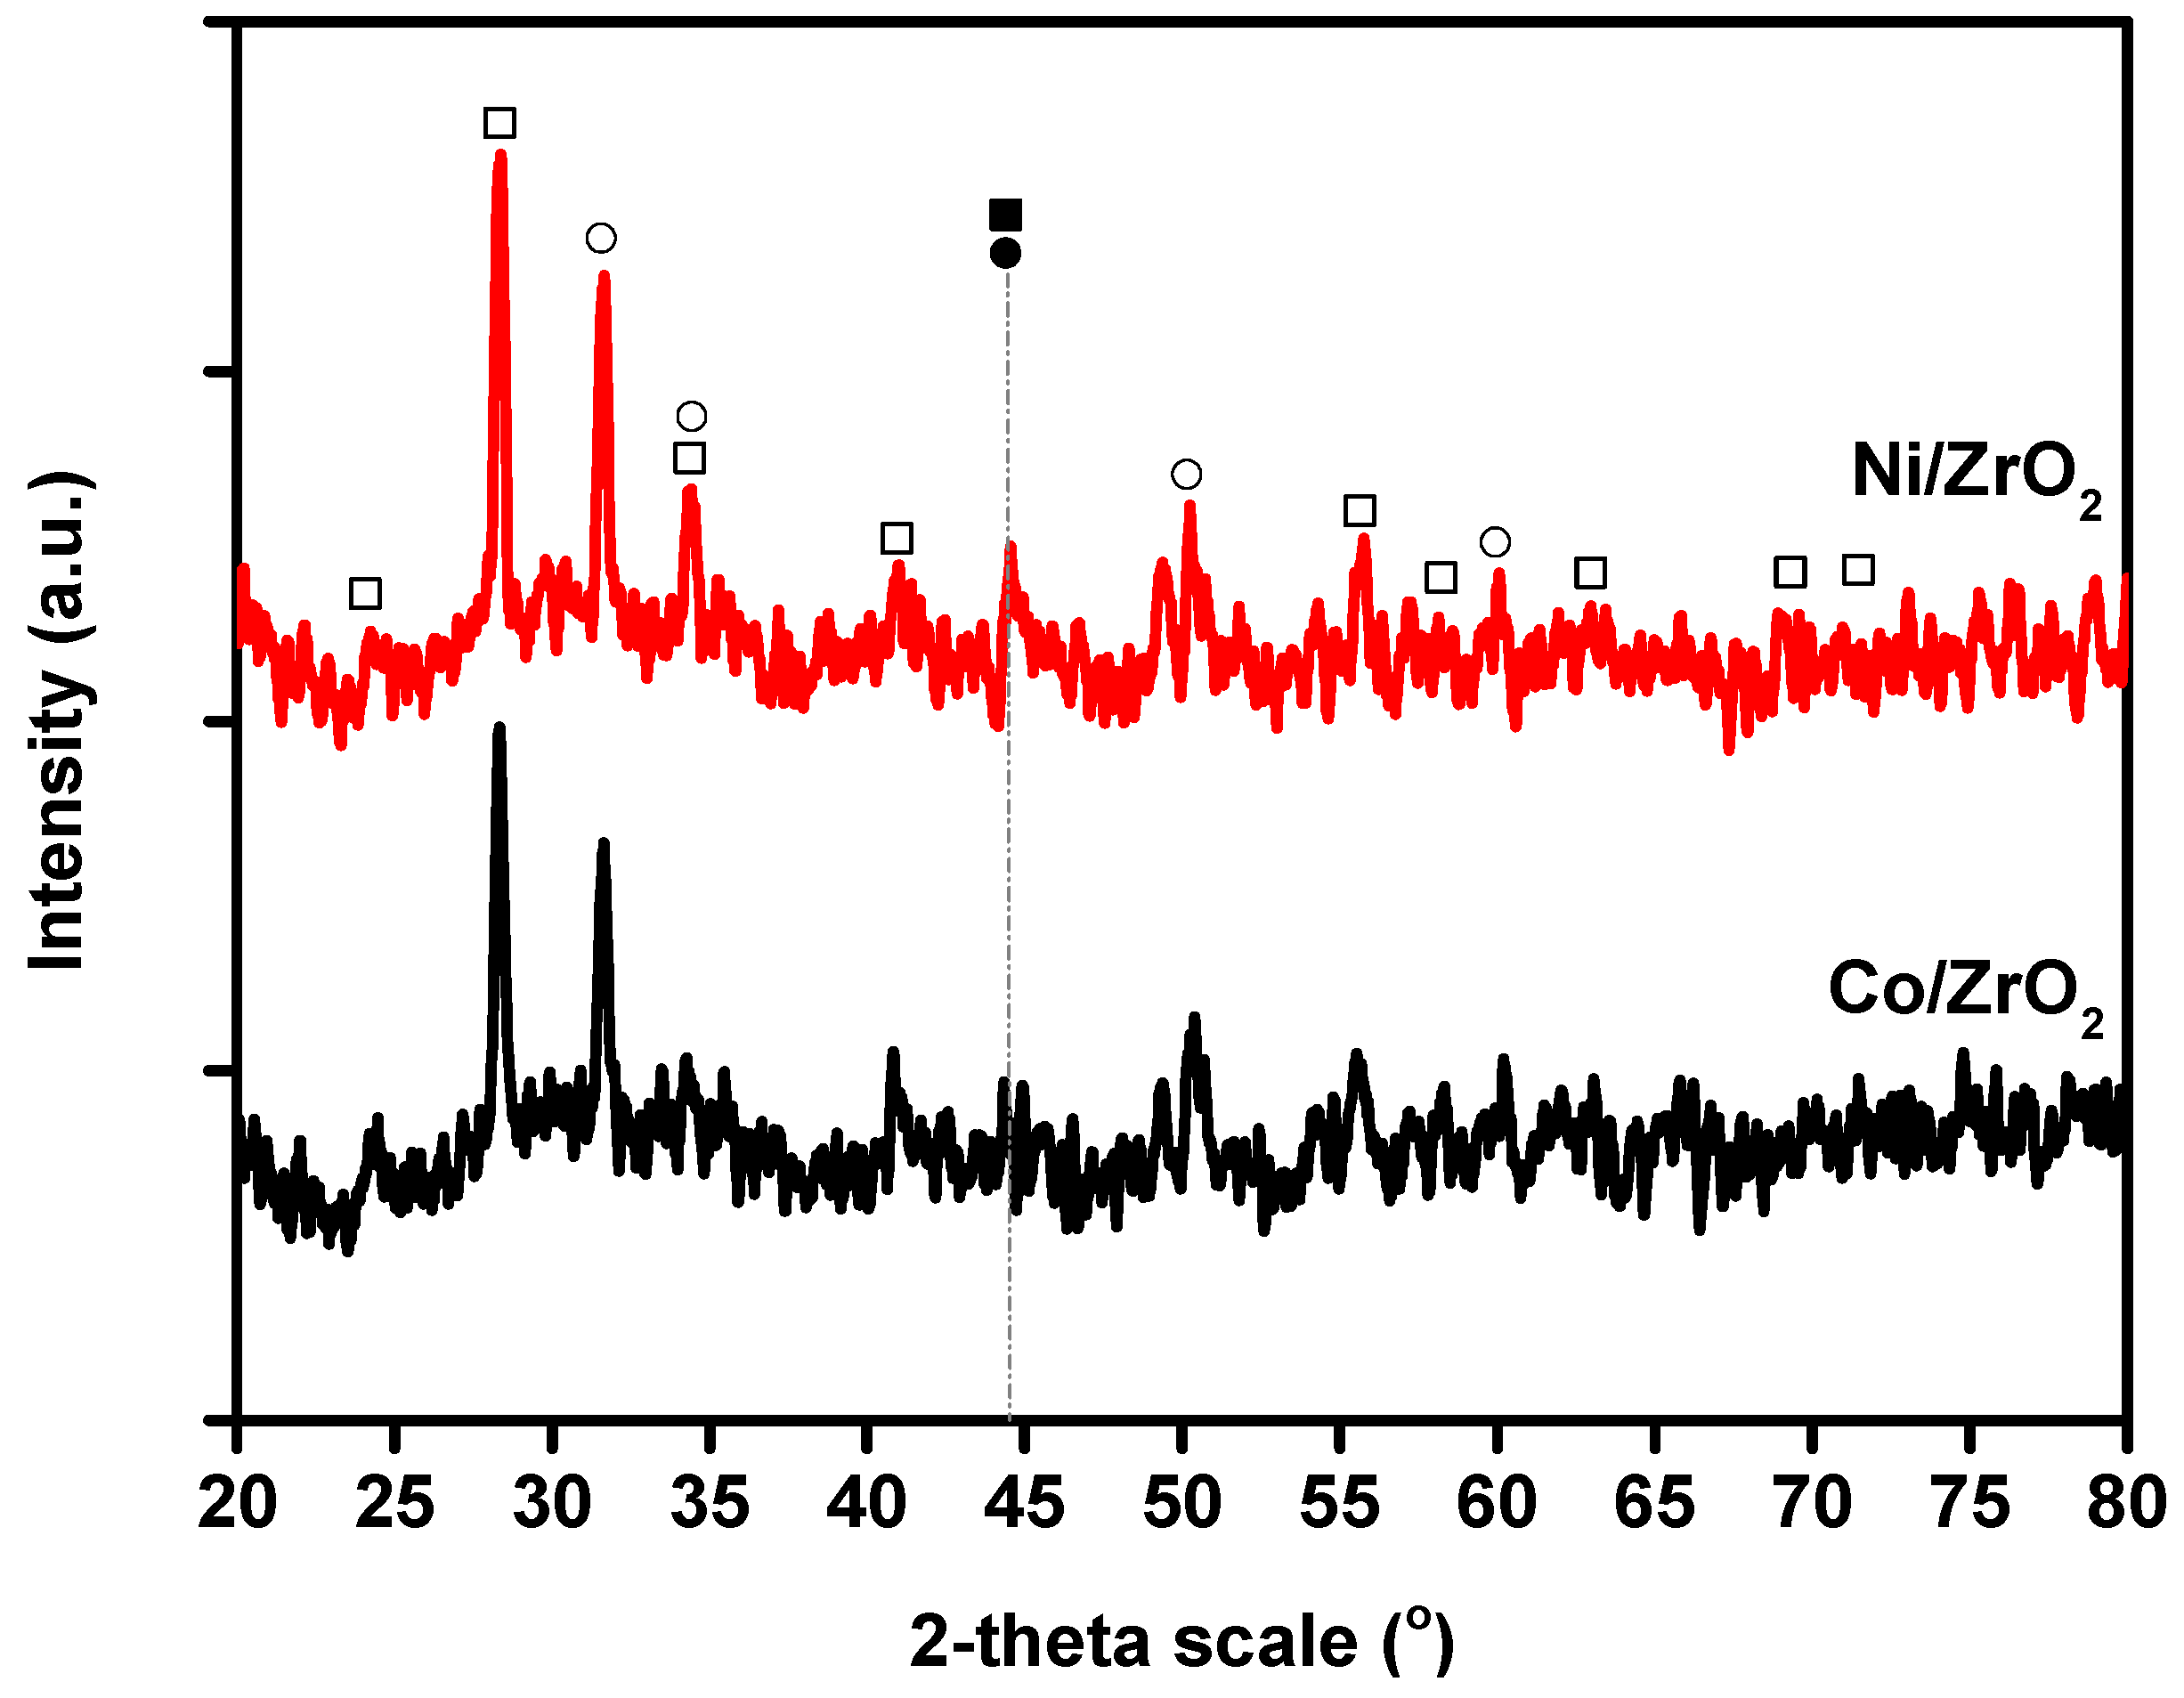
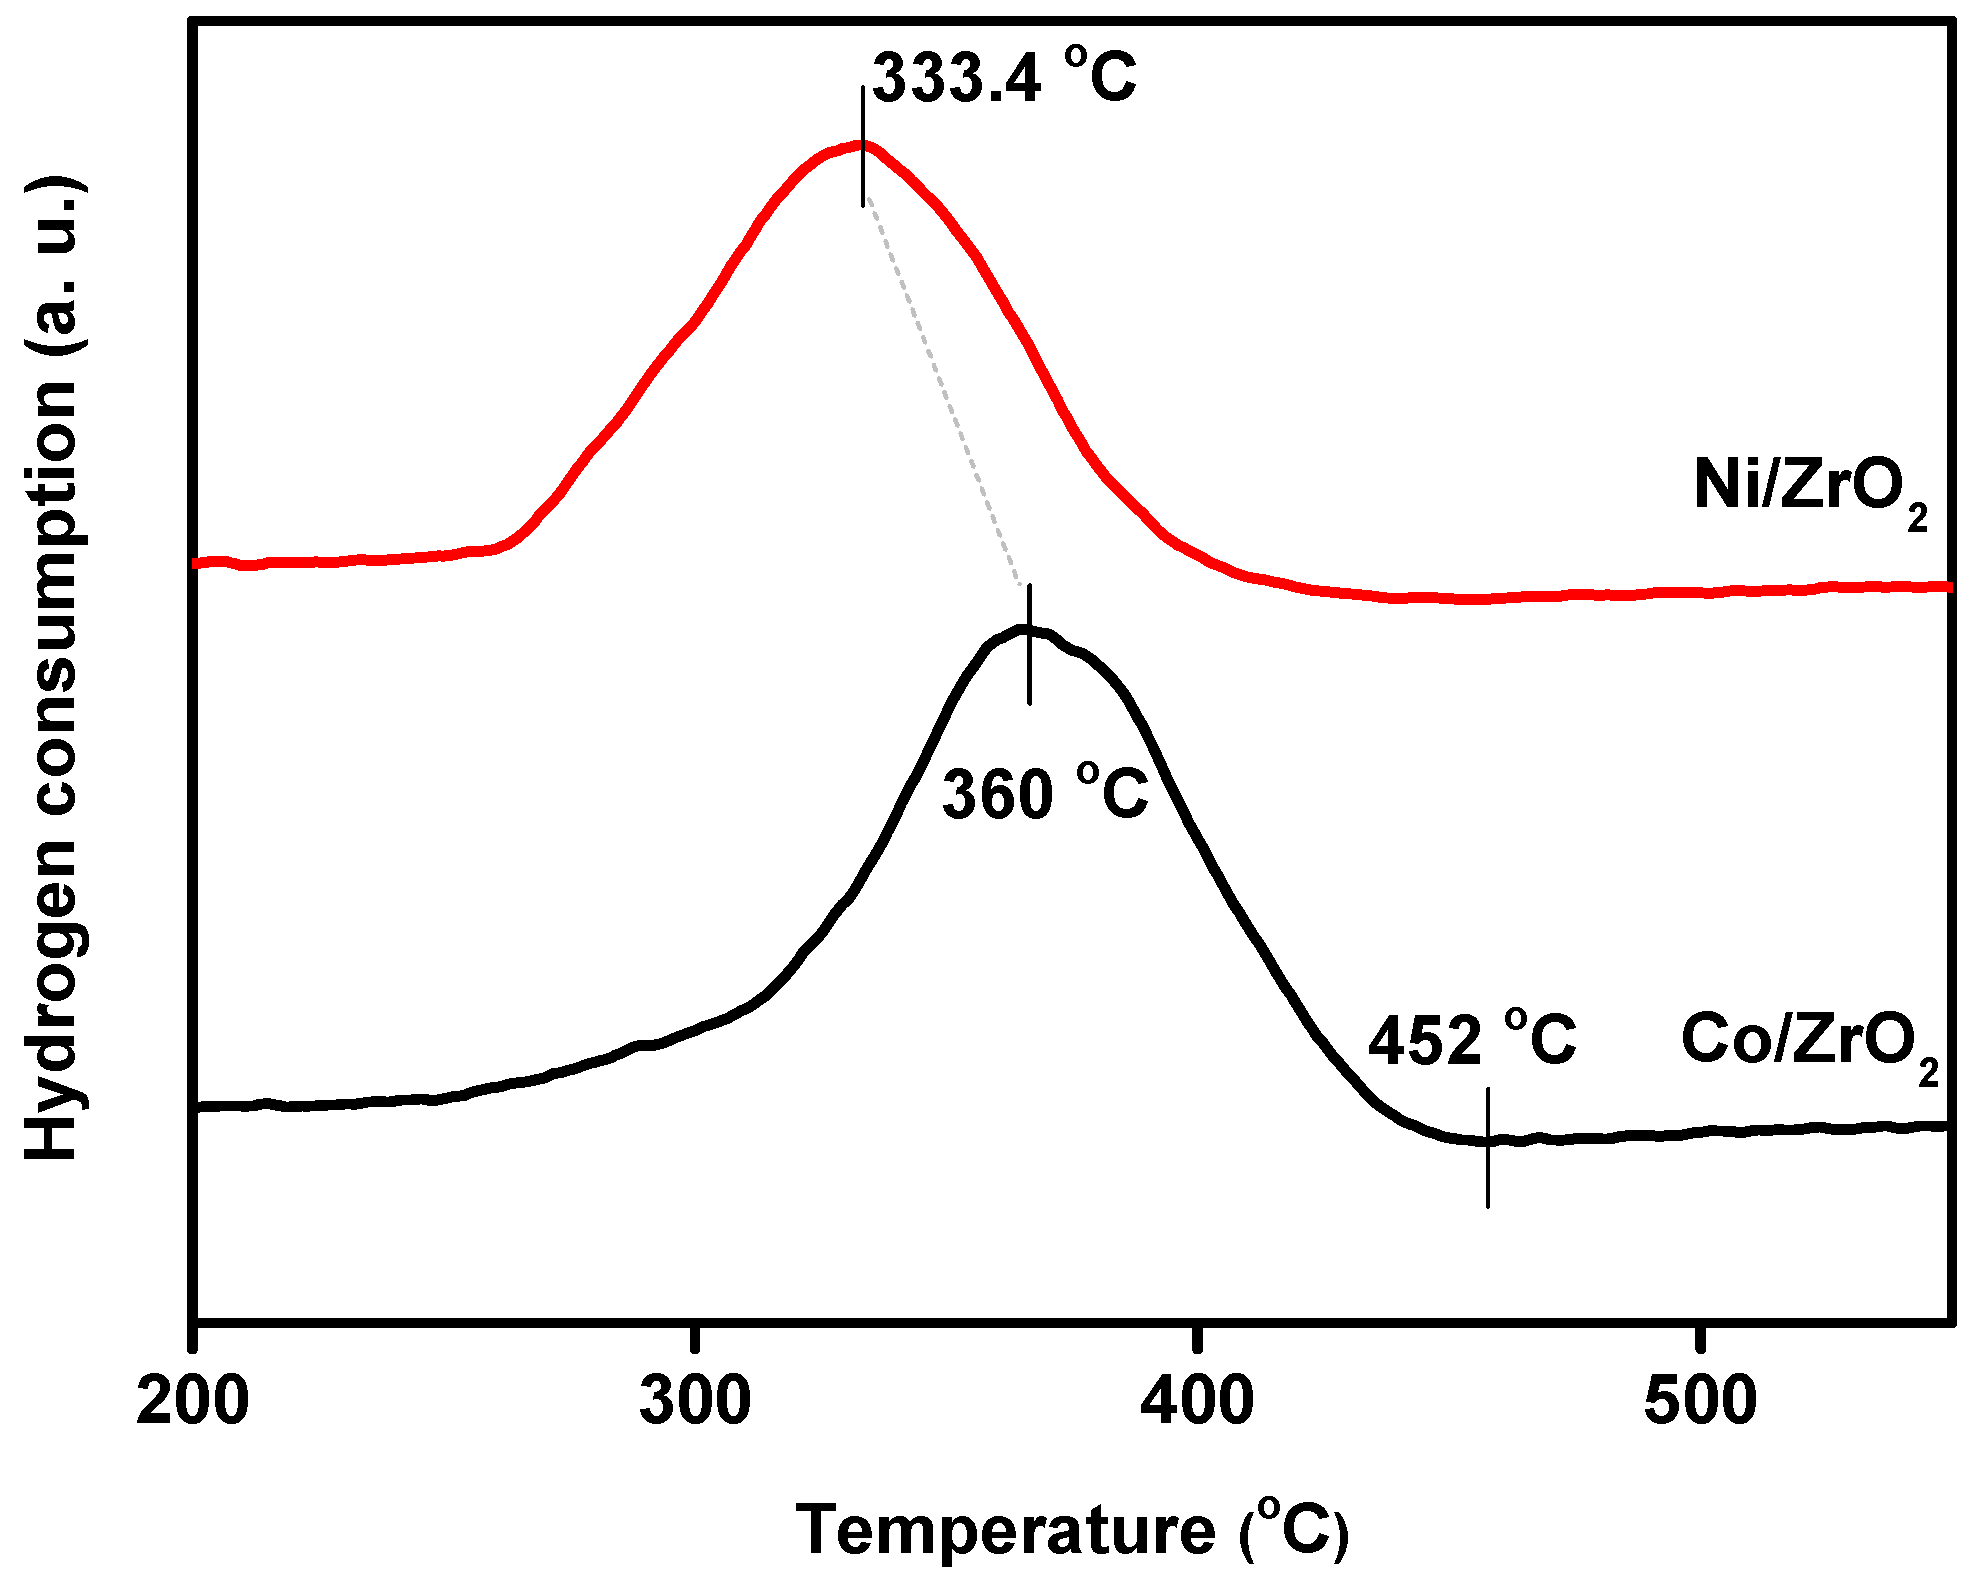
3.1. Characterisation of the Fresh Catalysts

XRD analysis was used to identify the crystal phases of the catalysts. The XRD patterns of the Ni/ZrO2 and Co/ZrO2 catalysts after reduction at 600 °C are displayed in Figure 2. The XRD spectrum was characterized by several intense peaks between the diffraction angles of 20° and 80°. The XRD pattern of the Ni/ZrO2 and Co/ZrO2 catalysts contains Bragg peaks at around 2θ = 44.52°, which corresponds to metallic Ni. This can be attributed to the presence of the cubic [JCPDS 45-1027] structure of Ni and is in agreement with previous research [6,35,36,37]. The diffraction peaks at 2θ = 44.37° correspond to metallic Co [JCPDS 01-1254], similar to reports from previous works [38,39]. It can be inferred that nickel oxide (NiO) and cobalt oxide (CoO) were reduced at 600 °C to metallic Ni [40,41] and metallic Co [42], respectively. The relative intensity of XRD peaks of the supported catalysts depends on the nature of the metal oxide precursors formed during the calcination step [43]. The XRD patterns of the ZrO2 support resulted in a number of peaks located at 2θ of 24.47°, 28.19°, 31.48°, 34.45°, 40.73°, 50.61°, 55.62°, 58.3°, 60.02°, 62.83°, 69.67°, and 71.29° corresponding to the (111), (200), (210), (211), (300), (320), (400), (410), (411), (331), (332), and (422) crystal planes, which can be attributed to the monoclinic ZrO2 (m-ZrO2) and tetragonal ZrO2 (t-ZrO2) [JCPDS 83-0943] structure of the ZrO2. This conforms with previous research [44,45,46,47].
To have better insights into the nature of the cobalt and nickel phases, TPR-H2 of the calcined catalysts was carried out. This helped to explore the level of reduction of the Co and Ni oxides’ species. Figure 3 shows that only single reduction zones were observed. This corresponds to the area below 400 °C (~280–450 °C), corresponding to the reduction of NiO [48,49] and CoO [50,51,52] particles with weak metal–support interaction. Thus, the reduction of the NiO and CoO to metallic Ni and Co agrees with the XRD analysis. In particular, the reductions were peaks shifted to higher temperatures as the Co/ZrO2 catalyst. This suggests that higher temperatures are needed in order to reduce the cobalt oxides (>452 °C) completely, as compared to nickel oxides [53]. Therefore, these catalysts were reduced at 600 °C.

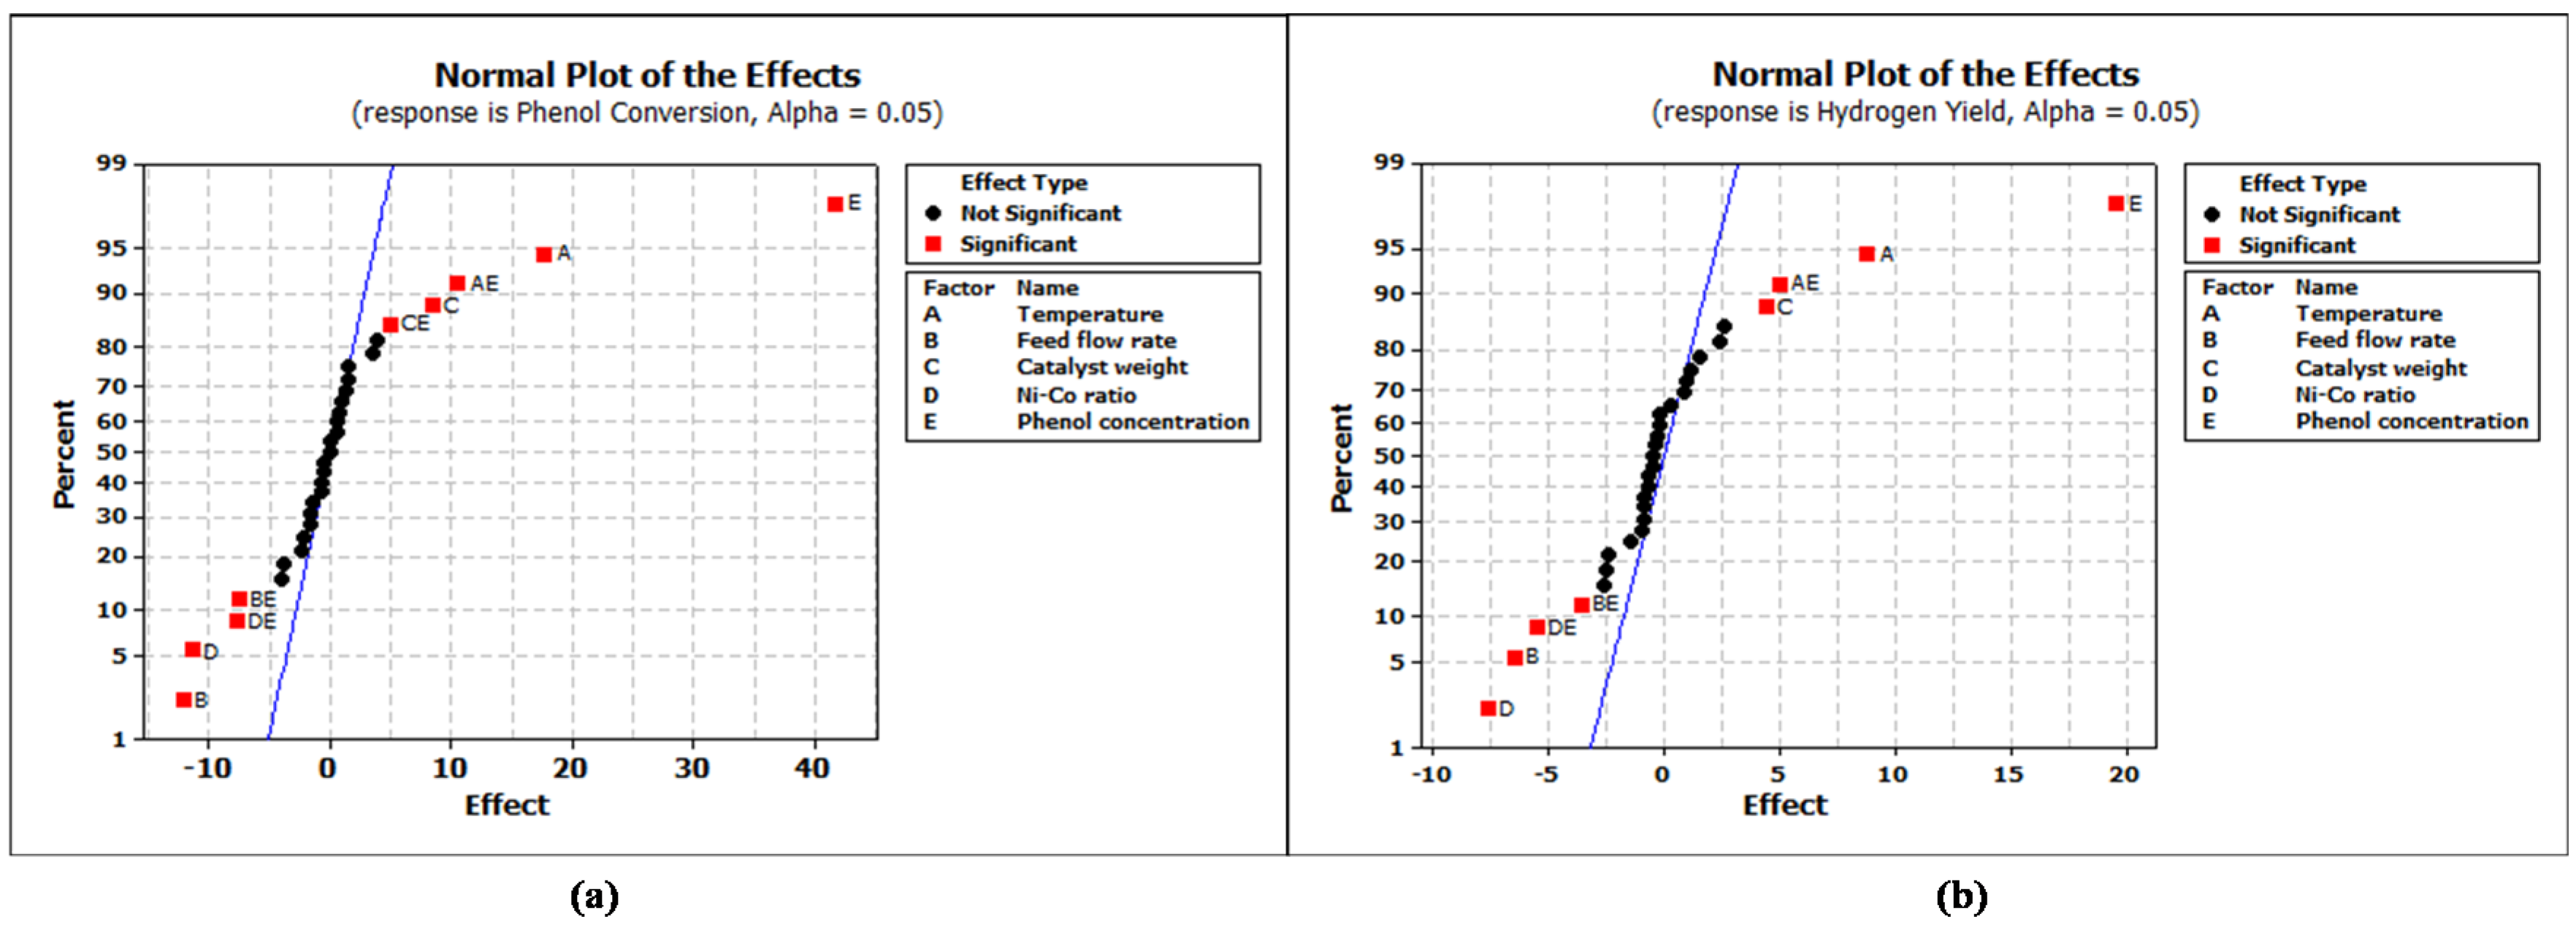
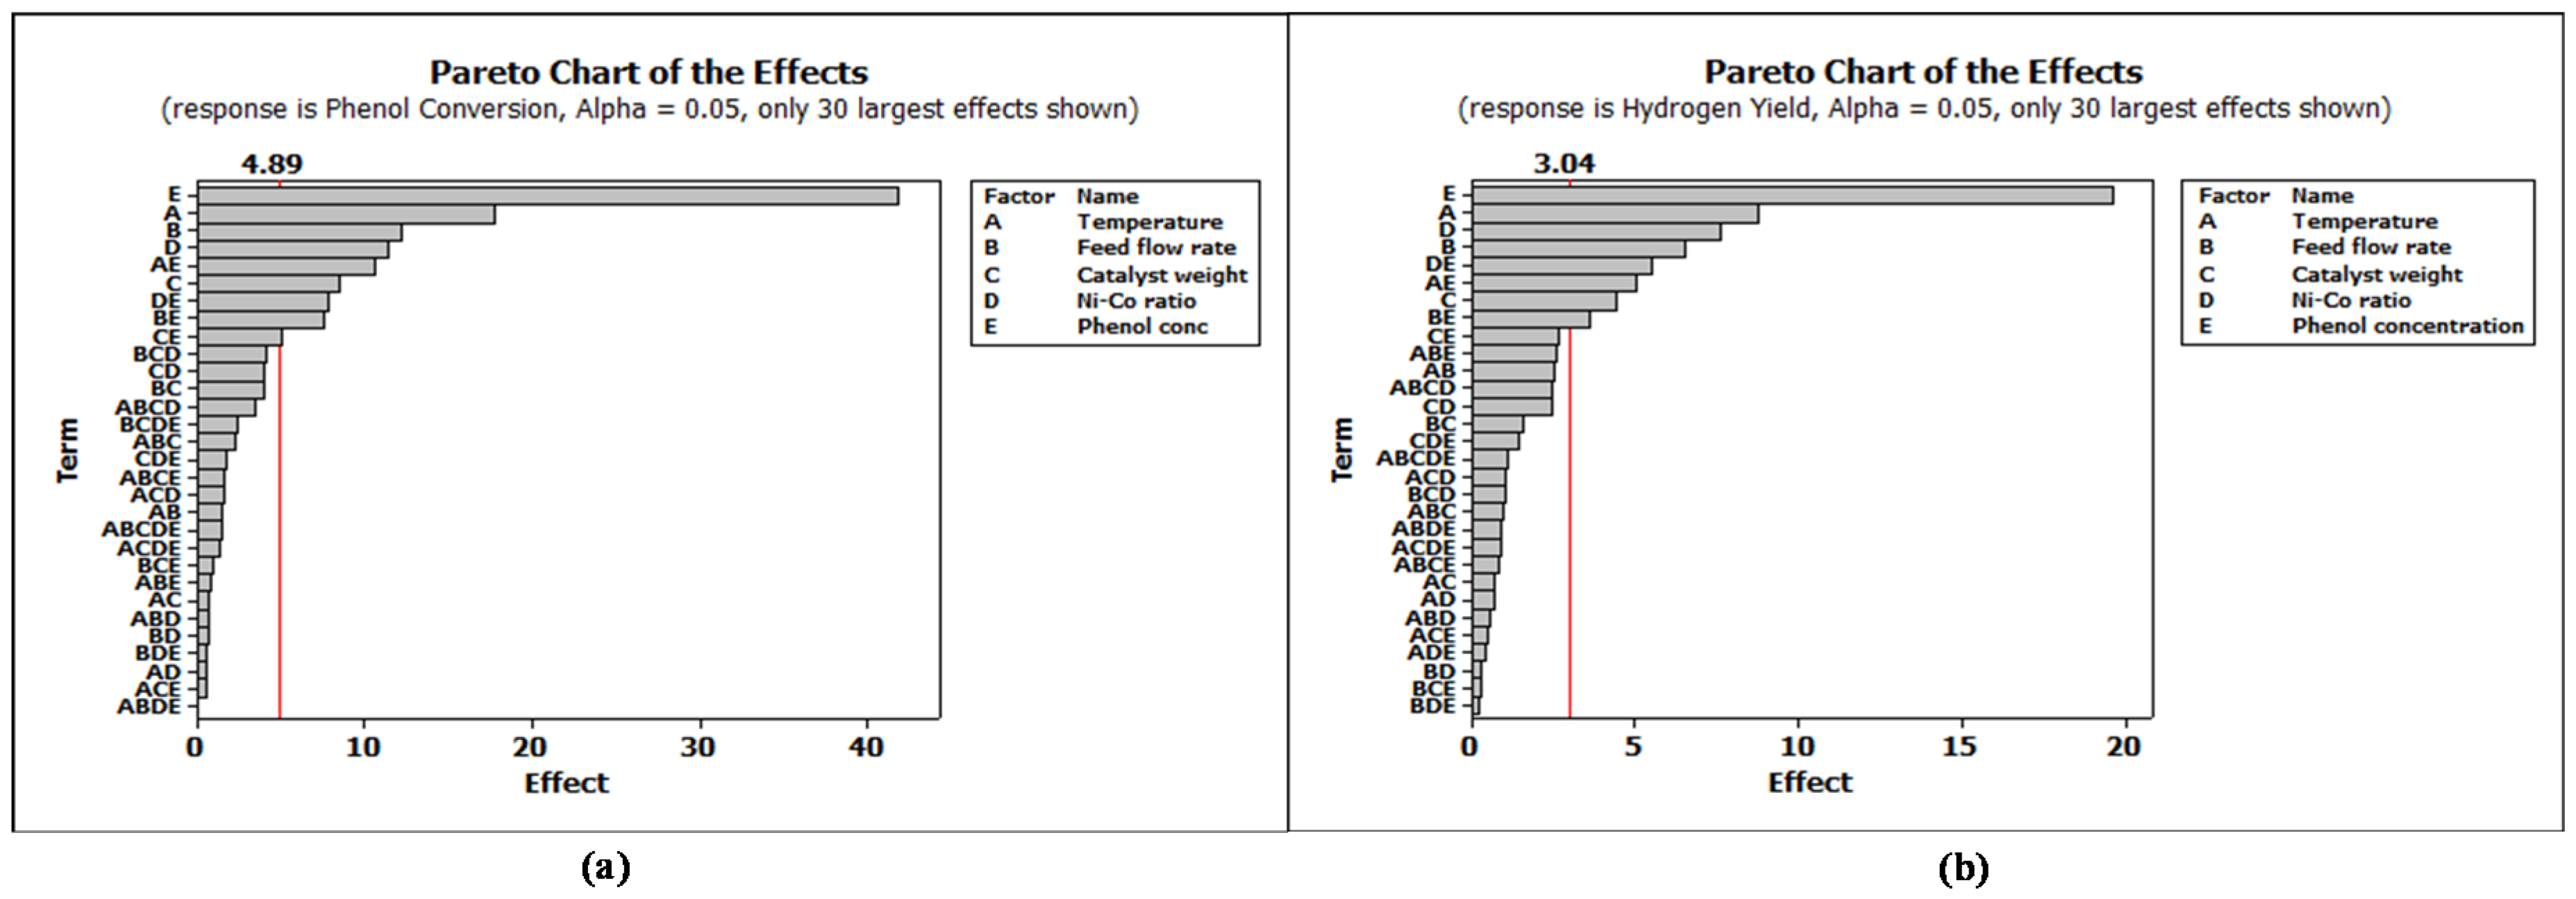
3.2. Factors Screening in a Full 25 Factorial Design for the Initial Regression Model

Table 2 gives the experimental values of the two main responses in each experiment. The 2-level factorial was employed to improve the correlation between the five process variables, temperature, feed flow rate, amount of catalyst and the catalyst of Ni to Co ratio, and phenol concentration in the feed (coded as A, B, C, D, and E, respectively) to responses of phenol conversion (Y1) and hydrogen yield (Y2). Thirty-two sets of experiments were performed to explore the effects of the reaction parameters on the phenol conversion and the generation of hydrogen in the phenol steam reforming process. It was found that the conversion of the phenol varied from 2.7% to 96.8% and H2 yield was in the range of 21.4%–72.4%. The maximum catalyst activity for Y1 of 96.8 and Y2 of 72.4% was found to be at 800 °C, 0.16 mL/min feed flow rate, 0.3 g of catalyst, 0 ratio of Ni-Co (Co/ZrO2), and 10 wt % of phenol in the feed (run number 32).
To identify whether the results are “real” or “chance,” a Normal plot (Figure 4) was used to display the estimates of the main effects among the factors as well as their interaction. To obtain this Normal plot, effects were ranked in ascending order and plotted against their corresponding cumulative probability [54]. All the effects that tended to fall along a straight line in the plot (distributed with mean zero and marked in black) do not demonstrate any significant effect on the responses. In comparison, the significant effects were located far from the straight line and had non-zero means. They appear in red. The significant effects get more distanced from the straight line as they become larger. From Figure 4, it can be seen that all of the main parameters (A, B, C, D, and E) and their interactions (AE, BE, CE, and DE) are found to be “real” parameters for Y1 and Y2. The red marks, which lie to the left of the fitted line, had a negative effect on the responses [55].
The evaluation of the effect of each variable on the Y1 and Y2 may also be verified from the Pareto chart. A Pareto chart (Figure 5) visually represents the absolute values of the effects of main factors and the effects of n-way interaction of factors. The chart includes a vertical reference line at the critical t-value for an alpha of 0.05 (magnitude for a 95% confidence level) to indicate that the factors that extend past this line are potentially important. For a 95% confidence level and 32 degrees of freedom (DF), t-value is equal to 4.89 for Y1 and 3.04 for Y2. It can again be seen from the Pareto chart that all effects are statistically significant. The significance of the n-way interactions could also be compared from the Pareto charts. These results were in agreement with those obtained from the analysis of the Normal plot. These plots clearly indicate that the significance of the variables and their n-way interaction towards Y1 and Y2 decreased in this order: E > A > B > D > AE > C > DE > BE > CE and E > A > B > D > DE > AE > C > BE.
Based on the experimental data, regression models were fitted for Y1 and Y2, as shown in Equations (6) and (7), respectively. The adequacy of the initial model was tested a via parity plot for observed versus predicted values, as demonstrated in Figure 6. As seen in Figure 6, the high value of the correlation coefficient (R2 = 1) demonstrates good correlation between the observed and the predicted responses by the initial models. The analysis of the regression coefficient for initial models Y1 and Y2 is shown in Table 3 and Table 4. In such analysis, a modal term is considered significant if its p-value is less than 0.05 (bold). It was found that among the variables and their interaction, A, B, C, D, E, AE, BE, CE, and DE for Y1 and A, B, C, D, E, AE, BE, and DE for Y2 response were statistically significant.
Y 1 = 8.74 0.002 A 39.7 B 74.48 C 19.41 D + 7.49 E + 0.02 A B + 0.084 A C + 0.03 A D + 0.001 A E + 247.6 B C + 65.85 B D 30.93 B E + 133.44 C D 30.32 C E 6.78 D E 0.2 A B C 0.09 A B D + 0.03 A B E 0.21 A C D + 0.05 A C E + 0.01 A D E 402.2 B C D + 139.9 B C E + 27.72 B D E + 26 C D E + 0.56 A B C D 0.173 A B C E 0.03 A B D E 0.03 A C D E 145.23 B C D E + 0.16 A B C D E
Y 2 = 31.3 0.01 A 37.7 B 43.37 C 10.87 D + 1.3 E + 0.03 A B + 0.04 A C + 0.01 A D + 0.003 A E + 128.3 B C + 30.1528 B D 11.5 B E + 95.75 C D 10.6 C E 5.4 D E 0.1 A B C 0.03 A B D + 0.01 A B E 0.13 A C D + 0.02 A C E + 0.007 A D E 272.9 B C D + 74.17 B C E + 23.01 B D E + 12.8 C D E + 0.3 A B C D 0.11 A B C E 0.04 A B D E 0.02 A C D E 83.82 B C D E + 0.12 A B C D E

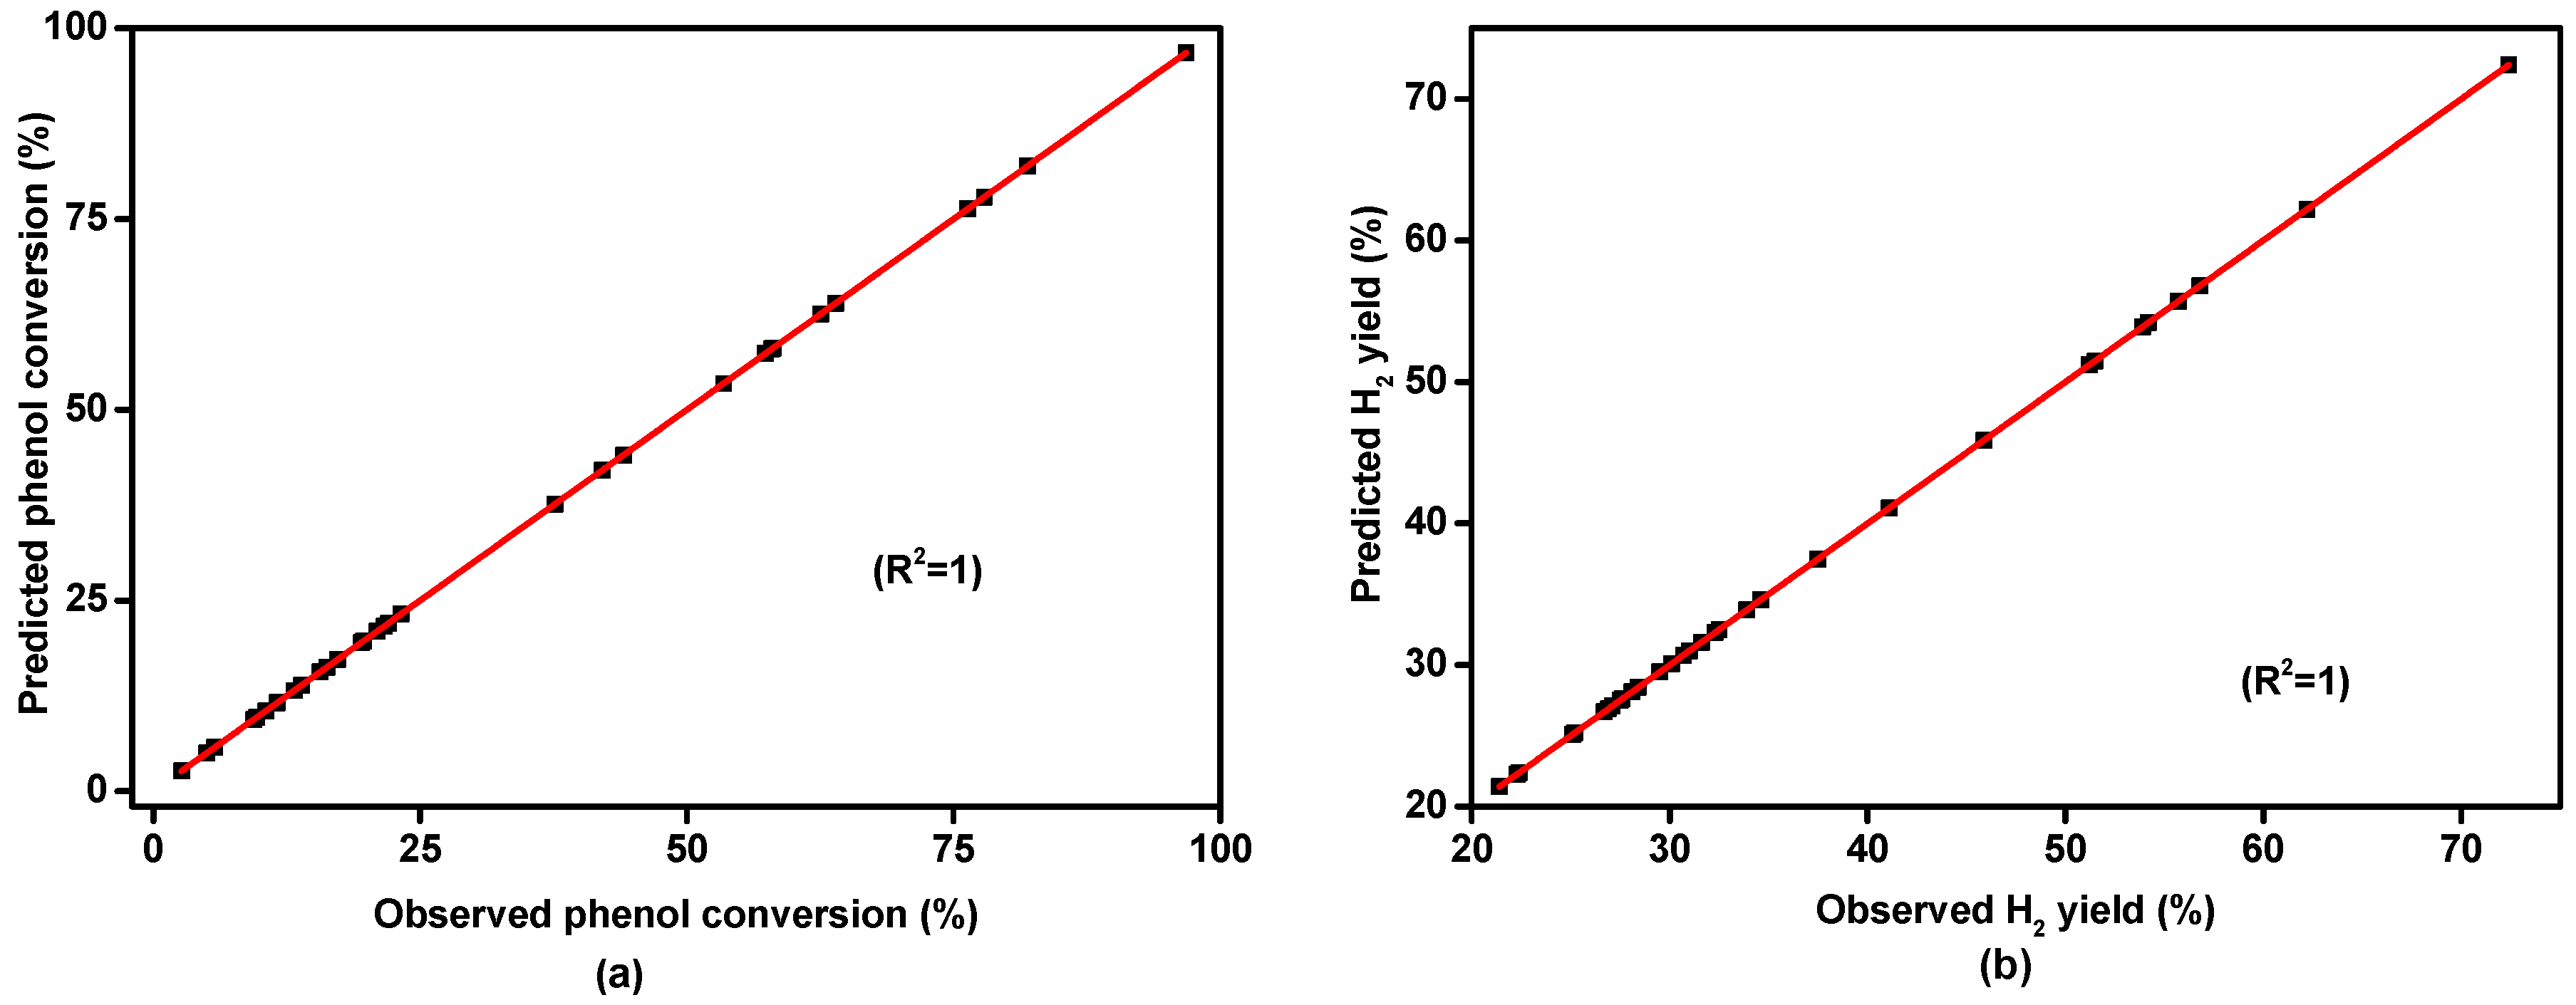
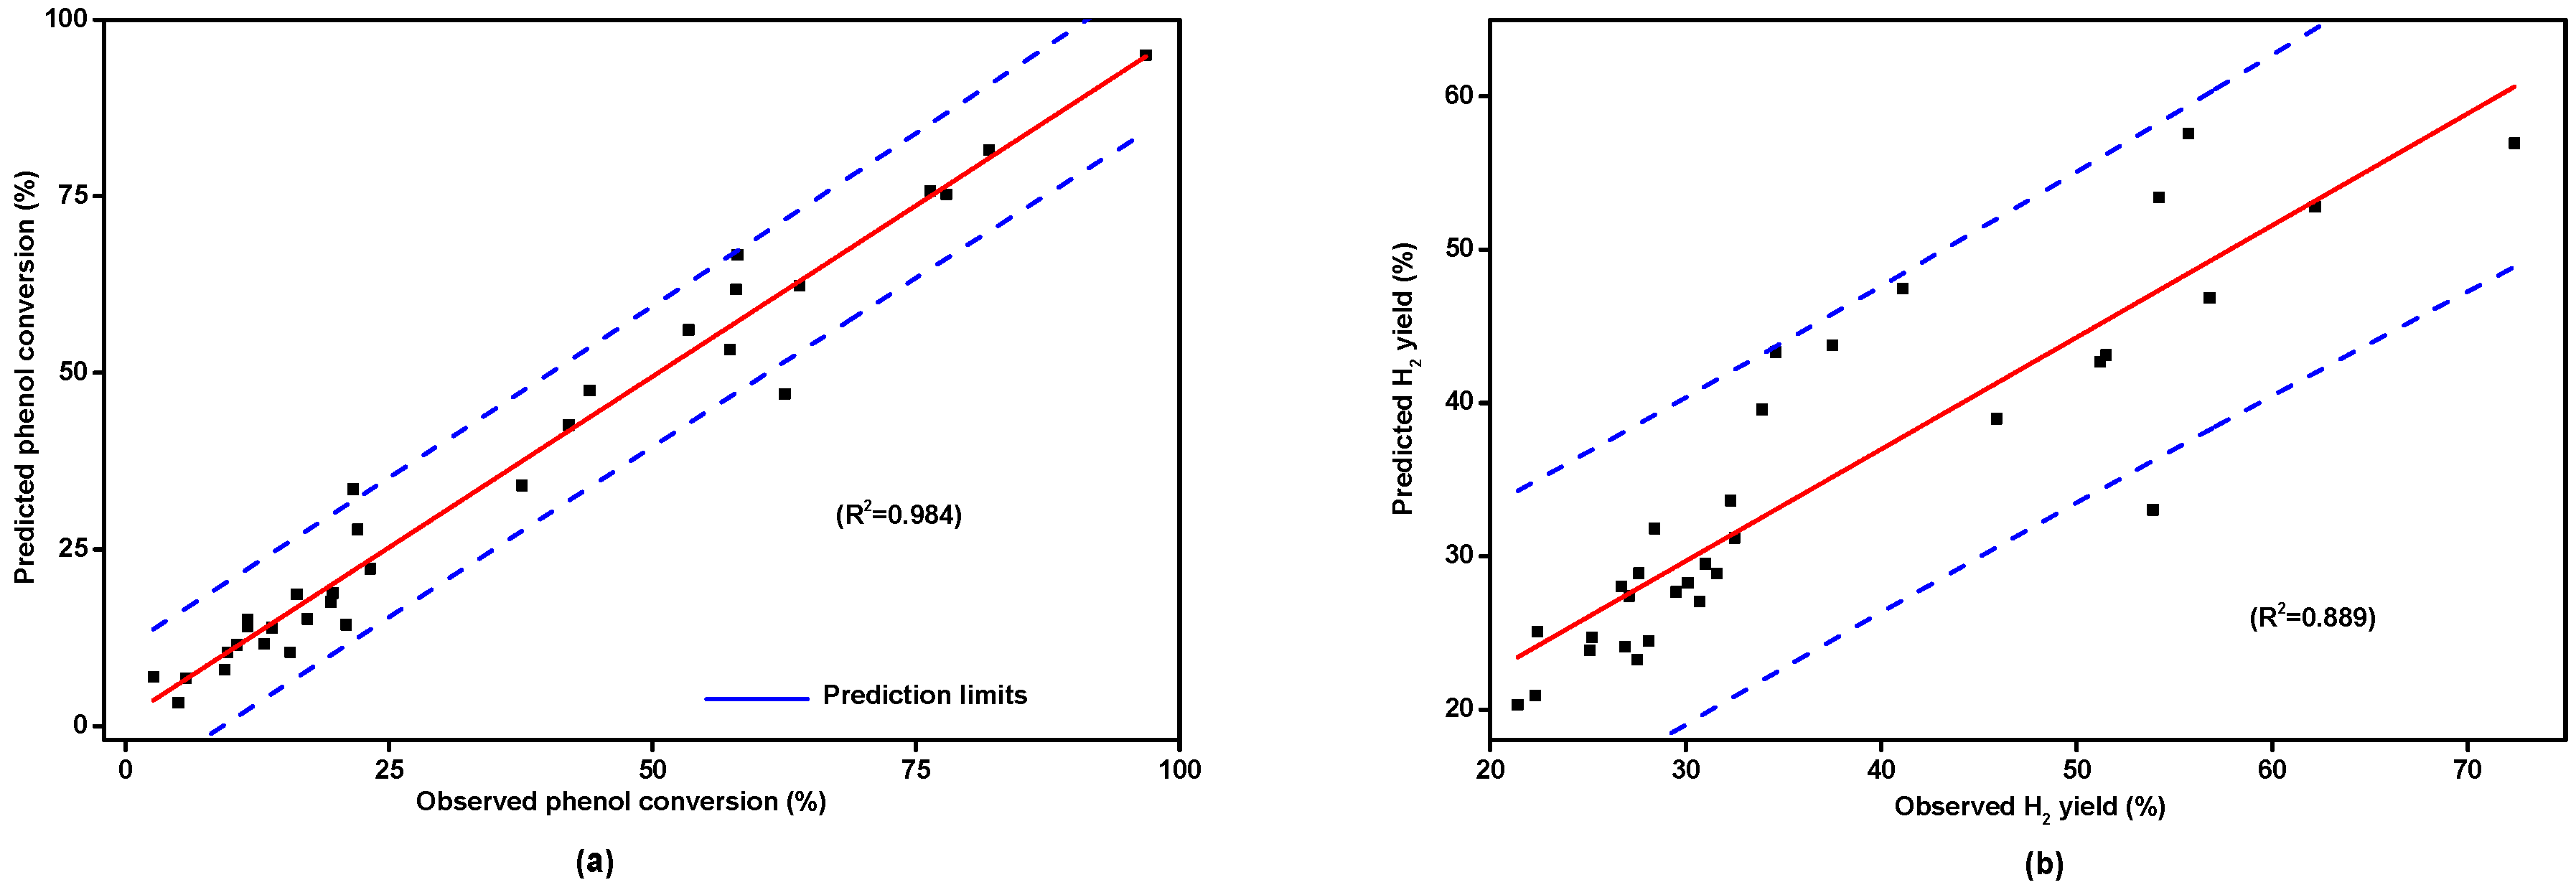
3.3. Reduced Model Equation for Phenol Conversion (Y1) and Hydrogen Yield (Y2)

In the reduced regression model, all of the insignificant terms were removed and only the variables with a p-value of lower than 0.05 were considered. The Pareto chart of the model after reduction at p = 0.05 with 10 degrees of freedom (DF) for Y1 and nine for Y2 is presented in Figure 7. All the values were greater than 2.07 (p = 0.05). Moreover, the model is statistically significant as indicated by a p-value less than 0.05 (95% confidence).
The reduced linear regression model for production of hydrogen from phenol was fitted for Y1 and Y2 through the application of multiple regression analysis on the experimental data and subsequent removal of insignificant terms as shown in Equations (8) and (9). From the analysis of the regression coefficient, the value of the model helps in making inferences about whether there is a need for a complex model for better fit. The significances of the models were determined by the experimental F-value derived from the regression coefficient analysis. On the other hand, the tabulated F-values are calculated based on the degree of freedom for regression and residual at a specific confidence level. If the F test for the model is significant at the 5% level (p < 0.05), then the model is fit and can adequately account for the variation observed.
The ratio of the mean square due to regression to that due to error is depicted by the F value. Generally, a good model should have its calculated F value several times greater than the tabulated. Table 5 and Table 6 depict the reduced model coefficients of the factors and interactions, and the p-values of the effects in the model are shown for Y1 and Y2, respectively. According to the analysis of the regression coefficient of the reduced regression models, the models are highly significant. This was evident from the Fisher (F) test. The ratio of the mean square regression to mean square residual was 121.1 for Y1 and 60.13 for Y2 responses. Also, the probability value was very low (p-value = 0.000).
Y 1 = 1.87 + 0.01 A 3.13 B + 4.99 C + 0.24 D + 1.18 E + 0.01 A E 6.3 B E + 6.23 C E 1.94 D
Y 2 = 15.7 + 0.004 A 3.8 B + 22.16 C + 0.62 D + 1.35 E + 0.004 A E 2.98 B E 1.38 C E
The coefficient of determination (R2) and adjusted R2 are among other criteria that are commonly used to show the best fitness of a model. Table 5 and Table 6 show the calculated R2 and adjusted R2 values for the reduced models developed with respect to phenol conversion (Y1) and the hydrogen yield (Y2) responses, respectively. From these values, it was clear that the regression model was adequate.
The model reduction has little influence on the predicted values of Y1 and Y2, as indicated by the small change of the R2 values from the analysis of the regression coefficient results (Table 5 and Table 6). The validity of the regression model developed was further tested by drawing the parity charts. The parity plot helps in detecting any outliers and provides a prompt indication of the accuracy of the correlation. The observed values and predicted values of the responses are scattered close to the 95% prediction limits with 45°, indicating an almost perfect fit of the developed reduced model. Figure 8 shows the parity plot of the experimental and predicted values for the reduced model. In all the cases, one or two data points out of 32 fall outside the 95% prediction limits (as shown with blue dotted lines).

3.4. Effects of Operating Conditions on Reaction Responses

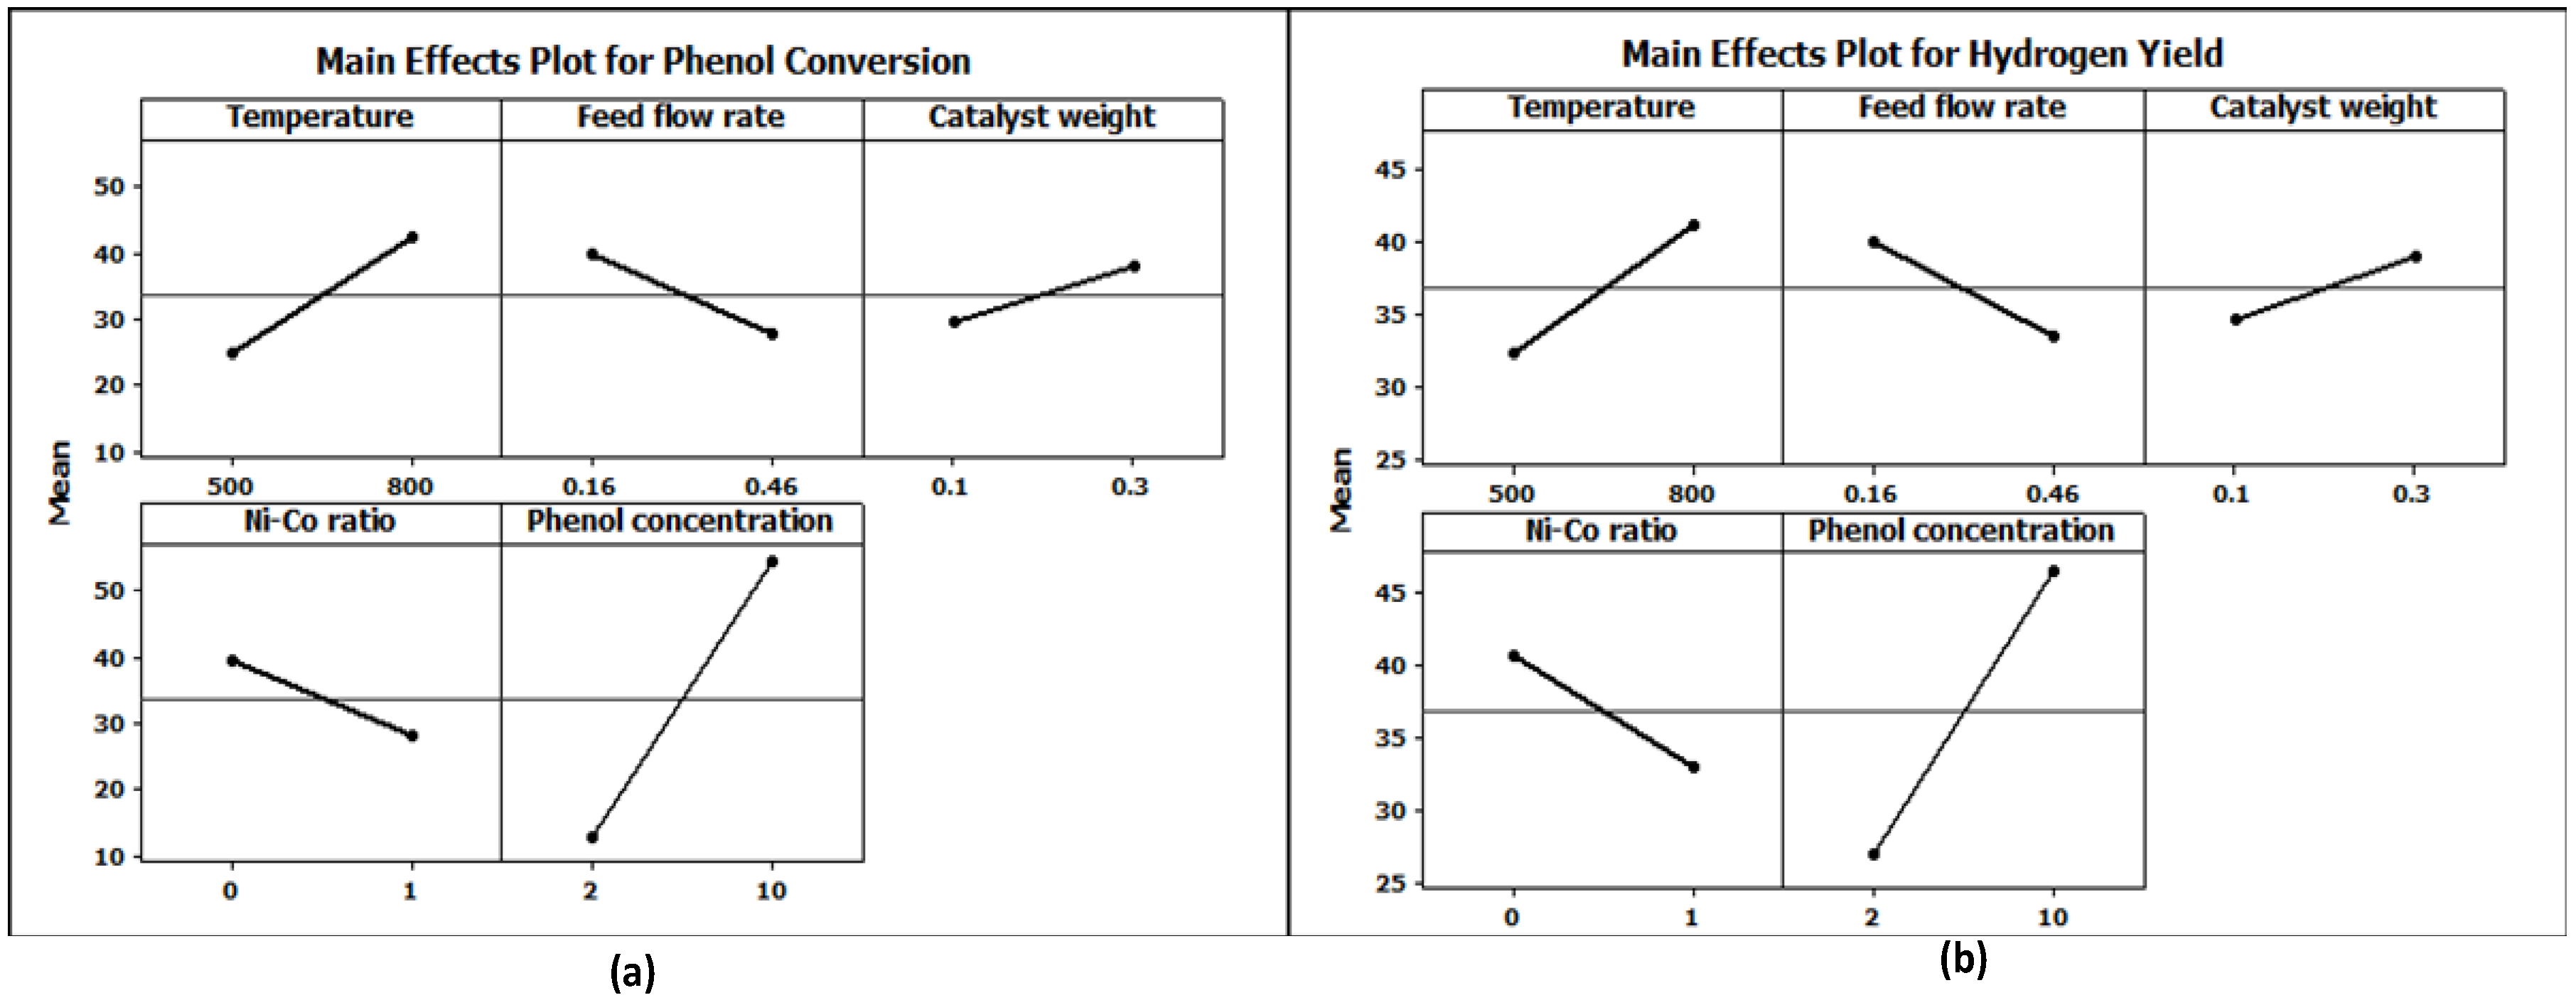
3.4.1. Main Effect Plots for Y1 and Y2

Graphs of the main effects were plotted in order to identify the factor level providing the minimum response value, as shown in Figure 9. Figure 9 presents the mean changes that occurred in both responses (Y1 and Y2) when the levels of the main factors were changed from the lower level, passing through the central point, to a higher level. The reference line represents the overall mean. A main effect is present when the mean response changes across the levels of a factor. This plot shows that the Y1 and Y2 changes depend on the levels of factor E (phenol concentration) with the steepest line. The steeper the slope of the line, the greater the magnitude of the main effect. Therefore, the concentration of phenol should be studied in detail. It can be seen that for the temperature there were great changes in the mean phenol conversion (Y1) and hydrogen yield (Y2), characterized by a great degree of departure from the horizontal (but less than the phenol concentration main effect). Therefore, a higher temperature is desirable to get higher phenol conversion and hydrogen yield. This is because of the favorable hydrocarbon conversion at high temperatures [56]. Feed flow rate and Ni/Co ratio showed slight negative changes in mean Y1 and Y2. Y1 and Y2 decreased from 39.8% and 40.1% to 27.6% and 33.5% with the increase of feed flow rate from 0.16 to 0.46 mL/min, respectively. On the other hand, Y1 and Y2 also decreased from 39.5% and 40.6% to 28.02% and 32.97% with the increase of the Ni to Co ratio from 0 to 1. Nianjun et al. [52] used NixCoy/Al2O3 catalysts to investigate the activity of glycerin liquid reforming. They noticed that an increase in Co content results in maximum H2 and minimum CH4 production. They mentioned that low content of Ni is unfavorable for carbon–carbon breaking. Consequently, the performance of the reforming process was lowered. Hence, it can be concluded that temperature and phenol concentration variables highly influenced Y1 and Y2, whereas feed flow rate, Ni/Co ratio, and catalyst weight had minor effects due to their lines being less sharp against the x-axis. These patterns were previously identified by statistical significance (Pareto charts and analysis of the regression coefficient data).

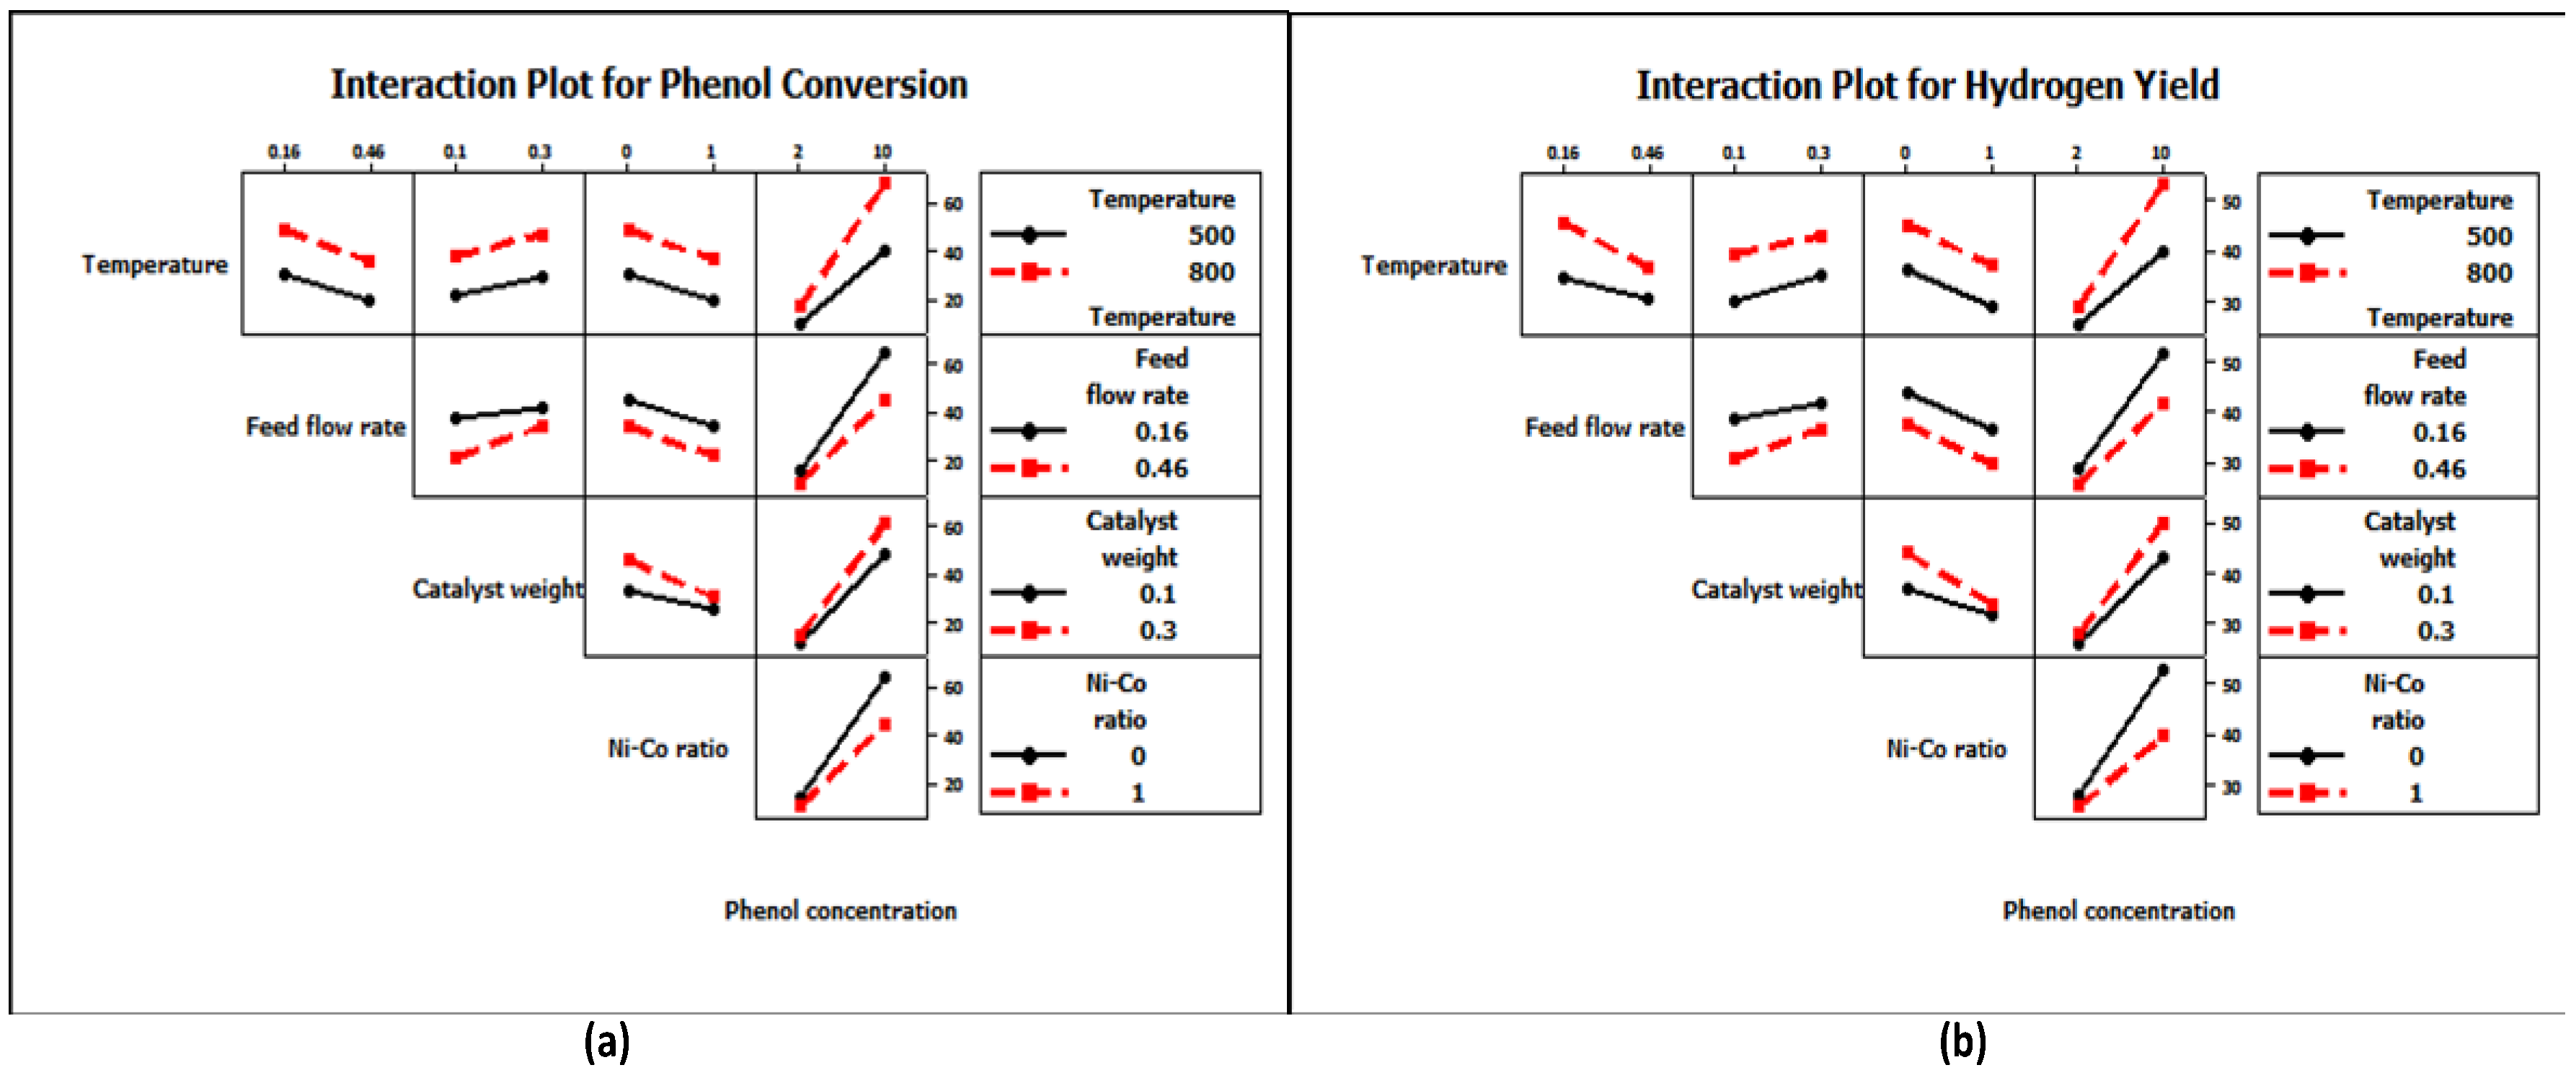
3.4.2. Interaction Plots for Y1 and Y2

To visualize the impact of each factor combination and identify which factors were most influential, interaction plots were constructed. These also consider interactions among variables and can be used to optimize the operating parameters in multivariable systems [57]. The mean response of the two factors is depicted by the plot for all the possible combinations of their settings. When there is interaction between the two factors, the lines appear as non-parallel [58]. Figure 10 presents the full interactions effect plot matrix for five factors, temperature (A), liquid feed rate (B), catalyst weight (C), Ni to Co ratio (D), and phenol concentration (E) at two collocation levels on phenol conversion (Y1) and hydrogen yield (Y2). An interaction exists between variables when the effect of one variable on the response depends on the level of another variable [59]. Also, the presence of interaction results in the combined effect being more or less than that expected when the effects are individually added together [60]. Figure 10 shows that phenol concentration factor (E) is a predominant factor in Y1 and Y2. This means that E interacted strongly with all other factors. There was a strong two-way interaction between the main effects of A and E, B and E, C and E, D and E, and C and E, as evident from the non-parallel nature of the effect lines for the interaction on Y1 and Y2 responses. However, it can be proved by regression coefficient analysis. The graph also shows that there is a possible interaction between C and B factors with respect to Y1 and Y2 due to their un-parallel lines. The rest of the graphs are parallel, suggesting a general lack of interaction or weak interaction between the different variables with respect to their influence on Y1 and Y2.

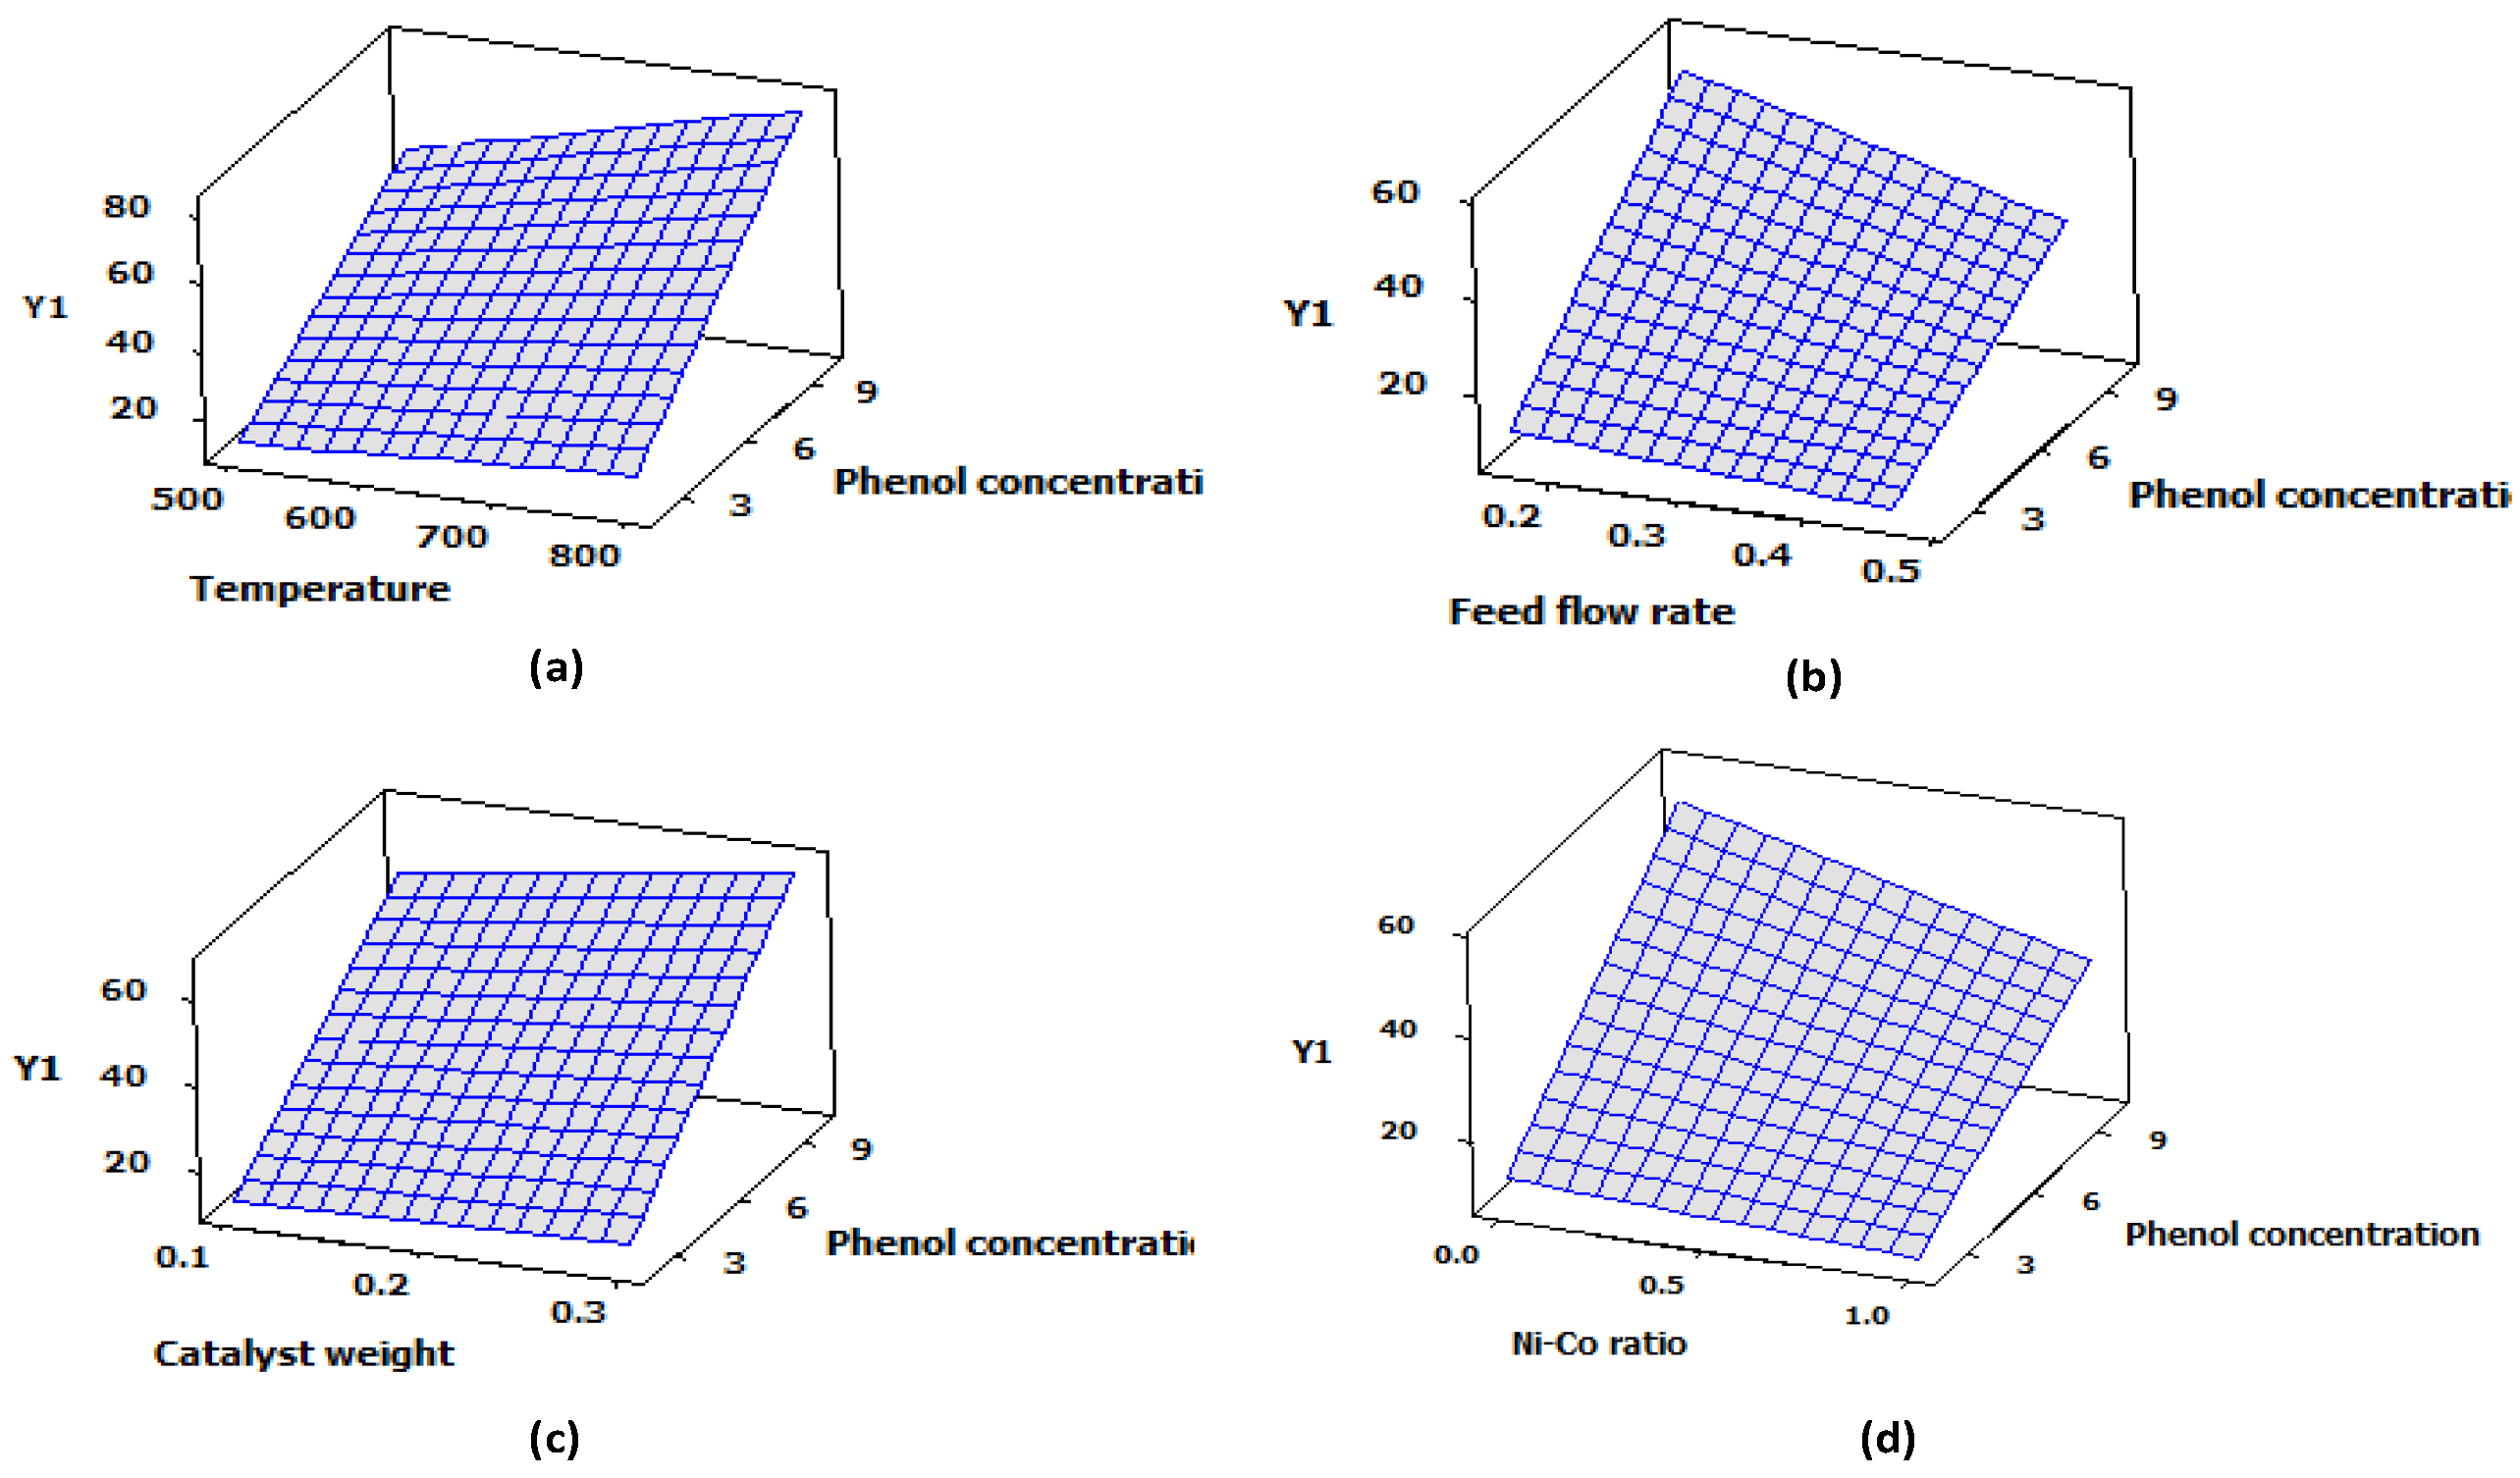
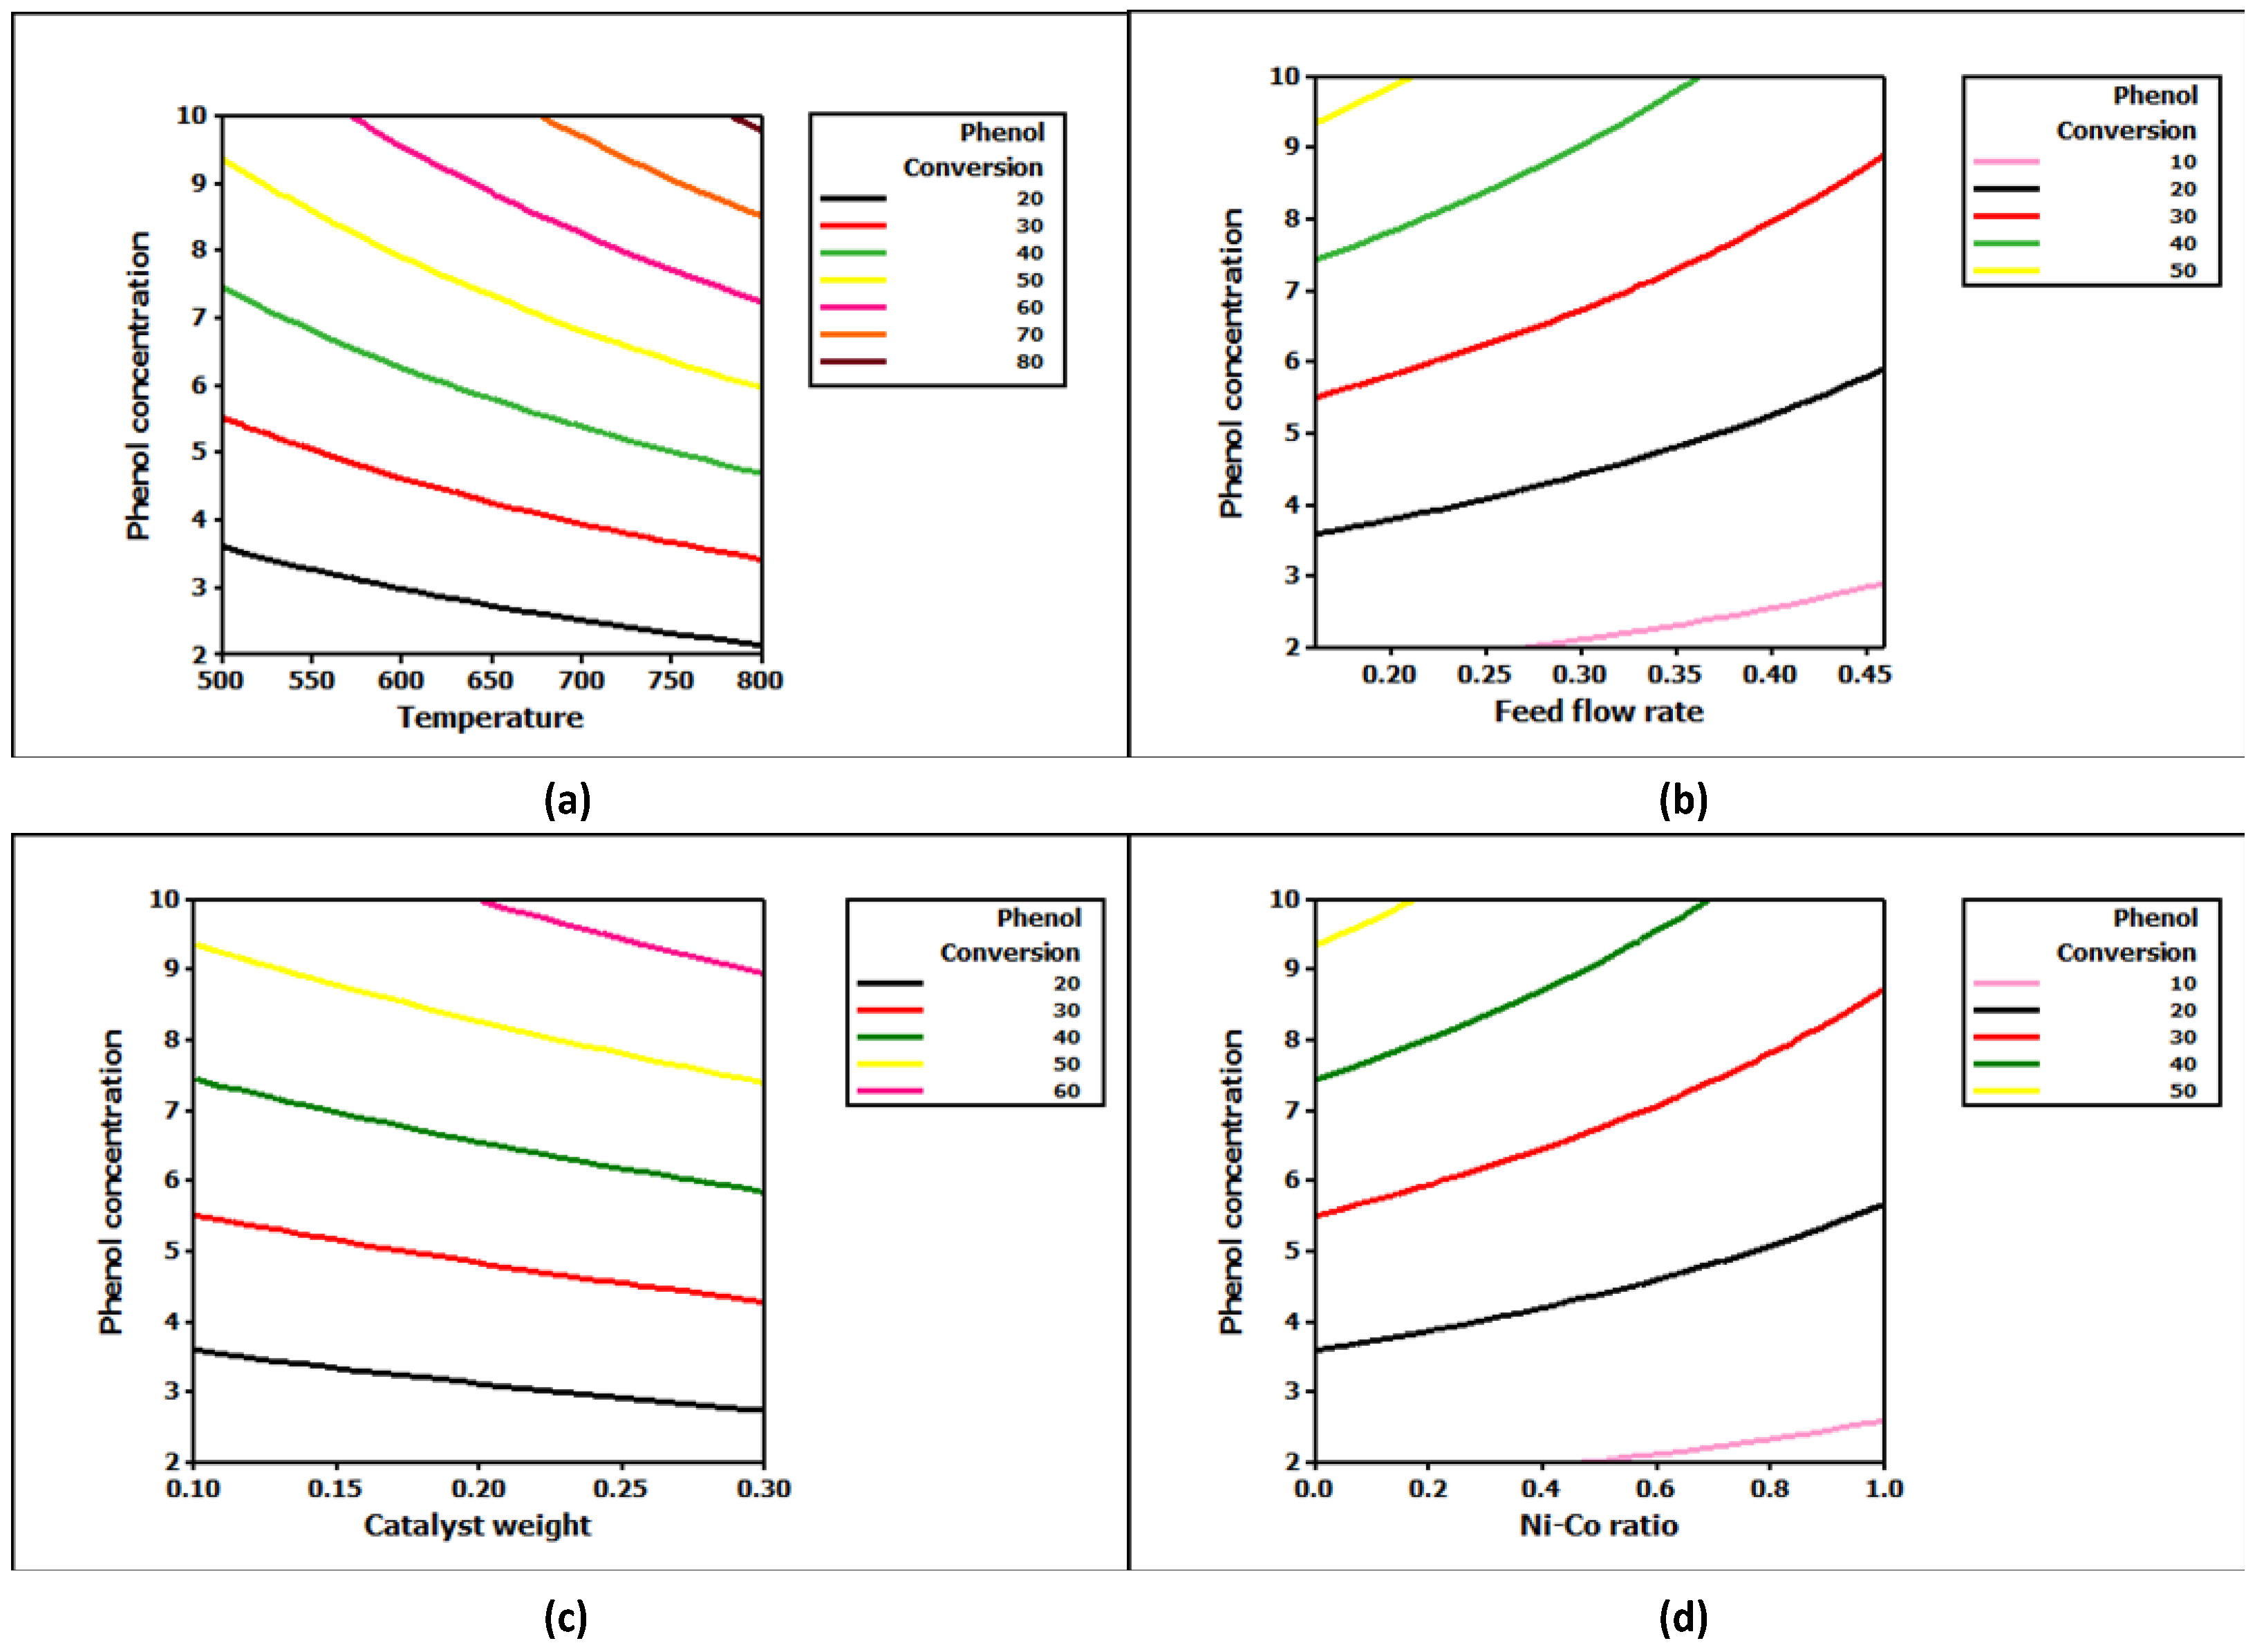
3.4.3. Surface and Contour Plots for Phenol Conversion (Y1) Response

As is seen from the analysis of the regression coefficient results in Table 5, all of the variables (temperature (A), feed flow rate (B), catalyst weight (C), Ni-Co ratio (D), and phenol concentration (E)) and their interactions (AE, BE, CE, and DE) are statistically significant and affect the phenol conversion (Y1) response. The response surface plots are useful in understanding the relationship between the main and interaction effects of the variables [61]. The contour plots are curved lines because the model contains the interactions of the factors (AE, BE, CE, and DE). The surface and contour plots given in Figure 11 and Figure 12 show the relative effects of any two variables when the remaining variables are kept constant. In general, the results of surface and contour plots reveal that the phenol concentration plays an important role in catalyst activity towards phenol conversion. The surface and contour plots for AE in Figure 11a and Figure 12a show the interactive effect of phenol concentration (E) and temperature (A) by keeping B, C, and D constant. The phenol conversion is relatively high for high levels of A and E. In the same way, the surface and contour plot show the interactive effect of B and E through keeping A, C, and D constant. Figure 11b and Figure 12b show the Y1 response of the mutual interactions between the variables. It was found to be high at a low flow rate and high phenol concentration. Furthermore, when the catalyst weight ranged from 0.1 to 0.3 g the effect on the Y1 response was significant (Figure 11c and Figure 12c). On the other hand, Figure 11d and Figure 12d show that the NiCo ratio and phenol concentration (D versus E) have a negative effect on Y1 response. In conclusion, surface and contour plots prove the results of the regression coefficient data and the Pareto charts.

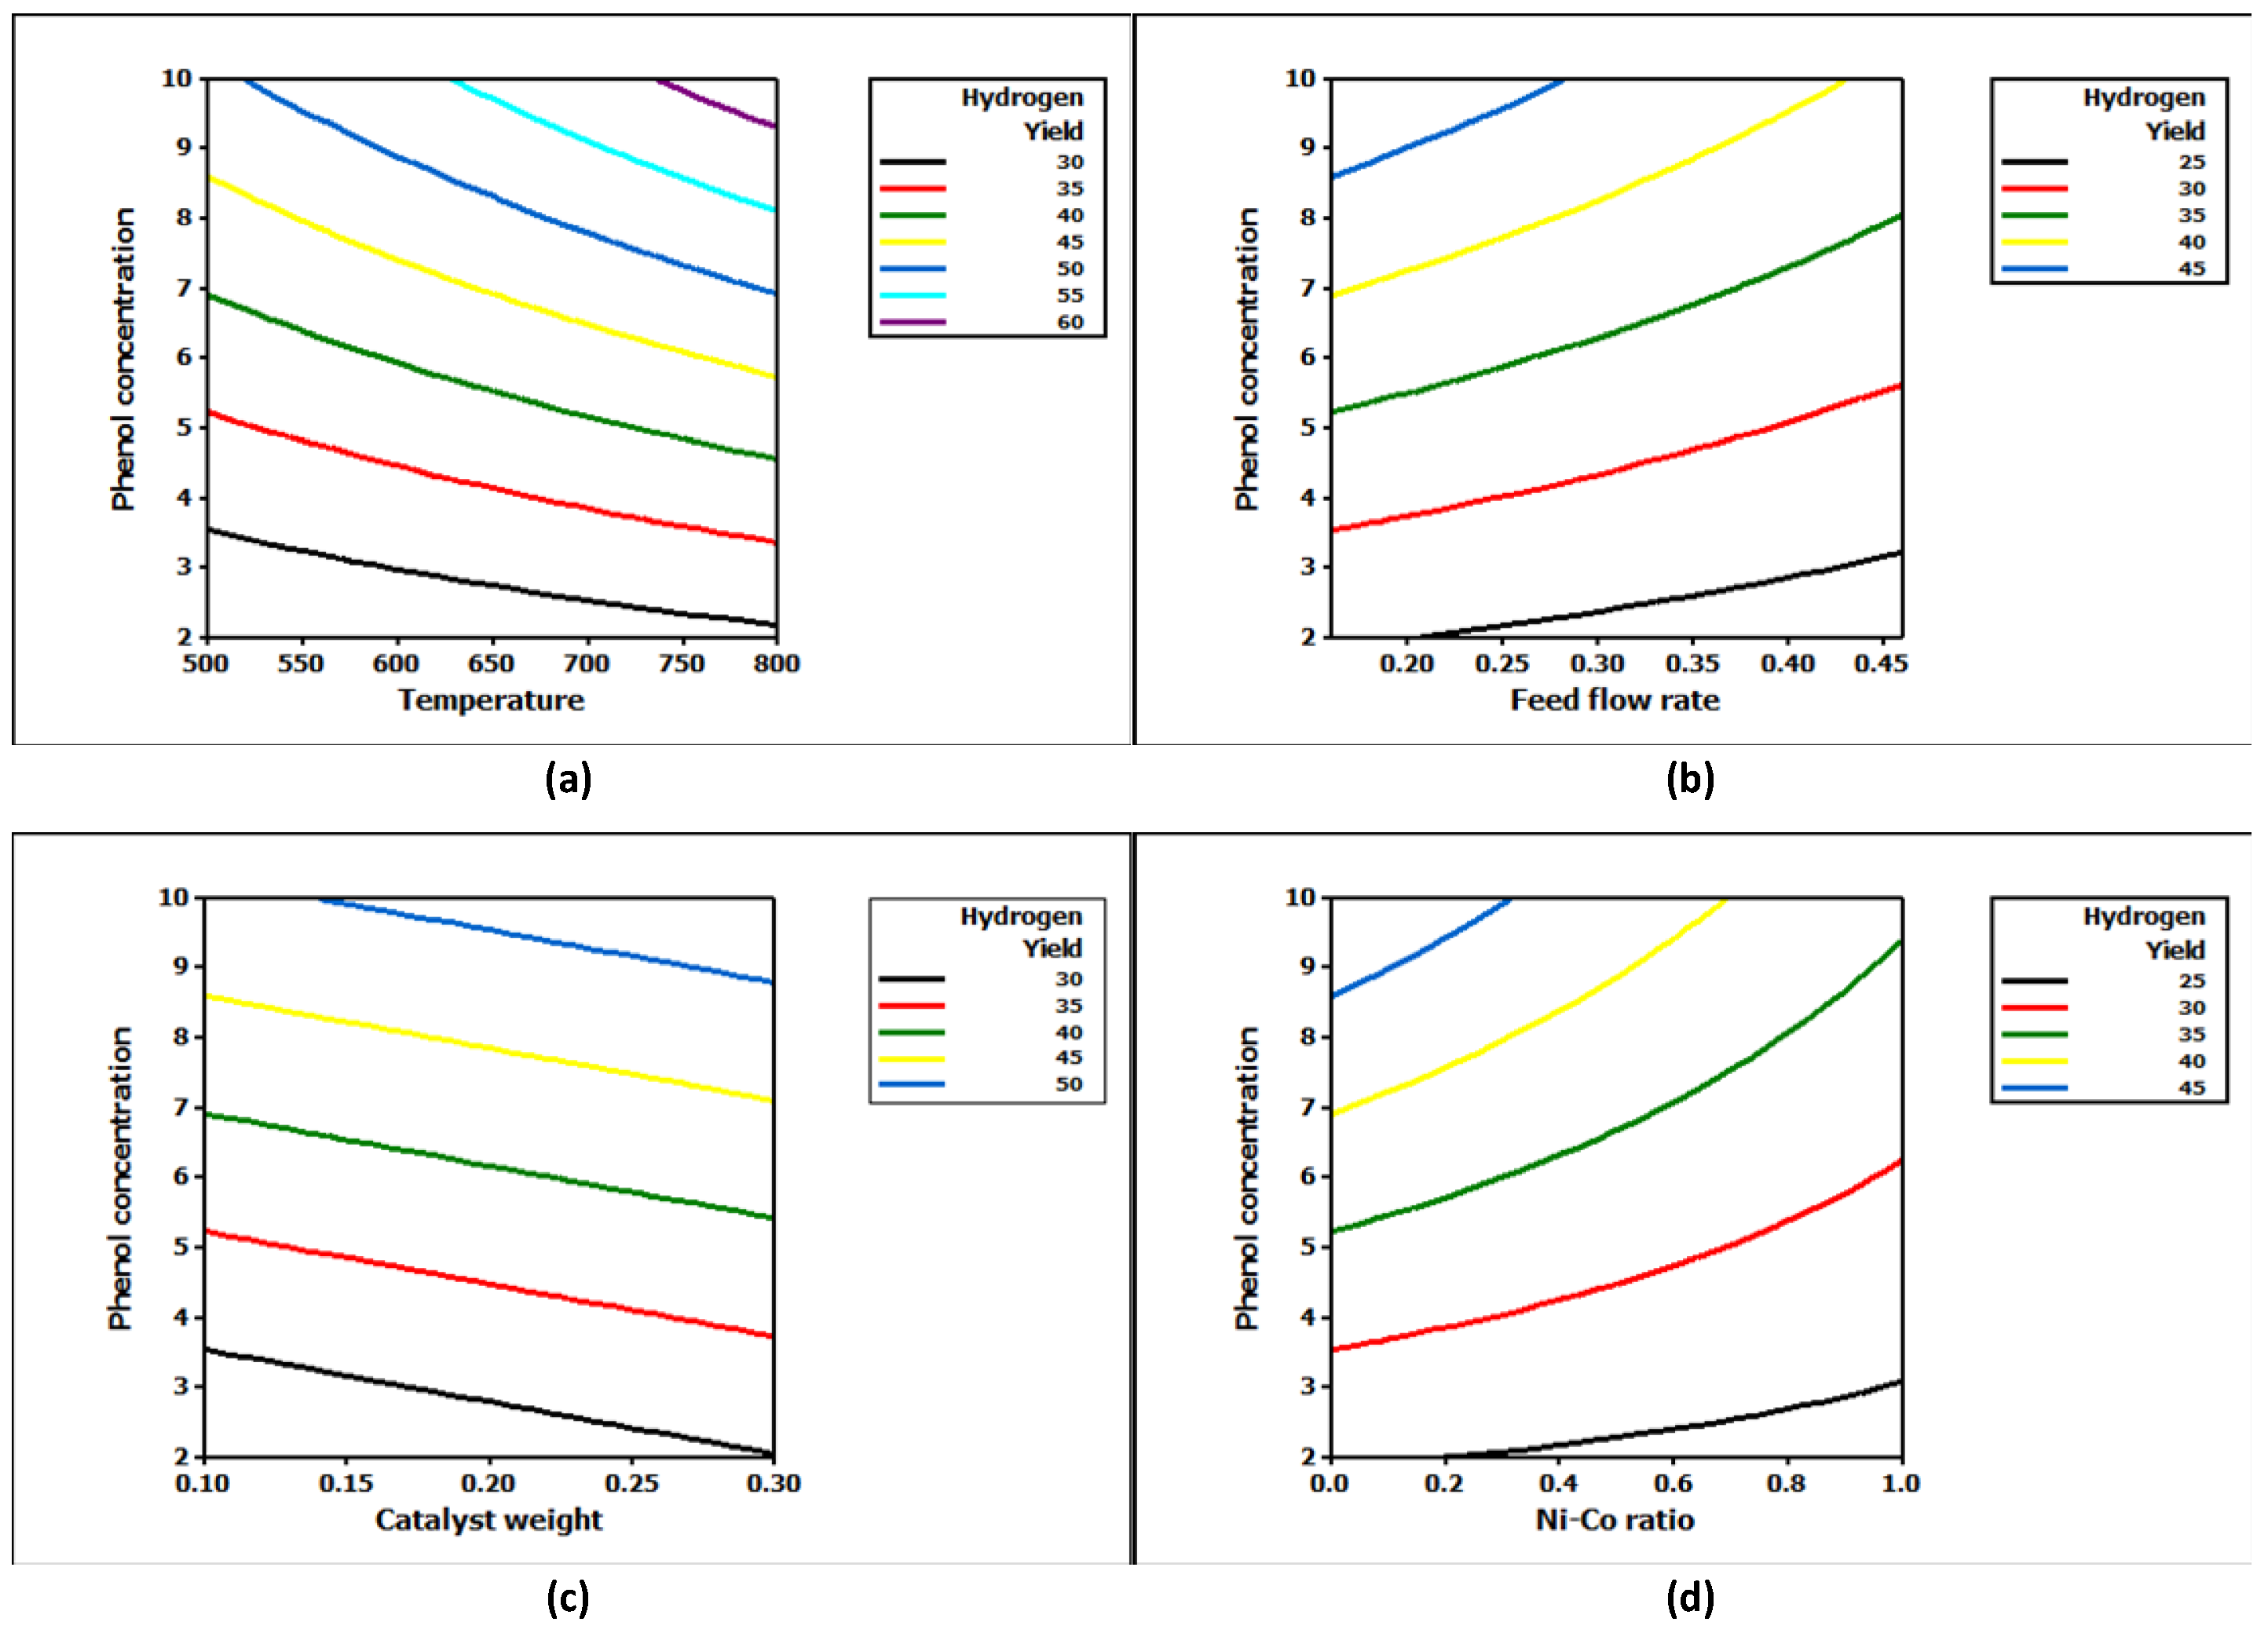
3.4.4. Surface and Contour Plots for Hydrogen Yield (Y2) Response

Figure 13 and Figure 14 give surface and contour plots indicating the effect of interactive effect temperature (A), feed flow rate (B), catalyst weight (C), Ni-Co ratio (D), and phenol concentration (E) upon the hydrogen yield (Y2) response. As in the previous section, the highest Y2 values are observed at the highest phenol concentration. Figure 13 and Figure 14 illustrate that E is more significant with a lower level of B and D, and a higher level of A and C factors. The effect of two-way interaction on Y2 response is almost the same as the Y1 response and proves the analysis of the regression coefficient data in Table 6.

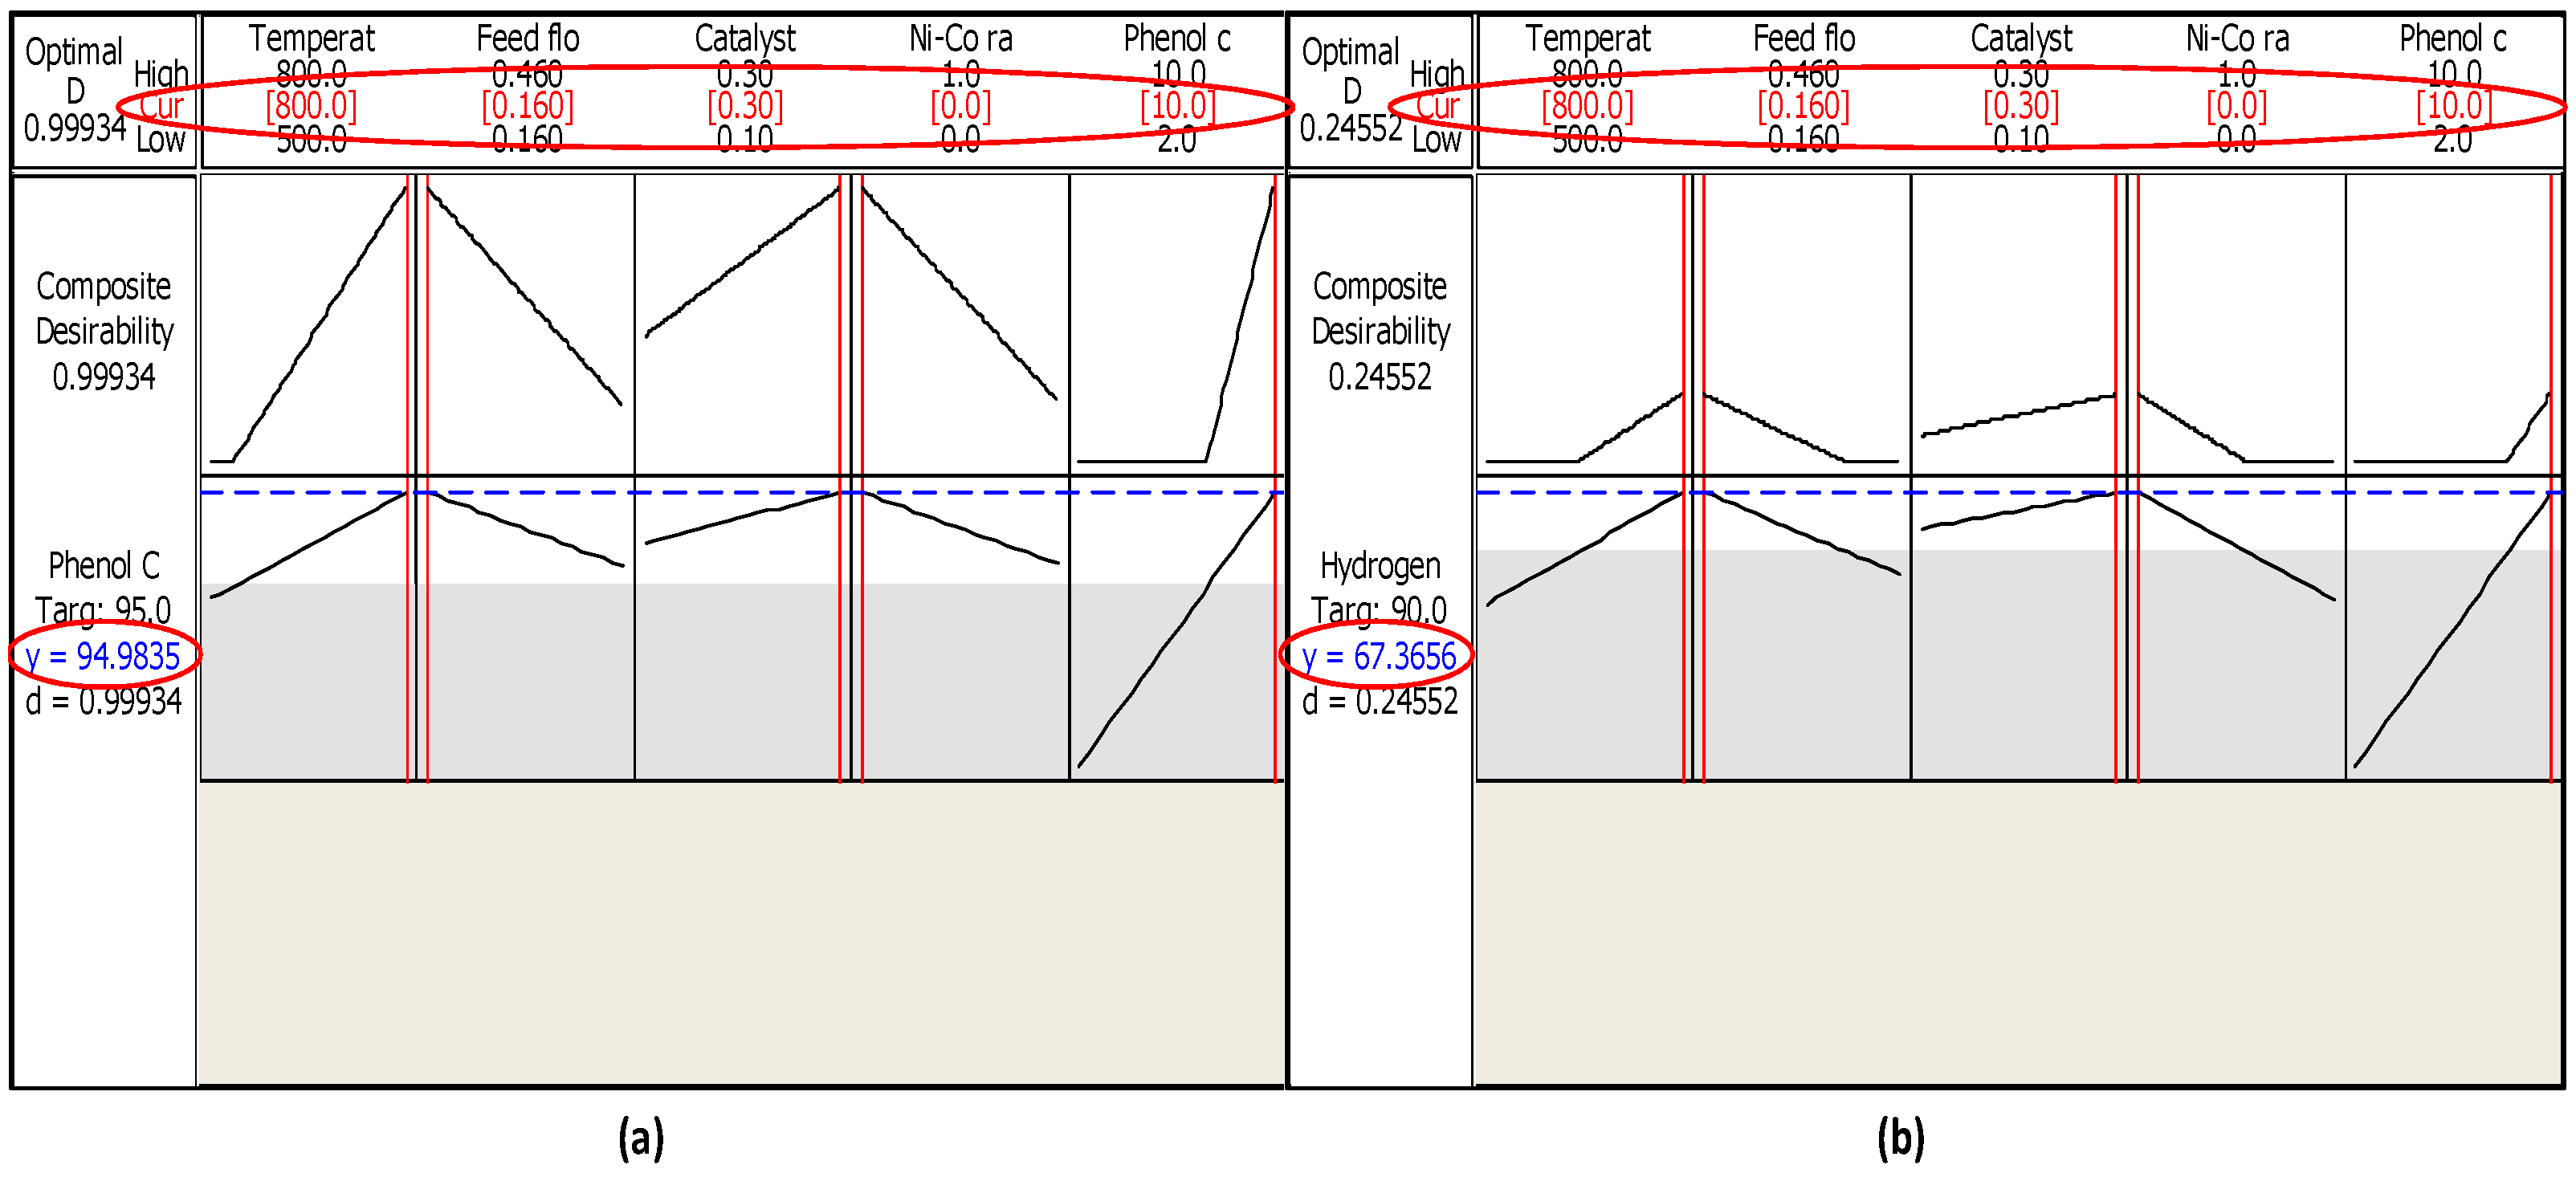
3.4.5. Response Optimization
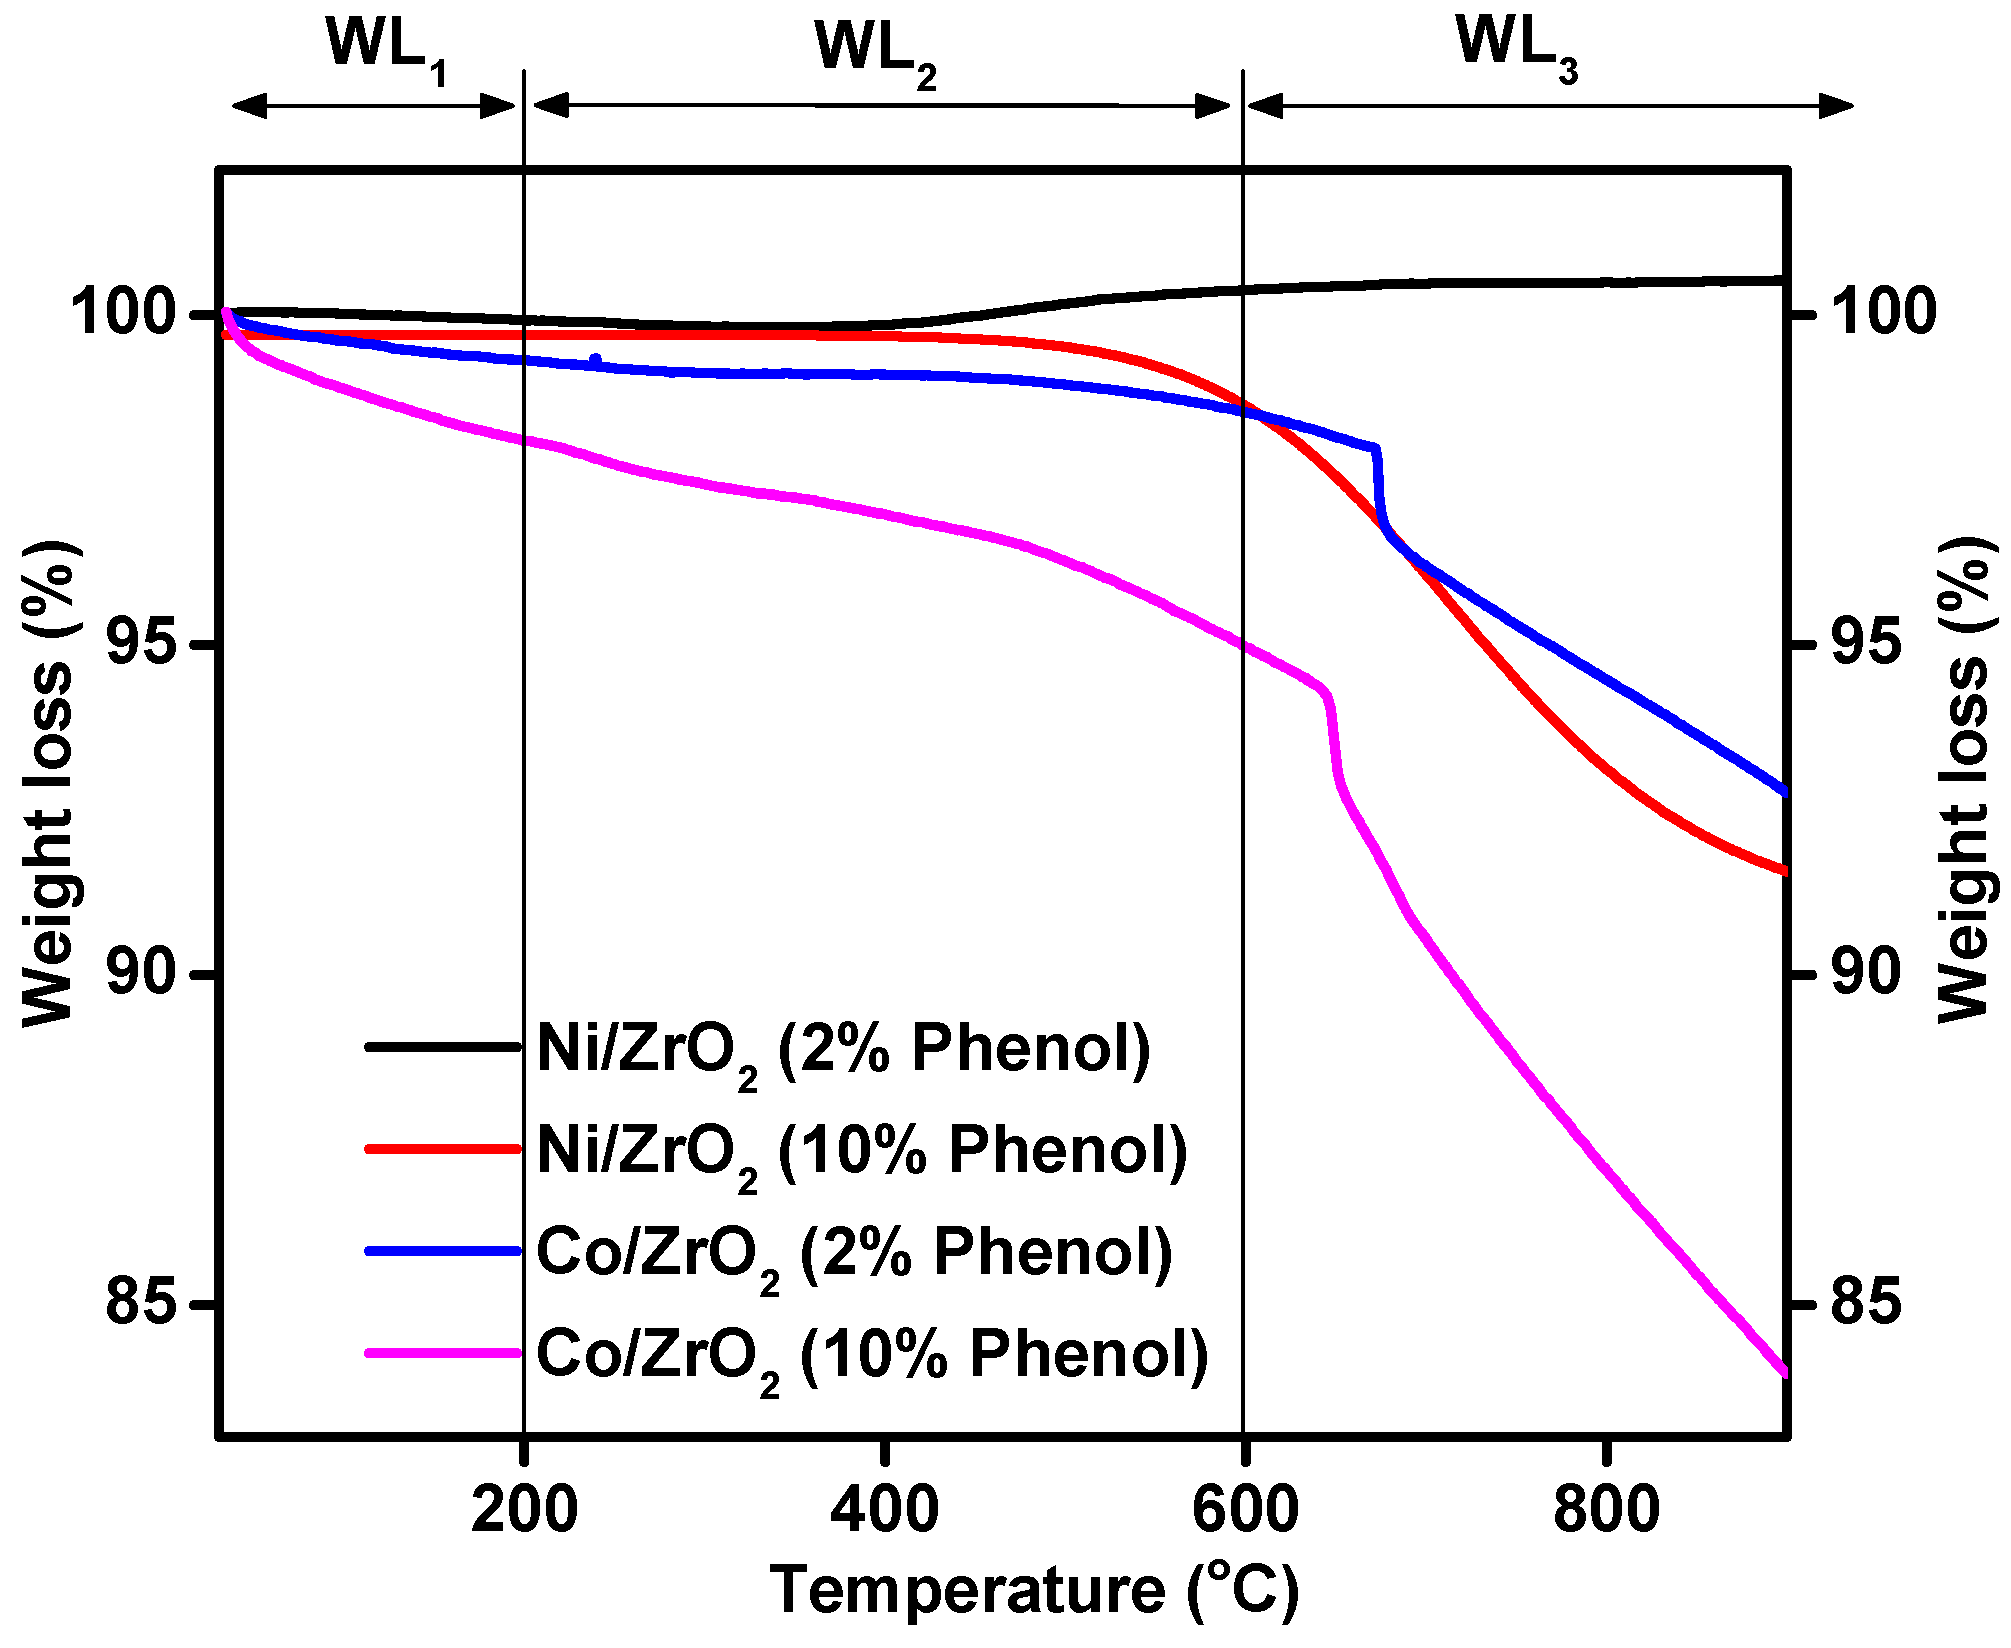
Finally, the Minitab Response Optimizer tool helps to obtain the best possible result for phenol conversion (Y1) and hydrogen yield (Y2). Moreover, it can help solve problems involving several design variables and one or more responses simultaneously. It also has an interactive graphic mode that helps in investigating local behaviors around an optimized solution. By using a response optimizer, the optimal conditions for the suggested reduced model (Equations (8) and (9)) were found to be 800 °C, 0.16 mL/min feed flow rate, 0.3 g catalyst weight, 0 Ni/Co ratio, and 10 wt % of phenol concentration in order to obtain 94.98% of Y1 and 67.4% of Y2 responses (Figure 15a,b, respectively).

3.5. Coke Analysis

The changes occurring during the steam reforming of Ni/ZrO2 and Co/ZrO2 catalysts were studied through thermo-gravimetric analyses (TGA) of the used catalysts for different phenol concentrations. As is shown in Figure 16, they had different amounts corresponding to the weight loss associated with decomposition/oxidation of graphite from the catalyst. The carbon deposit types depend carbon oxidation temperature. The curves of weight loss as a function of temperature can be divided into three parts: below 200 °C (WL1), 200–600 °C (WL2), and above 600 °C (WL3). In the literature, the region below 200 °C has been attributed to water and moisture evaporation. The weight loss between 200 °C and 600 °C has been ascribed to less stable deposits [62], whereas the weight loss above 600 °C is generally attributed to oxidation of coke deposits with a more stable [62] and/or different degree of graphitization [63]. In general, Ni/ZrO2 has less coke deposited on its surface than Co/ZrO2. The TGA result shows that the Ni/ZrO2 catalyst for 2% phenol concentration in the feed did not suffer from any coke formation on its surface in all WL1, WL2, and WL3 regions. This catalyst profile exhibited additional weight gained; this might be due to the oxidation of the metallic active sites [64,65]. A significant mass loss was found for both Ni/ZrO2 and Co/ZrO2 catalysts when the phenol concentration increased from 2% to 10% and the temperature rose above 600 °C due to the increase in carbon molecules in the feed. Therefore, a higher phenol concentration leads to higher catalyst activity in terms of phenol conversion and hydrogen production but causes the carbon deposition to increase.

4. Conclusions

In this study, hydrogen production from catalytic steam reforming of phenol was performed over Ni/ZrO2 (Ni-Co ratio = 1) and Co/ZrO2 (Ni-Co ratio = 0) catalysts. In order to investigate the promising catalyst activity towards phenol conversion (Y1) and hydrogen yield (Y2), as well as reduce the total number of experiments, a statistical design of experiment (DOE) using the 25 full factorial method (five variables, each variable at two levels) was performed. The five variables were temperature (A), liquid feed flow rate (B), catalyst weight (C), Ni to Co ratio (D), and phenol concentration (E). Thirty-two sets of experiments were performed to explore the effects of the reaction variables and their interaction on the phenol conversion and the hydrogen yield. The catalyst performance testing shows that 800 °C, 0.16 mL/min feed flow rate, 0.3 g of catalyst, 0 ratio of Ni-Co (Co/ZrO2), and 10 wt % of phenol in the feed gave a phenol conversion of 96.8% and a hydrogen yield of 72.4%. The statistical DOE indicated that within the limits that were being examined, all the variables had a significance level of 5% (p < 0.05). In addition, the interaction among A versus E, B versus E, C versus E, and D versus E were found to have a significant effect on Y1 and Y2 responses. This was proven by Pareto charts and Normal plots. The analysis of the regression coefficient results for the reduced regression model indicates that the model can fit the experimental data for both Y1 and Y2 responses with correlation coefficients (R2) of 0.968 and 0.936, respectively. The parity charts of predicted versus observed responses also confirm the fit of the experimental data with the regression model. The p-value of the reduced model was zero and that model is considered to be statistically significant. The surface and contour plots show that the E variable is more significant with higher levels of A and C and lower levels of B and D. The response optimizer tool indicated that the optimum conditions for the reduced model were 800 °C, 0.16 mL/min, 0.3 g catalyst, 0 Ni-Co ratio, and 10 wt % of phenol concentration to obtain 94.98% of Y1 and 67.4% of Y2, respectively.

Acknowledgments

The authors acknowledge the financial support given for this work by Universiti Teknologi Malaysia (UTM) under the Research University Grant (10H19 and 13H36), and The Malaysian Ministry of Higher Education under FRGS 4F478 and 4F403.

Author Contributions

W.N. drafting the whole work, T.A.T.A. is the main supervisor who supervise the whole study (including design of the work, analysis, and interpretation of data), R.M. is the Co-supervisor who help to supervise the whole study (including design of the work, analysis, and interpretation of data), B.N. contributed on optimization part, Y.G. contributed on analysis and interpretation of data, A.J. contributed on XRD and TPR characterization.

Conflicts of Interest

The authors declare no conflict of interest.

References

  1. Ebshish, A.; Yaakob, Z.; Taufiq-Yap, Y.H.; Bshish, A. Investigation of the process conditions for hydrogen production by steam reforming of glycerol over Ni/Al2O3 catalyst using response surface methodology (RSM). Materials 2014, 7, 2257–2272. [Google Scholar] [CrossRef]
  2. Bu, Q.; Lei, H.; Ren, S.; Wang, L.; Holladay, J.; Zhang, Q.; Tang, J.; Ruan, R. Phenol and phenolics from lignocellulosic biomass by catalytic microwave pyrolysis. Bioresour. Technol. 2011, 102, 7004–7007. [Google Scholar] [CrossRef] [PubMed]
  3. Polychronopoulou, K.; Bakandritsos, A.; Tzitzios, V.; Fierro, J.L.G.; Efstathiou, A.M. Absorption-enhanced reforming of phenol by steam over supported Fe catalysts. J. Catal. 2006, 241, 132–148. [Google Scholar] [CrossRef]
  4. Garbarino, G.; Sanchez Escribano, V.; Finocchio, E.; Busca, G. Steam reforming of phenol-ethanol mixture over 5% Ni/Al2O3. Appl. Catal. B Environ. 2012, 113–114, 281–289. [Google Scholar] [CrossRef]
  5. Garbarino, G.; Wang, C.; Valsamakis, I.; Chitsazan, S.; Riani, P.; Finocchio, E.; Flytzani-Stephanopoulos, M.; Busca, G. A study of Ni/Al2O3 and Ni–La/Al2O3 catalysts for the steam reforming of ethanol and phenol. Appl. Catal. B Environ. 2015, 174–175, 21–34. [Google Scholar] [CrossRef]
  6. Nabgan, W.; Tuan Abdullah, T.A.; Mat, R.; Nabgan, B.; Gambo, Y.; Moghadamian, K. Acetic acid-phenol steam reforming for hydrogen production: Effect of different composition of La2O3-Al2O3 support for bimetallic Ni-Co catalyst. J. Environ. Chem. Eng. 2016, 4, 2765–2773. [Google Scholar] [CrossRef]
  7. Shukla, S.; Seal, S. Thermodynamic Tetragonal Phase Stability in Sol-Gel Derived Nanodomains of Pure Zirconia. J. Phys. Chem. B 2004, 108, 3395–3399. [Google Scholar] [CrossRef]
  8. Llorca, J.; Homs, N.; Sales, J.; de la Piscina, P.R. Efficient Production of Hydrogen over Supported Cobalt Catalysts from Ethanol Steam Reforming. J. Catal. 2002, 209, 306–317. [Google Scholar] [CrossRef]
  9. Batista, M.S.; Santos, R.K.S.; Assaf, E.M.; Assaf, J.M.; Ticianelli, E.A. High efficiency steam reforming of ethanol by cobalt-based catalysts. J. Power Source 2004, 134, 27–32. [Google Scholar] [CrossRef]
  10. Moura, J.S.; Souza, M.O.G.; Bellido, J.D.A.; Assaf, E.M.; Opportus, M.; Reyes, P.; do Carmo Rangel, M. Ethanol steam reforming over rhodium and cobalt-based catalysts: Effect of the support. Int. J. Hydrogen Energy 2012, 37, 3213–3224. [Google Scholar] [CrossRef] [Green Version]
  11. Papadopoulou, E.; Delimaris, D.; Denis, A.; Machocki, A.; Ioannides, T. Alcohol reforming on cobalt-based catalysts prepared from organic salt precursors. Int. J. Hydrogen Energy 2012, 37, 16375–16381. [Google Scholar] [CrossRef]
  12. Polychronopoulou, K.; Fierro, J.L.G.; Efstathiou, A.M. The phenol steam reforming reaction over MgO-based supported Rh catalysts. J. Catal. 2004, 228, 417–432. [Google Scholar] [CrossRef]
  13. Rioche, C.; Kulkarni, S.; Meunier, F.C.; Breen, J.P.; Burch, R. Steam reforming of model compounds and fast pyrolysis bio-oil on supported noble metal catalysts. Appl. Catal. B Environ. 2005, 61, 130–139. [Google Scholar] [CrossRef]
  14. Goodwin, A.K.; Rorrer, G.L. Conversion of Xylose and Xylose-Phenol Mixtures to Hydrogen-Rich Gas by Supercritical Water in an Isothermal Microtube Flow Reactor. Energy Fuels 2009, 23, 3818–3825. [Google Scholar] [CrossRef]
  15. Wang, S.; Zhang, F.; Cai, Q.; Li, X.; Zhu, L.; Wang, Q.; Luo, Z. Catalytic steam reforming of bio-oil model compounds for hydrogen production over coal ash supported Ni catalyst. Int. J. Hydrogen Energy 2014, 39, 2018–2025. [Google Scholar] [CrossRef]
  16. Pinheiro, A.N.; Valentini, A.; Sasaki, J.M.; Oliveira, A.C. Structural characterization of highly stable Pt−Ni supported zeolites and its catalytic performance for methane reforming with CO2. In Studies in Surface Science and Catalysis; Antoine Gédéon, P.M., Florence, B., Eds.; Elsevier: Paris, France, 2008; Part A; Volume 174, pp. 205–208. [Google Scholar]
  17. Zhou, L.; Guo, Y.; Zhang, Q.; Yagi, M.; Hatakeyama, J.; Li, H.; Chen, J.; Sakurai, M.; Kameyama, H. A novel catalyst with plate-type anodic alumina supports, Ni/NiAl2O4/γ-Al2O3/alloy, for steam reforming of methane. Appl. Catal. A Gen. 2008, 347, 200–207. [Google Scholar] [CrossRef]
  18. Kwak, B.S.; Kim, J.; Kang, M. Hydrogen production from ethanol steam reforming over core–shell structured NixOy–, FexOy–, and CoxOy–Pd catalysts. Int. J. Hydrogen Energy 2010, 35, 11829–11843. [Google Scholar] [CrossRef]
  19. Peppley, B.A.; Amphlett, J.C.; Kearns, L.M.; Mann, R.F. Methanol–steam reforming on Cu/ZnO/Al2O3 catalysts. Part 2. A comprehensive kinetic model. Appl. Catal. A Gen. 1999, 179, 31–49. [Google Scholar] [CrossRef]
  20. Chen, J.; Sun, L.; Wang, R.; Zhang, J. Hydrodechlorination of Chlorobenzene Over Ni2P/SiO2 Catalysts: Influence of Ni2P Loading. Catal. Lett. 2009, 133, 346–353. [Google Scholar] [CrossRef]
  21. Wu, C.; Wu, F.; Bai, Y.; Yi, B.; Zhang, H. Cobalt boride catalysts for hydrogen generation from alkaline NaBH4 solution. Mater. Lett. 2005, 59, 1748–1751. [Google Scholar] [CrossRef]
  22. Mas, V.; Dieuzeide, M.L.; Jobbágy, M.; Baronetti, G.; Amadeo, N.; Laborde, M. Ni(II)-Al(III) layered double hydroxide as catalyst precursor for ethanol steam reforming: Activation treatments and kinetic studies. Catal. Today 2008, 133–135, 319–323. [Google Scholar] [CrossRef]
  23. Jiang, C.J.; Trimm, D.L.; Wainwright, M.S.; Cant, N.W. Kinetic study of steam reforming of methanol over copper-based catalysts. Appl. Catal. A Gen. 1993, 93, 245–255. [Google Scholar] [CrossRef]
  24. Siahvashi, A.; Chesterfield, D.; Adesina, A.A. Nonoxidative and Oxidative Propane Dehydrogenation over Bimetallic Mo–Ni/Al2O3 Catalyst. Ind. Eng. Chem. Res. 2013, 52, 4017–4026. [Google Scholar] [CrossRef]
  25. Seong, M.; Shin, M.; Cho, J.-H.; Lee, Y.-C.; Park, Y.-K.; Jeon, J.-K. Reactor sizing for butane steam reforming over Ni and Ru catalysts. Korean J. Chem. Eng. 2014, 31, 412–418. [Google Scholar] [CrossRef]
  26. Mastalir, A.; Frank, B.; Szizybalski, A.; Soerijanto, H.; Deshpande, A.; Niederberger, M.; Schomäcker, R.; Schlögl, R.; Ressler, T. Steam reforming of methanol over Cu/ZrO2/CeO2 catalysts: A kinetic study. J. Catal. 2005, 230, 464–475. [Google Scholar] [CrossRef]
  27. Jia, A.-P.; Hu, G.-S.; Meng, L.; Xie, Y.-L.; Lu, J.-Q.; Luo, M.-F. CO oxidation over CuO/Ce1−xCuxO2−δ and Ce1−xCuxO2−δ catalysts: Synergetic effects and kinetic study. J. Catal. 2012, 289, 199–209. [Google Scholar] [CrossRef]
  28. Goltsov, V.A.; Veziroglu, T.N.; Goltsova, L.F. Hydrogen civilization of the future—A new conception of the IAHE. Int. J. Hydrogen Energy 2006, 31, 153–159. [Google Scholar] [CrossRef]
  29. Cai, W.; de la Piscina, P.R.; Homs, N. Oxidative steam reforming of bio-butanol for hydrogen production: effects of noble metals on bimetallic CoM/ZnO catalysts (M = Ru, Rh, Ir, Pd). Appl. Catal. B Environ. 2014, 145, 56–62. [Google Scholar] [CrossRef]
  30. Radlein, D.; Piskorz, J.; Scott, D.S. Proceedings of the 9th International Conference on Fundamentals Aspects, Analytical Techniques, Processes and Applications of PyrolysisFast pyrolysis of natural polysaccharides as a potential industrial process. J. Anal. Appl. Pyrolysis 1991, 19, 41–63. [Google Scholar] [CrossRef]
  31. Mguni, L.L. Biodiesel Production over Supported Nano-Magnesium Oxide Particles. Ph.D. Thesis, University of Johannesburg, Johannesburg, South Africa, April 2012. [Google Scholar]
  32. Fatsikostas, A.N.; Kondarides, D.I.; Verykios, X.E. Production of hydrogen for fuel cells by reformation of biomass-derived ethanol. Catal. Today 2002, 75, 145–155. [Google Scholar] [CrossRef]
  33. Martens, J.H.A.; Van ’t Blik, H.F.J.; Prins, R. Characterization of supported cobalt and cobalt-rhodium catalysts: II. Temperature-Programmed Reduction (TPR) and Oxidation (TPO) of CoTiO2 and Co-RhTiO2. J. Catal. 1986, 97, 200–209. [Google Scholar] [CrossRef]
  34. Abdullah, T.A.T.; Nabgan, W.; Kamaruddin, M.J.; Mat, R.; Johari, A.; Ahmad, A. Hydrogen production from acetic acid steam reforming over bimetallic Ni-Co on La2O3 catalyst-Effect of the catalyst dilution. Appl. Mech. Mater. 2014, 493, 39–44. [Google Scholar] [CrossRef]
  35. Mi, Y.; Yuan, D.; Liu, Y.; Zhang, J.; Xiao, Y. Synthesis of hexagonal close-packed nanocrystalline nickel by a thermal reduction process. Mater. Chem. Phys. 2005, 89, 359–361. [Google Scholar] [CrossRef]
  36. Beach, E.R.; Shqau, K.; Brown, S.E.; Rozeveld, S.J.; Morris, P.A. Solvothermal synthesis of crystalline nickel oxide nanoparticles. Mater. Chem. Phys. 2009, 115, 371–377. [Google Scholar] [CrossRef]
  37. Nabgan, W.; Abdullah, T.A.T.; Mat, R.; Nabgan, B.; Jalil, A.A.; Firmansyah, L.; Triwahyono, S. Production of hydrogen via steam reforming of acetic acid over Ni and Co supported on La2O3 catalyst. Int. J. Hydrogen Energy 2016. [Google Scholar] [CrossRef]
  38. Ingersoll, J.C.; Mani, N.; Thenmozhiyal, J.C.; Muthaiah, A. Catalytic hydrolysis of sodium borohydride by a novel nickel–cobalt–boride catalyst. J. Power Sources 2007, 173, 450–457. [Google Scholar] [CrossRef]
  39. Li, Y.; Wang, R.; Qi, F.; Wang, C. Preparation, characterization and microwave absorption properties of electroless Ni–Co–P-coated SiC powder. Appl. Surf. Sci. 2008, 254, 4708–4715. [Google Scholar] [CrossRef]
  40. Cabo, M.; Garroni, S.; Pellicer, E.; Milanese, C.; Girella, A.; Marini, A.; Rossinyol, E.; Suriñach, S.; Baró, M.D. Hydrogen sorption performance of MgH2 doped with mesoporous nickel- and cobalt-based oxides. Int. J. Hydrogen Energy 2011, 36, 5400–5410. [Google Scholar] [CrossRef]
  41. Han, S.J.; Bang, Y.; Yoo, J.; Seo, J.G.; Song, I.K. Hydrogen production by steam reforming of ethanol over mesoporous Ni–Al2O3–ZrO2 xerogel catalysts: Effect of nickel content. Int. J. Hydrogen Energy 2013, 38, 8285–8292. [Google Scholar] [CrossRef]
  42. Lin, S.S.Y.; Kim, D.H.; Ha, S.Y. Metallic phases of cobalt-based catalysts in ethanol steam reforming: The effect of cerium oxide. Appl. Catal. A Gen. 2009, 355, 69–77. [Google Scholar] [CrossRef]
  43. Xu, J.; Zhou, W.; Li, Z.; Wang, J.; Ma, J. Biogas reforming for hydrogen production over nickel and cobalt bimetallic catalysts. Int. J. Hydrogen Energy 2009, 34, 6646–6654. [Google Scholar] [CrossRef]
  44. Alves-Rosa, M.A.; Martins, L.; Hammer, P.; Pulcinelli, S.H.; Santilli, C.V. Sulfated zirconia foams synthesized by integrative route combining surfactants, air bubbles and sol-gel transition applied to heterogeneous catalysis. RSC Adv. 2016, 6, 6686–6694. [Google Scholar] [CrossRef]
  45. Mondal, T.; Pant, K.K.; Dalai, A.K. Catalytic oxidative steam reforming of bio-ethanol for hydrogen production over Rh promoted Ni/CeO2–ZrO2 catalyst. Int. J. Hydrogen Energy 2015, 40, 2529–2544. [Google Scholar] [CrossRef]
  46. Yasu-eda, T.; Kitamura, S.; Ikenaga, N.-O.; Miyake, T.; Suzuki, T. Selective oxidation of alcohols with molecular oxygen over Ru/CaO–ZrO2 catalyst. J. Mol. Catal. A Chem. 2010, 323, 7–15. [Google Scholar] [CrossRef]
  47. Li, W.; Zhao, Z.; Ding, F.; Guo, X.; Wang, G. Syngas Production via Steam–CO2 Dual Reforming of Methane over LA-Ni/ZrO2 Catalyst Prepared by l-Arginine Ligand-Assisted Strategy: Enhanced Activity and Stability. ACS Sustain. Chem. Eng. 2015, 3, 3461–3476. [Google Scholar] [CrossRef]
  48. Kumar, P.; Sun, Y.; Idem, R.O. Comparative study of Ni-based mixed oxide catalyst for carbon dioxide reforming of methane. Energy Fuels 2008, 22, 3575–3582. [Google Scholar] [CrossRef]
  49. De Freitas Silva, T.; Reis, C.G.M.; Lucrédio, A.F.; Assaf, E.M.; Assaf, J.M. Hydrogen production from oxidative reforming of methane on Ni/γ-Al2O3 catalysts: Effect of support promotion with La, La–Ce and La–Zr. Fuel Process. Technol. 2014, 127, 97–104. [Google Scholar] [CrossRef]
  50. Khodakov, A.Y.; Chu, W.; Fongarland, P. Advances in the Development of Novel Cobalt Fischer−Tropsch Catalysts for Synthesis of Long-Chain Hydrocarbons and Clean Fuels. Chem. Rev. 2007, 107, 1692–1744. [Google Scholar] [CrossRef] [PubMed]
  51. Dang, C.; Yu, H.; Wang, H.; Peng, F.; Yang, Y. A bi-functional Co–CaO–Ca12Al14O33 catalyst for sorption-enhanced steam reforming of glycerol to high-purity hydrogen. Chem. Eng. J. 2016, 286, 329–338. [Google Scholar] [CrossRef]
  52. Luo, N.; Ouyang, K.; Cao, F.; Xiao, T. Hydrogen generation from liquid reforming of glycerin over Ni–Co bimetallic catalyst. Biomass Bioenergy 2010, 34, 489–495. [Google Scholar] [CrossRef]
  53. Koh, A.C.W.; Chen, L.; Kee Leong, W.; Johnson, B.F.G.; Khimyak, T.; Lin, J. Hydrogen or synthesis gas production via the partial oxidation of methane over supported nickel–cobalt catalysts. Int. J. Hydrogen Energy 2007, 32, 725–730. [Google Scholar] [CrossRef]
  54. Gunter, K.L.; Sutherland, J.W. An experimental investigation into the effect of process conditions on the mass concentration of cutting fluid mist in turning. J. Clean. Prod. 1999, 7, 341–350. [Google Scholar] [CrossRef]
  55. Bingol, D.; Tekin, N.; Alkan, M. Brilliant Yellow dye adsorption onto sepiolite using a full factorial design. Appl. Clay Sci. 2010, 50, 315–321. [Google Scholar] [CrossRef]
  56. Hallman, N. High Temperature, High Pressure Hydrocarbon Conversion Process. U.S. Patent 3,714,028, 30 January 1973. [Google Scholar]
  57. Naseri, A.; Ayadi-Anzabi, H. Monitoring of decolorization of a two dyes mixture using spectrophotometric data and multivariate curve resolution: Modeling the removal process using an experimental design method. Anal. Methods 2012, 4, 153–161. [Google Scholar] [CrossRef]
  58. Antony, J. A Systematic Methodology for Design of Experiments. In Design of Experiments for Engineers and Scientists, 2nd ed.; Antony, J., Ed.; Elsevier: Oxford, UK, 2014; pp. 33–50. [Google Scholar]
  59. Mathews, P.G. Design of Experiments with MINITAB; ASQ Quality Press: Milwaukee, WI, USA, 2005. [Google Scholar]
  60. Ellison, S.L.R.; Farrant, T.J.; Barwick, V.; Chemistry, R.S.O. Practical Statistics for the Analytical Scientist: A Bench Guide; RSC Publishing: Cambridge, UK, 2009. [Google Scholar]
  61. Cojocaru, C.; Zakrzewska-Trznadel, G. Response surface modeling and optimization of copper removal from aqua solutions using polymer assisted ultrafiltration. J. Membr. Sci. 2007, 298, 56–70. [Google Scholar] [CrossRef]
  62. Cobo, M.; Pieruccini, D.; Abello, R.; Ariza, L.; Córdoba, L.F.; Conesa, J.A. Steam reforming of ethanol over bimetallic RhPt/La2O3: Long-term stability under favorable reaction conditions. Int. J. Hydrogen Energy 2013, 38, 5580–5593. [Google Scholar] [CrossRef]
  63. Natesakhawat, S.; Watson, R.B.; Wang, X.; Ozkan, U.S. Deactivation characteristics of lanthanide-promoted sol–gel Ni/Al2O3 catalysts in propane steam reforming. J. Catal. 2005, 234, 496–508. [Google Scholar] [CrossRef]
  64. Yang, E.-H.; Kim, N.Y.; Noh, Y.-S.; Lim, S.S.; Jung, J.-S.; Lee, J.S.; Hong, G.H.; Moon, D.J. Steam CO2 reforming of methane over La1−xCexNiO3 perovskite catalysts. Int. J. Hydrogen Energy 2015, 40, 11831–11839. [Google Scholar] [CrossRef]
  65. Gallego, G.S.; Marín, J.G.; Batiot-Dupeyrat, C.; Barrault, J.; Mondragón, F. Influence of Pr and Ce in dry methane reforming catalysts produced from La1−xAxNiO3−δ perovskites. Appl. Catal. A Gen. 2009, 369, 97–103. [Google Scholar] [CrossRef]
Figure 1. Schematic flow diagram of experimental setup.
Applsci 06 00223 g001
Figure 2. XRD pattern for Ni/ZrO2 and Co/ZrO2 catalysts after reduction at 600 °C; (●) peaks correspond to metallic Ni, (■) peaks correspond to metallic Co, (□) peaks correspond to monoclinic phase of ZrO2 (m-ZrO2) and (○) peaks correspond to tetragonal phase of ZrO2 (t-ZrO2).
Applsci 06 00223 g002
Figure 3. TPR-H2 profiles for the Ni/ZrO2 and Co/ZrO2 catalysts.
Applsci 06 00223 g003
Figure 4. Normal plot for (a) Y1 and (b) Y2.
Applsci 06 00223 g004
Figure 5. Pareto chart for (a) Y1 and (b) Y2.
Applsci 06 00223 g005
Figure 6. Parity charts of predicted versus observed responses for the initial models of (a) phenol conversion (Y1) and (b) hydrogen yield (Y2), including all main and interaction independent variables.
Applsci 06 00223 g006
Figure 7. Pareto chart of the reduced model for (a) Y1 and (b) Y2.
Applsci 06 00223 g007
Figure 8. Parity charts of predicted versus observed responses for the reduced models of phenol conversion (Y1) (a) and hydrogen yield (Y2) (b) with a 95% prediction band.
Applsci 06 00223 g008
Figure 9. Main effect plot for (a) Y1 and (b) Y2.
Applsci 06 00223 g009
Figure 10. Full interaction plot matrix for (a) Y1 and (b) Y2.
Applsci 06 00223 g010
Figure 11. Surface plot for significant interactions on Y1: (a) AE; (b) BE; (c) CE; (d) DE.
Applsci 06 00223 g011
Figure 12. Contour plot for significant interactions on Y1: (a) AE; (b) BE; (c) CE; (d) DE.
Applsci 06 00223 g012
Figure 13. Surface plot for significant interactions on Y2: (a) AE; (b) BE; (c) CE; (d) DE.
Applsci 06 00223 g013
Figure 14. Contour plot for significant interactions on Y2: (a) AE; (b) BE; (c) CE; (d) DE.
Applsci 06 00223 g014
Figure 15. Results from the Response Optimizer tool for Y1 (a) and Y2 (b).
Applsci 06 00223 g015
Figure 16. TGA profile of used Ni/ZrO2 and Co/ZrO2 catalysts.
Applsci 06 00223 g016
Table 1. Selected factors and levels for the experimental study.
FactorsSymbolLevels
Temperature (°C)A500800
Feed flow rate (mL/min)B0.160.46
Catalyst amount (g)C0.10.3
Ni-Co ratioD01
Phenol Concentration (wt %)E210
Table 2. Experiment matrix for the 25 factorial designs and experimental results.
RunsA (°C)B (mL/min)C (g)DE (wt %)Phenol ConversionH2COCO2
15000.460.101021.631.610.458
25000.460.111021.0311059
38000.460.311053.441.112.846.1
48000.460.31213.927.68.963.5
58000.160.111064.054.215.330.5
68000.160.11217.329.59.660.9
75000.160.1129.425.16.868.1
85000.160.10213.227.58.663.9
98000.460.111042.134.612.552.9
108000.460.10211.626.97.865.3
118000.160.101081.962.215.921.9
125000.160.111037.633.911.954.2
138000.460.101057.951.214.834
148000.160.30223.232.511.256.3
155000.460.311022.032.310.657.1
165000.460.301062.653.914.931.2
175000.160.311044.037.512.649.9
185000.160.30211.627.18.564.4
198000.160.10219.730.79.759.6
205000.460.30215.628.1962.9
215000.460.1125.022.35.971.8
228000.160.31216.328.49.262.4
238000.160.301096.872.416.111.5
248000.460.1129.725.27.467.4
255000.160.101057.445.913.540.6
265000.160.301058.151.514.833.7
275000.460.1022.721.45.872.8
285000.460.3125.722.46.271.4
298000.160.311076.355.715.728.6
308000.460.301077.956.815.827.4
315000.160.31210.626.77.765.6
328000.460.30219.530.19.760.2
Table 3. Analysis of the regression coefficient of the initial model for phenol conversion (Y1).
ResponseModel TermsEffectCoefficientp-Value
Phenol conversion (%)Model Equation (6)-8.740140.000
A17.704−0.002160.008
B−12.201−39.66080.016
C8.478−74.47820.026
D−11.43−19.40770.018
E41.8597.490080.002
AB−1.4910.0239120.495
AC0.6720.0839920.727
AD−0.5180.0301470.784
AE10.5520.0008460.021
BC3.915247.5540.229
BD−0.63265.85270.742
BE−7.508−30.92890.036
CD−3.939133.440.227
CE4.986−30.3160.049
DE−7.779−6.775650.031
ABC−2.213−0.223520.373
ABD0.635−0.087510.74
ABE−0.7310.030160.706
ACD1.525−0.207450.488
ACE0.4990.0463930.792
ADE0.0420.0054430.982
BCD−4.111−402.1830.219
BCE0.96139.8890.632
BDE−0.52827.71720.78
CDE−1.71625.98470.451
ABCD3.460.5579740.256
ABCE−1.642−0.172840.465
ABDE0.062−0.031970.973
ACDE1.361−0.027930.524
BCDE−2.346−145.2290.356
ABCDE1.470.1632870.501
R2 = 0.999, R2(adj) = 0.976.
Table 4. Analysis of the regression coefficient of the initial model for hydrogen yield (Y2).
ResponseModel TermsEffectCoefficientp-Value
Hydrogen yield (%)Model Equation (7)-31.34390
A8.806−0.008160.009
B−6.519−37.72220.027
C4.431−43.36670.041
D−7.644−10.86610.018
E19.6441.290280.006
AB−2.4940.0327780.268
AC−0.6690.0426670.657
AD−0.6690.0141720.657
AE5.0190.0030030.039
BC1.581128.3330.392
BD−0.29430.15280.837
BE−3.581−11.52780.048
CD−2.44495.750.273
CE2.644−10.61670.255
DE−5.506−5.401940.031
ABC−0.919−0.10.562
ABD−0.519−0.031810.724
ABE−2.6060.0122220.258
ACD1.006−0.12950.534
ACE−0.4560.0223330.753
ADE−0.4310.0071310.766
BCD−0.994−272.9170.538
BCE0.26974.16670.85
BDE−0.18123.00690.898
CDE−1.40612.78610.428
ABCD2.4560.3458330.272
ABCE−0.831−0.108330.593
ABDE−0.906−0.034930.567
ACDE0.894−0.023640.571
BCDE−0.181−83.81940.898
ABCDE1.1190.1243060.497
R2 = 0.998, R2(adj) = 0.944.
Table 5. The regression coefficient value of the reduced model for Y1.
ResponseModel TermsEffectCoefficientF-Ratiop-Value
Phenol conversion (%)Model Equation (8)-−1.87079121.10.000
A17.7040.006252478.520.000
B−12.201−3.1337.290.000
C8.4784.996918.010.000
D−11.430.2386632.730.000
E41.8591.18218438.950.000
AE10.5520.0087932627.890.000
BE−7.508−6.2564714.120.001
CE4.9866.232146.230.021
DE−7.779−1.9447115.160.001
R2 = 0.968, R2(adj) = 0.955.
Table 6. The regression coefficient value of the reduced model for Y2.
ResponseModel termsEffectCoefficientF-Ratiop-Value
Hydrogen yield (%)Model Equation (9)-15.734660.130.000
A8.8060.0042639.930.000
B−6.519−3.8229221.880.000
C4.43122.156310.110.004
D−7.6440.6156230.080.000
E19.6441.35042198.670.000
AE5.0190.00418212.970.002
BE−3.581−2.984376.60.017
CE−5.506−1.3765615.610.001

