Article

Online Monitoring of Laser-Generated XUV Radiation Spectra by Surface Reflectivity Measurements with Particle Detectors

1
Institute of Optics and Quantum Electronics, Abbe Center of Photonics, Friedrich Schiller University Jena, Max-Wien-Platz 1, 07743 Jena, Germany
2
Institut für Kernphysik, Westfälische Wilhelms Universität, Wilhelm-Klemm-Straße 9, 48149 Münster, Germany
3
GSI Helmholtz Centre for Heavy Ion Research, Planckstrasse 1, 64291 Darmstadt, Germany
4
Helmholtz Institute Jena, Fröbelstieg 3, 07743 Jena, Germany
*
Author to whom correspondence should be addressed.
Appl. Sci. 2017, 7(1), 70; https://doi.org/10.3390/app7010070
Submission received: 24 November 2016 / Revised: 3 January 2017 / Accepted: 4 January 2017 / Published: 10 January 2017
(This article belongs to the Section Optics and Lasers)

Abstract

:
In this contribution, we present a wavelength-sensitive method for the detection of extreme ultraviolet (XUV) photon energies between 30 eV and 120 eV. The method is based on 45° reflectivity from either a cesium iodide-coated or an uncoated metal surface, which directs the XUV beam onto an electron or ion detector and its signal is used to monitor the XUV beam. The benefits of our approach are a spectrally sensitive diagnosis of the XUV radiation at the interaction place of time-resolved XUV experiments and the detection of infrared leak light though metal filters in high-harmonic generation (HHG) experiments. Both features were tested using spectrally shaped XUV pulses from HHG in a capillary, and we have achieved excellent agreement with XUV spectrometer measurements and reflectivity calculations. Our obtained results are of interest for time-resolved XUV experiments presenting an additional diagnostic directly in the interaction region and for small footprint XUV beamline diagnostics.

1. Introduction

Over the past several decades, high-harmonic generation (HHG) has been extensively studied for enabling table-top production of coherent pulses of extreme ultraviolet (XUV) radiation. Due to the spectral, spatial, and temporal properties of HHG radiation, its applications range from fundamental atomic and molecular physics to material science, biology, and medicine [1,2,3], and great effort is being put into further source development [4,5,6] and scaling to high repetition rates and high laser pulse energies [7,8]. Since high-order harmonics are generated from an infrared laser pulse by nonlinear interaction with a gaseous medium, one task is to filter out the fundamental infrared beam to ensure a pure interaction of the sample with XUV radiation [9,10,11]. This becomes even more important if a part of the infrared laser pulses is used to initiate a dynamic process, and its subsequent evolution is monitored with delayed XUV pulses (Figure 1). Independent of whether, in such optical-pump XUV-probe experiments, the transmitted XUV radiation is measured [12,13], the emitted photoelectrons [14] are monitored, or additional temporal information will be gained by streaking the emitted photoelectrons with an intense infrared (IR) laser field [15], residual IR radiation in the probe arm can significantly complicate these experiments. Additionally, intensity fluctuations of IR laser pulses can result in an ionization-induced blue shift of the harmonic lines [16], or alter the amplitudes of the harmonic lines due to different phase matching conditions. If this happens during the exposure time, a high-resolution microscopy image will, for instance, be degraded, or an additional energy shift will appear in photoelectron spectra. Therefore, for high-quality experiments with HHG radiation, special care must be taken in the suppression of residual IR radiation and in ensuring the stability of the XUV spectra during these measurements. This implies that the signals must be continuously monitored, without interfering with the experiment.
In this paper, we present reflection measurements of cesium iodide (CsI)-coated and uncoated steel surfaces with shaped XUV pulses. We measure the spectrally integrated signal from both surfaces and show that the ratio of the two measured signals is a sensitive probe of changes in the incident XUV spectrum. Additionally, a disagreement between the measured ratio and the calculated number can be explained by a leakage of IR radiation through one of the metal filters. This simple setup allows for the monitoring of the IR leakage and spectral stability simultaneously. The paper is organized as follows: In Section 2, we introduce the method, describe the fabrication of the coated surfaces, and outline the experimental setup. The results of the experiments are presented in Section 3, and the context of XUV instrumentation is discussed. Conclusions and possible applications follow in Section 4.

2. Materials and Methods

2.1. Coated XUV Mirrors for 45° Incidence Angle

Since the reflectivity of mirrors in the XUV spectral range is very low for normal incidence, it is necessary to use glancing incidence optics in experiments. However, here we investigate the reflectivity of metal mirrors for 45°, which allows for an easier implementation in the beam path, even at the expense of a low reflectivity. In the energy range above 30 eV, tabulated values by the Center for X-ray Optics (CXRO) can be used to calculate the reflectivity, since, for photon energies from 30 eV to 30 keV, atomic scattering factors can be reliably used [18]. Below 30 eV, the assumption of independent scatterers is no longer strictly valid, since these photon energies approach the valence ionization threshold. Reflectivity values for four different materials are shown in Figure 2a.
For our experiments, we have used mirrors made of uncoated stainless steel (Fe.72Cr.18Ni.10) and a cesium iodide-coated stainless steel (300-nm-thick coating). For reflectivity calculations, stainless steel is very well approximated by iron, and the cesium iodide-coated mirror can be well described by its bulk properties. In the spectral range of interest, we have several narrow features, which will be not seen in our experiments, because we use a broadband XUV source. To allow for a meaningful comparison, we have calculated the spectrally integrated reflected signal after convoluting the reflectivity data given in Figure 2a with a realistic spectral distribution. Here, we choose a Gaussian distribution with a standard deviation of 3 eV and vary the center photon energy between 40 eV and 110 eV with a step size of 2 eV (Figure 2b). The spectrally integrated XUV yield on a detector is shown for the center tablevalues of the spectral distributions in Figure 2c. Finally, we have calculated the ratio of the reflected XUV yield compared to CsI, as depicted in Figure 2d. It can be seen that, for central photon energies between 40 eV and 50 eV, the ratio between uncoated and CsI-coated stainless steel is approximately 10, resulting in an order of magnitude difference in the detected signal levels. For other possible substrate materials, this ratio quickly increases towards 50, which will cause experimental difficulties due to very different and very low signal levels. It can be seen that CsI coatings are not practicable for all elements in the range between 55 eV and 80 eV. However, measurement of different reflections from uncoated metal surfaces would be an alternative. For the range from 80 eV to 110 eV mean photon energy, the comparison with CsI-coated surfaces becomes feasible again. Above 120 eV, all surfaces have a very low reflectivity, which limits this measurement procedure. This can be overcome by choosing a smaller angle of incidence.
Figure 3 illustrates the measurement procedure by taking two different reflective materials into account.
It should be mentioned that the reflectivity for 800 nm light is also different for both surfaces ( R Iron , 800 nm 70 % ,   R CsI , 800 nm 15 % ). This will make it possible to determine whether spectral filtering of XUV radiation from a fundamental laser pulse by metal foils is sufficient or whether a significant portion of IR light is still present. Usually, the infrared transmission through a thin metal foil is approximately 10−5 to 10−8 and thus comparable with the conversion efficiency of 10−5 to 10−6 of HHG.

2.2. Fabrication of the Samples

Cesium iodide-coated metal surfaces are commonly used as photocathodes in XUV spectroscopy due to their increased photoemission compared to metal surfaces [19]. In addition, photocathodes meet the requirements of ultrahigh vacuum conditions, can be adapted in their size and shape, and offer a wide dynamic range for various experiments. Therefore, they also find applications in storage rings [20,21,22]. The stainless steel samples were produced and polished at the mechanical workshop of the Nuclear Physics Institute at the University of Münster from Grade 1.4301 steel. Some of these samples were coated by a vacuum evaporation process at the target laboratory at GSI Helmholtz Centre for Heavy Ion Research with a 300-nm-thick layer of high purity CsI.

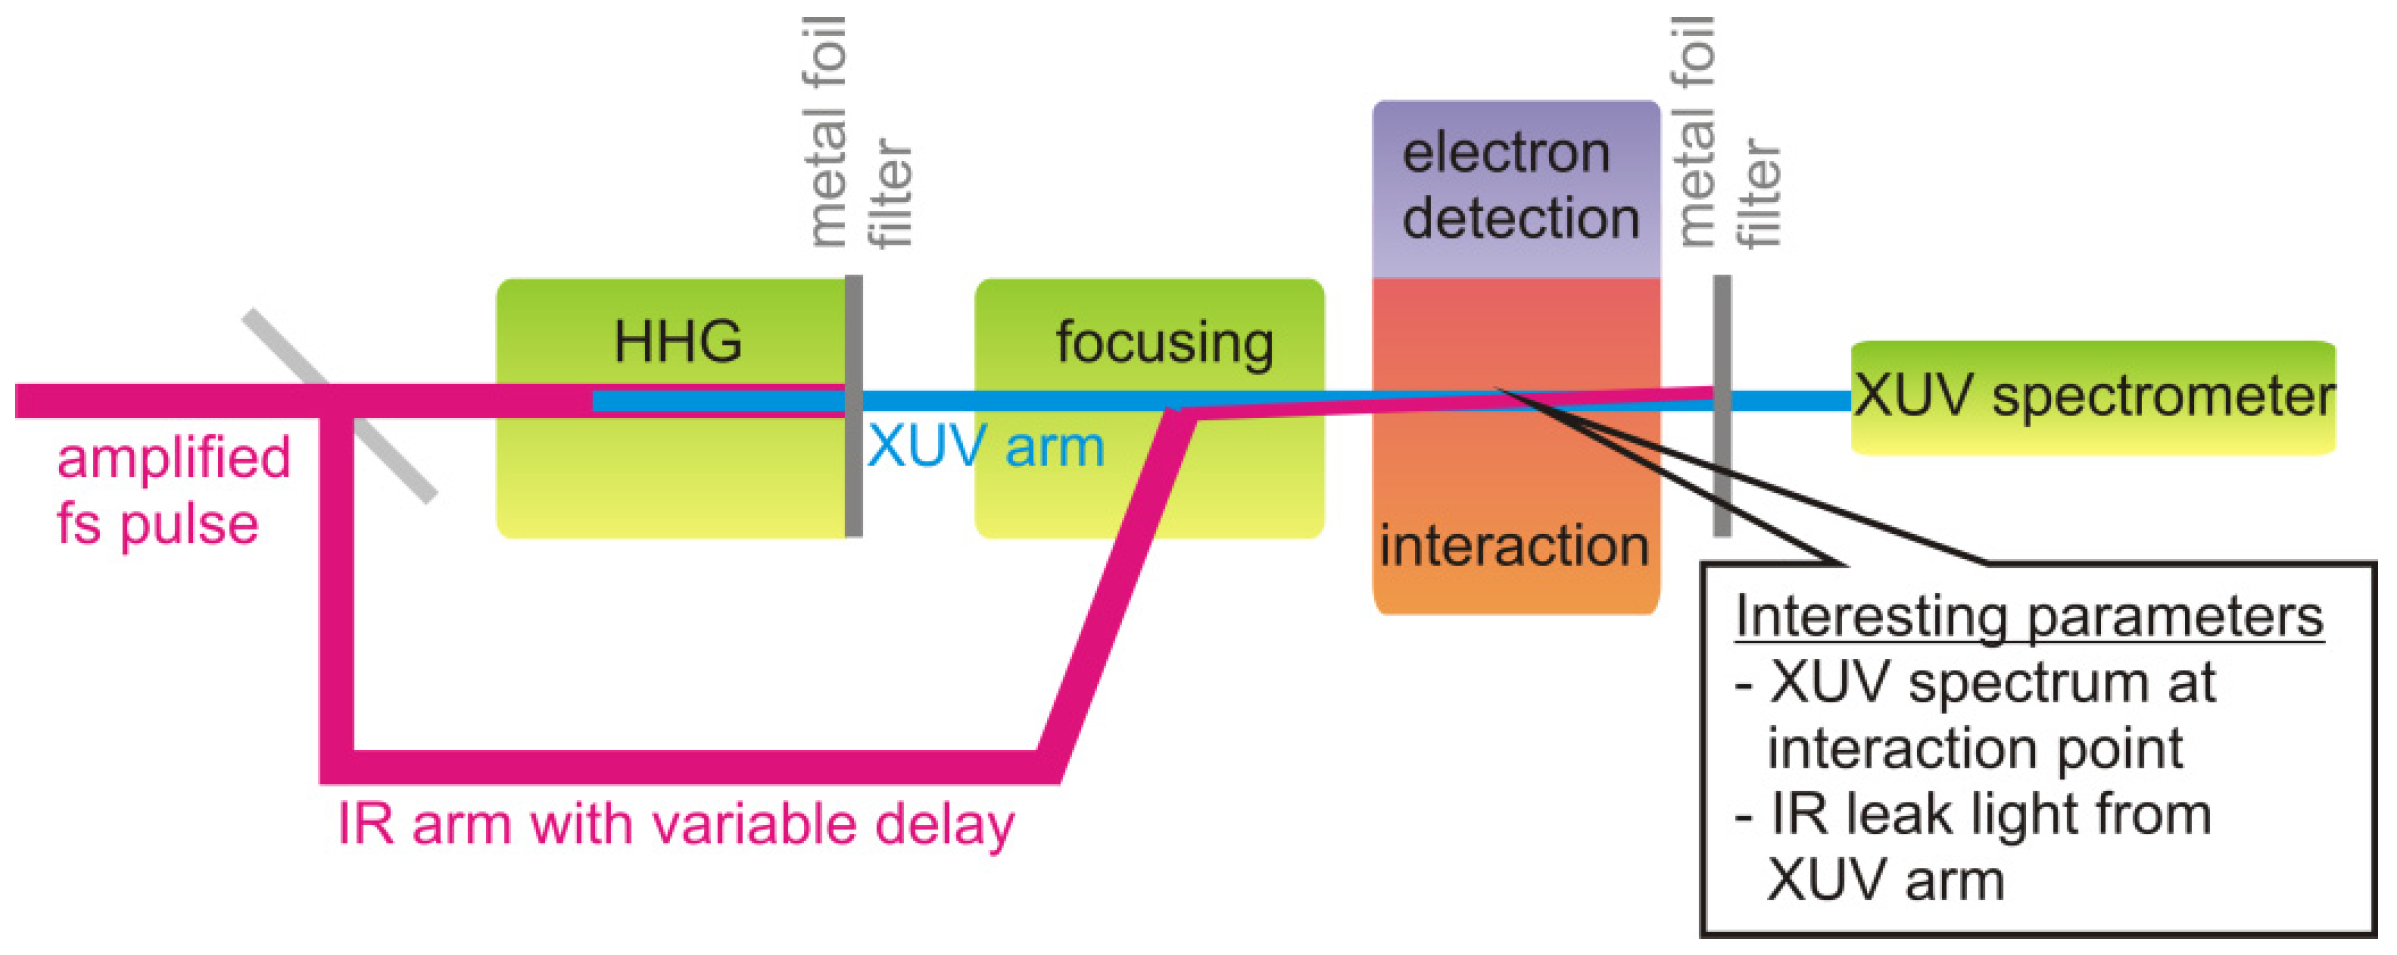
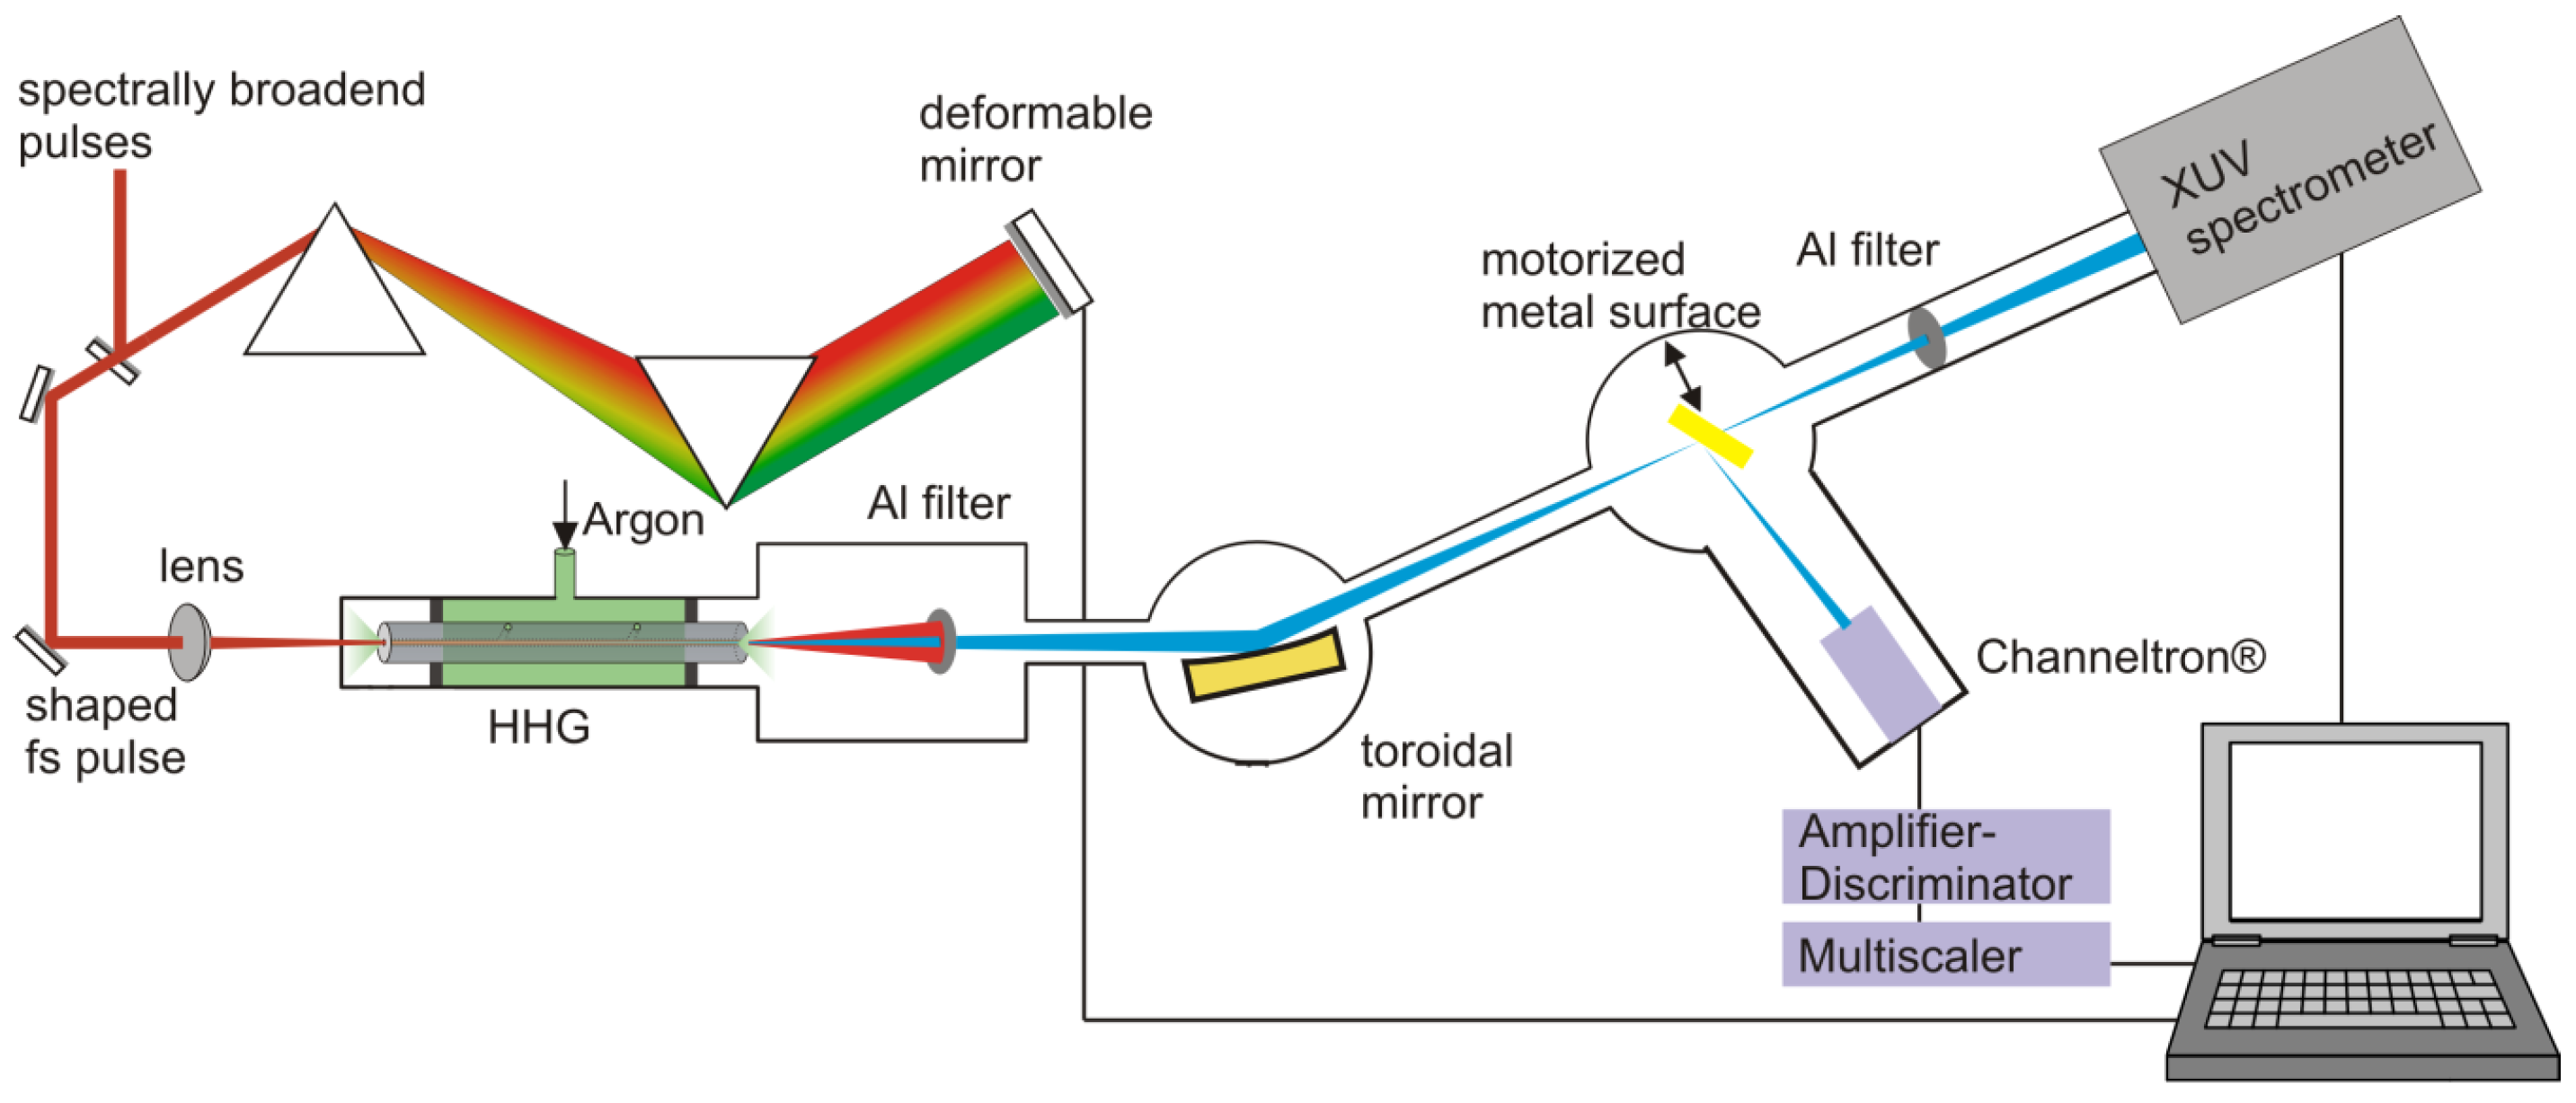
2.3. Experimental Setup

The experimental setup is depicted in Figure 4. Ultrashort laser pulses from a titanium sapphire CPA system (80 fs pulse duration, 0.9 mJ pulse energy, 1 kHz repetition rate) are spectrally broadened in an argon-filled hollow-core fiber. These spectrally broadened pulses are then sent into a prism compressor with a deformable mirror as a symmetry mirror for pulse-shaping. The shaped pulses are focused into an argon-filled capillary for HHG. Further details about the pulse-shaping device and the HHG setup can be found in [23]. The generated XUV radiation is separated from the laser beam by an aluminum filter foil (thickness of 300 nm), focused by a toroidal gold mirror into the interaction region, and characterized by an XUV spectrometer (LHT 30, HORIBA Jobin Yvon, Bensheim, Germany) equipped with a PI-SX 400 back-illuminated XUV-CCD, Roper Scientific, Martinsried, Germany).
Various gaseous, liquid, or solid targets can be investigated by the focused XUV beam and charged particles can be detected, e.g., by time-of-flight electron or by ion spectrometers [24,25]. Here, we use the reflection from a metal surface to direct the XUV beam onto a Channeltron (CEM045JR-1, PHOTONIS, Sturbridge, MA, USA) at a distance of 25 cm. It should be noted that the Channeltron used in our experiments is able to detect photons in a wavelength range from 0.1 nm to about 150 nm, and is regarded as a solar blind detector. The detector is supplied with a voltage of 2200 V along the tube axis. To measure the arrival time of the signals, the output of the detector is amplified, discriminated (ORTEC Model 9327, AMETEK, Meerbusch, Germany), and measured with a multiscaler (P7887, FASTComTec, Oberhaching, Germany).
It should be mentioned that the steel surface is not of optical quality in terms of XUV mirrors, which can cause scattering and reduced reflectivity due to surface roughness. In addition, the XUV beam being focused at the steel surface has a large beam size at the position of the detector. This becomes important when analyzing the temporally resolved signal from the Channeltron. Due to its cone shape, various spatial areas are illuminated and secondary electrons experience different accelerating potentials. Hence, the detected signal from the XUV photons is temporally smeared out to cover a range of approximately 30 ns.

2.4. Tailored High-Harmonic Generation

Besides being a well-established source for XUV spectroscopy and pump-probe experiments high-harmonic generation offers additional tunability and flexibility via tailoring the harmonics. One inherent feature of HHG is its strong dependence on the driving laser parameters (e.g., the cutoff law) and focusing geometry (phase matching), which make it sensitive for spatial and spectral pulse-shaping [26]. HHG in a hollow-core fiber has additional phase-matching conditions compared to a free-focus geometry [27], which offers enhancement or suppression of single harmonics (Figure 5).
In our experiments, we have used shaped XUV pulses from a hollow-core fiber to characterize the reflectivity of the surfaces with a tunable, broadband source with photon energies between 30 eV and 55 eV. Further details about the pulse-shaping device, computer-controlled optimizations, and the HHG in capillaries can be found in [23,26,28] (and references therein). For our experiments, we generated XUV spectra with different spectral widths and amplitude distributions for testing our measurement setup and data processing.

2.5. Data Processing

For comparison of the reflectivity of uncoated and CsI-coated steel with tabulated values, the measured broadband XUV spectra were processed in the following way:
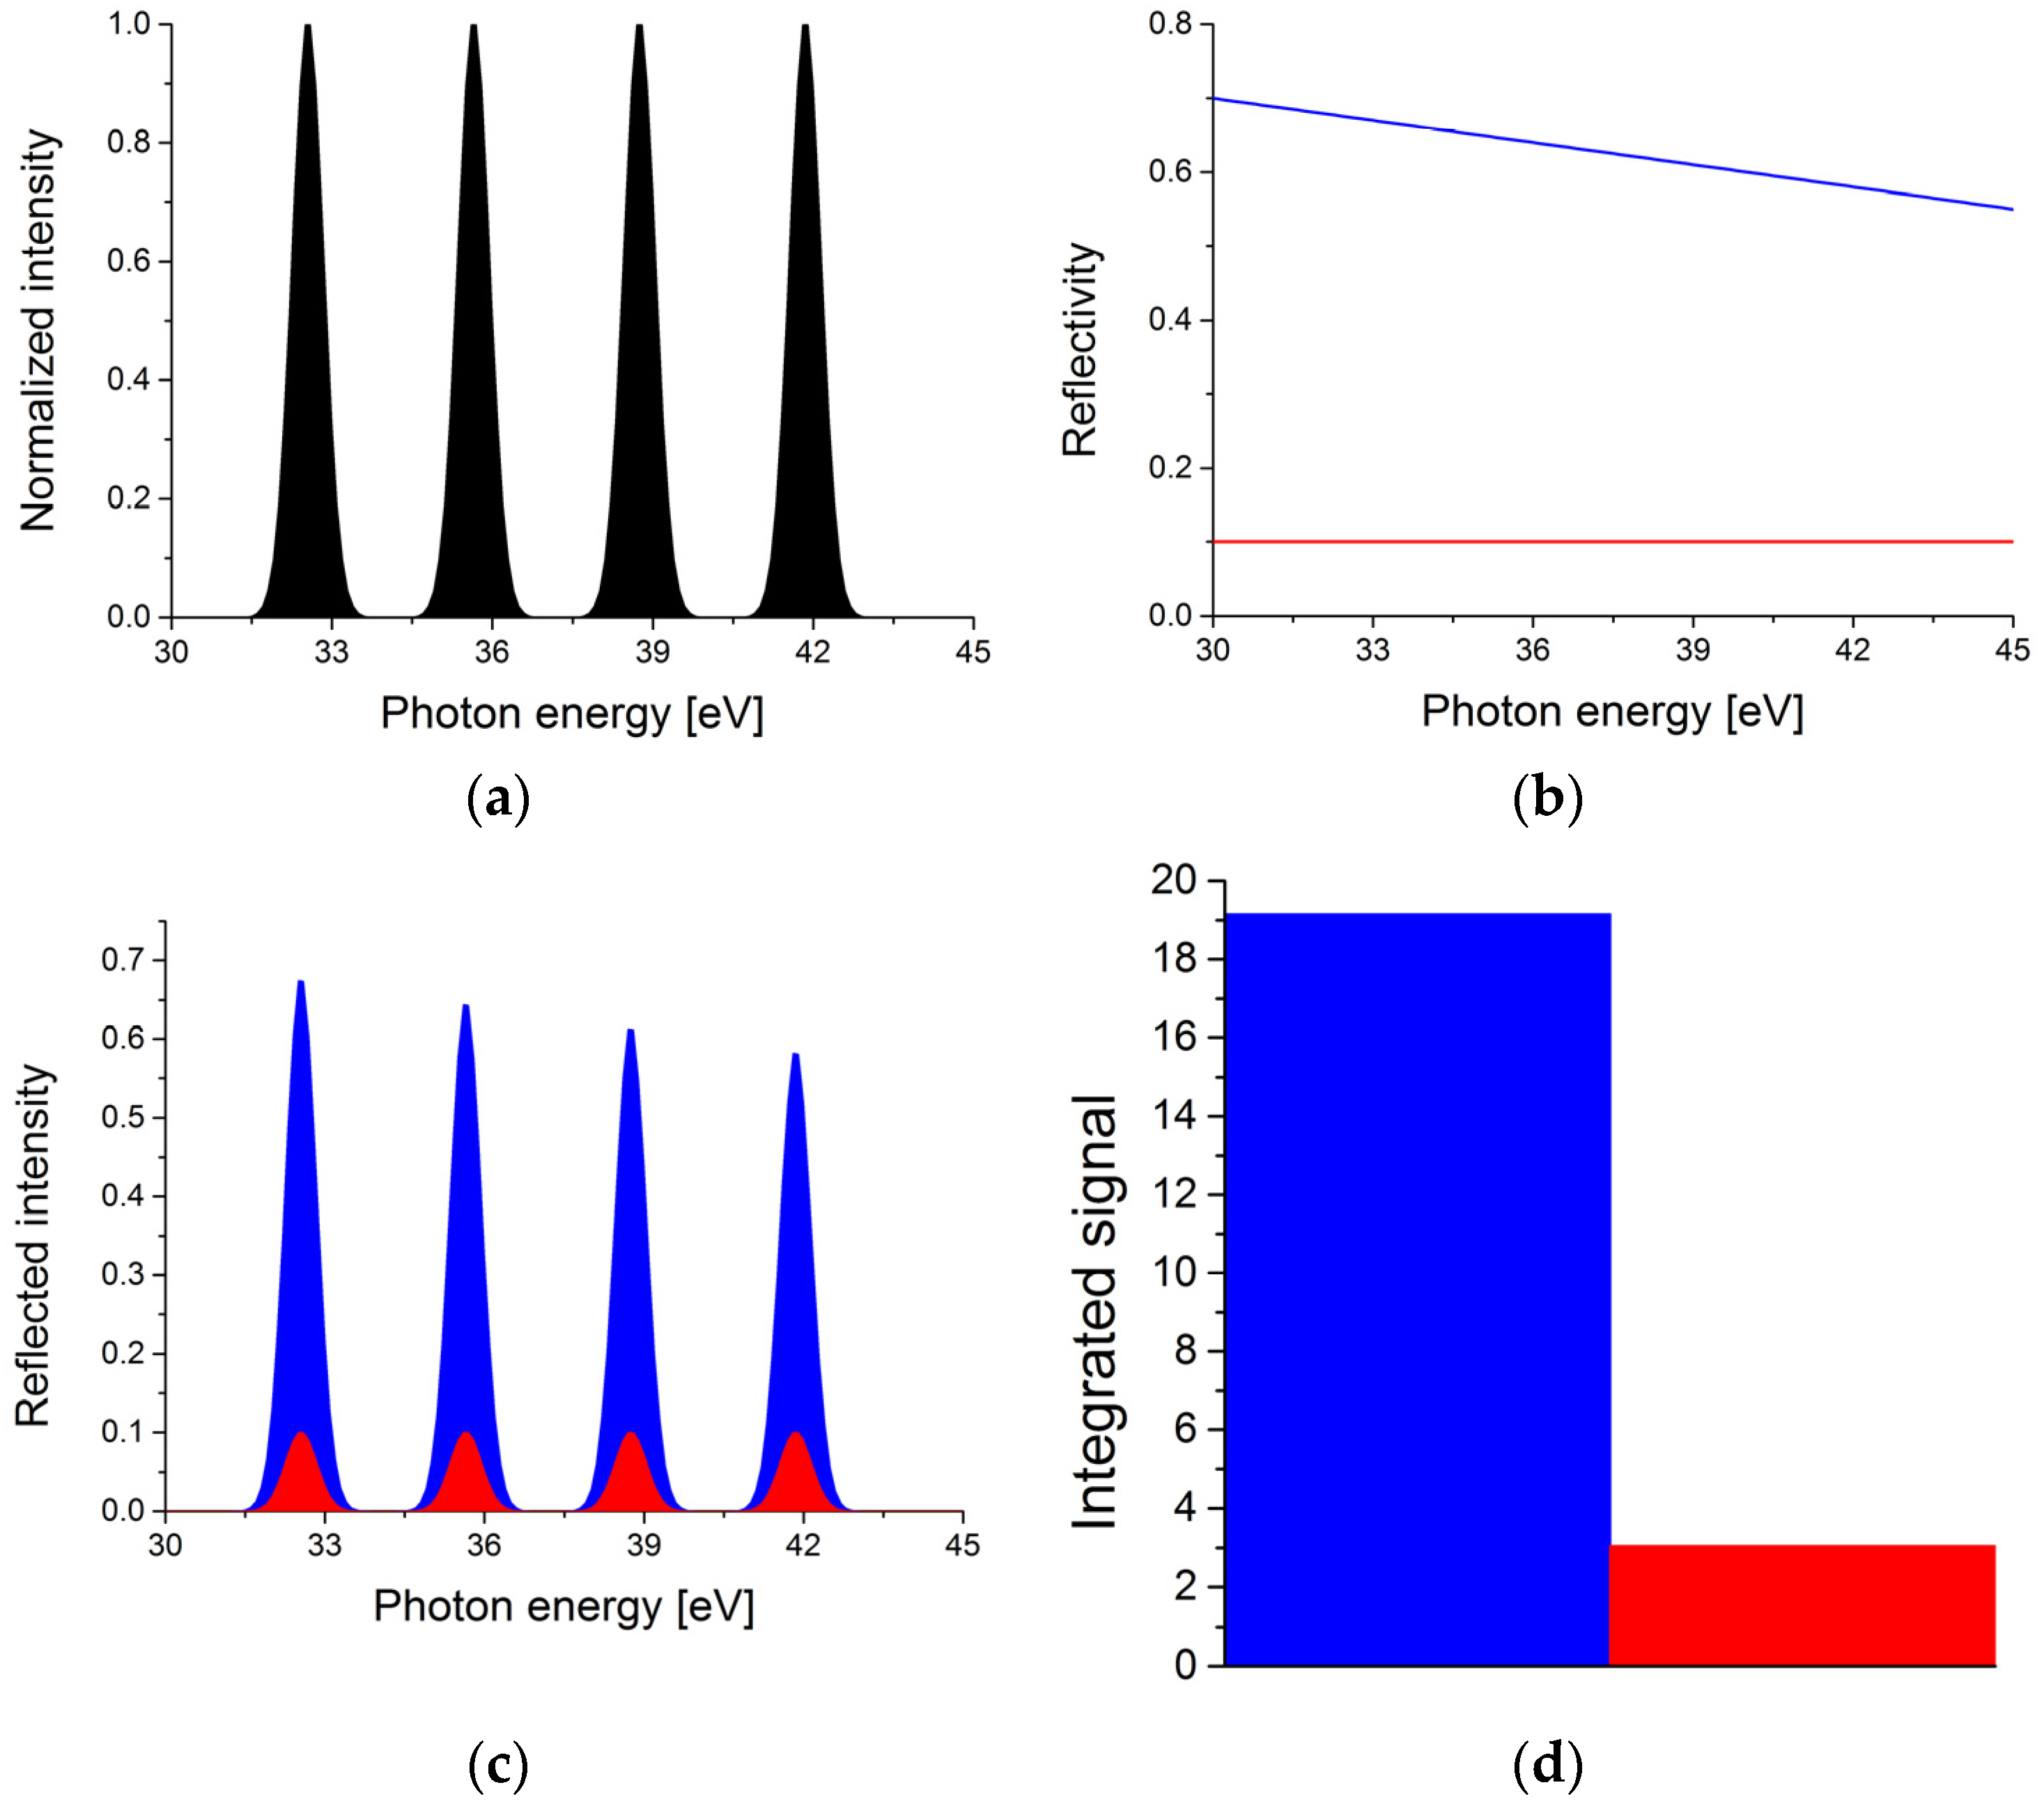
  • The measured spectra were converted from wavelength to photon energy scale.
  • These spectra were normalized and the offset noise of the spectrometer was subtracted.
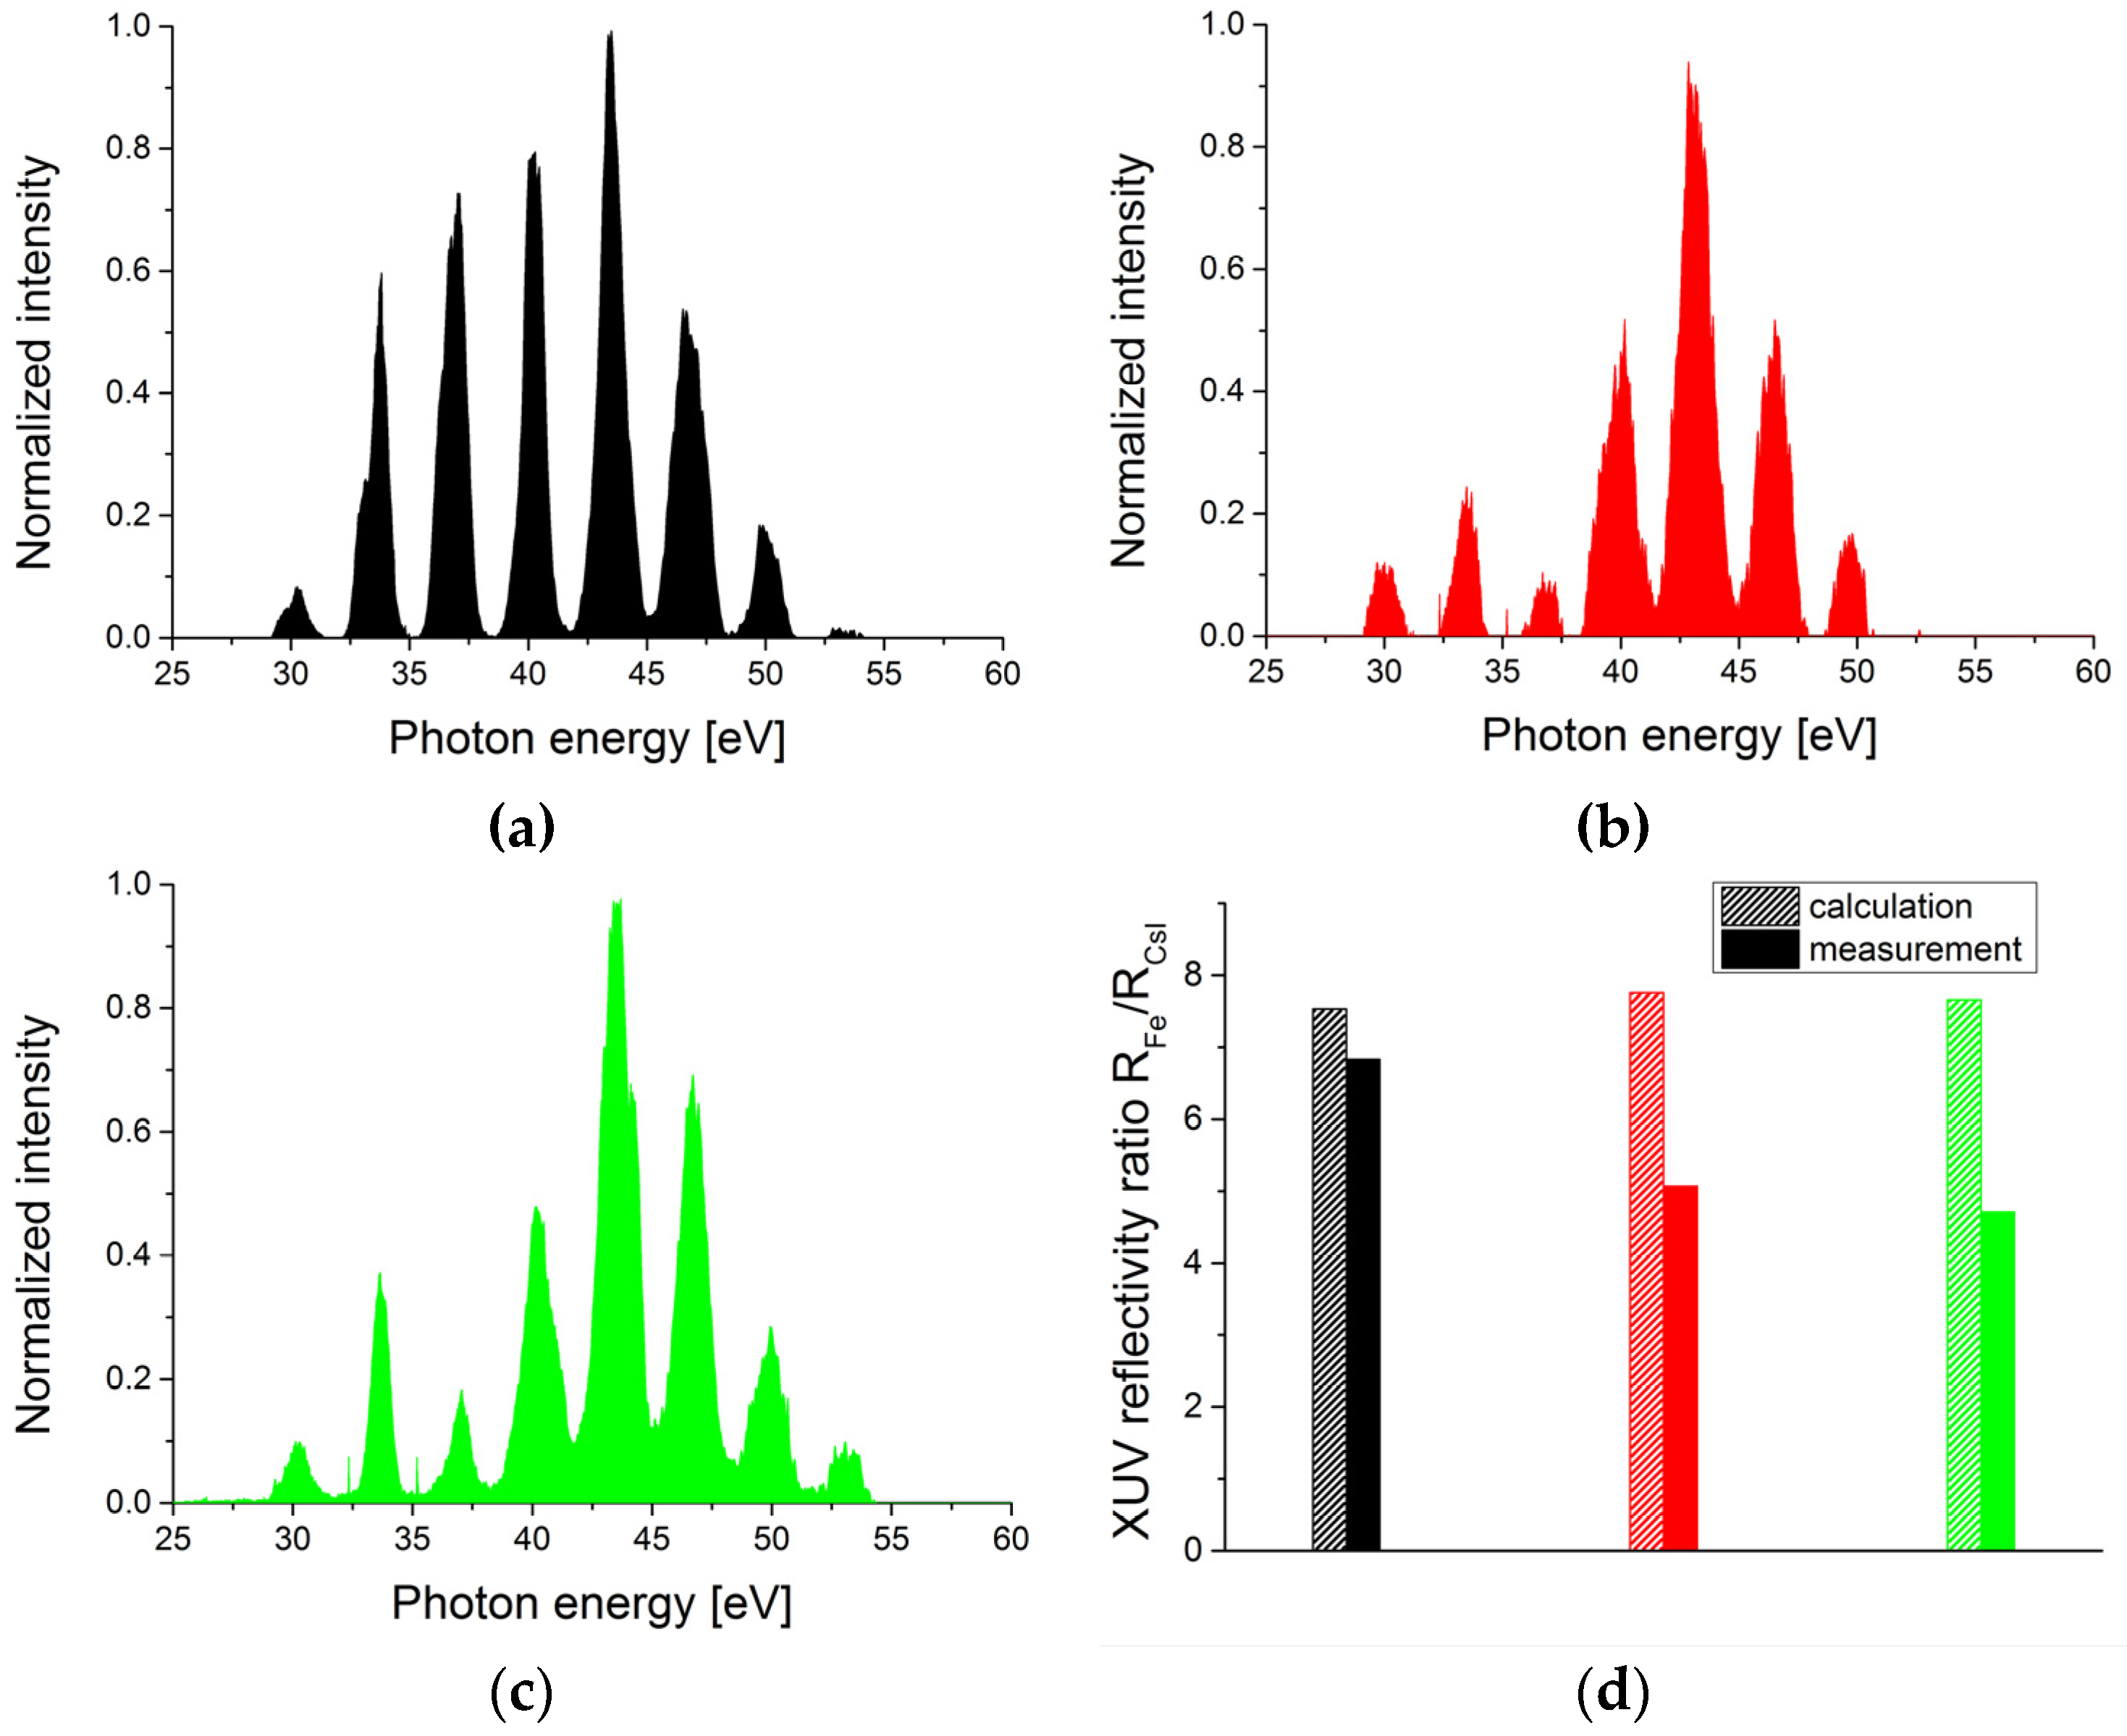
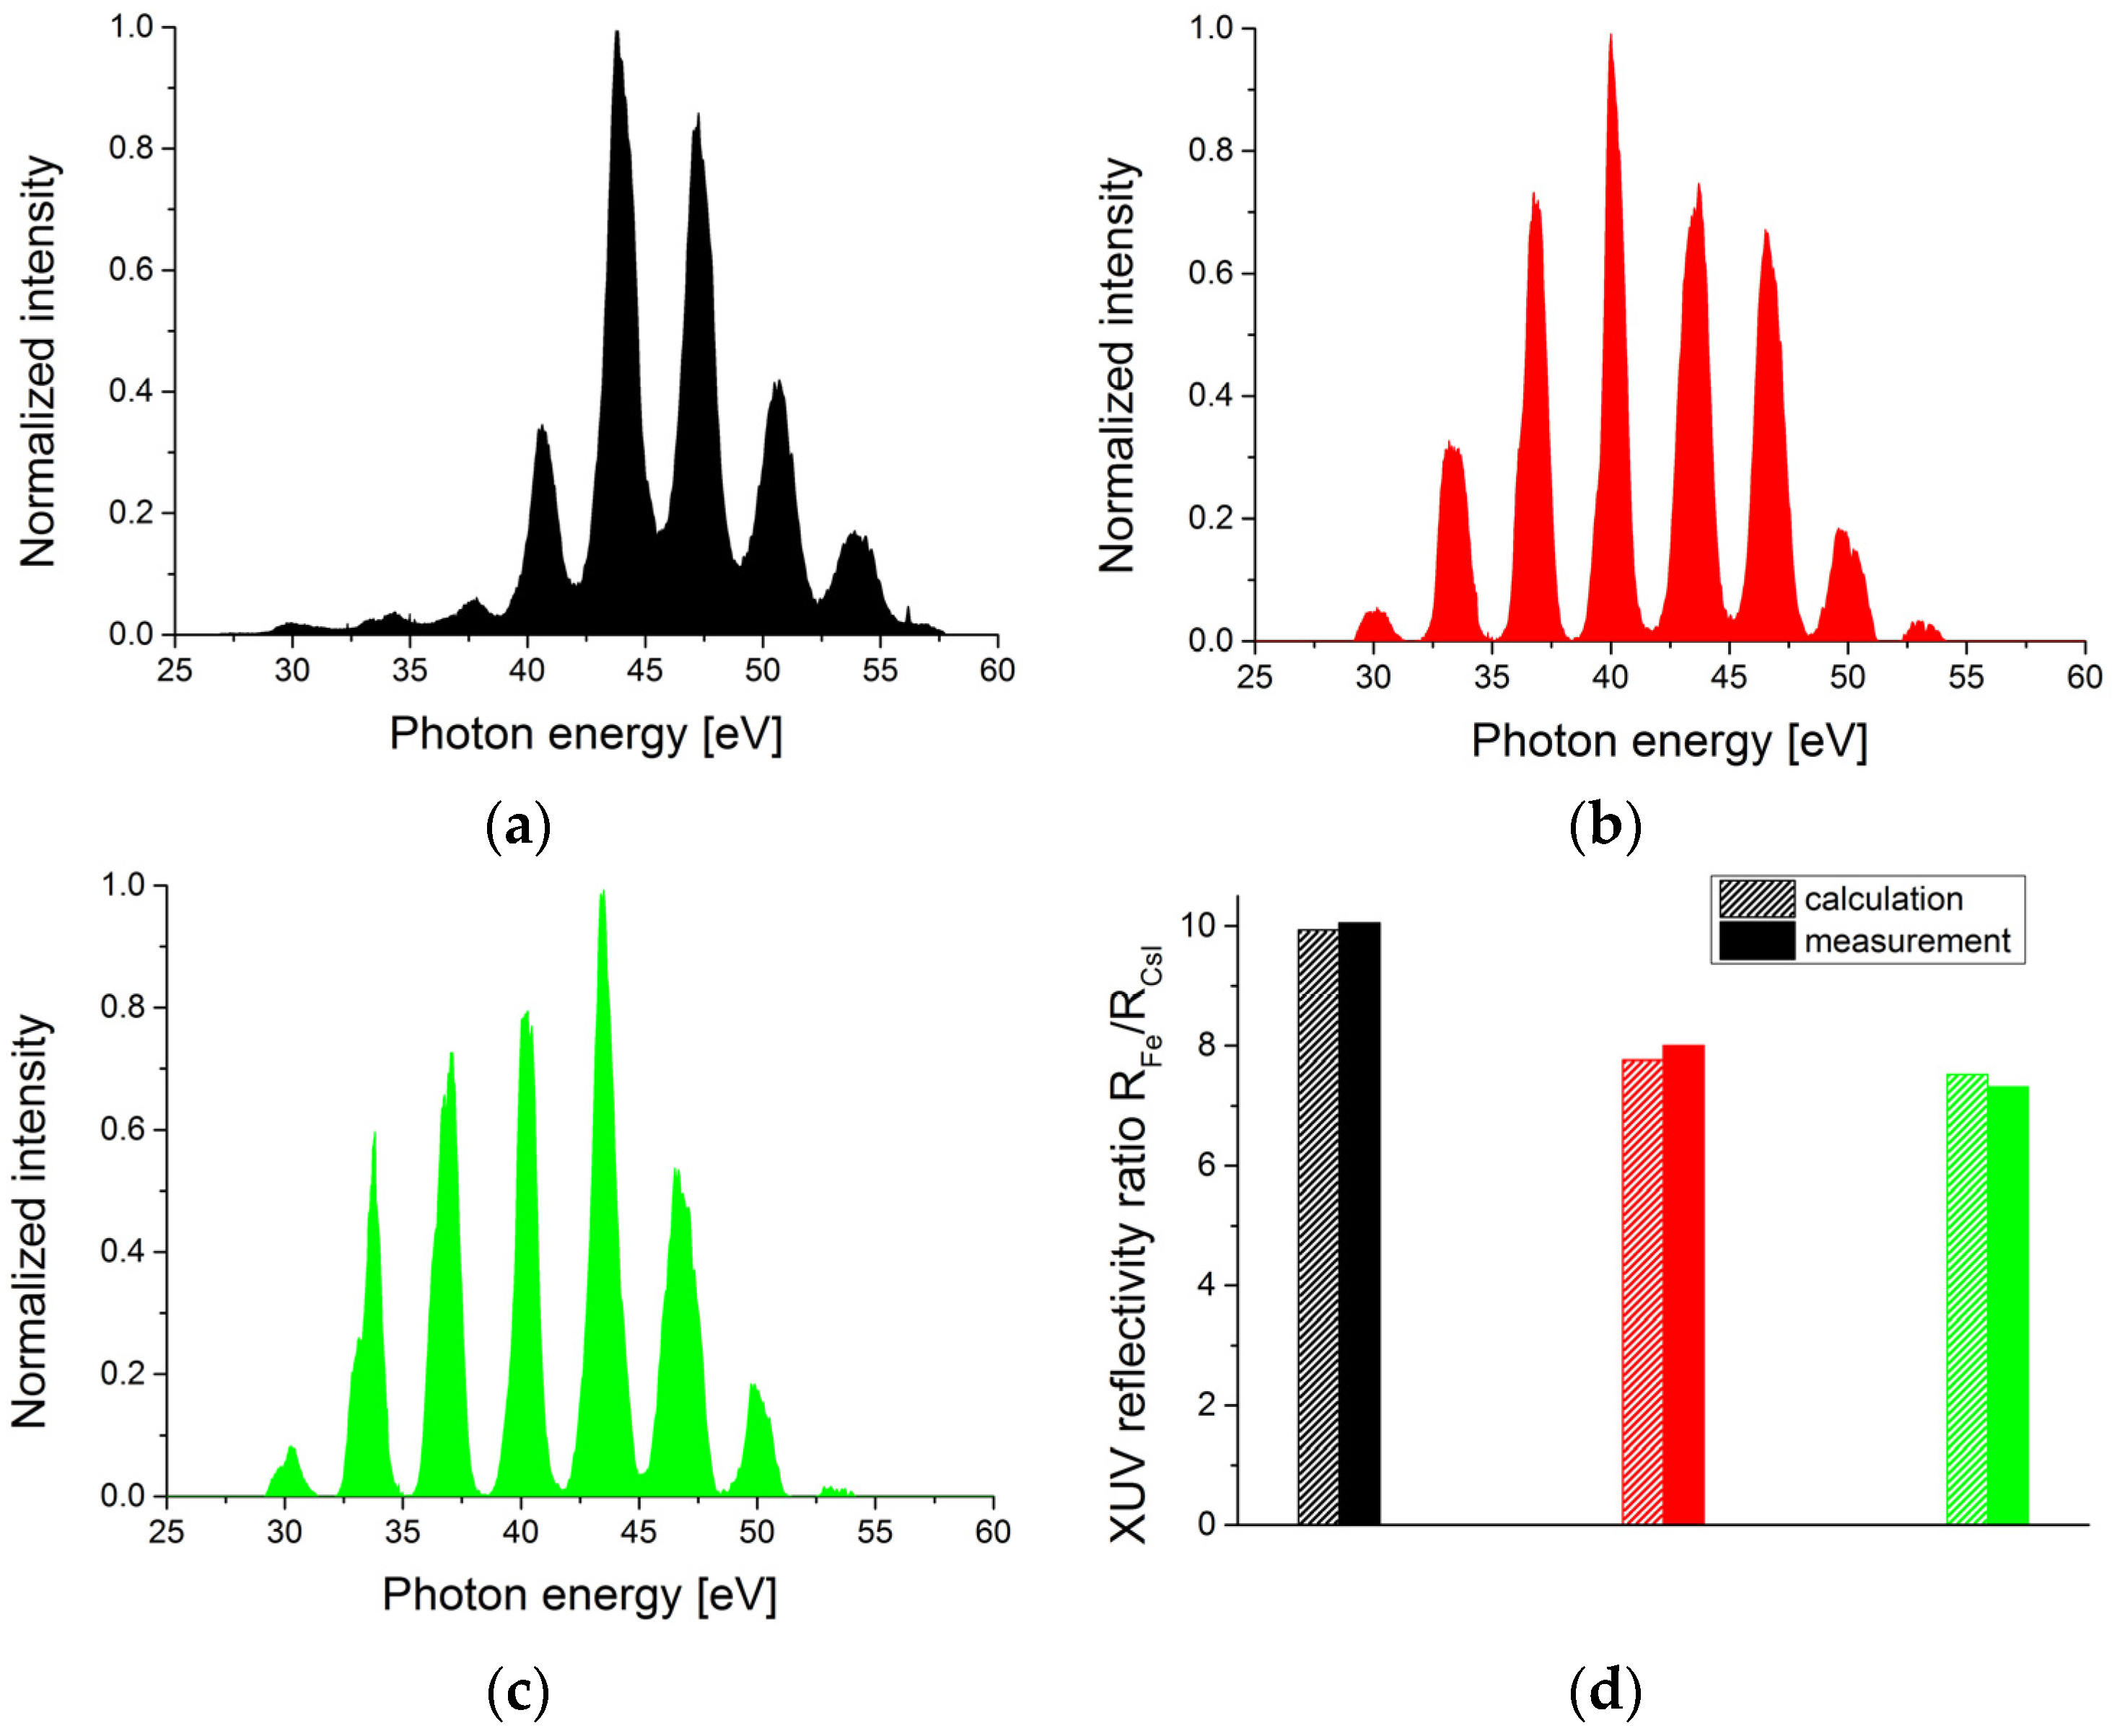
  • These spectra were interpolated to 1000 data points and multiplied with the tabulated reflectivity values either from iron or CsI.
  • Both were then spectrally integrated to obtain the integrated reflected XUV yield R . From this, the ratio R F e R C s I was calculated.
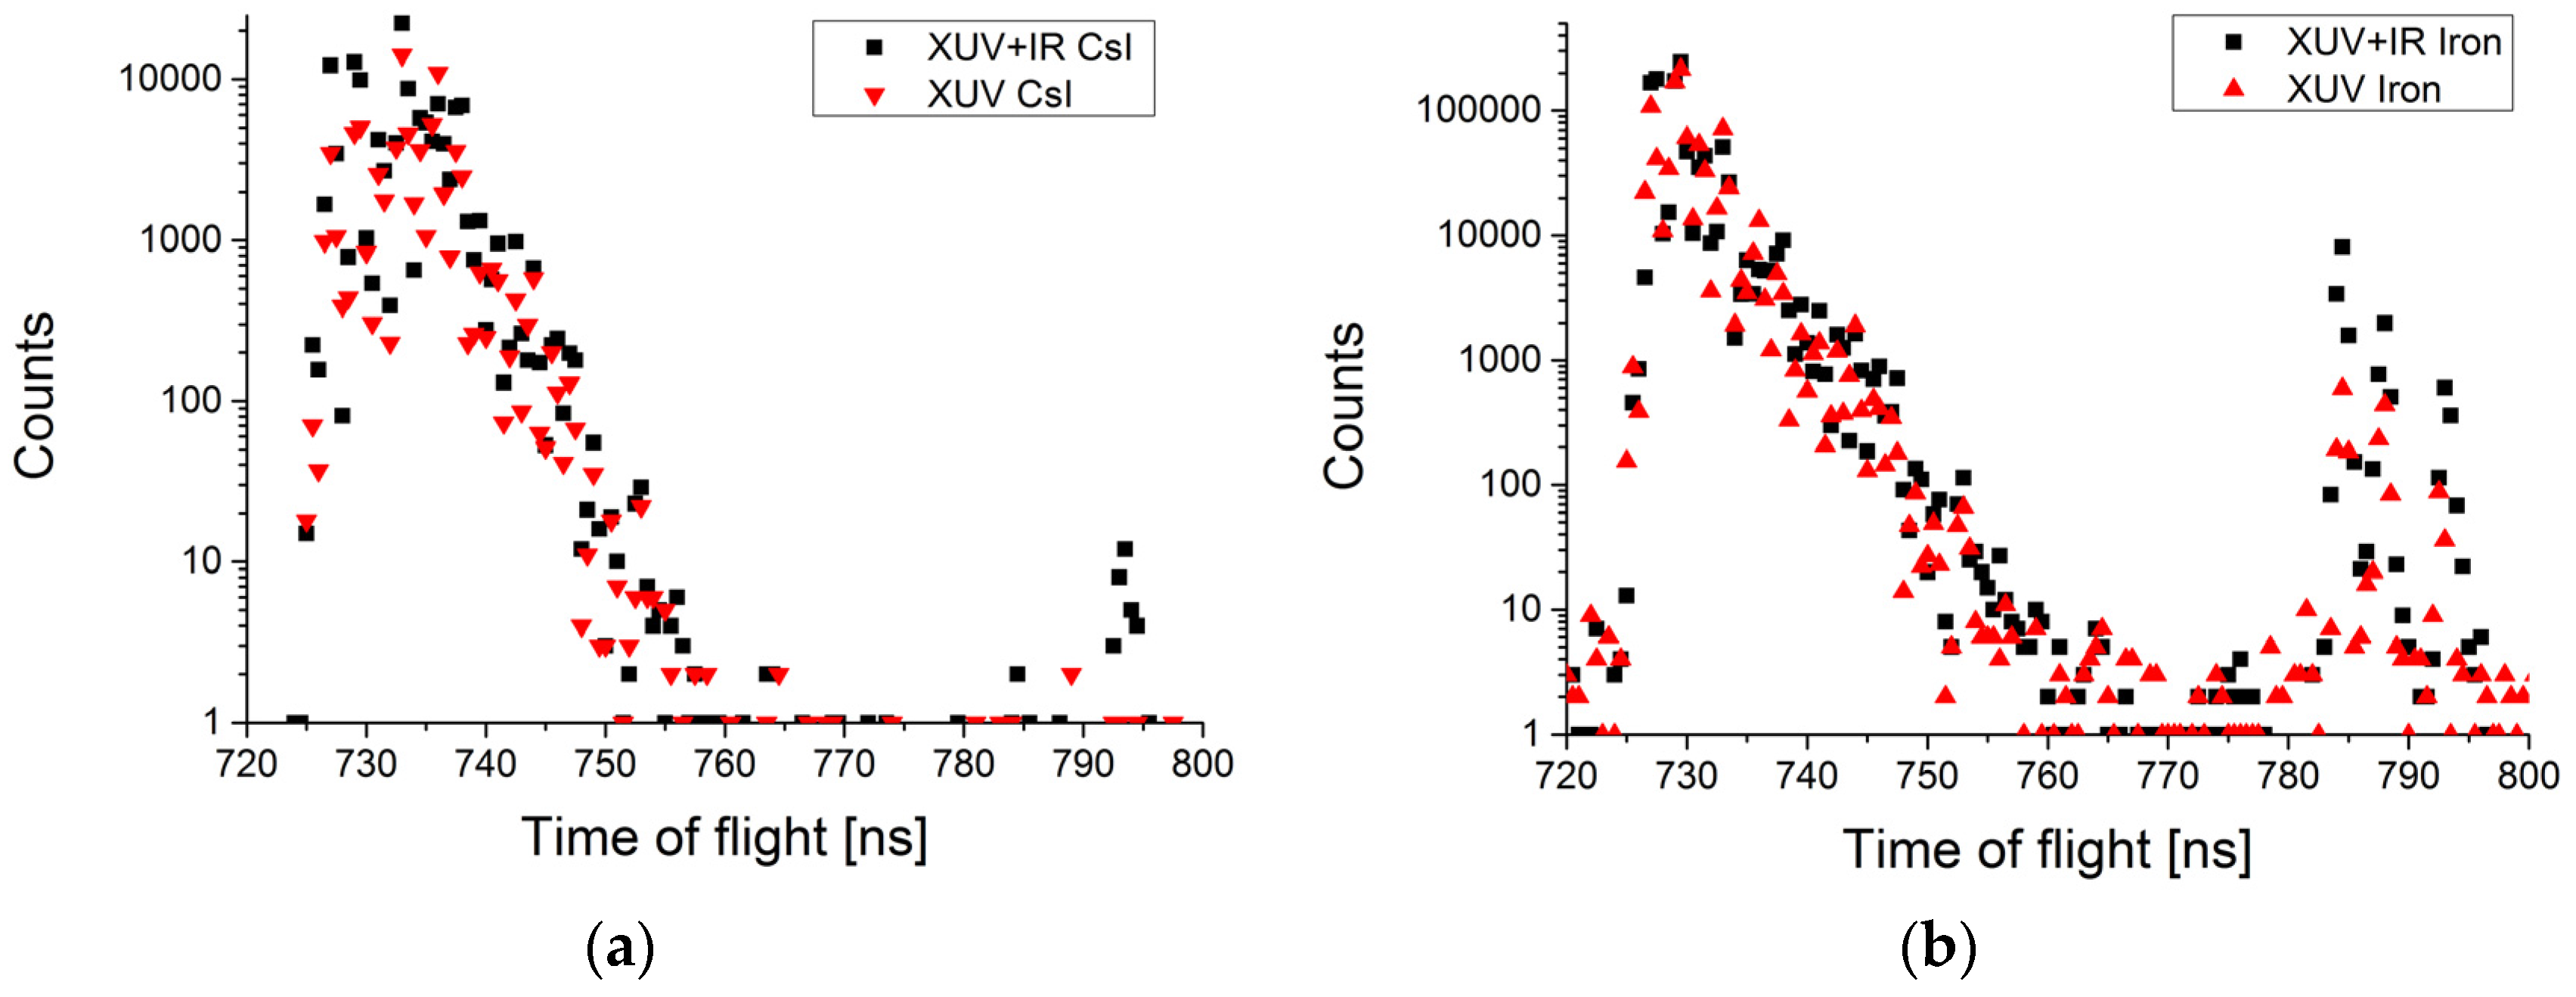
  • The same ratio can be determined using the reflection by the uncoated or coated steel surface onto the Channeltron. Here, the temporally resolved signal must be integrated in a time interval for both surfaces, and its ratio again is R F e R C s I .

3. Results and Discussion

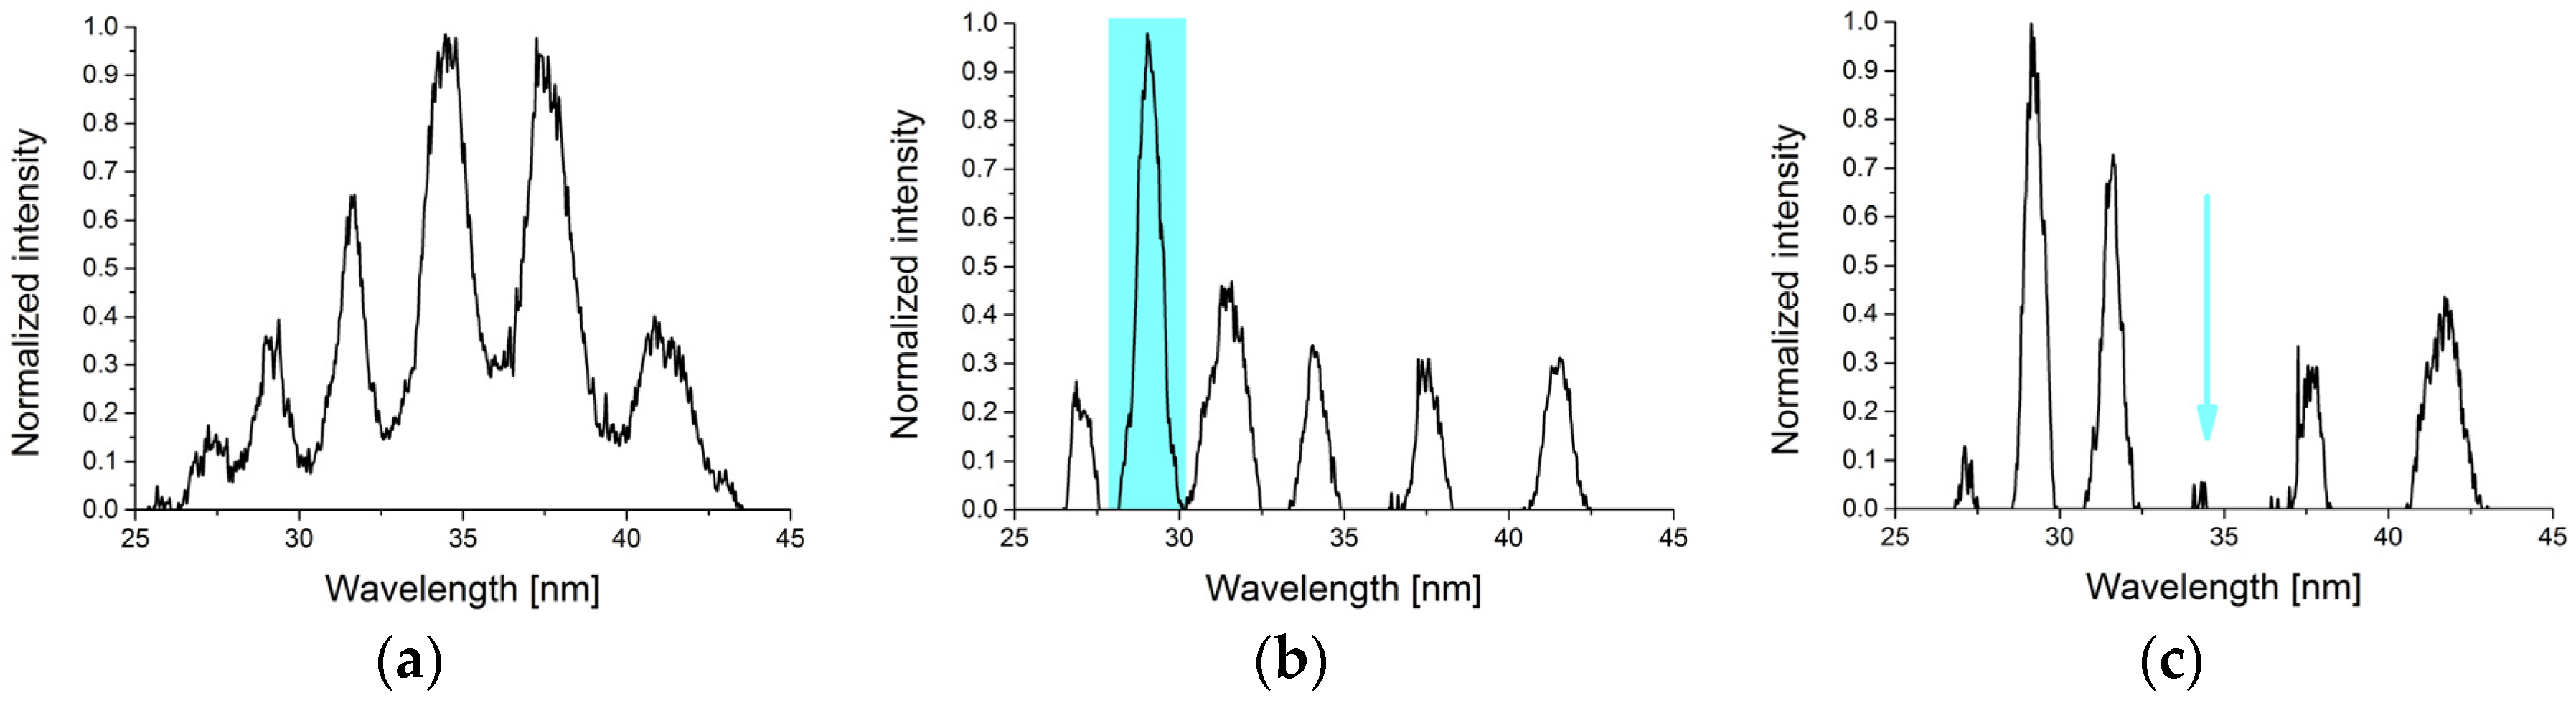
3.1. Characterization with Shaped XUV Pulses

The reflectivity characterization of the uncoated and CsI-coated steel surface is shown in Figure 6. Comparing the XUV reflectivity ratio for three different XUV spectra shows a good agreement between calculations using the tabulated values and evaluations of the Channeltron signals. The difference between calculation and measurement is approximately 3%. This confirms that the ratio of the two signals is a sensitive probe of the spectral shape of the incident XUV radiation.
Moreover, the very good agreement between the theoretical calculations and the measurements is also a clear indication that the spectral response of our XUV spectrometer equipped with a CCD camera must be rather flat. Therefore, using a shaped spectrum and a set of two different mirrors allow for a quick check of the correct spectral response of the XUV measurement equipment.

3.2. IR Leak Light Detection

For the characterization of the XUV signal by the spectrally integrated reflectivity measurement, we have assumed no residual IR light contribution due to efficient suppression with the metal filters. However, imperfections of the metal foil filters lead to a substantial portion of IR light in the XUV beam. With the attached XUV spectrometer, this IR light cannot be detected because of its limited displayed spectral range. Although the Channeltron is regarded as being solar blind, we will show that we were able to detect the residual IR light. Therefore, we varied the metal foil position horizontally and vertically to find imperfections in the foil that increase the amount of transmitted IR light. This has been monitored with an IR viewer observing the steel surface. After adjusting the filter, we performed the same data analysis as presented in Section 3.1, and the results are shown in Figure 7. We have made two very distinct observations: First, the measured data now reveal a substantial difference between the calculation and the measurement. The measured reflectivity ratio can be 10% to 40% lower. Second, as we have used a counting detector, we observed a substantial change in the count rate for both surfaces, uncoated and CsI-coated stainless steel.
To further investigate the IR sensitivity of our measurement setup, the secondary electron signals of the Channeltron for high and low IR content are shown for both surfaces in Figure 8 for the XUV spectra shown in Figure 6c and Figure 7a. Since we use the same detection electronics as for time-of-flight spectroscopy, the secondary electron signal of the Channeltron is sampled with a 0.5 ns temporal resolution.
As it has been pointed out already, the peak of the XUV reflection extends from delays of 720 ns to 750 ns (i.e., the laser pulse is 720 ns delayed to the trigger signal obtained from the amplifier system). This is also the dominant part of the signal for both surfaces, with and without increased infrared leak light. However, for the increased infrared light, additional peaks can be observed in the time-resolved Channeltron signal. They appear mainly with an additional 60 ns delay in the range between 780 ns and 800 ns. The determination of their origin is not entirely clear because the diameter of the infrared beam is already several mm at the position of the Channeltron and therefore illuminates various parts of this compact measurement device, potentially causing noise in the measured signal. It also cannot entirely be excluded that the reflected IR signal ionizes impurities in the surrounding of the Channeltron, which causes the charged particle to be detected with some delay. Measurements without the XUV beam showed these peaks, too. Saturation effects of the detection electronics can therefore be excluded. Furthermore, almost no counts appear at a delay of 720 ns, which proves the solar blindness of the Channeltron. Whatever the exact origin of the additional delayed signal may be, due to the higher IR reflectivity of the uncoated surface, the number of counts for this surface is larger (Figure 8b) than that of the CsI-coated surface (Figure 8a). We have always observed the pronounced peak for different experimental conditions. In principle, it should be possible to quantify the IR content by measuring the ratio of the signals at the additional peak and compare it with the ratio at the main peak. In the case of the uncoated stainless steel surface (Figure 8b), the additional count rate from the increased IR signal is in the order of 1% of the total counts. This rather low change in count rate only allows for a qualitative statement, i.e., whether IR light is present or not. This is also in agreement with the evaluation presented in Figure 7d, where the ratio of the calculated and measured reflectivity is different. Whether this will be a positive or negative discrepancy between calculation and measurement depends on the geometry of the detection device, its electronic readout, the distance to the reflecting surface, and the divergence of the XUV and IR beam, respectively. For our temporally resolved measurement of the Channeltron signal, the XUV reflectivity ratio is decreased because the contribution between 780 ns and 800 ns is neglected and the XUV peak is increased by IR photons in the case where uncoated stainless steel have a higher IR reflectivity. Thus, its temporal resolved signal can be directly used for optimization of the spectral filtering and minimization of the IR leak light, respectively. In Figure 8b, we observe a substantial difference in count rate depending on the amount of IR leak light.

4. Conclusions and Outlook

In conclusion, our experiments showed that the XUV reflection from uncoated and CsI-coated metal surfaces can be used to measure the spectrally integrated reflectivity with electron or ion detectors for photon energies between 30 eV and 120 eV. Due to beneficial features, e.g., simplicity and small size, our experimental approach can be implemented in various experiments. Especially for XUV sources based on HHG, our measurement and evaluation routines offer access for the detection of unwanted infrared leak light from the fundamental laser.
Since our setup is based on XUV reflectivity, it can handle focused and unfocused beams. Therefore, it seems to be suited for checking focus regions as well as XUV beamlines. In contrast to conventional glancing incidence XUV optics, our approach is based on 45° reflectivity and can be easily modified to other angles to guide the XUV beam on a detector. This could pave the way towards building XUV diagnostics that are as simple as those for visible light, e.g., flip mirrors.

Acknowledgments

We thank Volker Hannen, Daniel Winzen, and Hans-Werner Ortjohann from University of Münster and Bettina Lommel from GSI Darmstadt for preparation of the samples. We thank Volker Hannen for scientific discussions. The Münster contributions were funded by the German Federal Ministry of Education and Research (BMBF) under contract number 05P15PMFAA. This work has been supported by the BMBF under contract number 05P15SJFFA.

Author Contributions

A.H. and C.S. conceived and designed the experiments; A.H., C.E., D.W., and T.K. performed the experiments. All authors analyzed the data and contributed to the completion of the manuscript.

Conflicts of Interest

The authors declare no conflict of interest. The founding sponsors had no role in the design of the study; in the collection, analyses, or interpretation of data; in the writing of the manuscript; or in the decision to publish the results.

References

  1. Zürch, M.; Foertsch, S.; Matzas, M.; Pachmann, K.; Kuth, R.; Spielmann, C. Cancer cell classification with coherent diffraction imaging using an extreme ultraviolet radiation source. J. Med. Imaging 2014, 1. [Google Scholar] [CrossRef] [PubMed]
  2. Miaja-Avila, L.; Lei, C.; Aeschlimann, M.; Gland, J.L.; Murnane, M.M.; Kapteyn, H.C.; Saathoff, G. Laser-assisted photoelectric effect from surfaces. Phys. Rev. Lett. 2006, 97. [Google Scholar] [CrossRef] [PubMed]
  3. Krausz, F.; Ivanov, M. Attosecond physics. Rev. Mod. Phys. 2009, 81, 163–234. [Google Scholar] [CrossRef]
  4. Serrat, C.; Roca, D.; Budesca, J.M.; Seres, J.; Seres, E.; Aurand, B.; Hoffmann, A.; Namba, S.; Kuehl, T.; Spielmann, C. Avalanche of stimulated forward scattering in high harmonic generation. Opt. Express 2016, 24, 8028–8044. [Google Scholar] [CrossRef] [PubMed]
  5. Zürch, M.; Rothhardt, J.; Hädrich, S.; Demmler, S.; Krebs, M.; Limpert, J.; Tünnermann, A.; Guggenmos, A.; Kleineberg, U.; Spielmann, C. Real-time and sub-wavelength ultrafast coherent diffraction imaging in the extreme ultraviolet. Sci. Rep. 2014, 4. [Google Scholar] [CrossRef] [PubMed]
  6. Seres, J.; Seres, E.; Landgraf, B.; Ecker, B.; Aurand, B.; Hoffmann, A.; Winkler, G.; Namba, S.; Kuehl, T.; Spielmann, C. Parametric amplification of attosecond pulse trains at 11 nm. Sci. Rep. 2014, 4. [Google Scholar] [CrossRef] [PubMed]
  7. Heyl, C.M.; Gudde, J.; L’Huillier, A.; Hofer, U. High-order harmonic generation with mu j laser pulses at high repetition rates. J. Phys. B At. Mol. Opt. Phys. 2012, 45. [Google Scholar] [CrossRef]
  8. Heyl, C.M.; Coudert-Alteirac, H.; Miranda, M.; Louisy, M.; Kovacs, K.; Tosa, V.; Balogh, E.; Varju, K.; L'Huillier, A.; Couairon, A.; et al. Scale-invariant nonlinear optics in gases. Optica 2016, 3, 75–81. [Google Scholar] [CrossRef]
  9. Peatross, J.; Chaloupka, J.L.; Meyerhofer, D.D. High-order harmonic generation with an annular laserbeam. Opt. Lett. 1994, 19, 942–944. [Google Scholar] [CrossRef] [PubMed]
  10. Falcone, R.W.; Bokor, J. Dichroic beam splitter for extreme-ultraviolet and visible radiation. Opt. Lett. 1983, 8, 21–23. [Google Scholar] [CrossRef] [PubMed]
  11. Zhang, Q.; Zhao, K.; Li, J.; Chini, M.; Cheng, Y.; Wu, Y.; Cunningham, E.; Chang, Z.H. Suppression of driving laser in high harmonic generation with a microchannel plate. Opt. Lett. 2014, 39, 3670–3673. [Google Scholar] [CrossRef] [PubMed]
  12. Kienberger, R.; Goulielmakis, E.; Uiberacker, M.; Baltuska, A.; Yakovlev, V.; Bammer, F.; Scrinzi, A.; Westerwalbesloh, T.; Kleineberg, U.; Heinzmann, U.; et al. Atomic transient recorder. Nature 2004, 427, 817–821. [Google Scholar] [CrossRef] [PubMed]
  13. Mengxi, W.; Shaohao, C.; Seth, C.; Kenneth, J.S.; Mette, B.G. Theory of strong-field attosecond transient absorption. J. Phys. B 2016, 49. [Google Scholar] [CrossRef]
  14. Schultze, M.; Wirth, A.; Grguras, I.; Uiberacker, M.; Uphues, T.; Verhoef, A.J.; Gagnon, J.; Hofstetter, M.; Kleineberg, U.; Goulielmakis, E.; et al. State-of-the-art attosecond metrology. J. Electron. Spectrosc. Relat. Phenom. 2011, 184, 68–77. [Google Scholar] [CrossRef]
  15. Itatani, J.; Quere, F.; Yudin, G.L.; Ivanov, M.Y.; Krausz, F.; Corkum, P.B. Attosecond streak camera. Phys. Rev. Lett. 2002, 88. [Google Scholar] [CrossRef] [PubMed]
  16. Wang, F.; He, L.X.; Zhai, C.Y.; Shi, W.J.; Zhang, Q.B.; Lan, P.F.; Lu, P.X. Time-dependent phase matching of high-order-harmonic generation. Phys. Rev. A 2015, 92. [Google Scholar] [CrossRef]
  17. Mashiko, H.; Suda, A.; Midorikawa, K. Focusing coherent soft-X-ray radiation to a micrometer spot size withan intensity of 1014 W/cm2. Opt. Lett. 2004, 29, 1927–1929. [Google Scholar] [CrossRef] [PubMed]
  18. Henke, B.L.; Gullikson, E.M.; Davis, J.C. X-ray interactions: Photoabsorption, scattering, transmission, and reflection at e = 50–30,000 ev, z = 1–92. At. Data Nucl. Data Tables 1993, 54, 181–342. [Google Scholar] [CrossRef]
  19. Samson, J.A.R. Photocathodes: Their efficiency and stability. Nucl. Instrum. Methods Phys. Res. 1984, 222, 215–220. [Google Scholar] [CrossRef]
  20. Hannen, V.; Anielski, D.; Geppert, C.; Jöhren, R.; Kühl, T.; Lochmann, M.; López-Coto, R.; Nörtershäuser, W.; Ortjohann, H.W.; Sánchez, R.; et al. Detection system for forward emitted photons at the experimental storage ring at GSI. J. Instrum. 2013, 8. [Google Scholar] [CrossRef]
  21. Winters, D.F.A.; Kühl, T.; Schneider, D.H.; Indelicato, P.; Reuschl, R.; Schuch, R.; Lindroth, E.; Stöhlker, T. Laser spectroscopy of the (1s22s2p) 3P03P1 level splitting in Be-like krypton. Phys. Scr. 2011, 2011. [Google Scholar] [CrossRef]
  22. Wen, W.Q.; Lochmann, M.; Ma, X.; Bussmann, M.; Winters, D.F.A.; Nortershauser, W.; Botermann, B.; Geppert, C.; Frommgen, N.; Hammen, M.; et al. Optical measurement of the longitudinal ion distribution of bunched ion beams in the ESR. Nucl. Instrum. Methods in Phys. Res. Sect. A 2013, 711, 90–95. [Google Scholar] [CrossRef]
  23. Hoffmann, A.; Zürch, M.; Spielmann, C. Extremely nonlinear optics using shaped pulses spectrally broadened in an argon- or sulfur hexafluoride-filled hollow-core fiber. Appl. Sci. 2015, 5, 1310–1322. [Google Scholar] [CrossRef]
  24. Pfeifer, T.; Spitzenpfeil, R.; Walter, D.; Winterfeldt, C.; Dimler, F.; Gerber, G.; Spielmann, C. Towards optimal control with shaped soft-X-ray light. Opt. Express 2007, 15, 3409–3416. [Google Scholar] [CrossRef] [PubMed]
  25. Paulus, A.; Winterfeldt, C.; Pfeifer, T.; Walter, D.; Gerber, G.; Spielmann, C. Novel time-of-flight electron spectrometer optimized for time-resolved soft-X-ray photoelectron spectroscopy. Rev. Sci. Instrum. 2006, 77. [Google Scholar] [CrossRef]
  26. Winterfeldt, C.; Spielmann, C.; Gerber, G. Colloquium: Optimal control of high-harmonic generation. Rev. Mod. Phys. 2008, 80, 117–140. [Google Scholar] [CrossRef]
  27. Rundquist, A.; Durfee, C.G.; Chang, Z.H.; Herne, C.; Backus, S.; Murnane, M.M.; Kapteyn, H.C. Phase-matched generation of coherent soft X-rays. Science 1998, 280, 1412–1415. [Google Scholar] [CrossRef] [PubMed]
  28. Pfeifer, T.; Walter, D.; Winterfeldt, C.; Spielmann, C.; Gerber, G. Controlling the spectral shape of coherent soft X-rays. Appl. Phys. B 2005, 80, 277–280. [Google Scholar] [CrossRef]
Figure 1. Principle scheme of pump-probe experiments with XUV (extreme ultraviolet) and IR (infrared) pulses. One part of a fs laser beam is focused into a noble gas for high-harmonic generation. Filtering of the fundamental laser beam is achieved by a metal foil filter that transmits a large amount of XUV radiation. Using, e.g., a toroidal mirror, the XUV beam can be focused to interact with atomic or molecular media. Electrons and ions created in the interaction region can be detected. When an IR beam is used for time-resolved measurements, a second metal foil filter must be used to protect the CCD (charge-coupled device) of the XUV spectrometer. In case filters are used before and behind the interaction region, there is an ambiguity about IR leak light due to imperfections of the first metal filter. Furthermore, characterization of the XUV focal spot size by fluorescence is also limited by the quality of IR filtering [17].
Applsci 07 00070 g001
Figure 2. (a) Calculated reflectivity values for iron, gold, silver, and cesium iodide for a 45° incidence angle and s-polarized light from [18]. To account for a broadband XUV source, the reflectivity values are folded with a Gaussian spectral distribution (standard deviation 3 eV) in the range from 40 eV to 110 eV with a step size of 2 eV (b) and the result for a spectrally integrating detector is depicted in (c). In (d), the ratio of the reflected XUV yield compared to cesium iodide is shown in a logarithmic scale.
Applsci 07 00070 g002
Figure 3. Characterization of different surfaces by a broadband XUV spectrum. An input XUV signal (a) is reflected from a surface (b) with either constant reflectivity (red curve) or decreasing reflectivity with increasing photon energy (blue curve). The corresponding XUV signal after reflection is shown spectrally resolved in (c) and spectrally integrated in (d). The ratio of the integrated signal of both surfaces is only determined by their reflectivity. The ratio between these two signals is then sensitive to a variation of the incident spectrum.
Applsci 07 00070 g003
Figure 4. After spectral broadening laser pulses are sent through a prism compressor with a computer-controlled deformable mirror for pulse-shaping. These pulses are focused into an argon-filled capillary for high-harmonic generation. The XUV pulses are separated from the fundamental laser by aluminum foils and are sent either to an XUV spectrometer or to a metal surface that reflects the beam onto a Channeltron.
Applsci 07 00070 g004
Figure 5. A typical HHG (high-harmonic generation) spectrum from a hollow-core fiber is shown in (a). By temporally shaping the driving laser pulse, a specified region of the XUV spectrum (blue area) can be enhanced (b) or suppression of harmonics (blue arrow) can be achieved (c).
Applsci 07 00070 g005
Figure 6. XUV spectra for three different pulse-shapes are shown in (ac). A comparison between calculations and measurements is depicted in (d) for the associated colored spectrum. Using the spectral shape and tabulated reflectivity values calculation of the estimated reflectivity ratio of uncoated and cesium iodide (CsI)-coated stainless steel is possible (dashed columns) and shows good agreement with the measurement (filled columns).
Applsci 07 00070 g006
Figure 7. XUV spectra for three different driving pulse-shapes are shown in (ac) with increased IR content (not visible in the spectra). A comparison between our calculations and our measurements is depicted in (d) for the associated colored spectrum. Using the spectral shape and tabulated reflectivity values calculation of the estimated reflectivity ratio of uncoated and CsI-coated stainless steel is possible (dashed columns) and shows obvious discrepancy compared to the measurement (filled columns). This is caused by IR leak light through the aluminum foil filter.
Applsci 07 00070 g007
Figure 8. Time-resolved secondary electron signal of the Channeltron for XUV light with residual (black symbols) and suppressed IR light (red symbols), respectively. (a) Due to the low IR reflectivity of CsI only a small additional peak is visible between 780 ns and 800 ns. In the presence of increased IR light, the total counts in this temporal window increase from 9 to 36, which is only ~10−4 of the total counts; (b) For the stainless steel surface, the IR reflectivity is higher. Therefore, the counts between 780 ns and 800 ns are more pronounced and increase from 1778 to 17,981, which is more than 1% of the total counts.
Applsci 07 00070 g008

