Comparative Research on RC Equivalent Circuit Models for Lithium-Ion Batteries of Electric Vehicles


1
National Center for Materials Service Safety, University of Science and Technology Beijing, Beijing 100083, China
2
School of Chemistry and Biological Engineering, University of Science and Technology Beijing, Beijing 100083, China
*
Author to whom correspondence should be addressed.
Appl. Sci. 2017, 7(10), 1002; https://doi.org/10.3390/app7101002
Submission received: 18 August 2017
/
Accepted: 25 September 2017
/
Published: 28 September 2017
(This article belongs to the Special Issue Battery Management and State Estimation)
Abstract
:Equivalent circuit models are a hot research topic in the field of lithium-ion batteries for electric vehicles, and scholars have proposed a variety of equivalent circuit models, from simple to complex. On one hand, a simple model cannot simulate the dynamic characteristics of batteries; on the other hand, it is difficult to apply a complex model to a real-time system. At present, there are few systematic comparative studies on equivalent circuit models of lithium-ion batteries. The representative first-order resistor-capacitor (RC) model and second-order RC model commonly used in the literature are studied comparatively in this paper. Firstly, the parameters of the two models are identified experimentally; secondly, the simulation model is built in Matlab/Simulink environment, and finally the output precision of these two models is verified by the actual data. The results show that in the constant current condition, the maximum error of the first-order RC model is 1.65% and the maximum error for the second-order RC model is 1.22%. In urban dynamometer driving schedule (UDDS) condition, the maximum error of the first-order RC model is 1.88%, and for the second-order RC model the maximum error is 1.69%. This is of great instructional significance to the application in practical battery management systems for the equivalent circuit model of lithium-ion batteries of electric vehicles.
1. Introduction
Lithium-ion batteries have many advantages, such as high working voltage, small volume, light weight, long cycle life, environmental friendliness, weak memory effect, wide working temperature range, low self-discharge rate, and so on [1,2,3,4]. Lithium-ion batteries have been widely used in mobile phones, digital cameras, laptops, other portable consumer electronics, and renewable energy storage [5,6]. With the continuous development and improvement of science and technology, the application range of lithium-ion batteries has further widened to the electric power, aerospace, military, and other critical fields [7,8]. Lithium-ion batteries have become core components of energy supply for many critical devices or systems, and are often critical to the reliability and functionality of the overall system [3,8]. However, consequences of battery failure could range from inconvenience to catastrophic failure; for example, NASA’s Mars Global Surveyor stopped running due to battery failure in November 2006. The reliability of lithium-ion battery systems has yet to be improved. Recently, lithium-ion batteries have reached a degree of implementation that enabled their use in stringent automotive applications; for example, the Nissan LEAF rolled off the assembly line in 2010 as well as the Tesla Roadster in 2008 [9]. Automotive lithium-ion batteries usually consist of hundreds or even thousands of single cells connected in series and parallel so they have high power and energy density coupled with such problems as safety, reliability, and uniformity. At present, an efficient and reliable battery management system (BMS) has become the key to guaranteeing the reliable and safe operation of lithium-ion batteries [10,11]; there are many aspects to the process of developing a battery management system, such as requirement analysis, modeling and simulation, control strategy research, and on-line hardware test, which all need a capable model to identify the characteristics of the lithium-ion batteries.
In order to predict the behavior of the battery, many different models have been established, which can be generally divided into two categories: electrochemical models and equivalent circuit models. Although the electrochemical model accounts for the main underlying physics in the battery dynamics in terms of the main electrochemical parameters and variables [12,13], the on-site accuracy is not high when it is applied in vehicle control systems due to the complexity of the model, and a large number of design and electrochemical kinetic parameters need to be obtained first. Therefore, the electrochemical mechanism model is usually used to understand the reaction process inside the battery, and to guide the design and manufacture of the battery. In an equivalent circuit model (ECM), resistances, capacitances, and voltage sources are used to describe charging and discharging processes, and the model is built in frequency- or time-domain [14,15], in which each component has clear physical meaning, simple mathematical expressions, is more intuitive, and is easy to handle. It has been widely applied in the estimation of the state-of-charge (SOC), the state-of-health (SOH) and the state-of-function (SOF) for lithium-ion batteries. The literature [16] based on the first-order RC (resistor-capacitor) model of lithium-ion battery short-circuit detection was explored. The literature [17] used a first-order RC equivalent circuit model to estimate the resistance of lithium-ion batteries and the open circuit voltage. Reference [18] used the first-order RC equivalent circuit model for the modeling and simulation of lithium-ion battery packs. A first-order RC equivalent circuit model was created and validated for a particular battery using a MATLAB (the MathWork, Inc., Natick, MA, USA) Simulink in terms of the internal temperature distribution, the open circuit voltage, the heat generation, and the internal resistance in References [19,20]. A SOC estimation method based on the first-order RC equivalent circuit model of lithium-ion batteries was studied in [21,22,23]. The studies in [24,25,26] explored a SOC estimation method based on the second-order RC equivalent circuit model of lithium-ion batteries. References [26,27,28] studied SOH estimation based on second-order RC equivalent circuit models of a lithium-ion battery. Additionally, Reference [29] used the equivalent circuit model of a second-order RC model for lithium-ion battery modeling. It can be seen that the SOC and SOH estimation algorithms based on the equivalent circuit model are the most important class of estimation algorithms in battery management systems. Many scholars have proposed a variety of equivalent circuit models, from simple to complex. However, there are few systematic comparative studies on equivalent circuit models of lithium-ion batteries, and simple models are not able to adequately simulate dynamic characteristics of batteries, while it is difficult to apply complex ones to real-time systems. The choice between these models is a trade-off among modeling complexity, precision, and computational cost. Therefore, the first-order RC model and the second-order RC model commonly used in the literature are studied comparatively in this paper because of their simplicity and relative accuracy. In this paper, firstly, the parameters of the above two models are identified by experimental methods individually, and then the simulation models are built in the Matlab/Simulink environment, and finally the precision of results for the two models is verified and discussed comparatively with the actual data.
2. Experiments and Methods
2.1. ECM for Lithium-Ion Batteries
Equivalent circuit models use a circuit consisting of voltage sources, resistors, and capacitors to simulate the dynamic characteristics of batteries [14,15], thus describing the relationship between voltage and current shown in the battery operation. In this paper, a first-order RC model and a second-order RC model are comparatively researched, as they refer mostly to the equivalent circuit models used in the literature. On one hand, the two kinds of models do a good job of reflecting the dynamic and static characteristics of lithium-ion batteries, and on the other hand the complexity of the models is also appropriate, easy to implement in engineering, and it is easy to implement parameter identification with high precision.
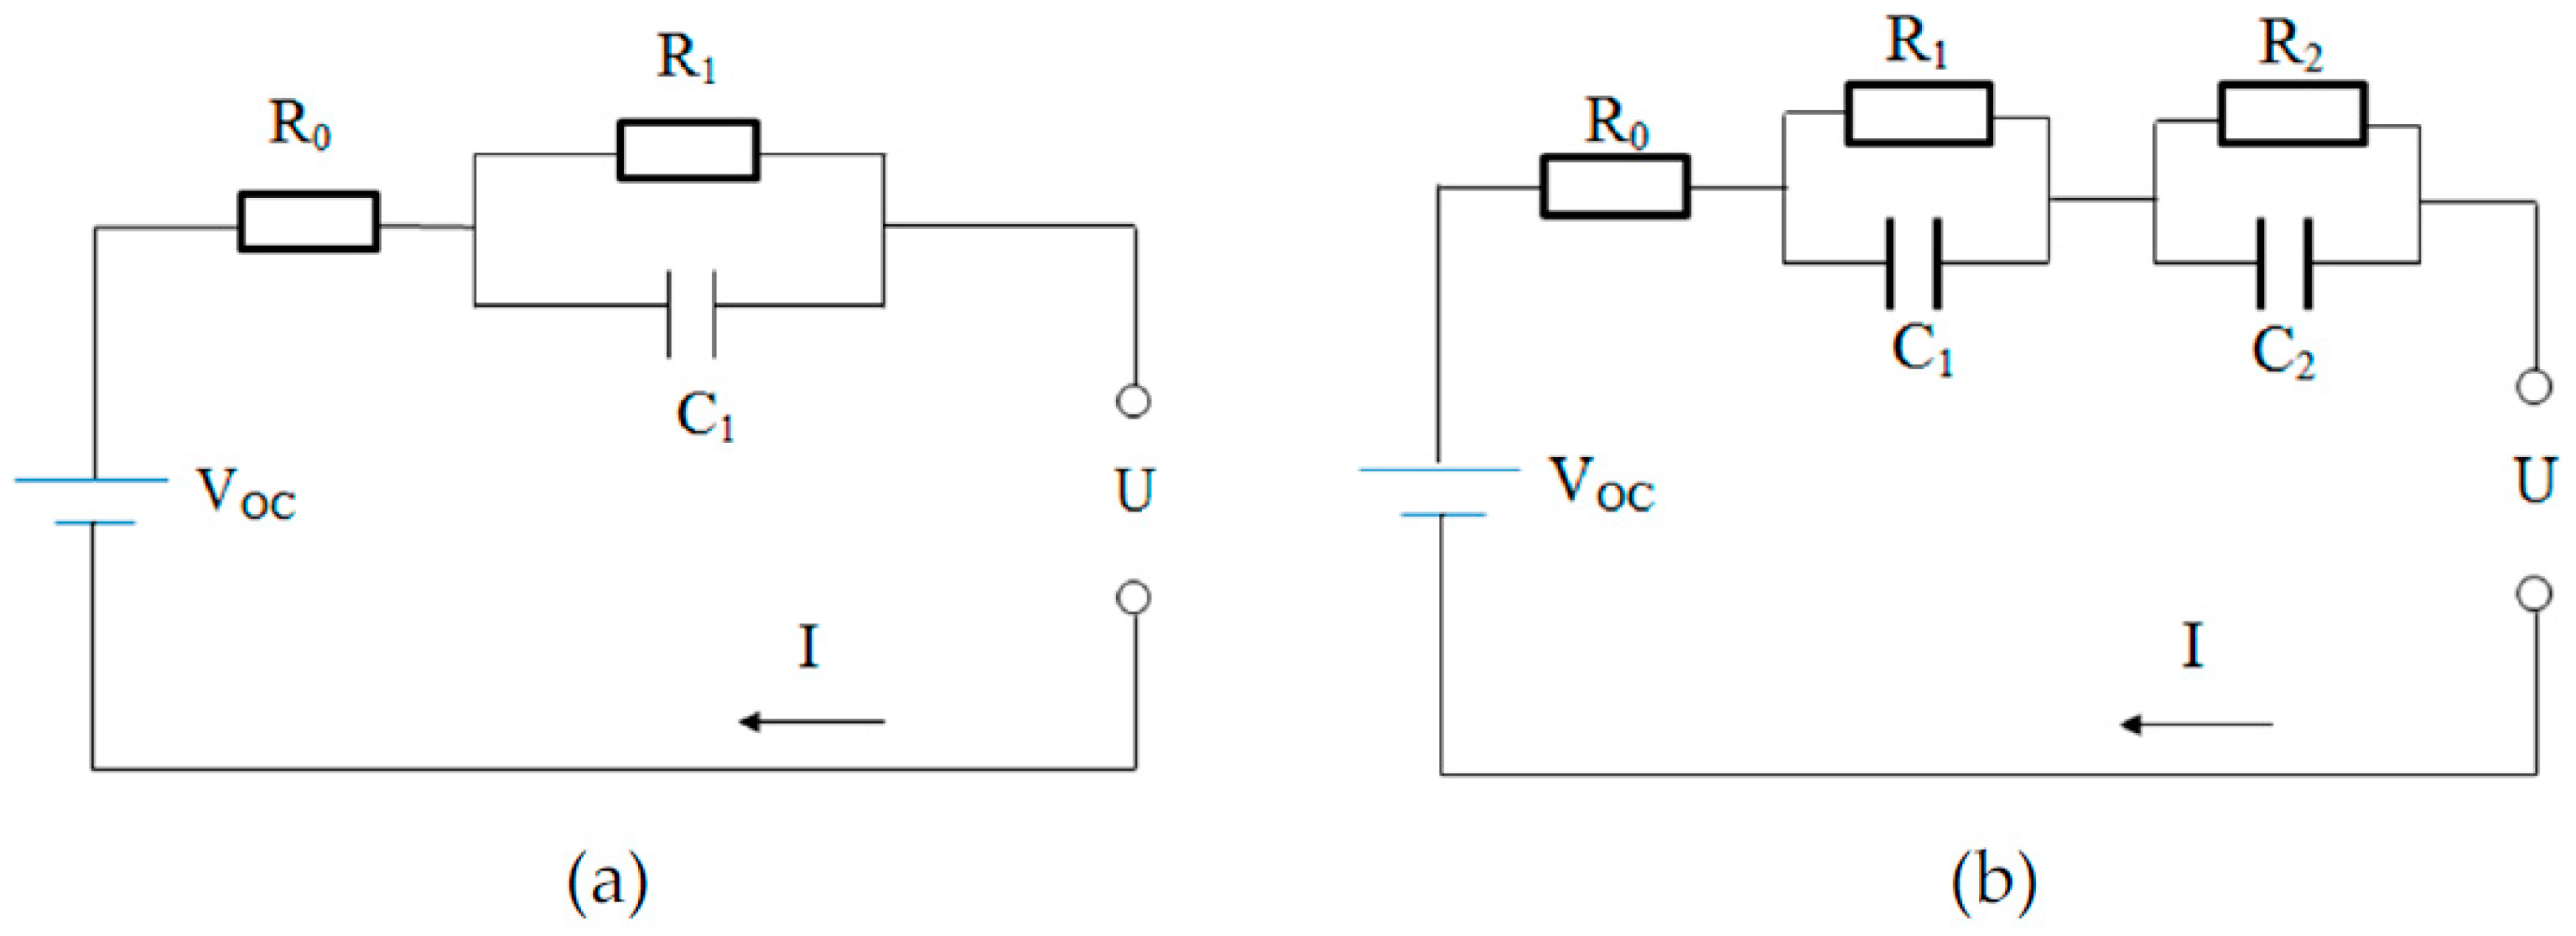
A schematic diagram of the first-order RC model is shown in Figure 1a, where the controllable voltage VOC denotes the open circuit voltage of the lithium-ion battery which usually varies nonlinearly with SOC, R0 denotes the ohmic resistance of the lithium-ion battery which describes the electrolyte resistance and connection resistance of the battery, R1 denotes the polarization resistance, C1 denotes polarization capacitance, I denotes the current flowing through the load which can be directly measured from current sensor, and U denotes the terminal voltage of the battery which can be directly measured from a voltage sensor. The parallel RC network describes the nonlinear polarization response of the lithium-ion battery, and I is positive for discharging and negative for charging.
The schematic diagram of the second-order RC model is shown in Figure 1b, where VOC, R0, I, and U have the same meanings as in the first-order RC model, except that there are two parallel RC networks to describe the nonlinear polarization response of the lithium-ion battery.
2.2. Battery Testing Bench
To complete the model parameter identification, the testing bench shown in Figure 2 was established. It is composed of a NEWARE (the NEWARE Co., Limited, Shenzhen, China) battery tester system 4000 (BTS4000) with eight independent channels, an intermediate machine, and a host computer on which NEWARE BTS Software v7.5.6 and MATLAB R2010a are installed.
The battery tester is used to load the programmed current profiles on the battery cells within a range of voltage 0–10 V and current −6 to 6 A, and the measuring errors of its voltage and current sensors are both less than 0.5%. The intermediate machine is mainly responsible for the network connection, receiving the control command from the host computer, controlling the lower battery cycler, and uploading the real-time test data. The host computer is employed to control and monitor the cycler via Ethernet cables, as well as to store the voltage and current acquired by the sensors. The tested battery cells are representative 18650 cylindrical cells whose specifications mainly include 2350 mAh nominal capacity, 3.7 V operating voltage, 4.2 V charging limit voltage, 2.7 V discharge limit voltage, and 10 A maximum continuous discharging current. During the test, the battery current and the voltage were recorded every second, while they were recorded every 100 milliseconds during the hybrid pulse power characterization (HPPC) test. The important parameters of the experiment are summarized in Table 1.
2.3. Model Parameter Identification
2.3.1. Open Circuit Voltage
The open circuit voltage (OCV) of the battery is the stable voltage value of the battery when the battery is left in the open circuit condition [11]. Regarding the battery after being charged, the battery terminal voltage will gradually decline to a stable value when it is left in the open circuit condition; regarding the battery after discharge, the battery terminal voltage will gradually rise to a stable value after the load is removed. The electromotive force of the battery is basically equal to the open circuit voltage of the battery, while the battery electromotive force is one of the metrics used to measure the amount of energy stored in the battery. Thus, there is a certain relationship between the battery OCV and the battery SOC [22]. There are a few ways to obtain OCV, in which the stationary method is a direct method and is relatively more accurate. To obtain the relationship between the battery OCV and SOC in the stationary method, the test procedures are performed as follows [30]:
- (1)
- Calibrate the battery capacity. The battery is fully charged with the standard charging method, in which the battery is charged using a constant current phase of 2.35 A (1C) to 4.2 V followed by a constant voltage phase of 4.2 V until the current is reduced to 0.02 A. Then, the battery is discharged with a constant current phase of 2.35 A to its discharge cut-off voltage 2.7 V. The experiment is repeated until the difference between the discharge capacity of each measurement does not exceed 2%, and then the measured capacity is deemed to be the actual capacity of the battery.
- (2)
- The battery is fully charged with the standard charging method described by Step (1) and then the battery is left in the open-circuit condition to rest for 4 h to achieve electrochemical and heat equilibrium [9].
- (3)
- The battery is discharged with a constant current 2.35 A for 6 minutes (i.e., discharging by 10% of the capacity) and then the battery is left in the open-circuit condition to rest for 4 h to achieve electrochemical and heat equilibrium.
- (4)
- Step (3) is repeated eight times.
- (5)
- The battery is discharged with a constant current 2.35 A by 3 min (i.e., discharging by 10% of the capacity) and then the battery is left in the open-circuit condition for 4 h to achieve electrochemical and heat equilibrium.
- (6)
- Step (5) is repeated four times.
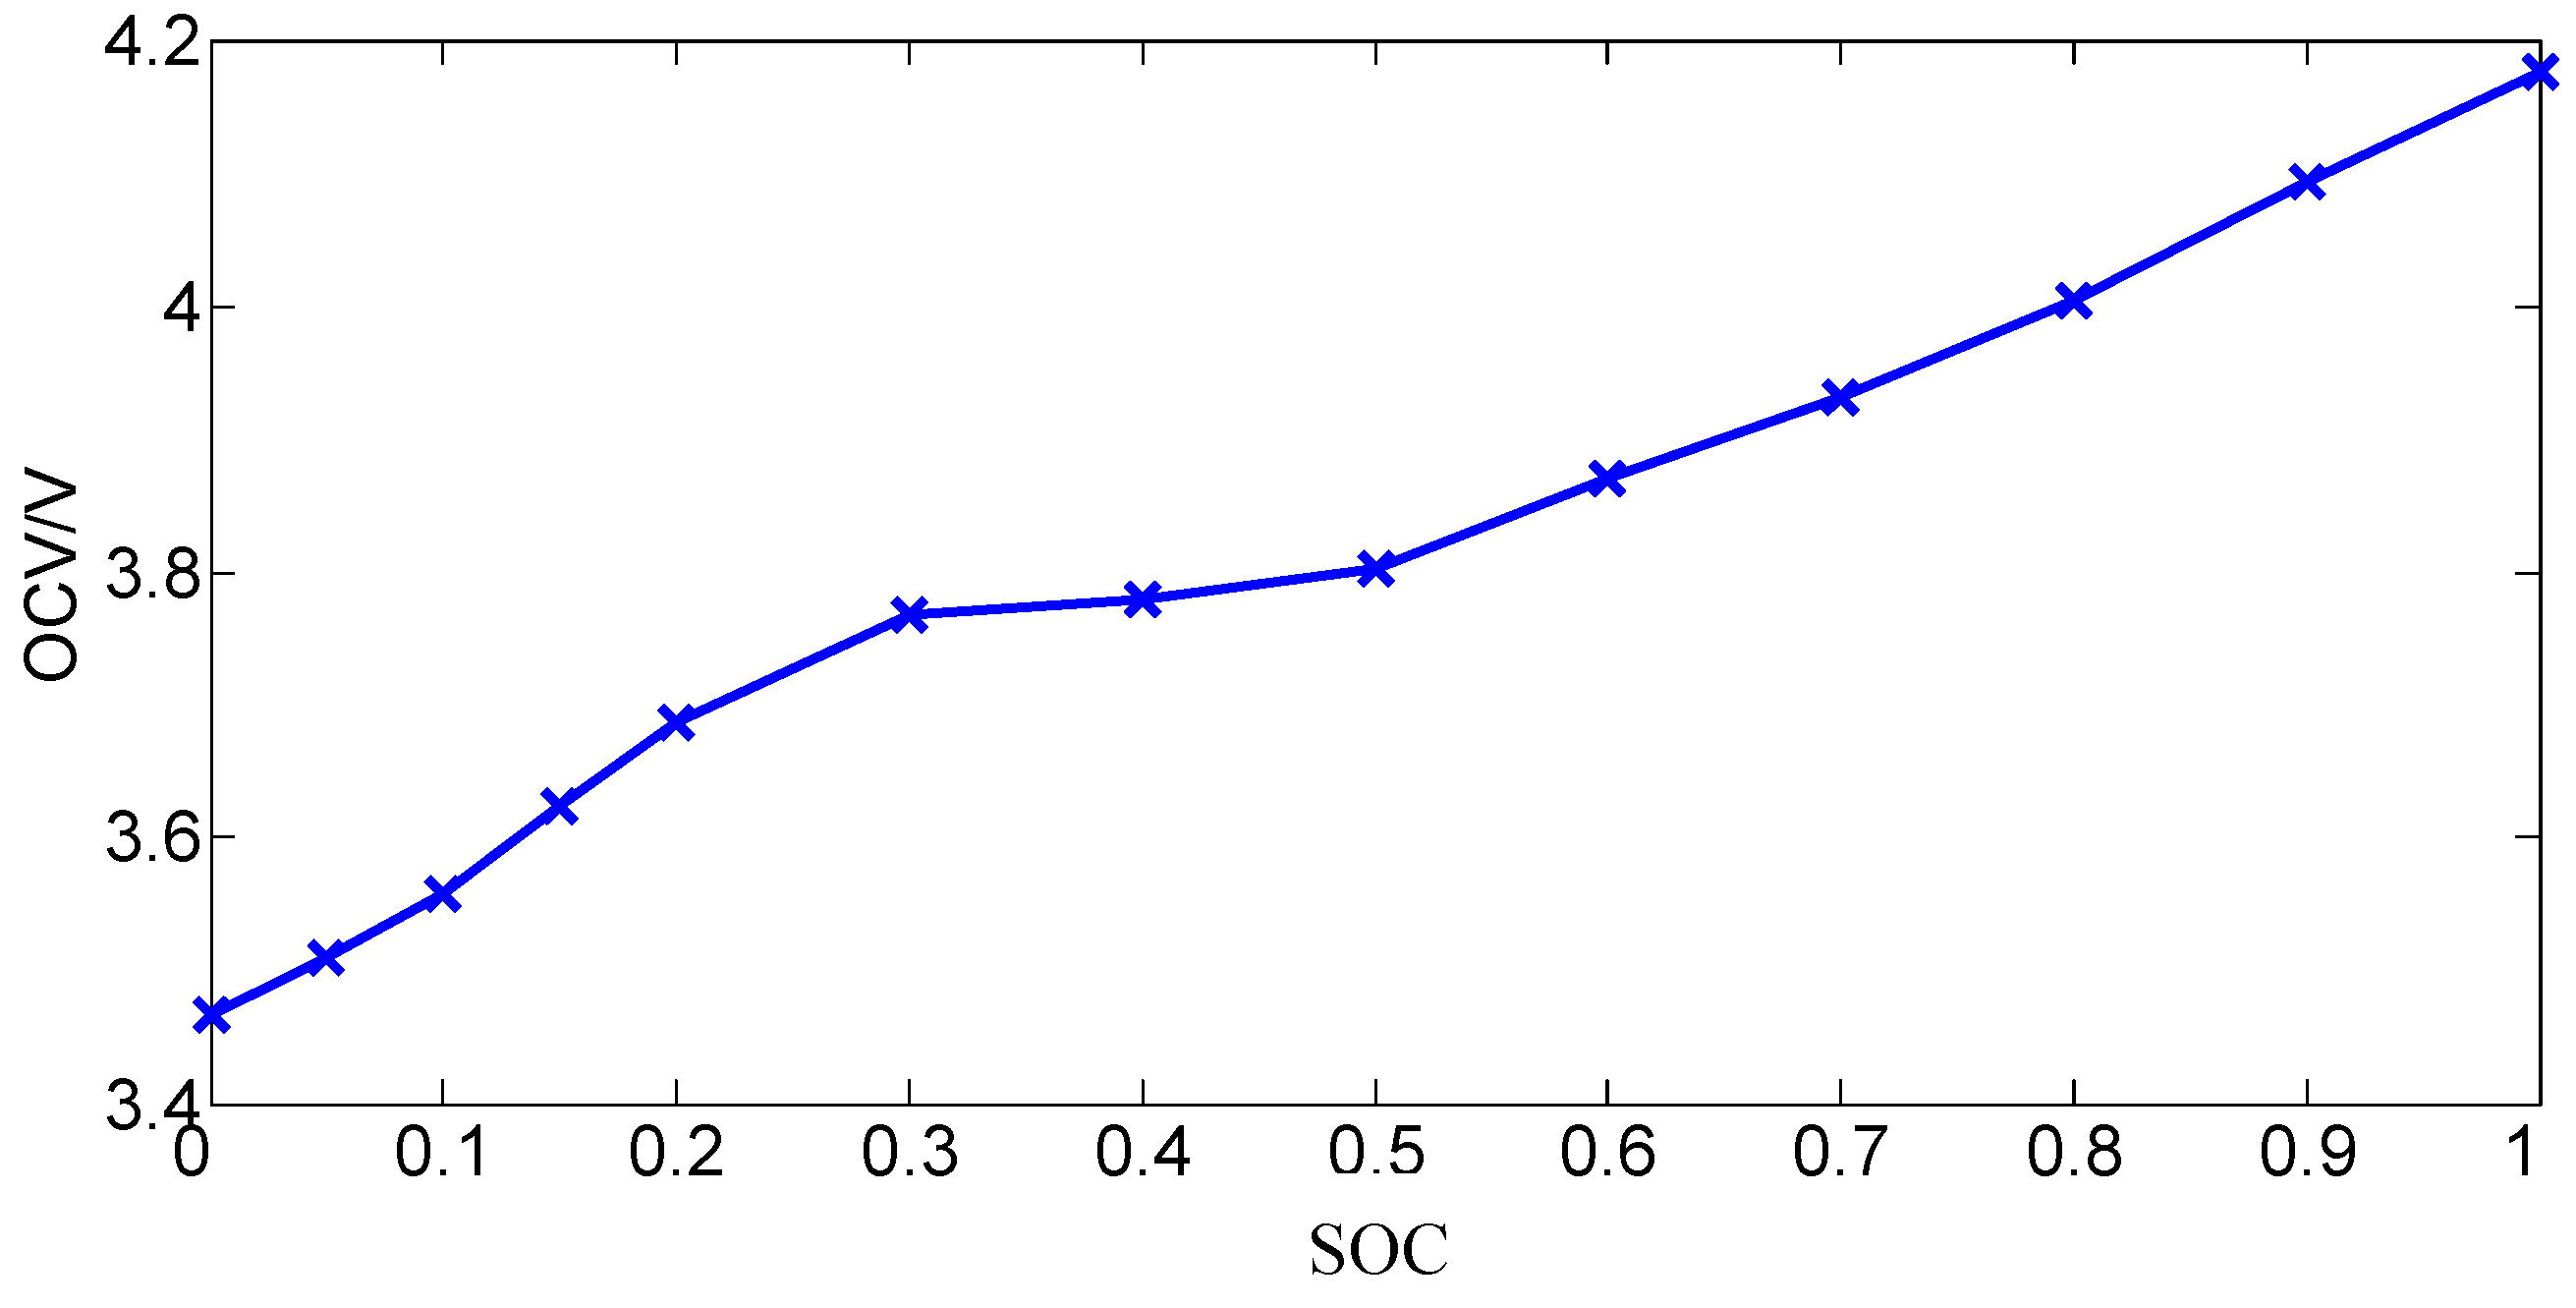
In the tests, the measured voltages at the end of each standby stage are regarded as the final open-circuit voltage. The variation of OCV with SOC obtained by the experimental method above is shown in Figure 3.
2.3.2. Ohmic Resistance
In general, the methods used to measure the battery resistance are the power-off method, the step method, and the electrochemical impedance spectroscopy (EIS) method. With the EIS method, the battery is excited by a series of alternating current (AC) signals of different frequency and then through analyzing the relation between the input excitation signal and the battery voltage output response, and the battery impedance characteristic can be obtained. The principle of the power-off method and the step method is similar, in which the difference between ohm polarization response time and other polarization response time is utilized to identify the different impedance. When the current has a sudden change, the voltage drop part caused by ohmic polarization changes instantaneously and then the voltage drop part by other polarization completes the transient process with the approximation exponential until the voltage returns to a steady-state voltage value. Assuming that the voltage before the current changes is U0 and the voltage after the moment the current changes is U1, the formula for calculating the ohmic resistance is as follows:
Referring to the “Freedom CAR Battery Test Manual” hybrid pulse power characterization test (HPPC test) [31], this paper adopts the step method to obtain the ohmic resistance, the polarization resistance, and polarization capacitance from the different SOCs. The hybrid pulse power characterization test profile is shown in Figure 4.
To obtain the battery ohmic resistance, polarization resistance, and polarization capacitance at the different SOCs, tests are performed as follows:
- (1)
- Calibrate the battery capacity as described in Section 2.3.1.
- (2)
- Charge the battery fully with the standard charging method the same as described in Section 2.2.
- (3)
- The HPPC test is performed and then the battery is left in the open-circuit condition to rest for 4 h to achieve electrochemical and heat equilibrium [9].
- (4)
- The battery is discharged with a constant current 2.35 A for 6 minutes and then the battery is left in the open-circuit condition to rest for 4 h to achieve electrochemical and heat equilibrium.
- (5)
- Steps (3) and (4) are respectively repeated eight times alternately.
- (6)
- The battery is discharged with a constant current 2.35 A for 3 min and then the battery is left in the open-circuit condition to rest for 4 h to achieve electrochemical and heat equilibrium.
- (7)
- The HPPC test is performed and then the battery is left in the open-circuit condition to rest for 4 h to achieve electrochemical and heat equilibrium.
- (8)
- Steps (6) and (7) are respectively repeated four times alternately.
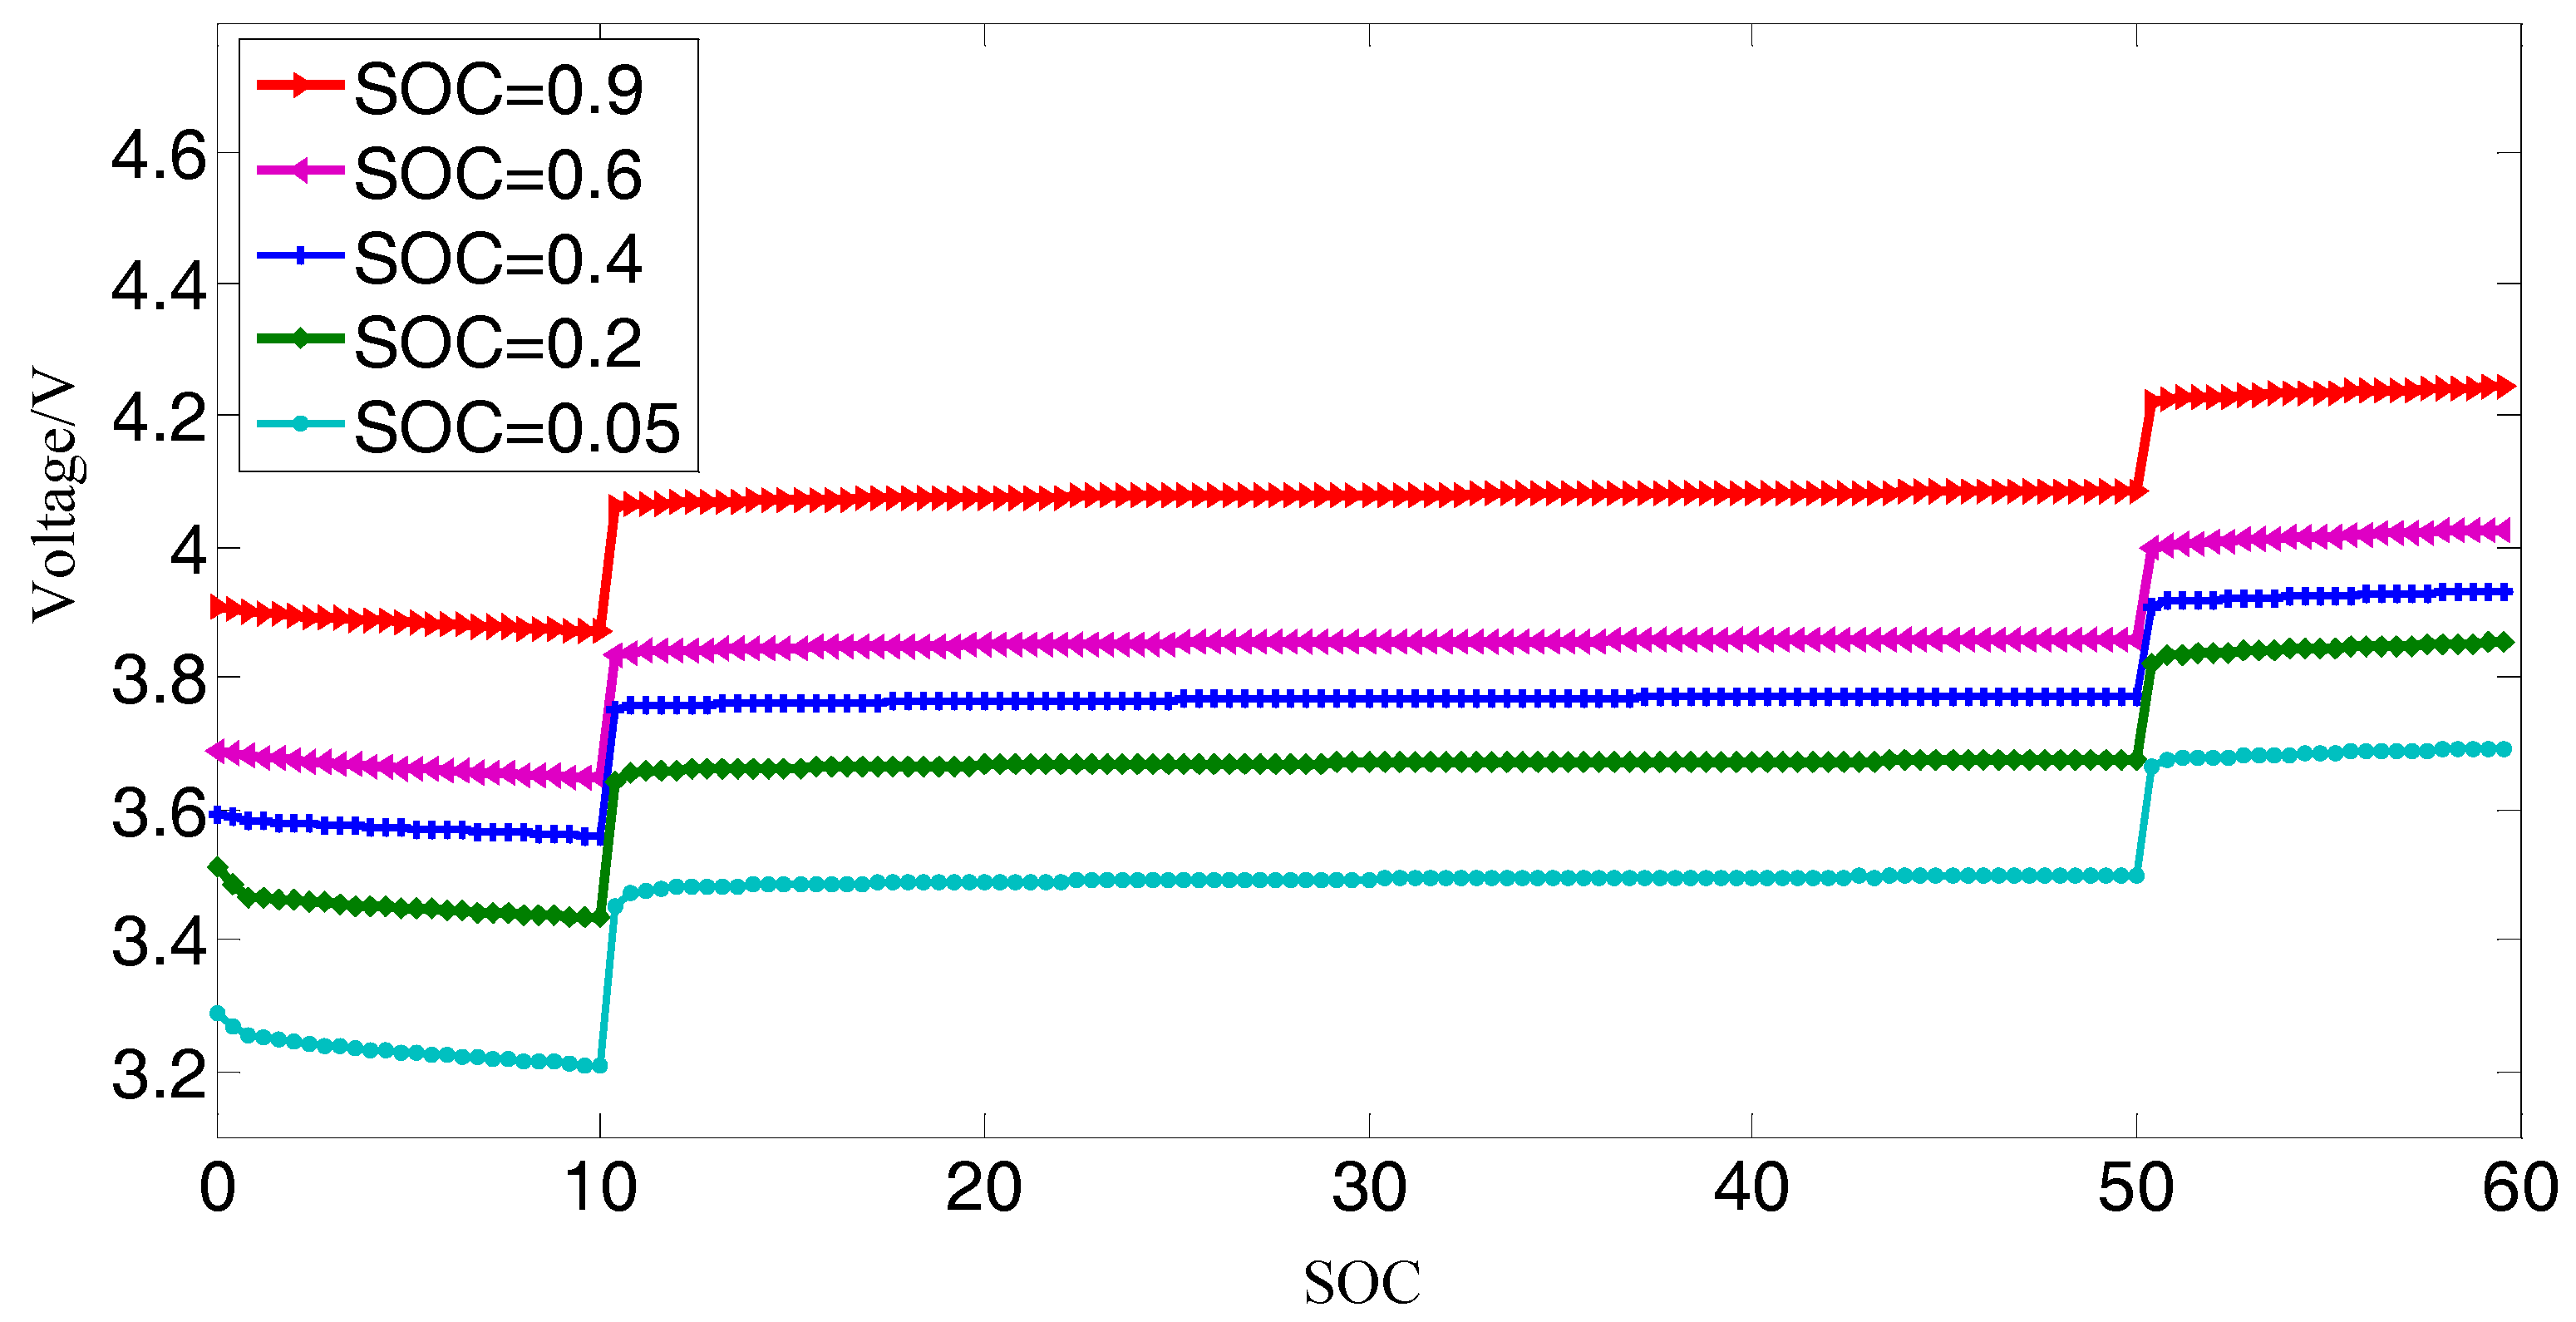
From the above experimental steps, it can be seen that the HPPC test can be implemented along with the open circuit voltage test described by Section 2.3.1. According to the above experimental procedures, the voltage response curves of lithium-ion battery excited by HPPC test at different SOC can be obtained. The results are shown in Figure 5. Then, the ohmic resistance at different SOCs can be obtained by calculating Equation (1). The results are shown in Figure 6.
2.3.3. Polarization Resistance and Polarization Capacitance
As discussed in Section 2.3.2, for the polarization process the terminal voltage completes the transient process in an exponential way approximately when the current sees a sudden change. According to the Kirchhoff laws, for the first-order RC model the variation law of the terminal voltage can be ruled by the following formula:
where represents the time constant.
Replacing the coefficients of Equation (2) and rewriting the form as:
Compared to the two formulas above, the parameter values can be obtained as follows:
According to the method described above, the polarization resistance and polarization capacitance of the first-order RC model can be obtained by the least square method as shown in Table 2.
Similarly, for the second-order RC model, the variation law of the terminal voltage can be ruled by the following equation:
where represent the time constant.
Replacing the coefficients of Equation (6) and rewriting the equation as:
Compared to coefficients of the two equations above, the parameter values can be obtained as follows:
According to the method described above, then the polarization resistance and polarization capacitance of the second-order RC model can be obtained by the least square method as shown in Table 3.
3. Model Simulation
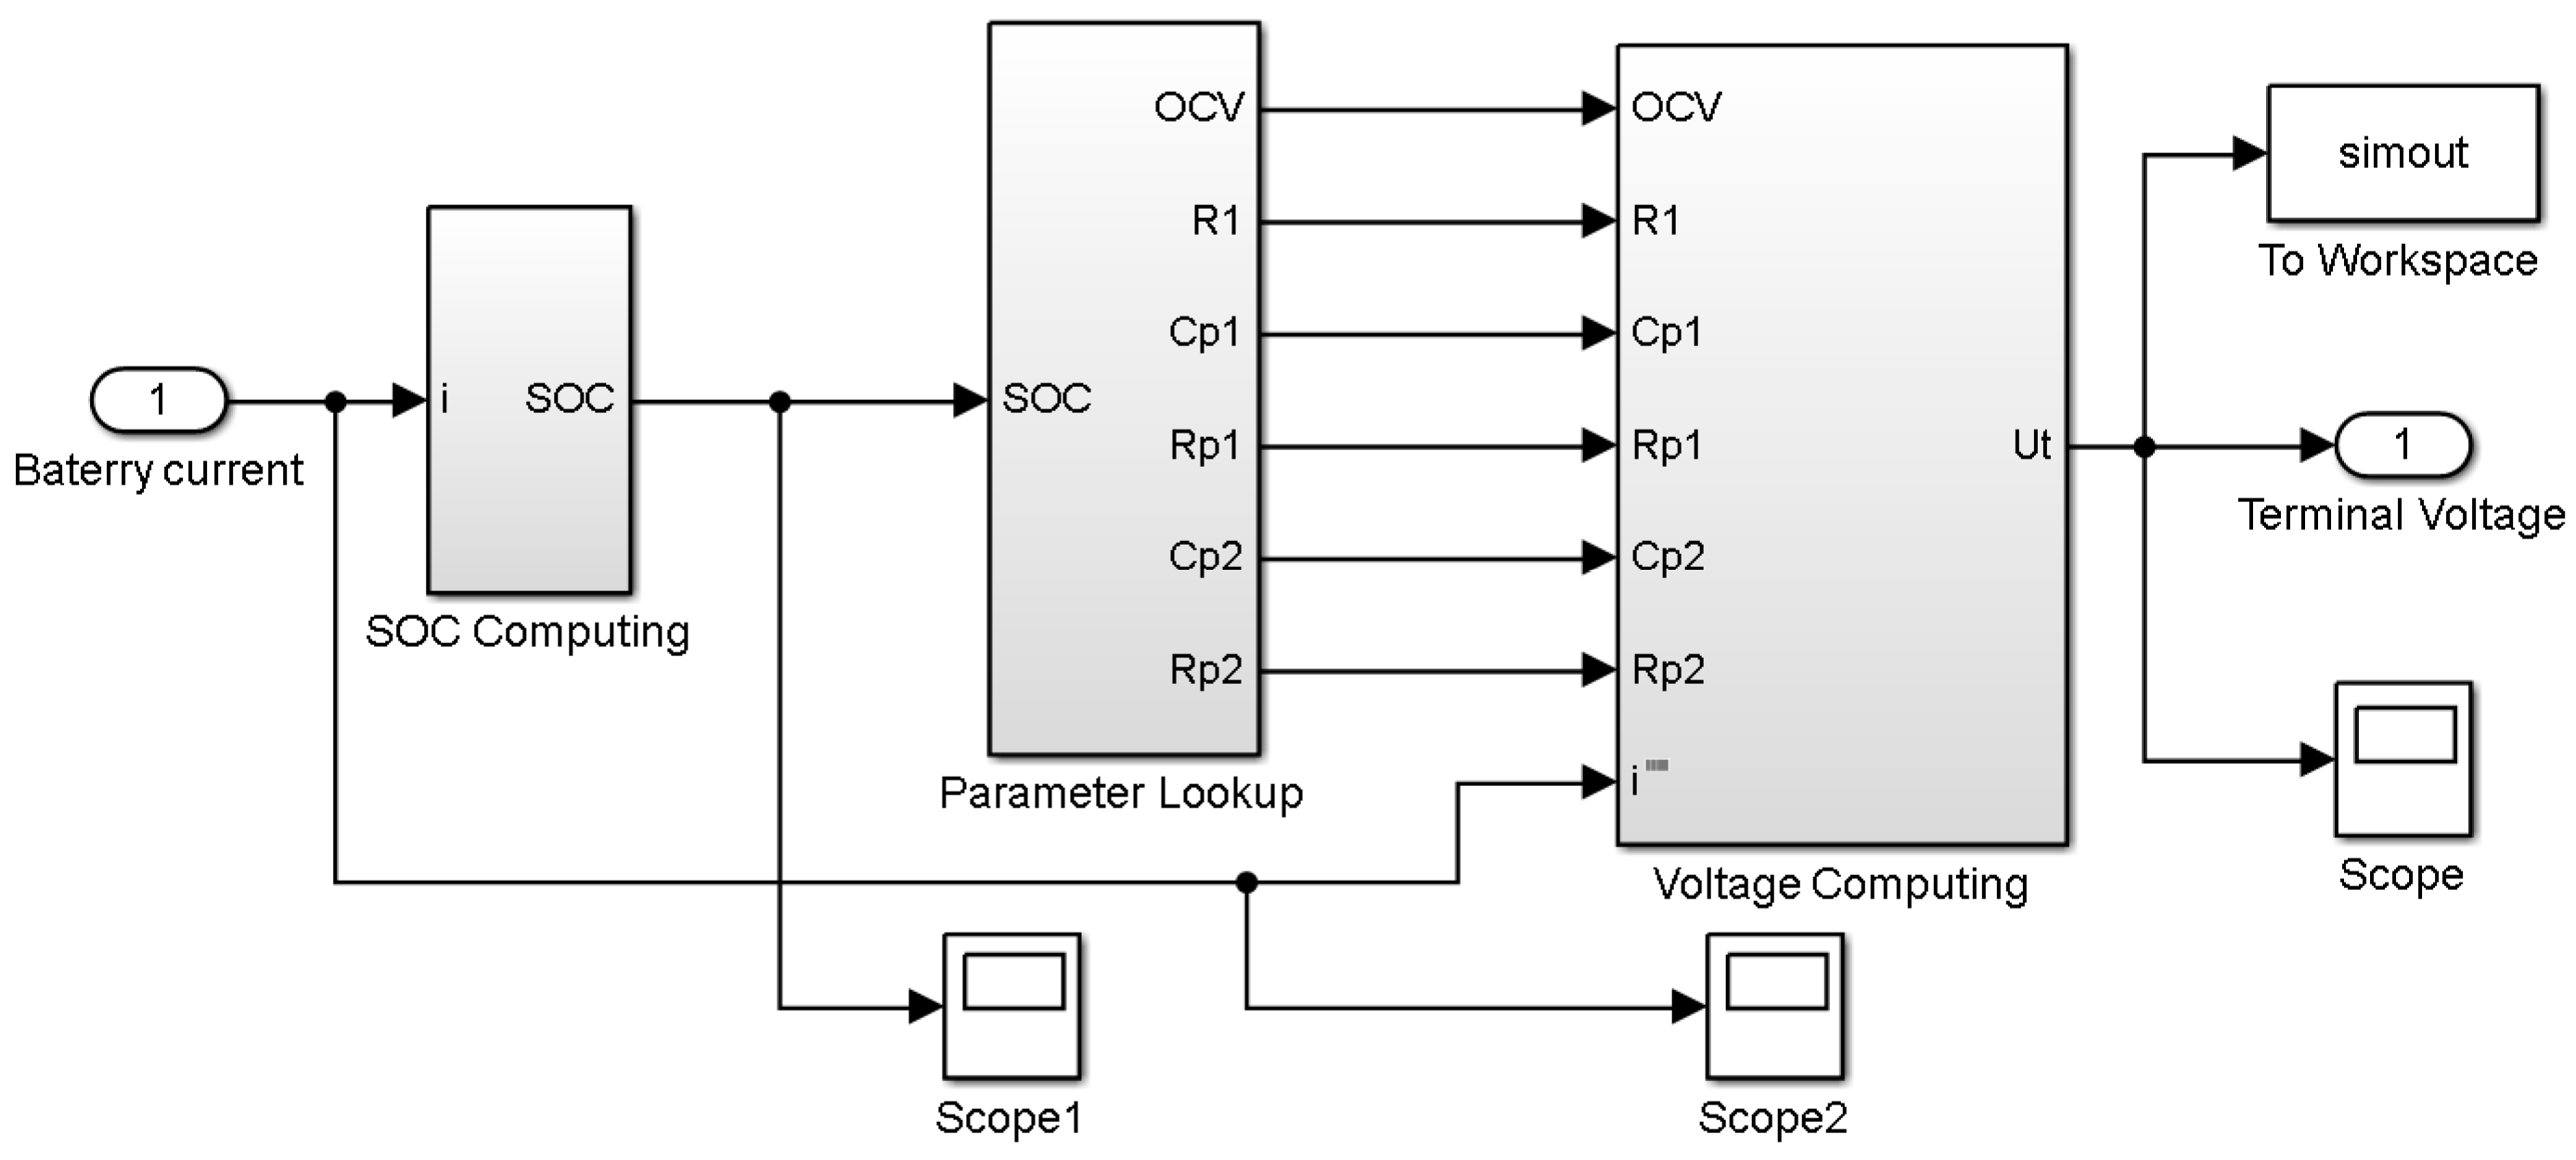
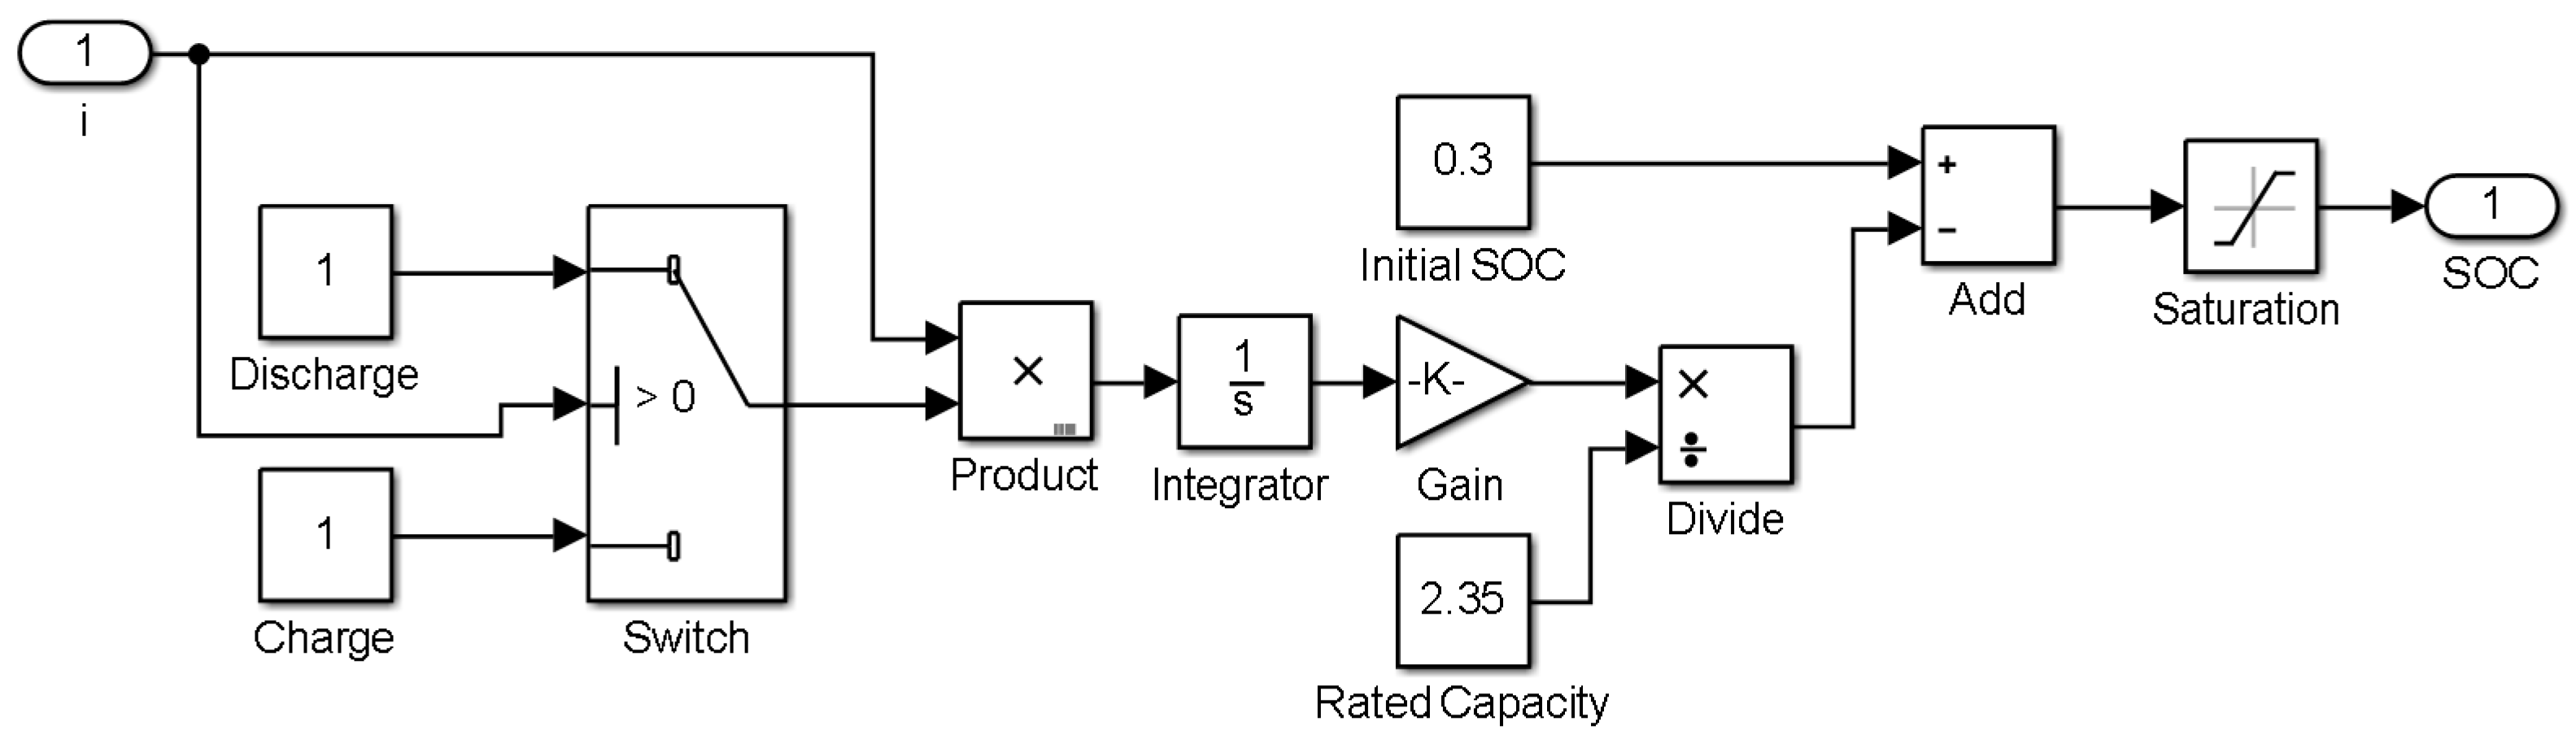
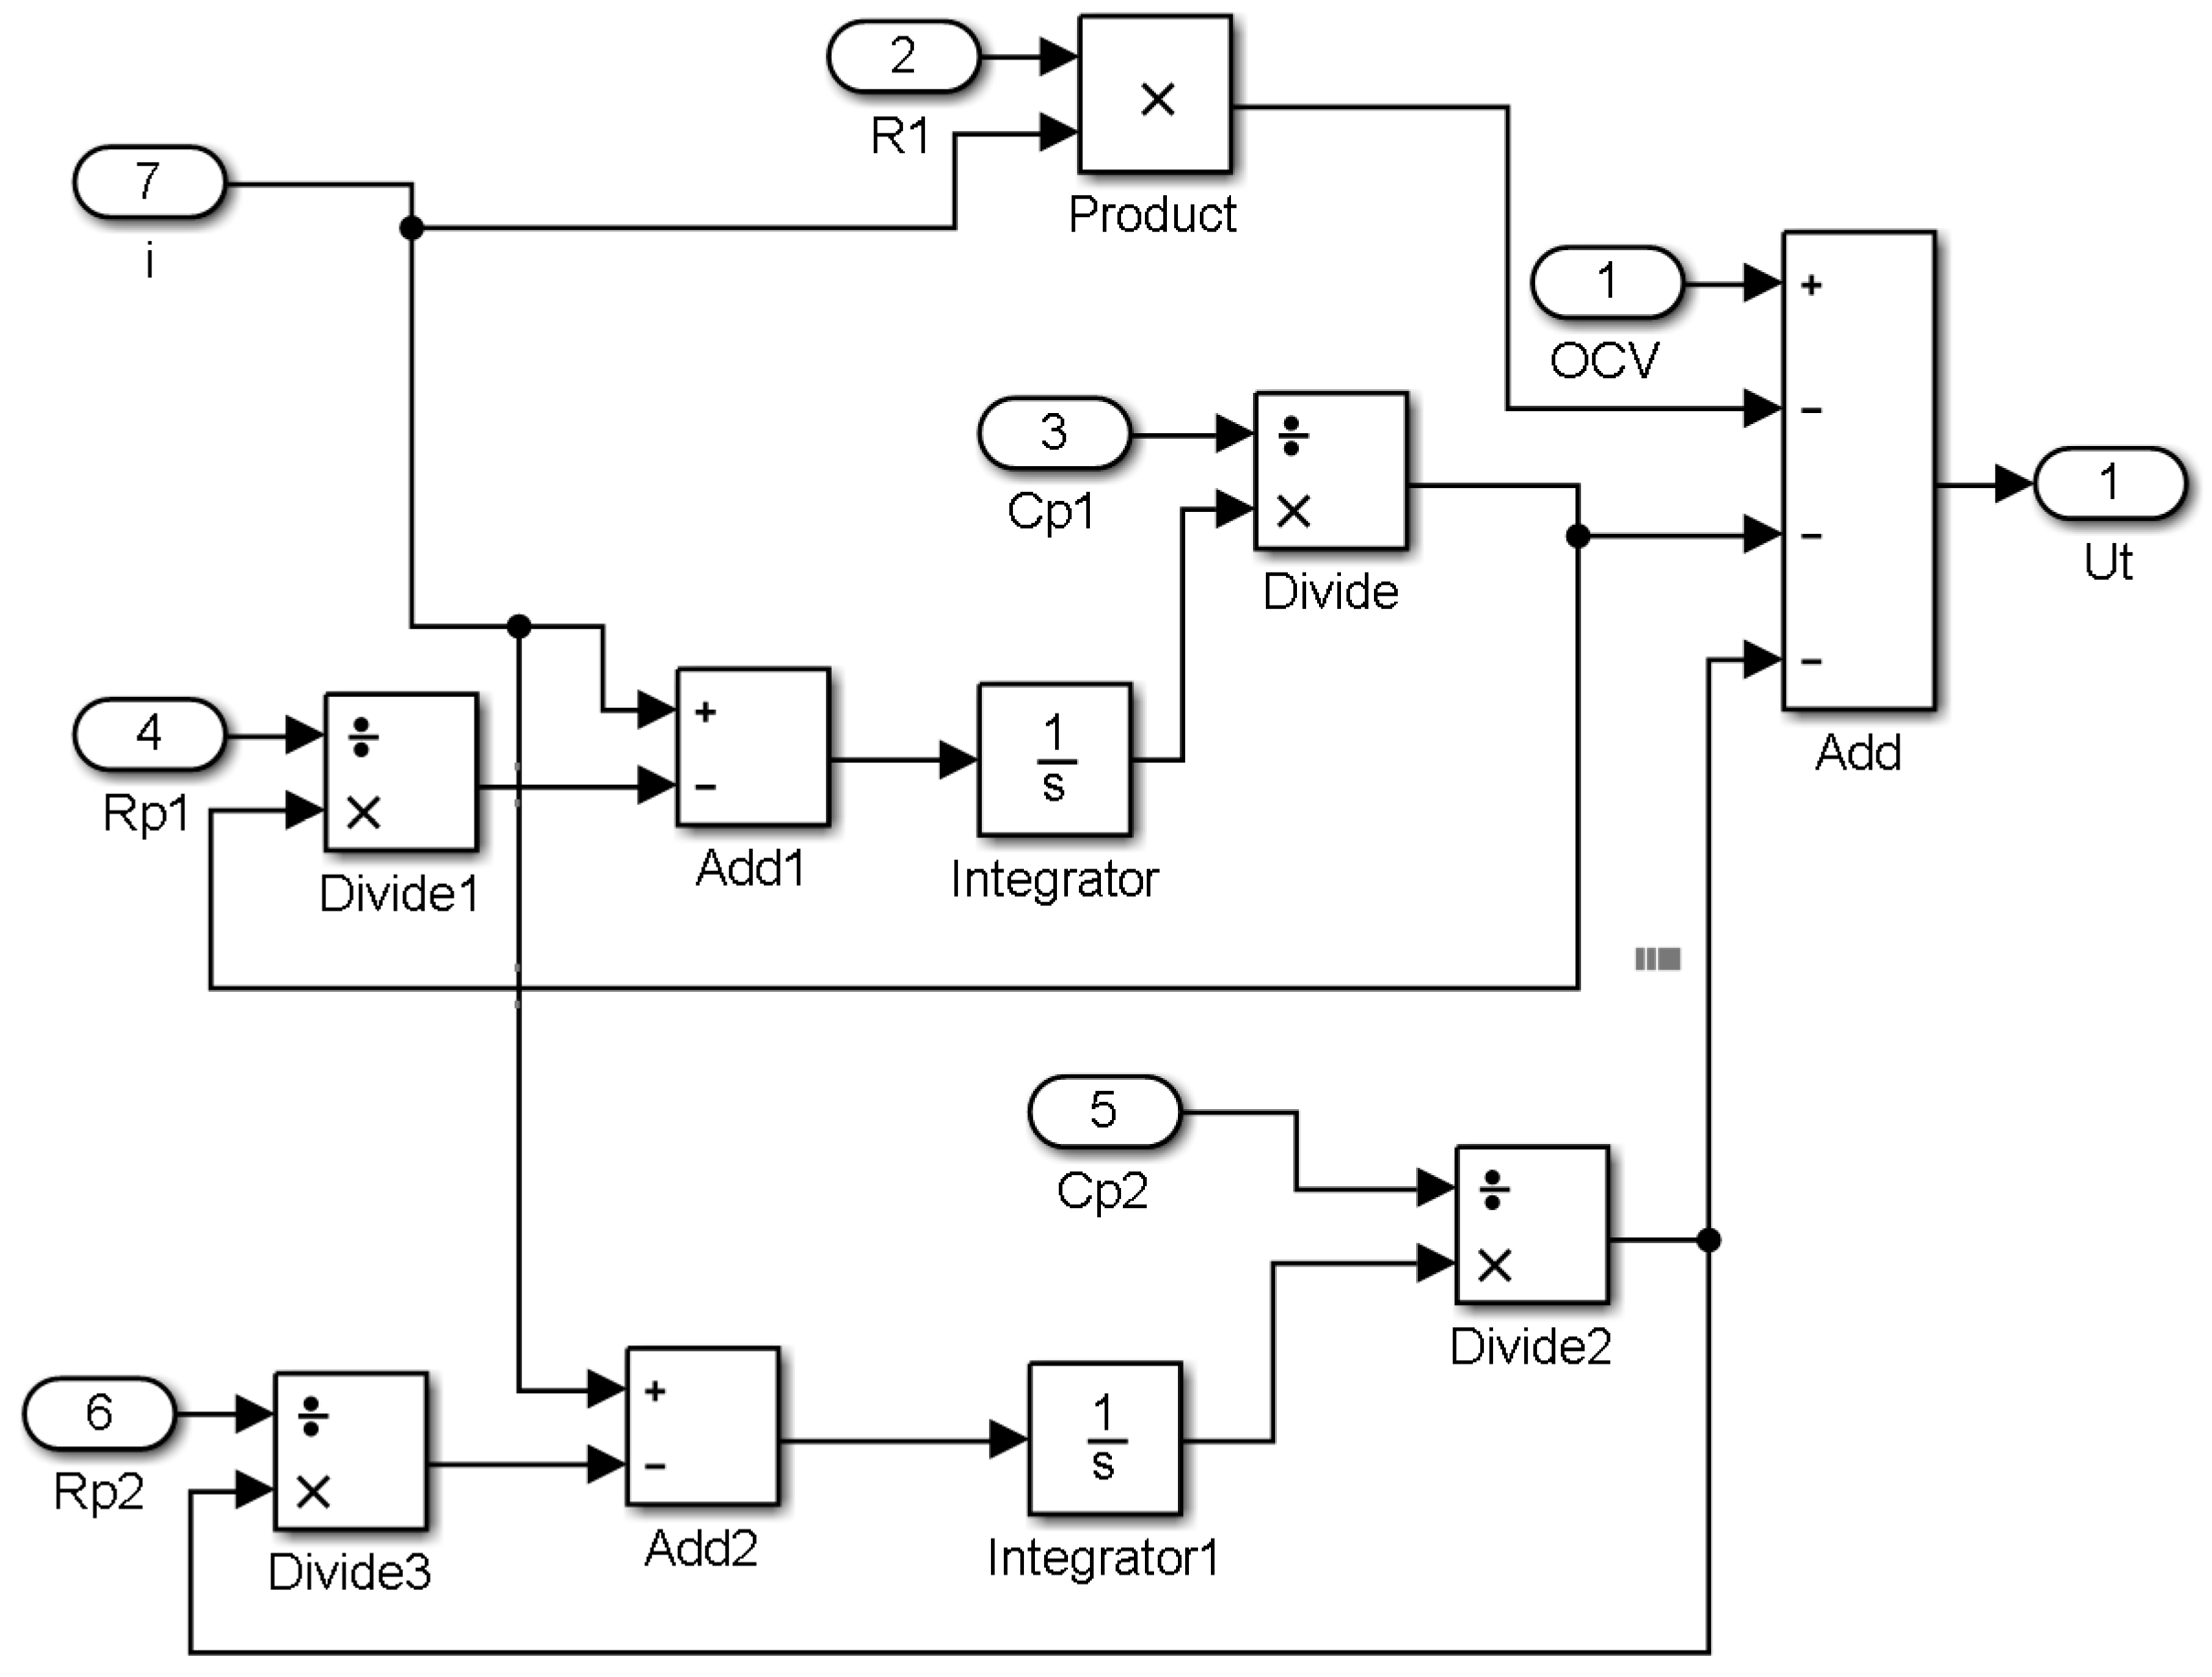
After obtaining the required model parameters, the simulation model of the lithium-ion battery can be established in Matlab/Simulink. The simulations of the established first-order RC and the second-order RC models are shown in Figure 7 and Figure 8, respectively. It can be seen that the simulation model is mainly composed of three sub-modules: the SOC calculation module, the circuit parameter updating module, and the terminal output voltage calculation module. The specific sub-modules are shown in Figure 9 and Figure 10. Figure 9 shows the SOC calculation module based on current time integral method, the discharge capacity is obtained by integrating the discharge current with time, and then the residual capacity could be obtained by using the nominal capacity minus the discharge capacity. Finally, the SOC value can be obtained by the standardized calculation. Figure 10 shows the terminal output voltage calculation module based on Kirchhoff laws, and the output voltage can be obtained by the voltage difference between the OCV and the resistor capacitor. The simulation model has two inputs: the load current profile and the initial SOC of the battery. The load current profile is input through the program, so the load current can be set to any form. The maximum value of SOC is set to 1, and the minimum value is 0, so as to prevent the battery from overcharge and over-discharge. Because of the relatively short cycle time, the influence of temperature change on the output voltage of a lithium-ion battery is ignored. Finally, the actual voltage curve is compared with the simulation curve of the model to verify the accuracy of the model. The detailed results will be discussed in the next section.
4. Results and Discussion
4.1. Constant Current Discharging
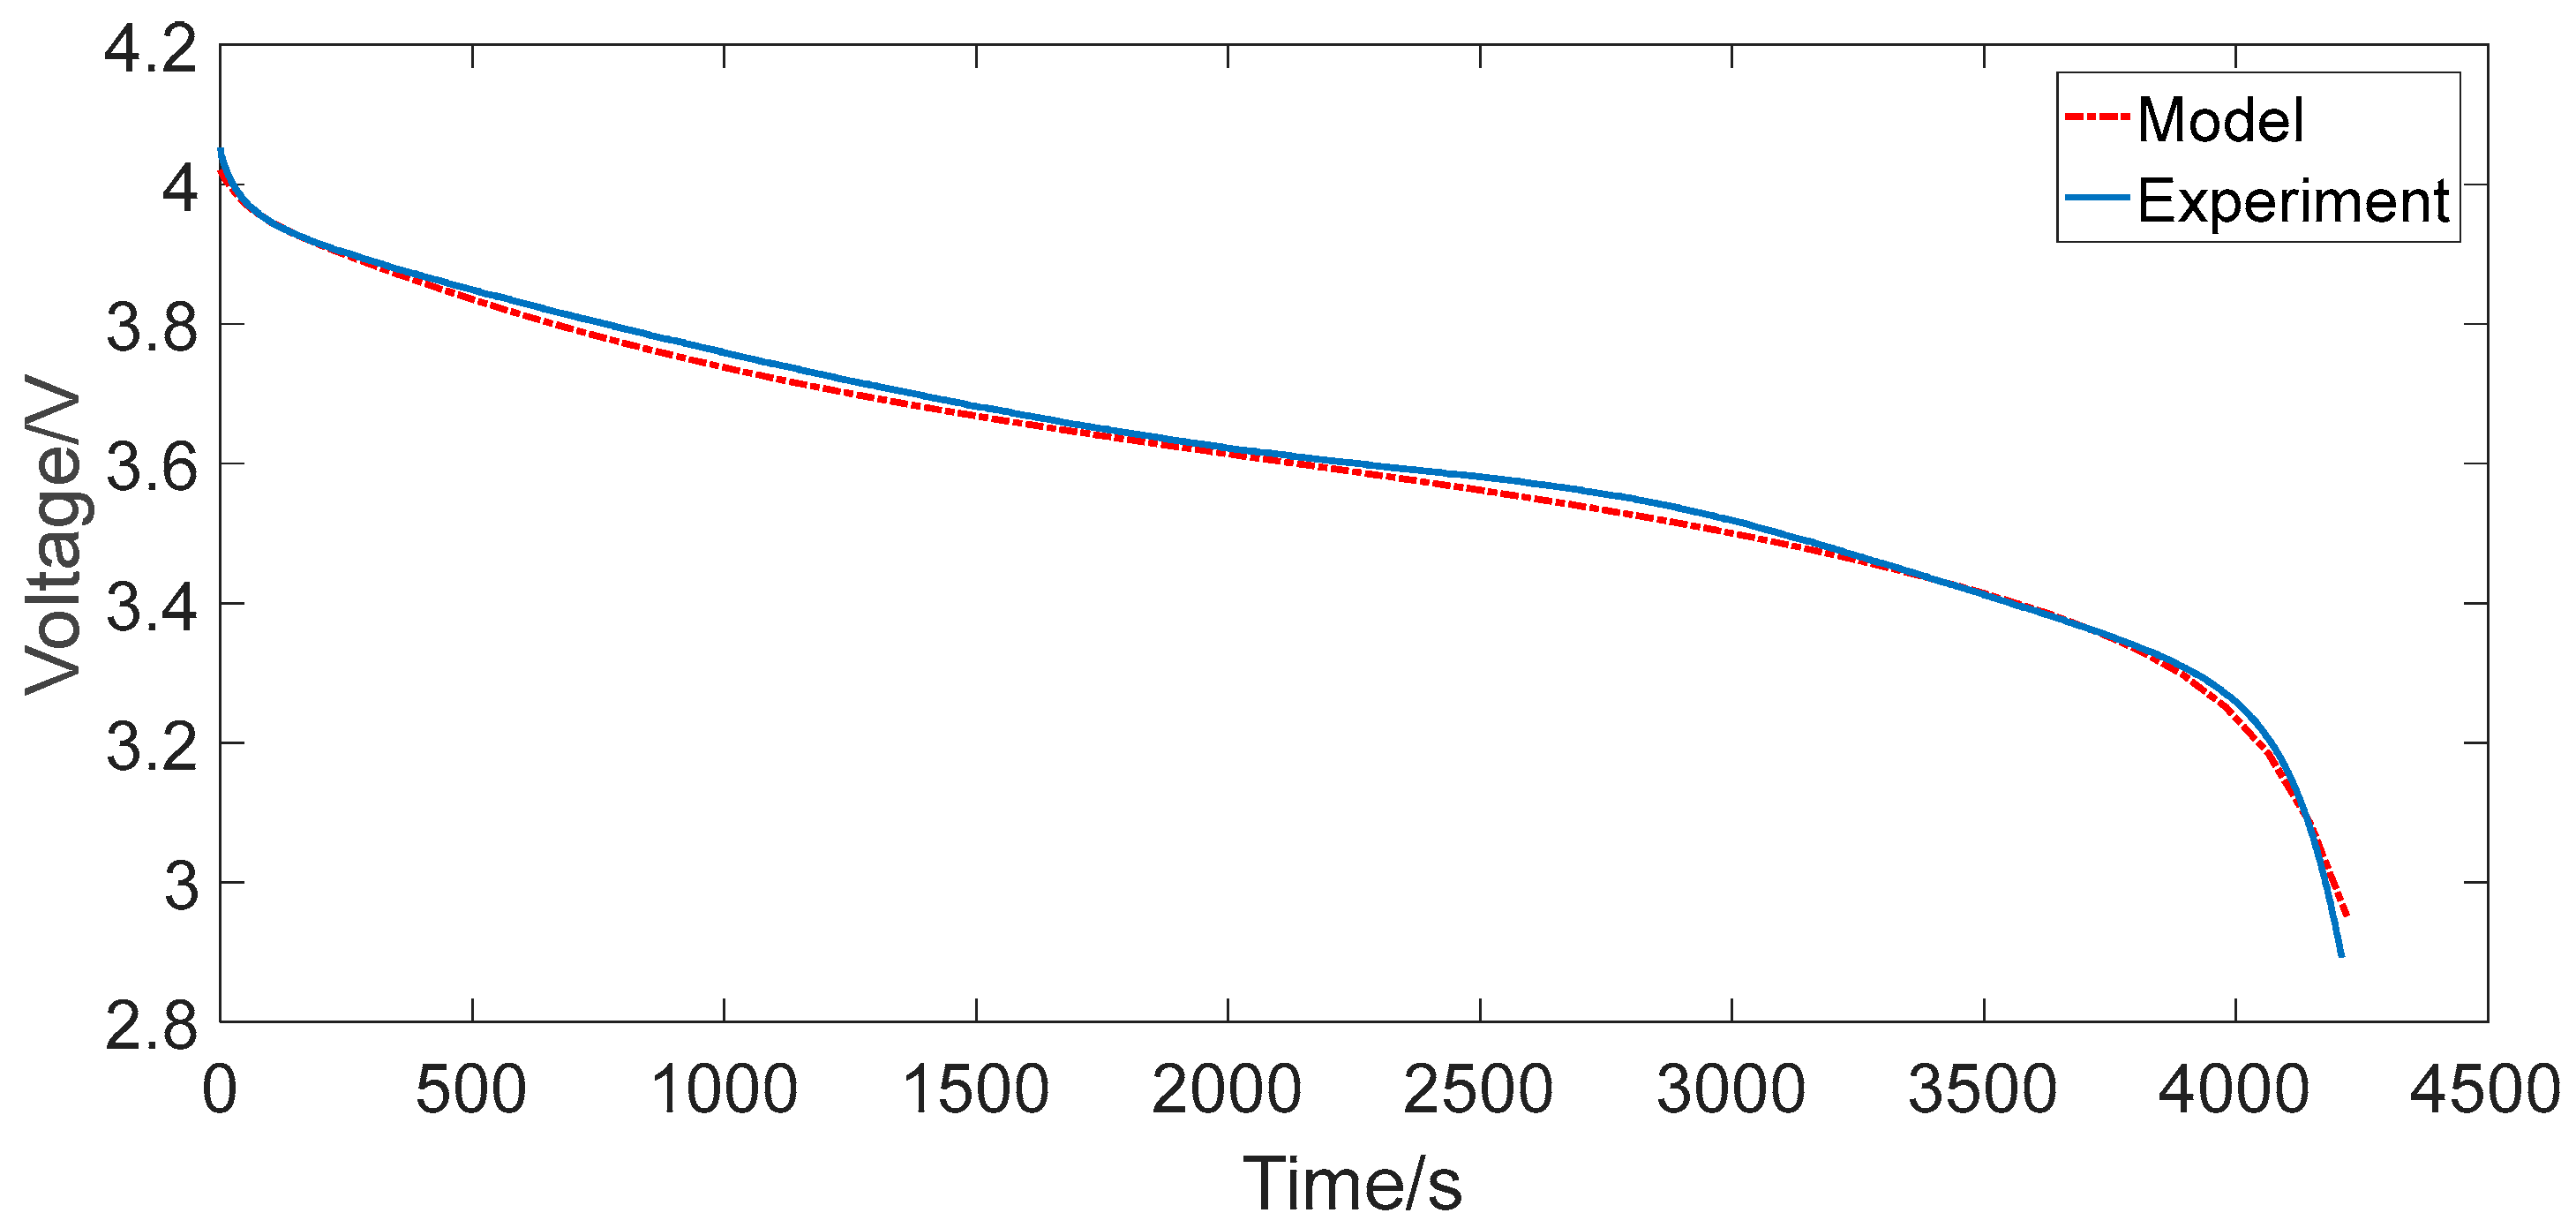
In order to verify the accuracy of the models under the simple operating conditions, constant current discharging tests were performed. First of all, the tested battery was fully charged according to the standard charging method and then the battery was left in the open-circuit condition to rest for 4 h to achieve electrochemical and heat equilibrium. Subsequently, the battery was discharged at a constant current 1C (2.35 A) to its discharging cut-off voltage 2.7 V. For the simulation models, first the initial SOC was set to 1 and the magnitude of the input current to 2.35 A, and then simulation models were run. Simulation results of the first-order RC model are shown in Figure 11, where the red dotted line represents the simulation output voltage and the solid blue line represents the actual voltage value. Similarly, the simulation results of the second-order RC model are shown in Figure 12, where the red dotted line represents the simulation output voltage, and the solid blue line represents the actual voltage value. It can be seen from the figures that the simulated voltage could basically follow the battery terminal voltage changes in the constant current discharging process. However, at the beginning and end stages of discharging, the error was relatively larger; this is at the beginning stage and end stage of discharging, lithium-ion batteries are deepening gradually in the polarization process, and the electrochemical reaction taking place in the battery tends to be unbalanced; the two factors above can lead to the change of parameters in a relatively large range, resulting in a relatively large increase in output error of the models. For better comparison, the output error of the first-order RC model and second-order RC model is analyzed as shown in Figure 13, in which it can be seen that the second-order RC model has a smaller output error than the first-order RC model in general.
4.2. Urban Dynamometer Driving Schedule Cycle
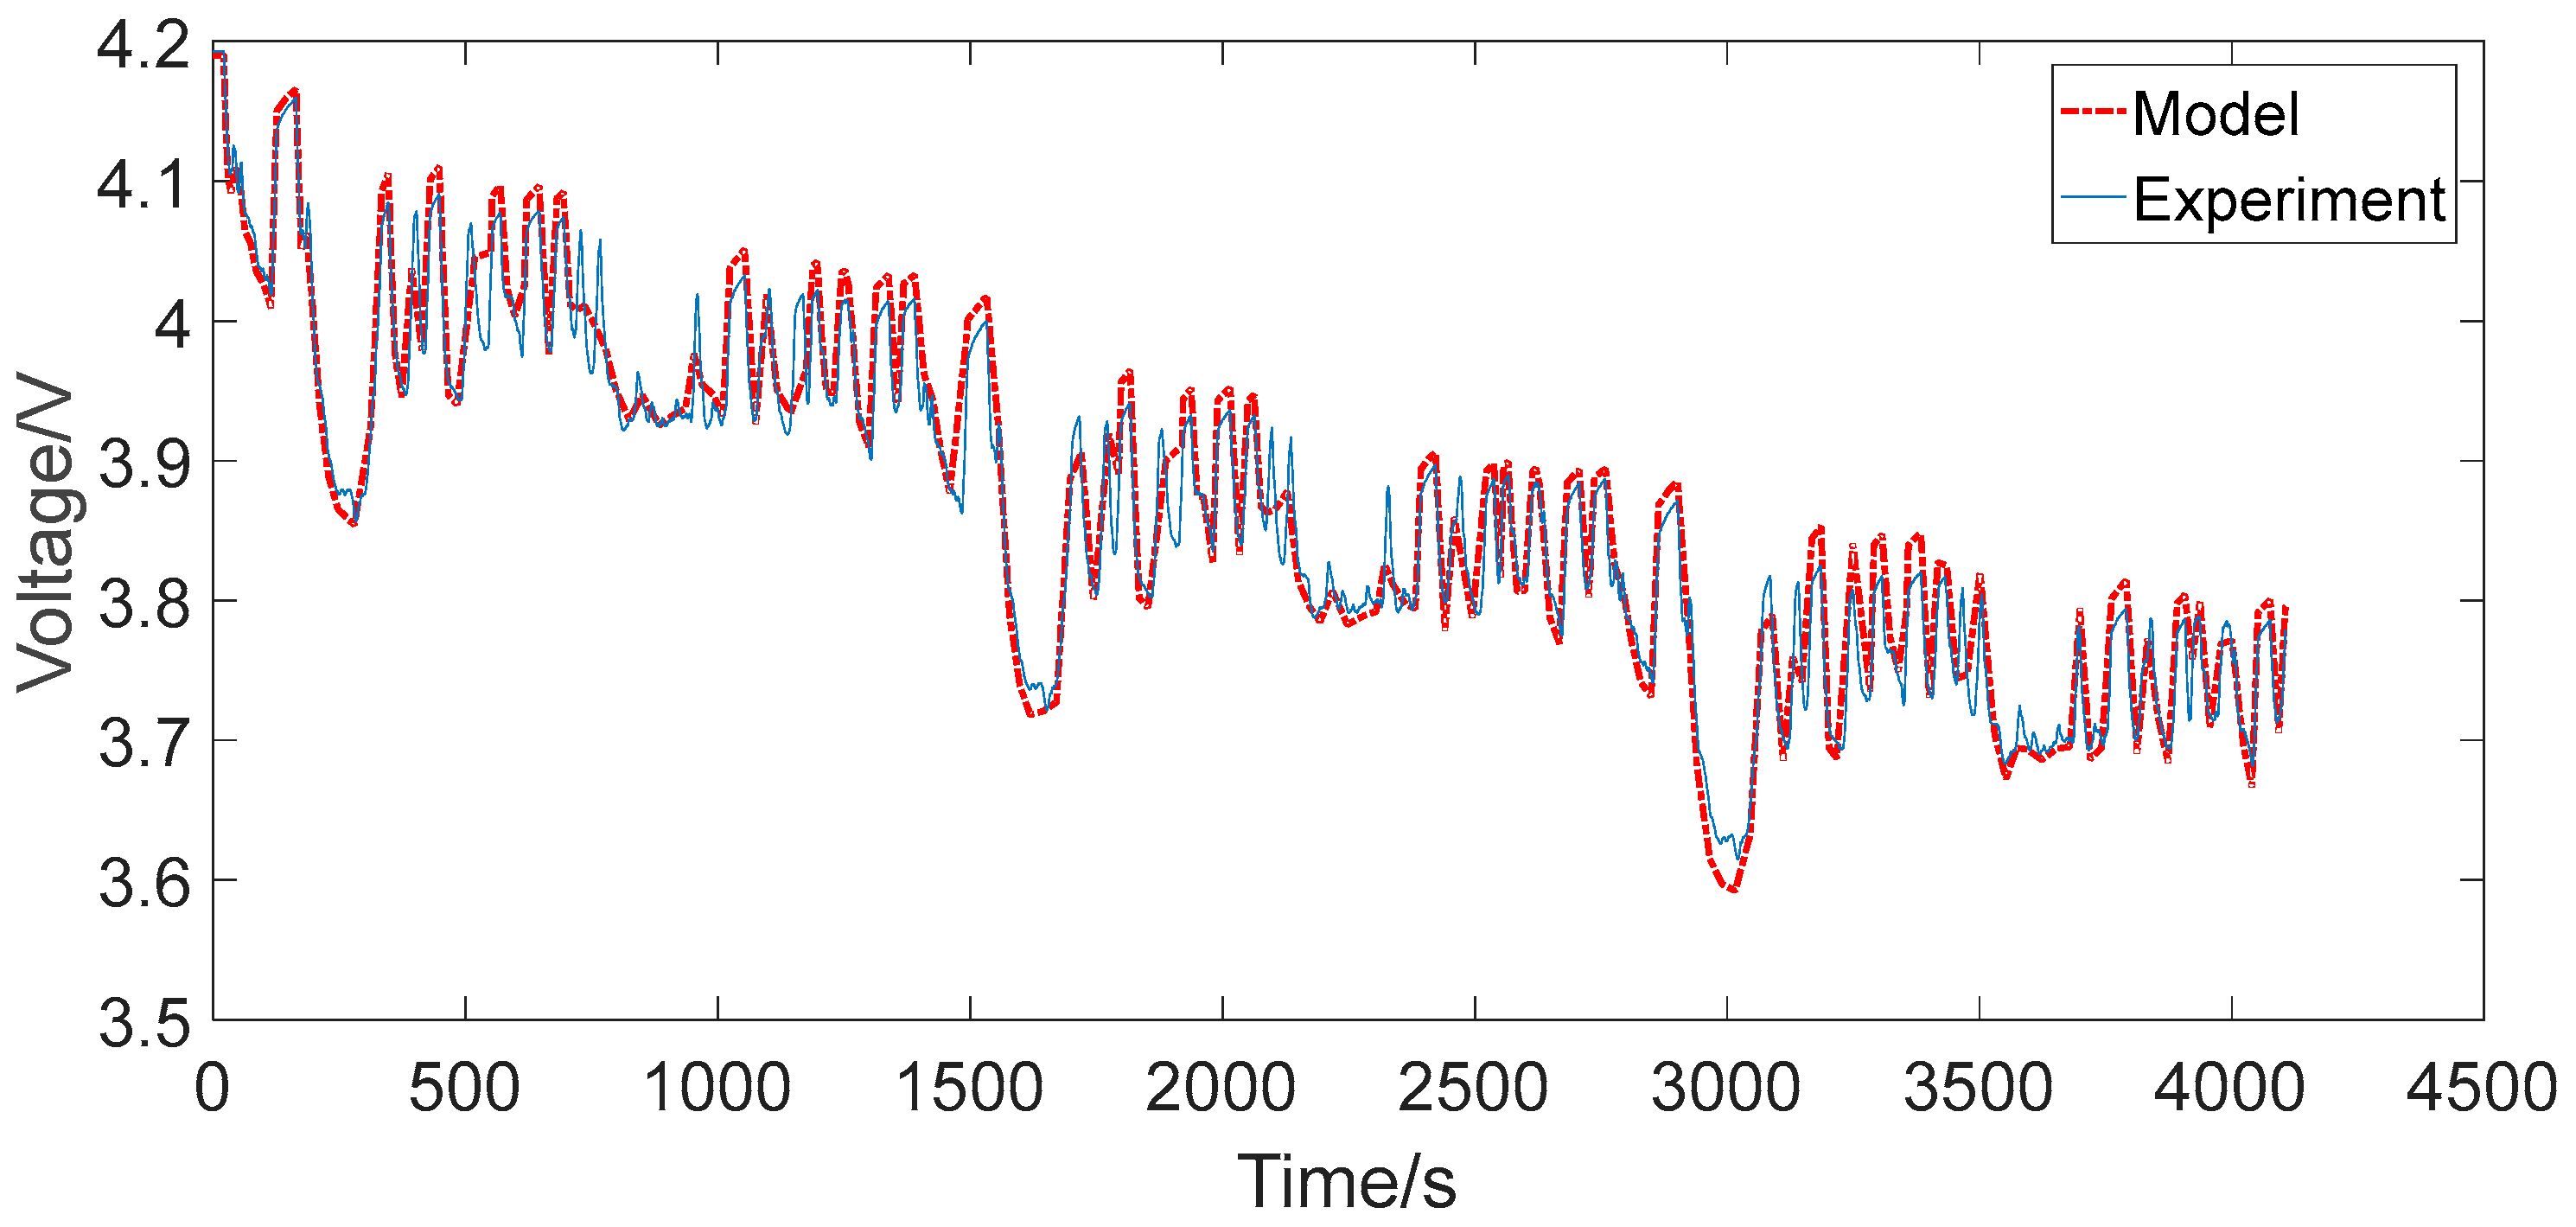
The urban dynamometer driving schedule (UDDS) cycle describes the city bus driving conditions in the United States, and was developed by the United States renewable energy laboratory to adapt to the city bus driving cycle conditions. To simulate real battery operation scenarios, a current sequence was extracted from a hybrid electric vehicle (HEV) battery pack under UDDS cycle, which is widely used in the battery model evaluation. In order to verify the accuracy of the models under UDDS cycle, the following tests were performed. First of all, the tested battery was fully charged according to the standard charging method and then the battery was left in the open-circuit condition to rest for 4 h to achieve electrochemical and heat equilibrium. Subsequently, the obtained current sequence was loaded on the tested battery through the battery tester. For the simulation models, the initial SOC was first set to 1, and then the obtained current sequence was set as the input current file running the simulation models. The simulation results of the first-order RC model are illustrated in Figure 14, where the dotted red line represents the simulation output voltage and the solid blue line represents the actual voltage value. Similarly, the simulation results of the second-order RC model are illustrated in Figure 15, where the dotted red line represents the simulation output voltage and the solid blue line represents the actual voltage. It can be seen from the figures that under UDDS cycle the simulating voltage of the both models can basically follow the battery terminal voltage variation trend except for some subtle peak shifts, while the second-order RC model has a better performance than the first-order RC model in tracking some subtle peak shifts. Obviously, this is because the second-order RC model has a stronger capability to describe the nonlinear polarization response with two RC networks instead of one RC network compared to the first-order RC model.
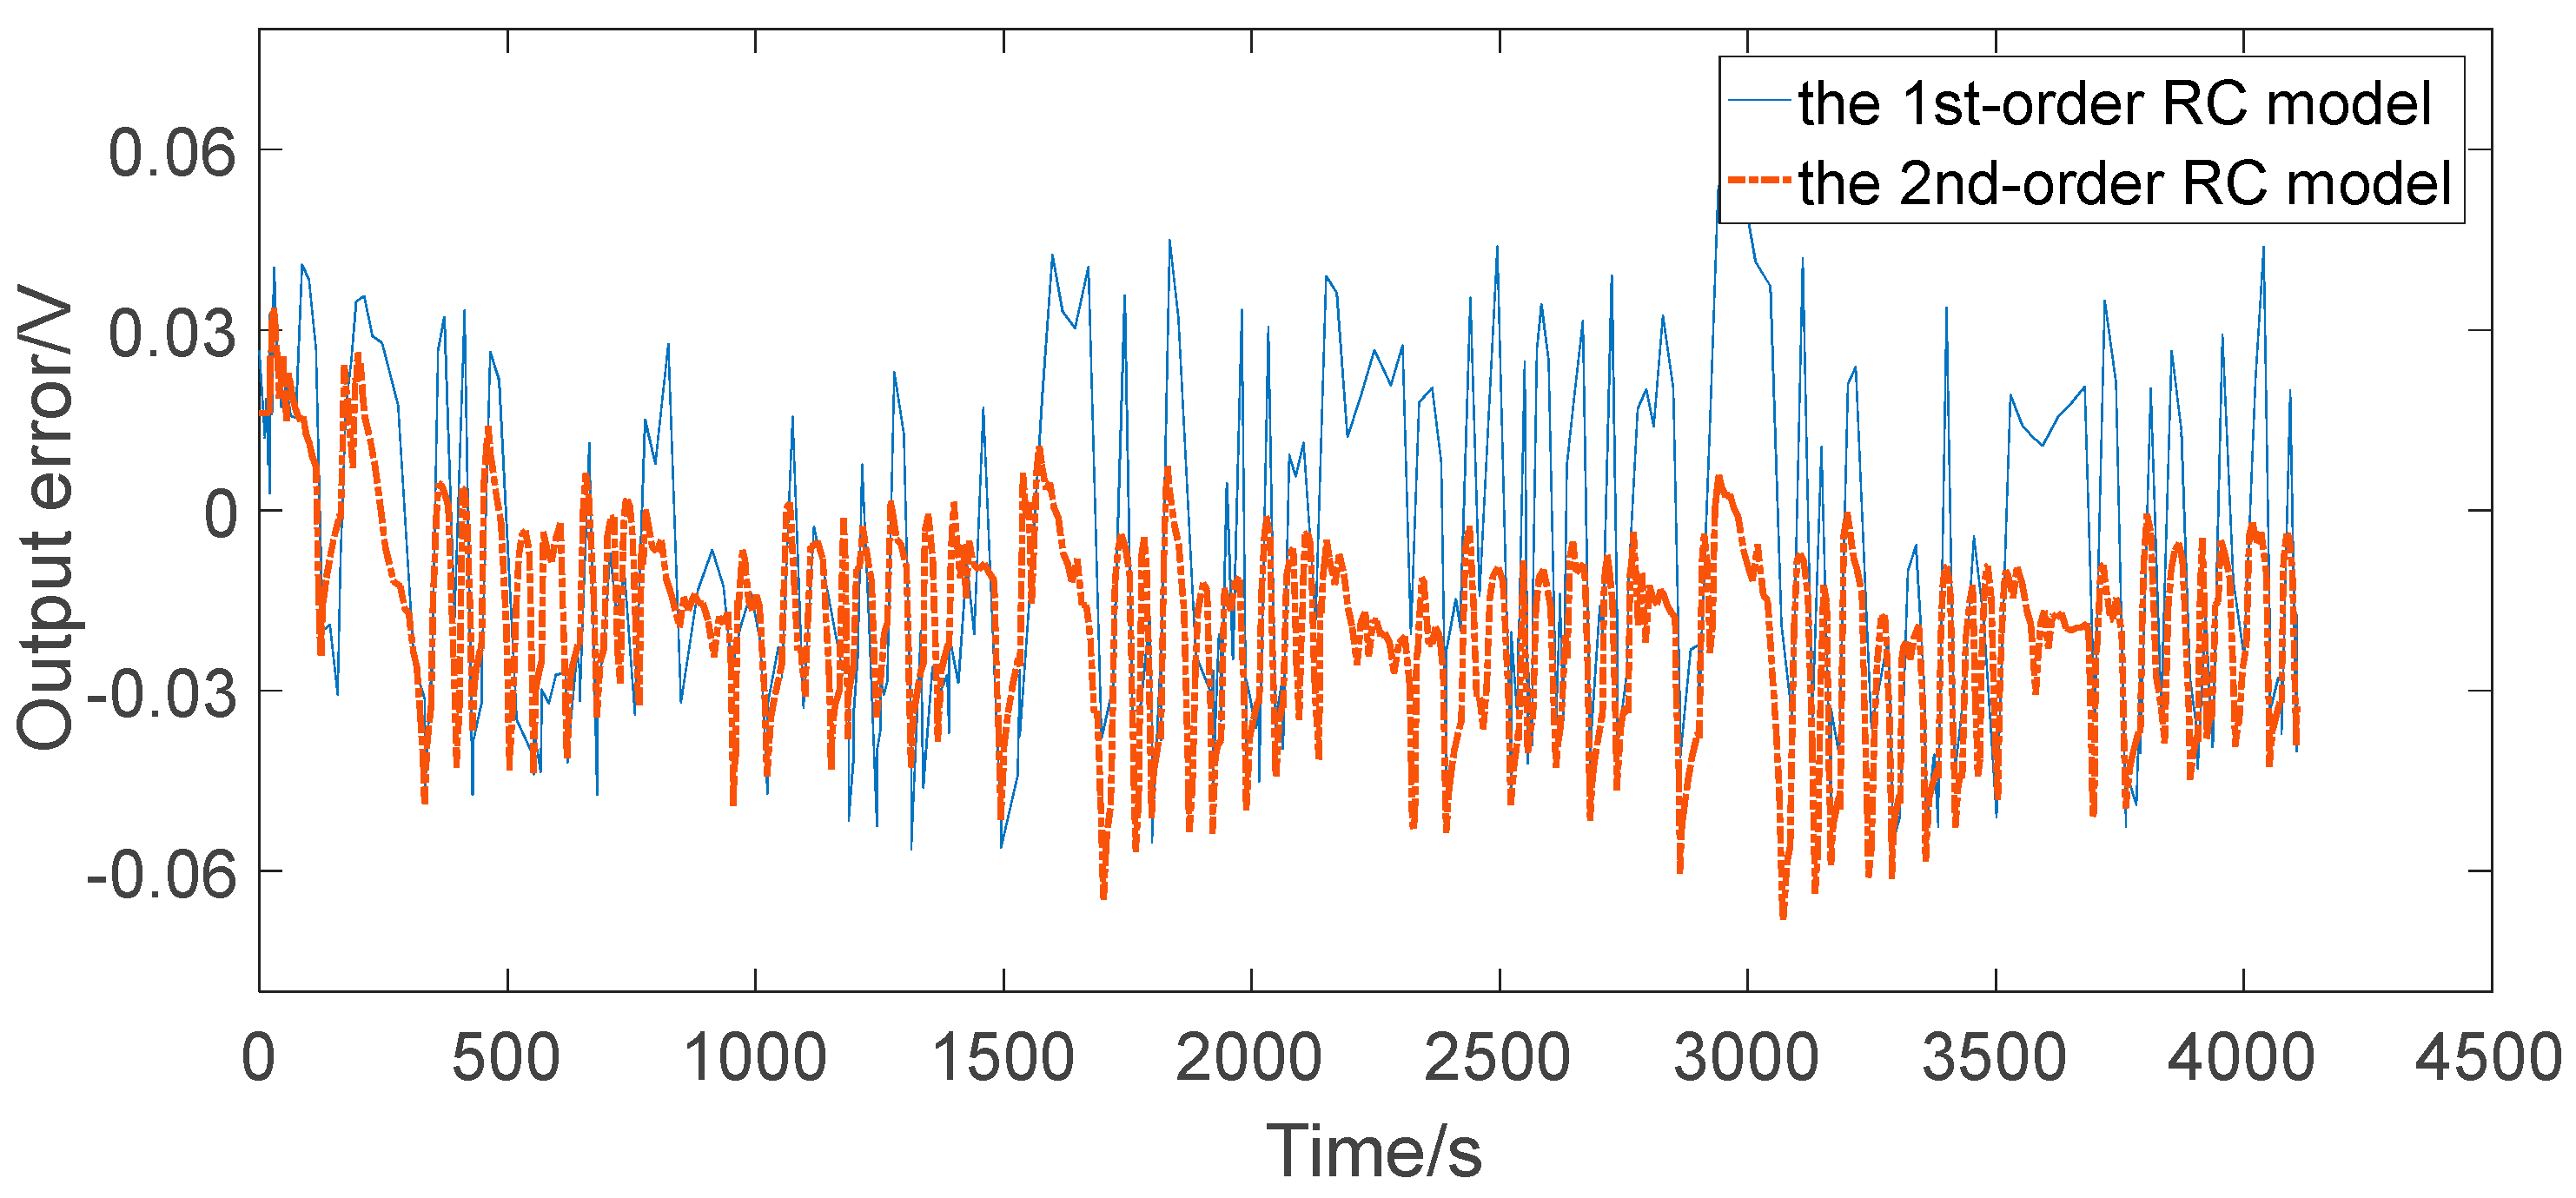
For a better comparison, the output error of the first-order RC model and second-order RC model are analyzed as illustrated in Figure 16. It is seen that the second-order RC model has less output error than the first-order RC model in general, while the maximum absolute errors of both models are less than 0.06 V (i.e., relative error less than 2%). It can also be found that the output error of the first-order model tended to be partial to the positive semi axis while that of the second-order model tended to be partial to the negative semi axis, which is caused by modeling itself on the process of the parameters identification. The results can also prove the ability of the two models above to capture battery dynamic behaviors in some sense.
4.3. Comparative Analysis
In order to better evaluate the accuracy of the two models, their output error was quantified by calculating the maximum absolute error, the maximum relative error, and the root mean square (RMS) error, respectively, as shown in Table 4 for the first-order RC model and in Table 5 for the second-order RC model. Under 1C constant current discharge, for the first-order RC model, the root mean square error was 0.0221 V, the maximum relative error was 1.65%; for the second-order RC model, the root mean square error was 0.0156 V, the maximum relative error was 1.22%. Under UDDS cycle, for the first-order RC model, the root mean square error was 0.0298 V, the maximum relative error was 1.88%; and for the second-order RC model, the root mean square error was 0.0282 V, the maximum relative error was −1.69%, respectively.
It can be seen from the two tables that the maximum relative error of the first-order RC model and the second-order RC model under the two representative operating conditions were both less than 2%, which can generally satisfy the precision requirements in the engineering calculation. By longitudinal comparison, it can be found that the output error of two models had a certain decrease, but not to the great extent expected in the simple conditions compared the actual complex conditions (UDDS), which may be due to measurement errors of VOC. By transverse comparison, the output error of the second-order RC model in the two conditions had a certain decrease but little change. This may be due to the increase in the number of parameters, resulting in the increase of the uncertainty factors of identification process; thus, the overall accuracy of the second-order RC model did not provide great improvement over the first-order RC model.
The discharge curve has been used to predict capacity fading of lithium-ion cells, which can reflect the discharge cut-off point, discharge plateau, and capacity of the cell. In this paper, the area surrounded by the discharge curve is used to describe the similarity of the discharge curve, which is defined as follows:
It can be seen from Table 6 that the area surrounded by the discharge curve of the first-order model is much larger than the second-order model, and therefore the second-order model is more accurate than the first-order model in terms of UDDS profile.
5. Conclusions
The lithium-ion battery models are generally divided into electrochemical mechanism models and equivalent circuit models. The representative first-order RC model and second-order RC model commonly used in the literature are studied comparatively in this paper, and the following main conclusions are achieved:
- (1)
- The ECM has a very large advantage in computation time in contrast to electrochemical models; the simulation time based on the electrochemical model was as long as 9600 s [13], while the simulation time based on equivalent circuit model in this paper was negligible.
- (2)
- The maximum relative errors of the two RC models under the two representative operating conditions were all less than 2%, which can generally satisfy the precision requirements for the practical engineering calculation, such as algorithms based on ECM for advanced BMSs.
- (3)
- The second-order RC model improved the output error in contrast to the first-order RC model in both simple and complex discharging conditions, but did not improve much. Therefore, for ordinary applications such as portable consumer electronics, the first-order RC model could be the preferred choice. However, for stringent applications such as automotive and aerospace, the second-order RC model could be the preferred choice. The results are of great instructional significance to the application in practical control systems for the equivalent circuit modeling of lithium-ion batteries.
Acknowledgments
This work was financially supported by the National Key Research and Development Program of China (No. 2016YFF0203804), the National Natural Science Foundation of China (No. 51775037), and the Fundamental Research Funds for Central Universities of China (No. FRF-TP-14-061A2). Also, thanks to Zachary Omariba for his English editing.
Author Contributions
Lijun Zhang, Hui Peng and Changyan Sun conceived and designed the experiments; Hui Peng, Zhansheng Ning and Zhongqiang Mu performed the experiments; Hui Peng and Zhansheng Ning analyzed the data; and Lijun Zhang and Hui Peng wrote the paper.
Conflicts of Interest
The authors declare no conflict of interest.
Abbreviations
| VOC | open circuit voltage (V) |
| R0 | ohmic resistance (Ω) |
| R1 | polarization resistance (Ω) |
| C1 | polarization capacitance (F) |
| I | current (A) |
| U | the terminal voltage (V) |
| U0 | the voltage before the current changes (V) |
| U1 | the voltage after the moment the current changes (V) |
| the time constant | |
| Ω | ohmic |
| AC | alternating current |
| Ah | ampere-hour |
| BMS | battery management system |
| ECM | equivalent circuit model |
| EIS | electrochemical impedance spectroscopy |
| HEV | hybrid electric vehicle |
| HPPC | hybrid pulse power characterization |
| LiFePO4 | lithium iron phosphate |
| MATLAB | MATrix LABoratory |
| OCV | open circuit voltage |
| RC | resistance capacitance |
| RMS | root mean square |
| SOC | state-of-charge |
| SOH | state-of-health |
| SOF | state-of-function |
| UDDS | urban dynamometer driving schedule |
References
- Jaguemont, J.; Boulon, L.; Dubé, Y. A comprehensive review of lithium-ion batteries used in hybrid and electric vehicles at cold temperatures. Appl. Energy 2016, 164, 99–114. [Google Scholar] [CrossRef]
- Wu, L.; Fu, X.; Guan, Y. Review of the remaining useful life prognostics of vehicle lithium-ion batteries using data-driven methodologies. Appl. Sci. 2016, 6, 166. [Google Scholar] [CrossRef]
- Sbarufatti, C.; Corbetta, M.; Giglio, M.; Cadini, F. Adaptive prognosis of lithium-ion batteries based on the combination of particle filters and radial basis function neural networks. J. Power Sources 2017, 344, 128–140. [Google Scholar] [CrossRef]
- Chaturvedi, N.A.; Klein, R.; Christensen, J. Algorithms for advanced battery-management systems. IEEE Control Syst. 2010, 30, 49–68. [Google Scholar] [CrossRef]
- Worwood, D.; Kellner, Q.; Wojtala, M.; Widanage, W.D.; McGlen, R.; Greenwood, D.; Marco, J. A new approach to the internal thermal management of cylindrical battery cells for automotive applications. J. Power Sources 2017, 346, 151–166. [Google Scholar] [CrossRef]
- Brand, M.J.; Schuster, S.F.; Bach, T. Effects of vibrations and shocks on lithium-ion cells. J. Power Sources 2015, 288, 62–69. [Google Scholar] [CrossRef]
- Liu, X.; He, Y.; Zheng, X.; Zhang, J.; Zeng, G. A new state-of-charge estimation method for electric vehicle lithium-ion batteries based on multiple input parameter fitting model. Int. J. Energy Res. 2017, 41, 1265–1276. [Google Scholar] [CrossRef]
- Hannan, M.A.; Hoque, M.M.; Mohamed, A.; Ayob, A. Review of energy storage systems for electric vehicle applications: Issues and challenges. Renew. Sustain. Energy Rev. 2017, 69, 771–789. [Google Scholar] [CrossRef]
- Barai, A.; Chouchelamane, G.H.; Guo, Y.; McGordon, A.; Jennings, P. A study on the impact of lithium-ion cell relaxation on electrochemical impedance spectroscopy. J. Power Sources 2015, 280, 74–80. [Google Scholar] [CrossRef]
- Lu, L.; Han, X.; Li, J. A review on the key issues for lithium-ion battery management in electric vehicles. J. Power Sources 2013, 226, 272–288. [Google Scholar] [CrossRef]
- Wang, D.; Zhao, Y.; Yang, F.; Tsui, K.-L. Nonlinear-drifted Brownian motion with multiple hidden states for remaining useful life prediction of rechargeable batteries. Mech. Syst. Signal Process. 2017, 93, 531–544. [Google Scholar] [CrossRef]
- Nikolian, A.; Firouz, Y.; Gopalakrishnan, R.; Timmermans, J.M.; Omar, N.; van den Bossche, P.; van Mierlo, J. Lithium ion batteries—Development of advanced electrical equivalent circuit models for nickel manganese cobalt lithium-ion. Energies 2016, 9, 360. [Google Scholar] [CrossRef]
- Chu, Z.; Feng, X.; Lu, L.; Li, J.; Han, X.; Ouyang, M. Non-destructive fast charging algorithm of lithium-ion batteries based on the control-oriented electrochemical model. Appl. Energy 2017, in press. [Google Scholar] [CrossRef]
- Zhang, X.; Lu, J.; Yuan, S.; Yang, J.; Zhou, X. A novel method for identification of lithium-ion battery equivalent circuit model parameters considering electrochemical properties. J. Power Sources 2017, 345, 21–29. [Google Scholar] [CrossRef]
- Wang, Q.K.; He, Y.J.; Shen, J.N.; Ma, Z.F.; Zhong, G.B. A unified modeling framework for lithium-ion batteries: An artificial neural network based thermal coupled equivalent circuit model approach. Energy 2017, 138, 118–132. [Google Scholar] [CrossRef]
- Feng, X.; Weng, C.; Ouyang, M.; Sun, J. Online internal short circuit detection for a large format lithium ion battery. Appl. Energy 2016, 161, 168–180. [Google Scholar] [CrossRef]
- Chiang, Y.H.; Sean, W.Y.; Ke, J.C. Online estimation of internal resistance and open-circuit voltage of lithium-ion batteries in electric vehicles. J. Power Sources 2011, 196, 3921–3932. [Google Scholar] [CrossRef]
- Mathew, M.; Kong, Q.H.; McGrory, J.; Fowler, M. Simulation of lithium ion battery replacement in a battery pack for application in electric vehicles. J. Power Sources 2017, 349, 94–104. [Google Scholar] [CrossRef]
- Panchal, S.; Dincer, I.; Agelin-Chaab, M.; Fraser, R.; Fowler, M. Experimental and simulated temperature variations in a LiFePO 4–20 Ah battery during discharge process. Appl. Energy 2016, 180, 504–515. [Google Scholar] [CrossRef]
- Panchal, S.; Mcgrory, J.; Kong, J.; Fraser, R.; Fowler, M.; Dincer, I.; Agelin-Chaab, M. Cycling degradation testing and analysis of a LiFePO4 battery at actual conditions. Int. J. Energy Res. 2017. [Google Scholar] [CrossRef]
- Mu, H.; Xiong, R.; Zheng, H.; Chang, Y.; Chen, Z. A novel fractional order model based state-of-charge estimation method for lithium-ion battery. Appl. Energy 2017, in press. [Google Scholar] [CrossRef]
- Dang, X.; Yan, L.; Xu, K.; Wu, X.; Jiang, H.; Sun, H. Open-circuit voltage-based state of charge estimation of lithium-ion battery using dual neural network fusion battery model. Electrochim. Acta 2016, 188, 356–366. [Google Scholar] [CrossRef]
- Dang, X.; Yan, L.; Jiang, H.; Wu, X.; Sun, H. Open-circuit voltage-based state of charge estimation of lithium-ion power battery by combining controlled auto-regressive and moving average modeling with feedforward-feedback compensation method. Int. J. Electr. Power Energy Syst. 2017, 90, 27–36. [Google Scholar] [CrossRef]
- Tian, Y.; Li, D.; Tian, J.; Xia, B. State of charge estimation of lithium-ion batteries using an optimal adaptive gain nonlinear observer. Electrochim. Acta 2017, 225, 225–234. [Google Scholar] [CrossRef]
- Li, J.; Barillas, J.K.; Guenther, C.; Danzer, M.A. A comparative study of state of charge estimation algorithms for LiFePO4 batteries used in electric vehicles. J. Power Sources 2013, 230, 244–250. [Google Scholar] [CrossRef]
- Du, J.; Liu, Z.; Wang, Y.; Wen, C. An adaptive sliding mode observer for lithium-ion battery state of charge and state of health estimation in electric vehicles. Control Eng. Pract. 2016, 54, 81–90. [Google Scholar] [CrossRef]
- Tong, S.; Klein, M.P.; Park, J.W. On-line optimization of battery open circuit voltage for improved state-of-charge and state-of-health estimation. J. Power Sources 2015, 293, 416–428. [Google Scholar] [CrossRef]
- Remmlinger, J.; Buchholz, M.; Meiler, M.; Bernreuter, P.; Dietmayer, K. State-of-health monitoring of lithium-ion batteries in electric vehicles by on-board internal resistance estimation. J. Power Sources 2011, 196, 5357–5363. [Google Scholar] [CrossRef]
- Xia, B.; Sun, Z.; Zhang, R.; Lao, Z. A Cubature Particle Filter Algorithm to Estimate the State of the Charge of Lithium-Ion Batteries Based on a Second-Order Equivalent Circuit Model. Energies 2017, 10, 457. [Google Scholar] [CrossRef]
- He, W.; Williard, N.; Chen, C.; Pecht, M. State of charge estimation for electric vehicle batteries using unscented kalman filtering. Microelectron. Reliab. 2013, 53, 840–847. [Google Scholar] [CrossRef]
- Schweiger, H.G.; Obeidi, O.; Komesker, O.; Raschke, A.; Schiemann, M.; Zehner, C.; Birke, P. Comparison of several methods for determining the internal resistance of lithium ion cells. Sensors 2010, 10, 5604–5625. [Google Scholar] [CrossRef] [PubMed]
Figure 1.
The first-order resistor–capacitor (RC) (a) and second-order RC (b) equivalent circuit models.
Figure 1.
The first-order resistor–capacitor (RC) (a) and second-order RC (b) equivalent circuit models.

Figure 2.
NEWARE BTS4000 battery testing bench.
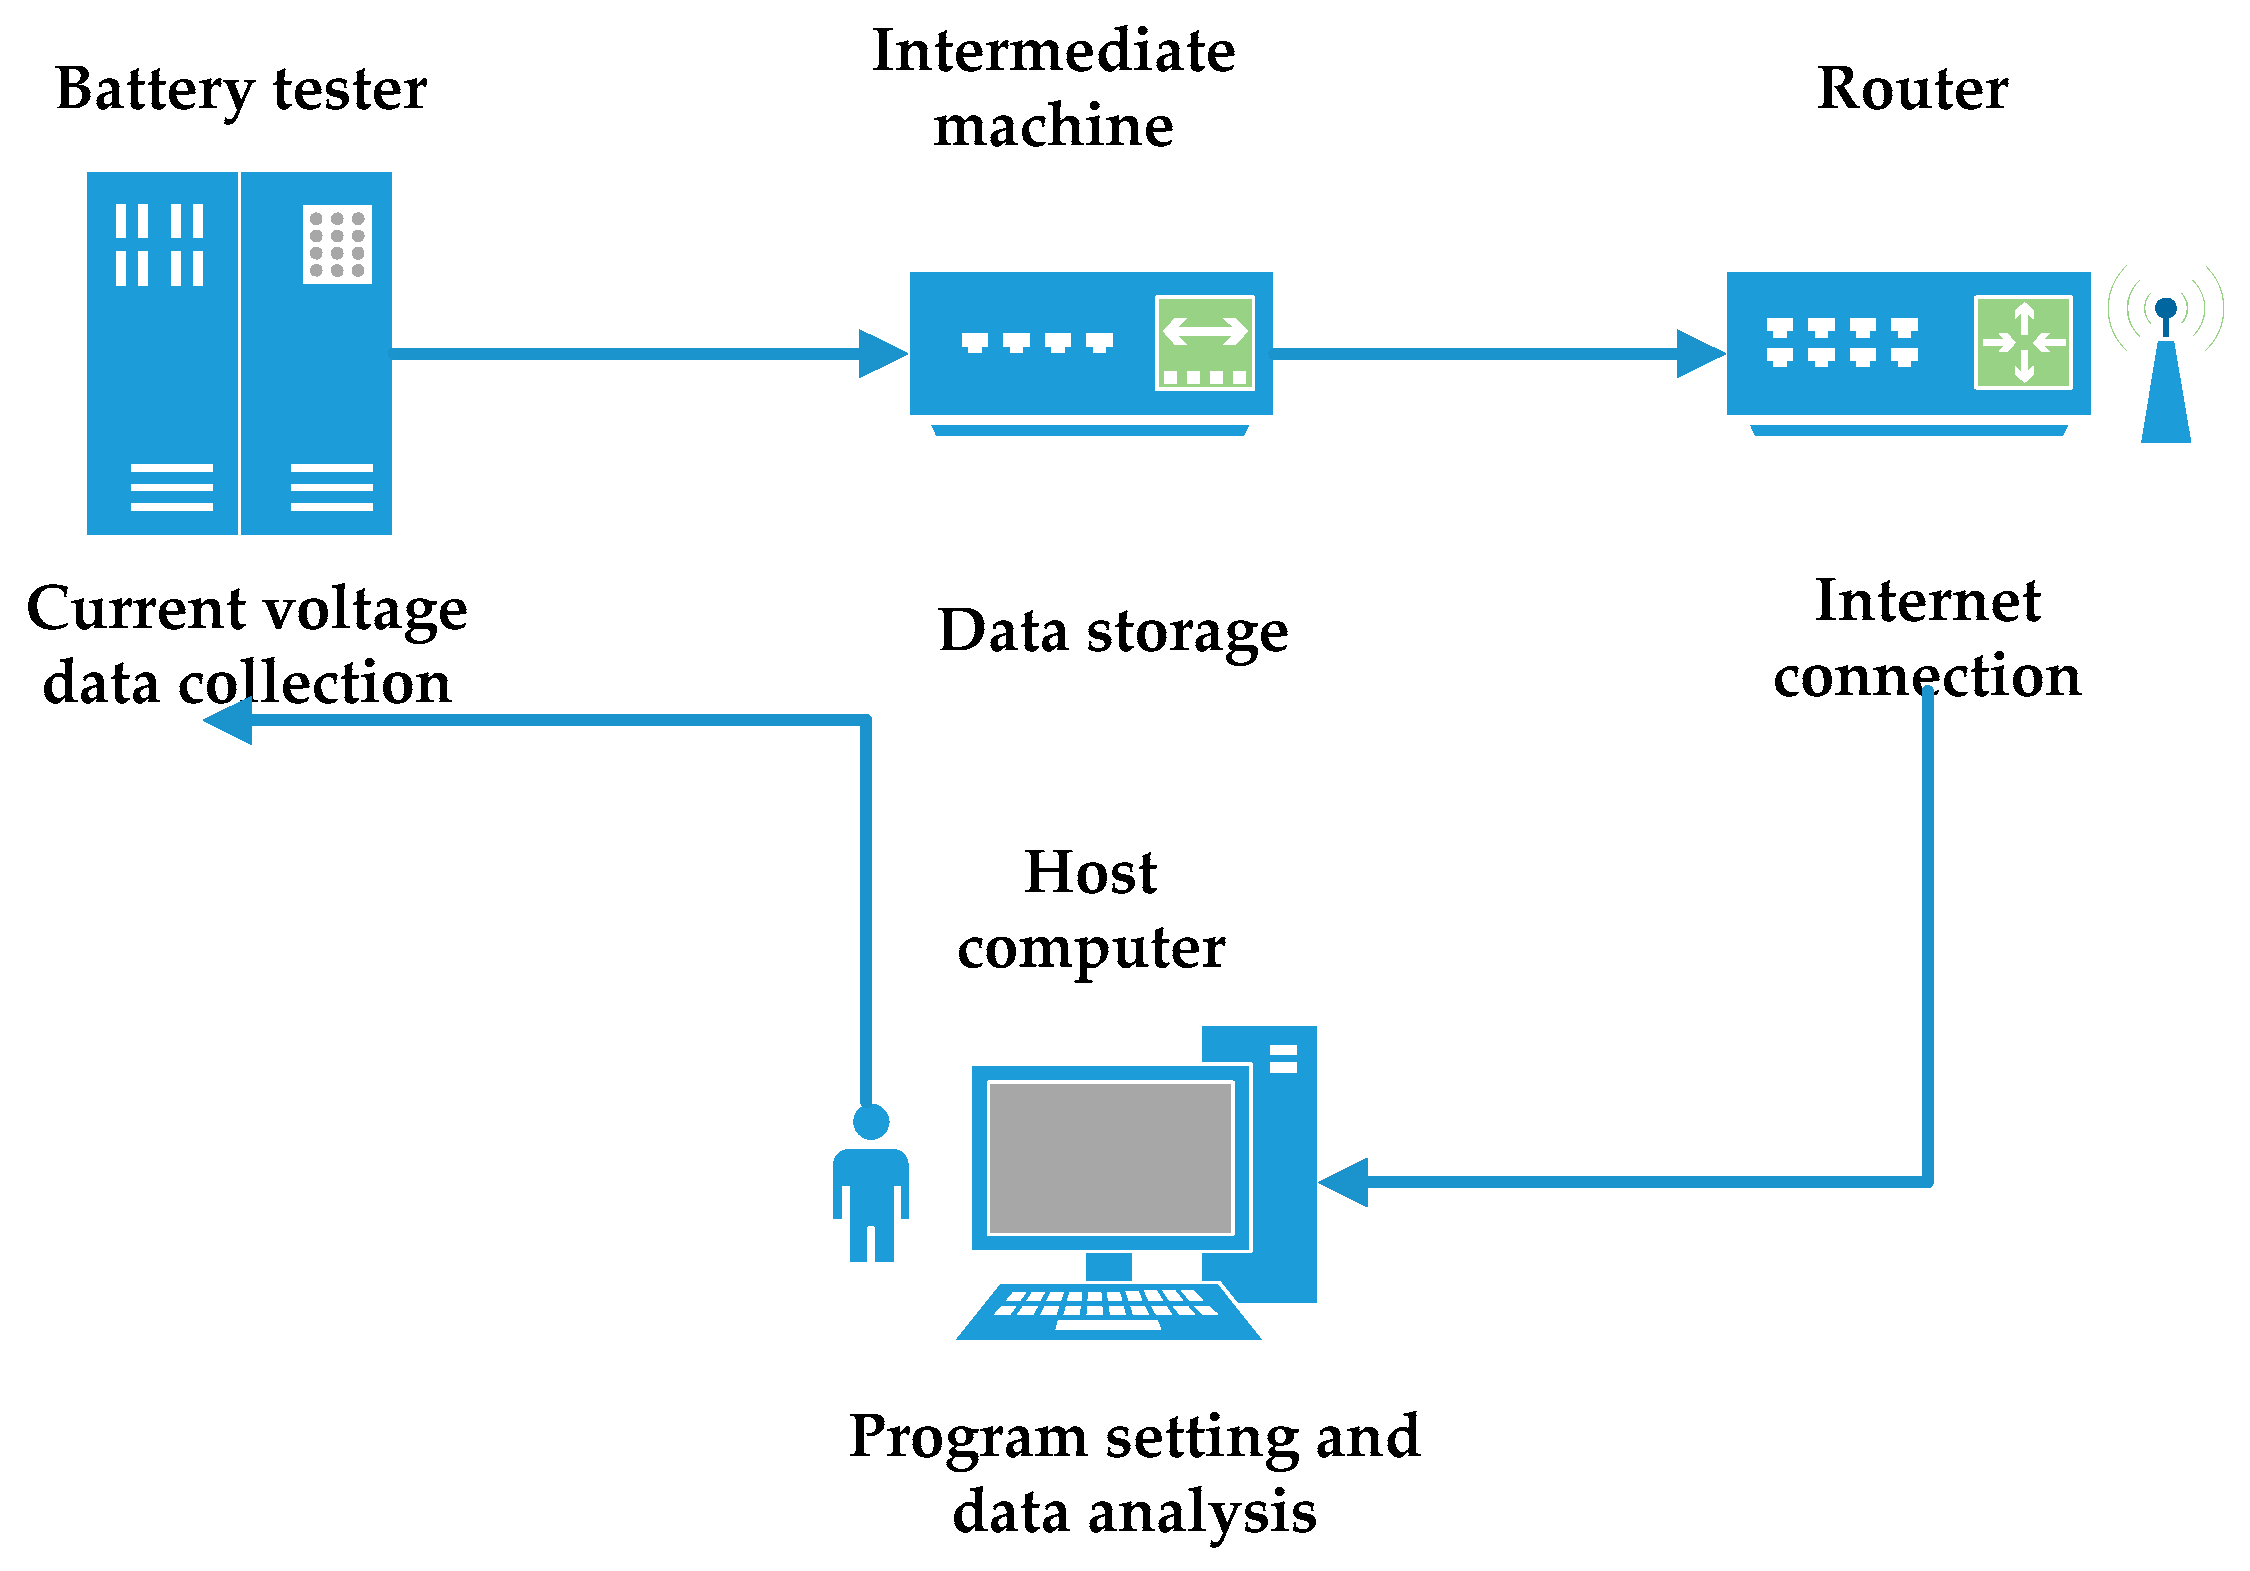
Figure 3.
The varying curve of open circuit voltage (OCV) with state-of-charge (SOC).

Figure 4.
Hybrid pulse power characterization (HPPC) test current profile.
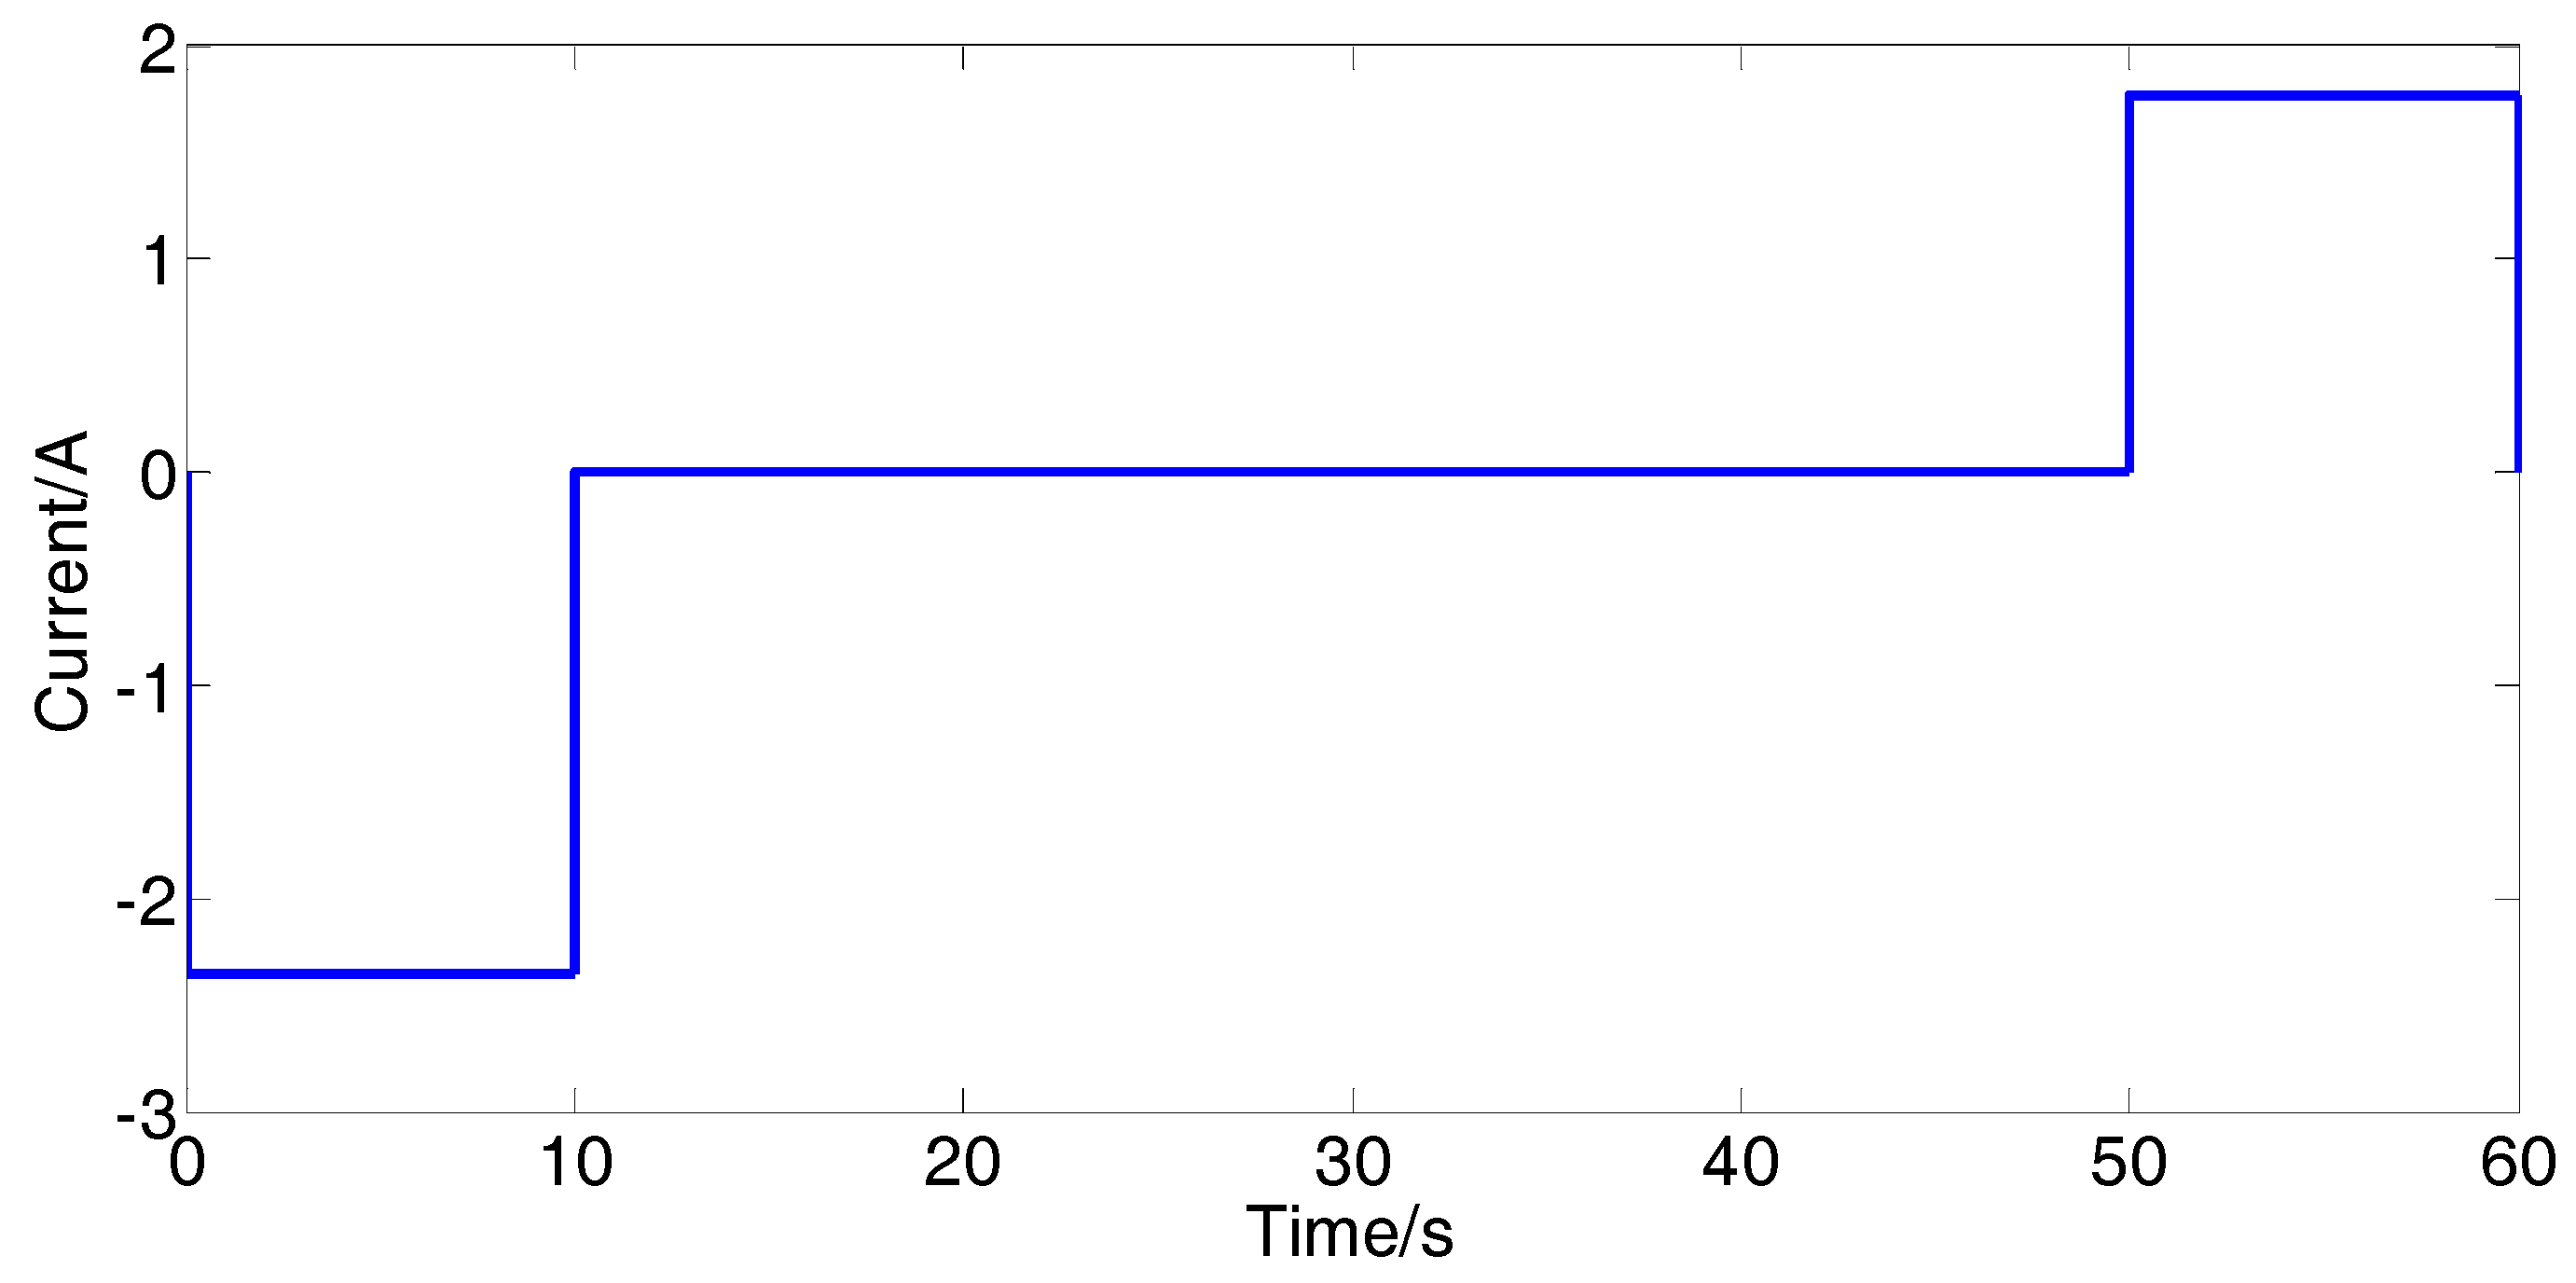
Figure 5.
Voltage response curves by HPPC test at different SOC.

Figure 6.
The varying curve of ohmic resistance with SOC.
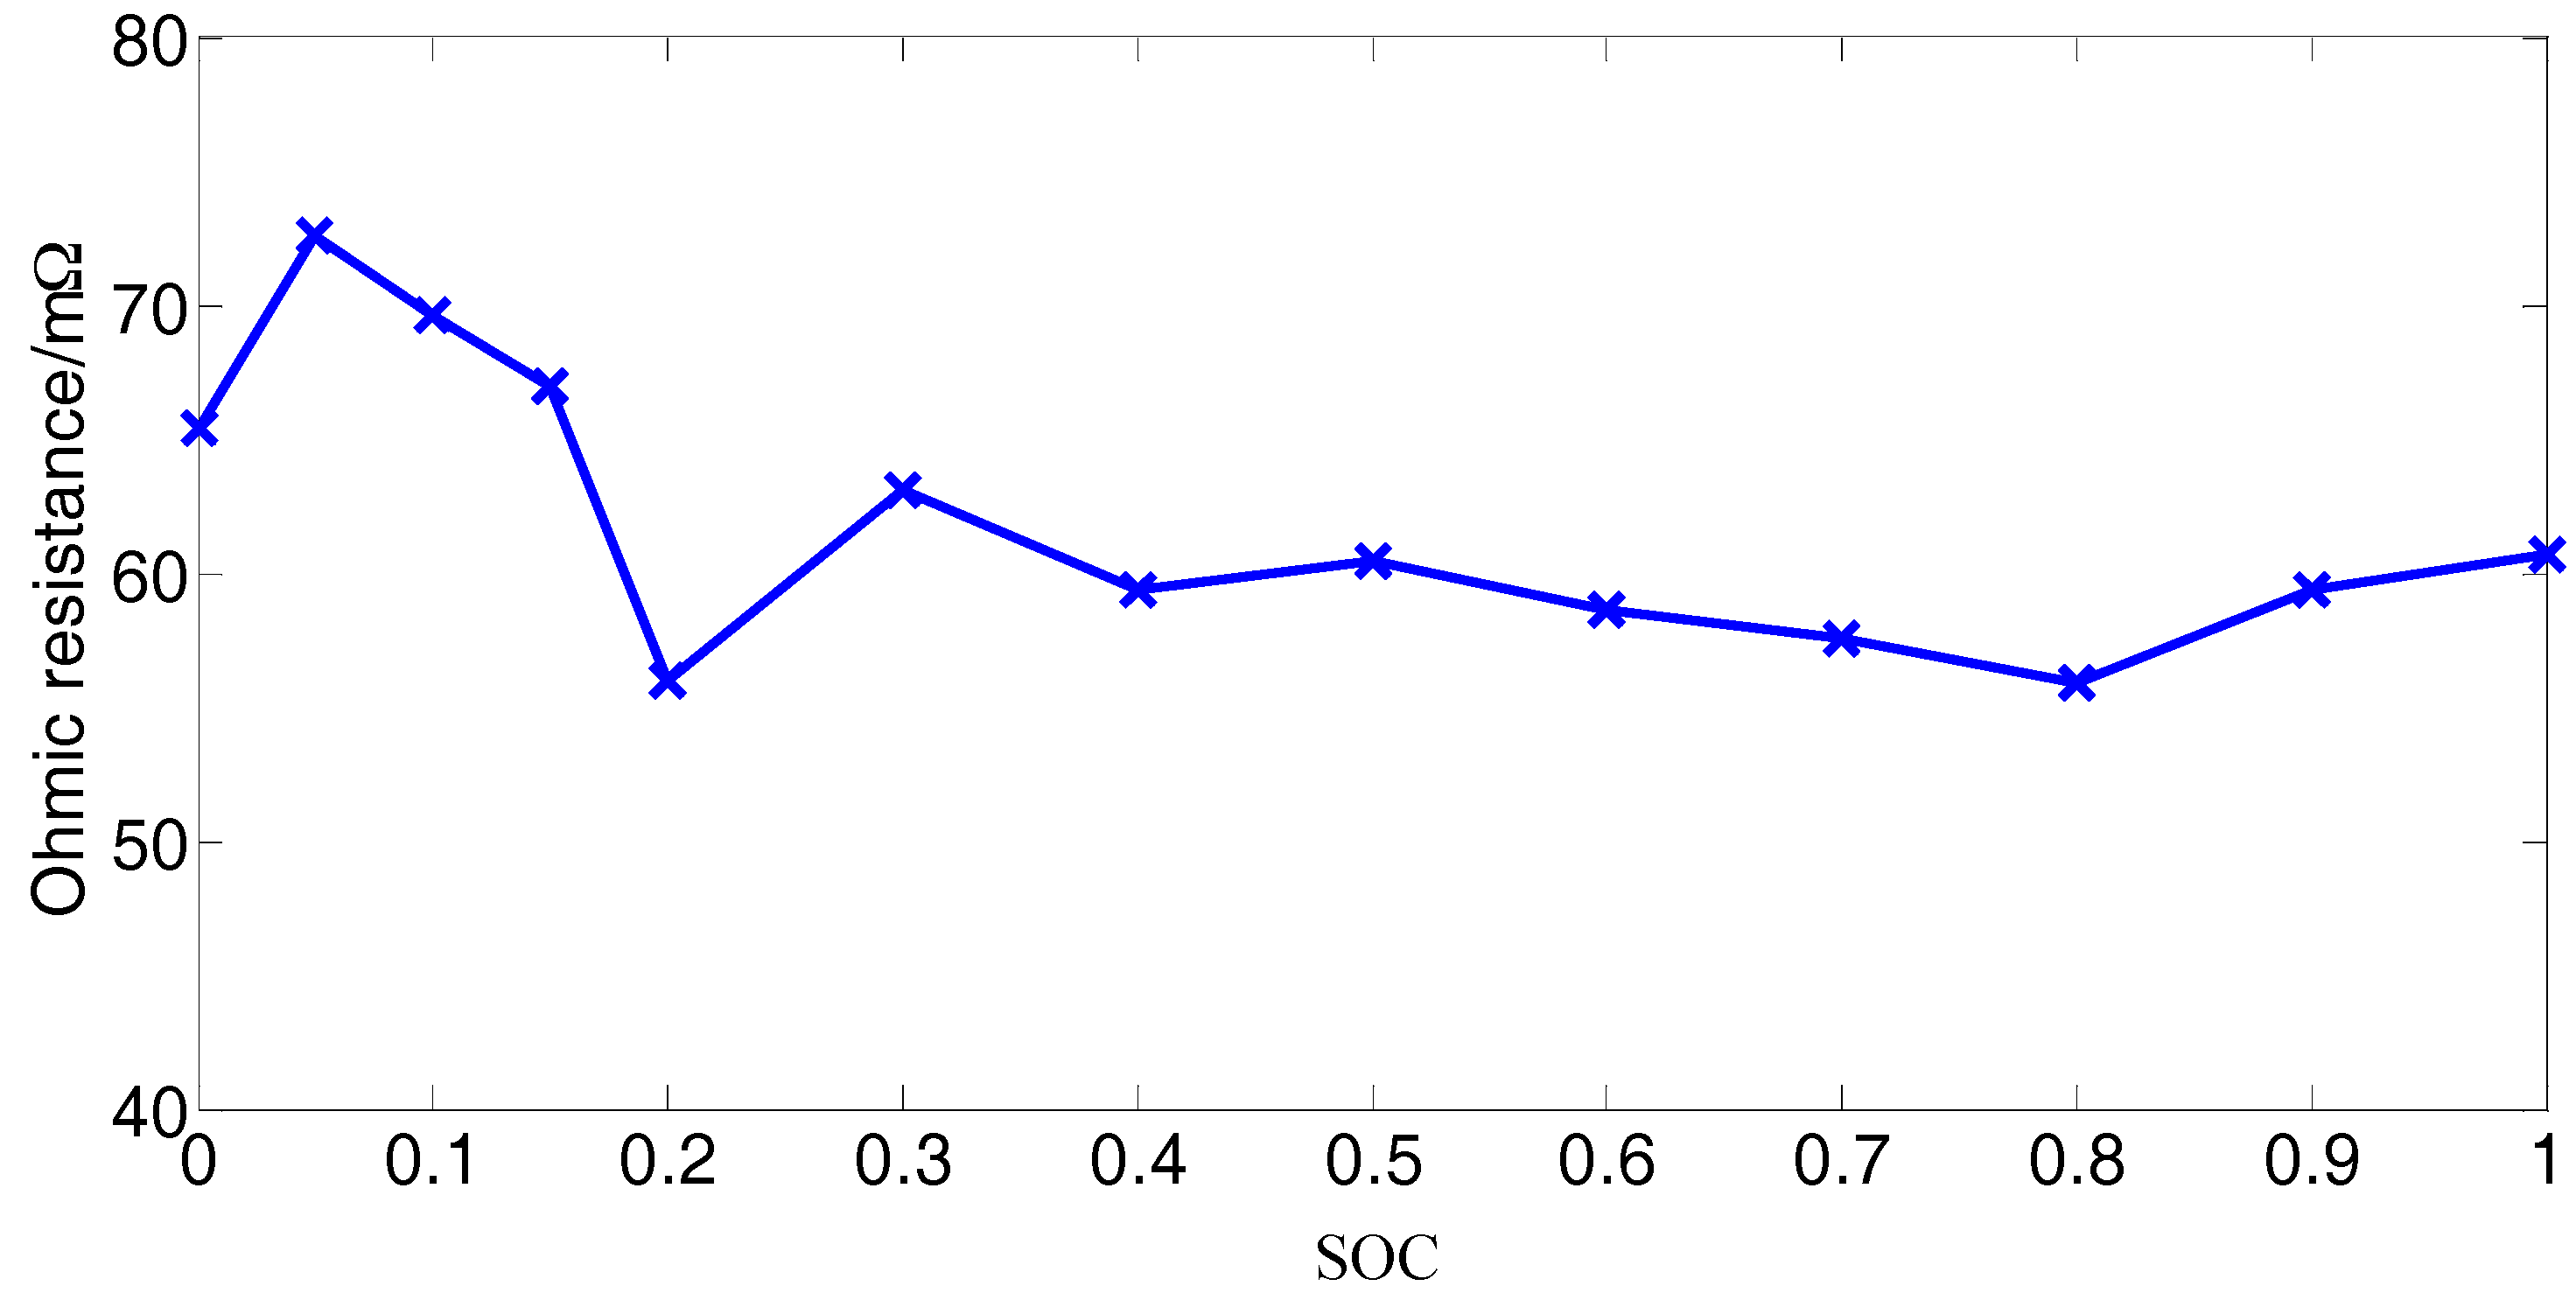
Figure 7.
The simulation model of the first-order RC model for Simulink simulation.
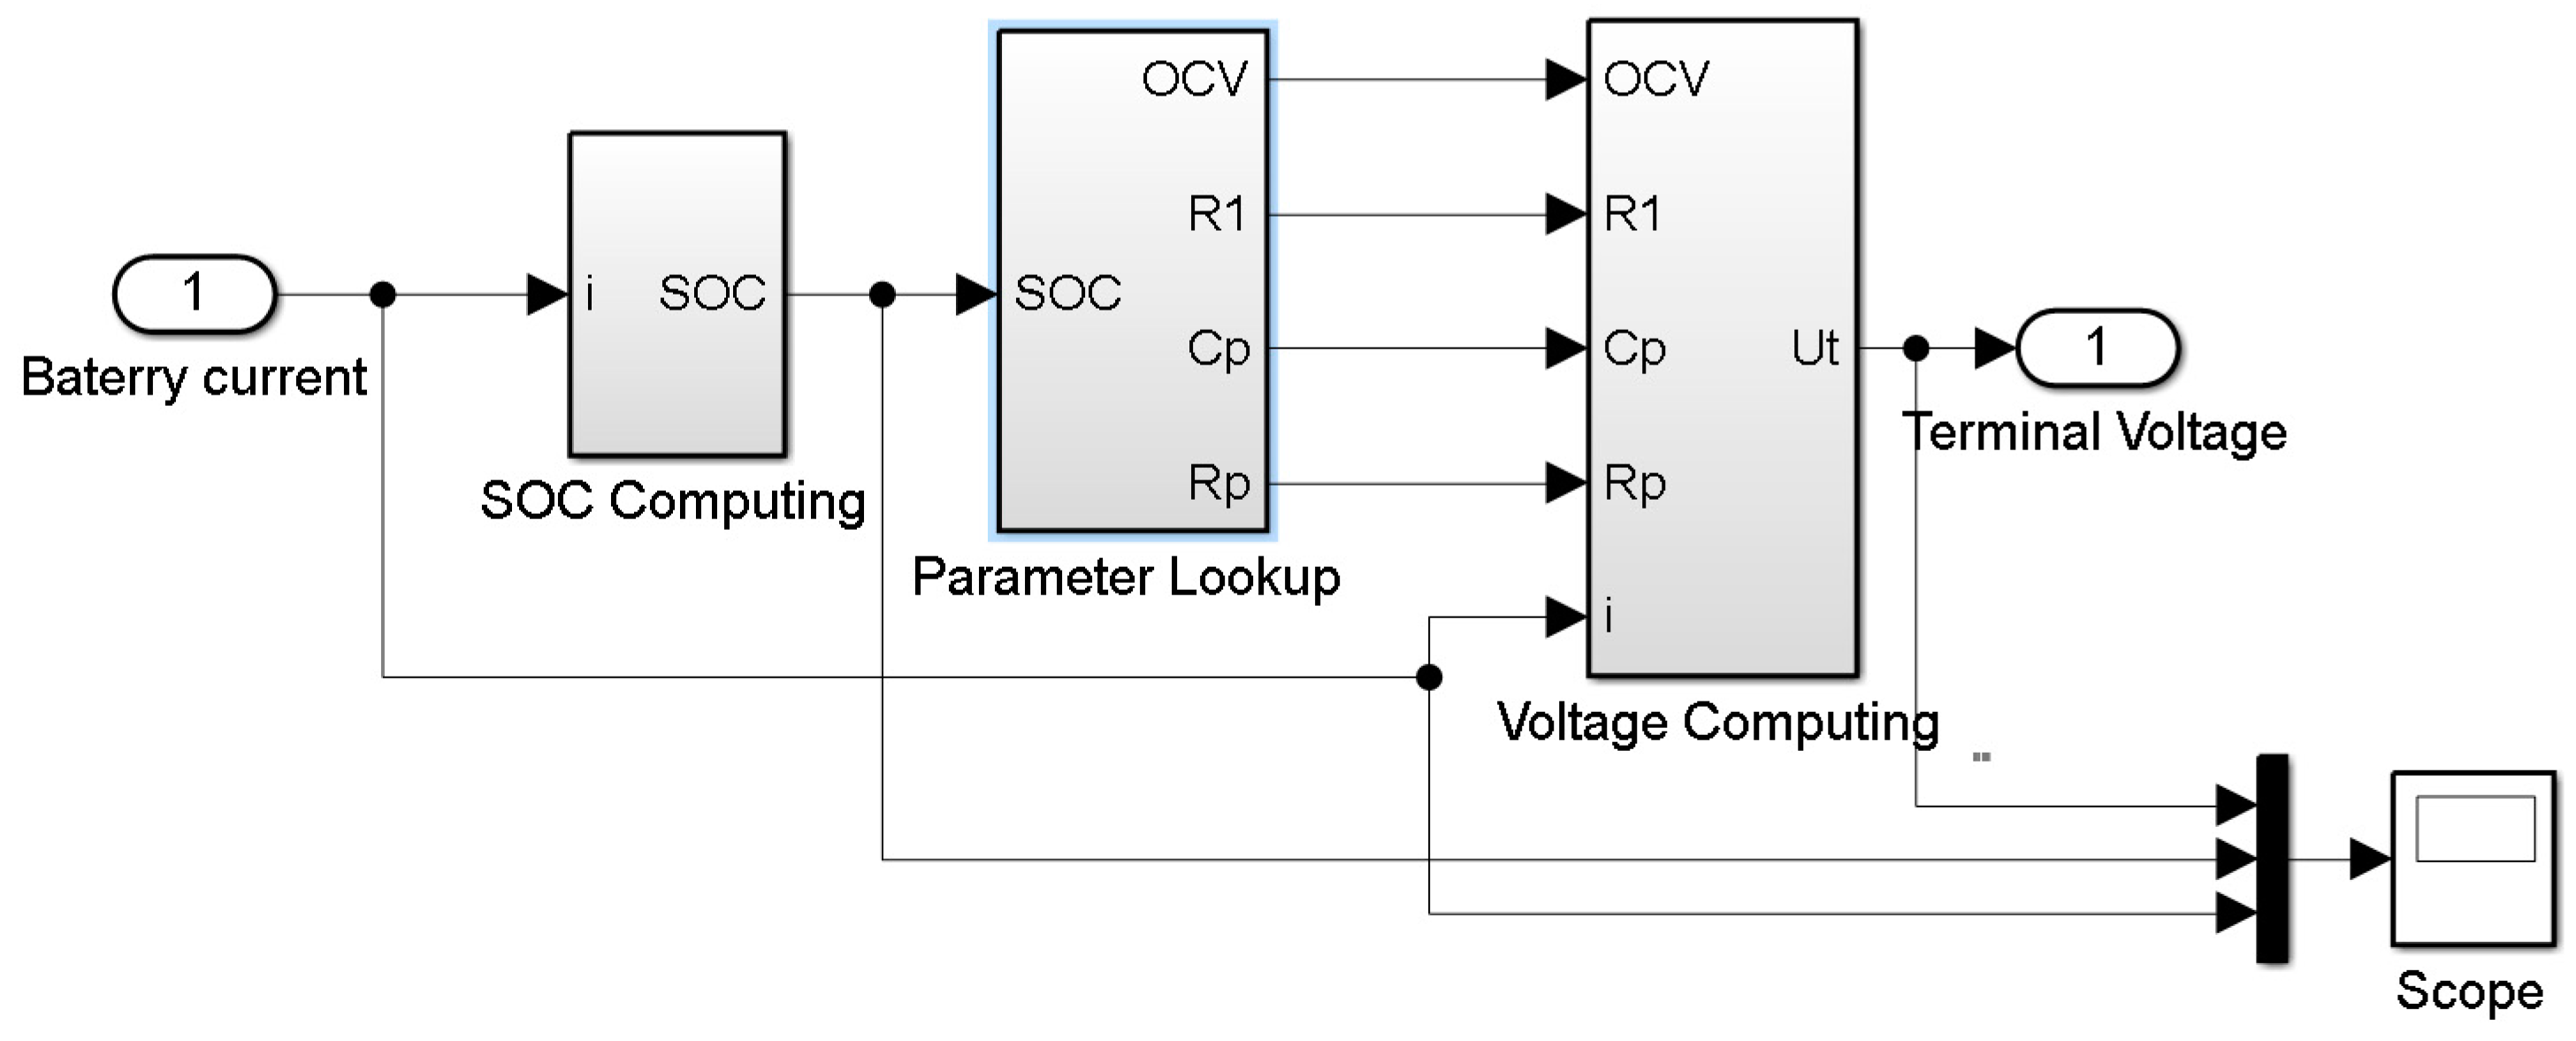
Figure 8.
The simulation model of the second-order RC model for Simulink simulation.

Figure 9.
The simulation model of the SOC calculation for Simulink simulation.

Figure 10.
The terminal voltage calculation submodule of the second-order RC model for Simulink simulation.
Figure 10.
The terminal voltage calculation submodule of the second-order RC model for Simulink simulation.

Figure 11.
The simulation output of the first-order RC model for 1C constant current discharging.
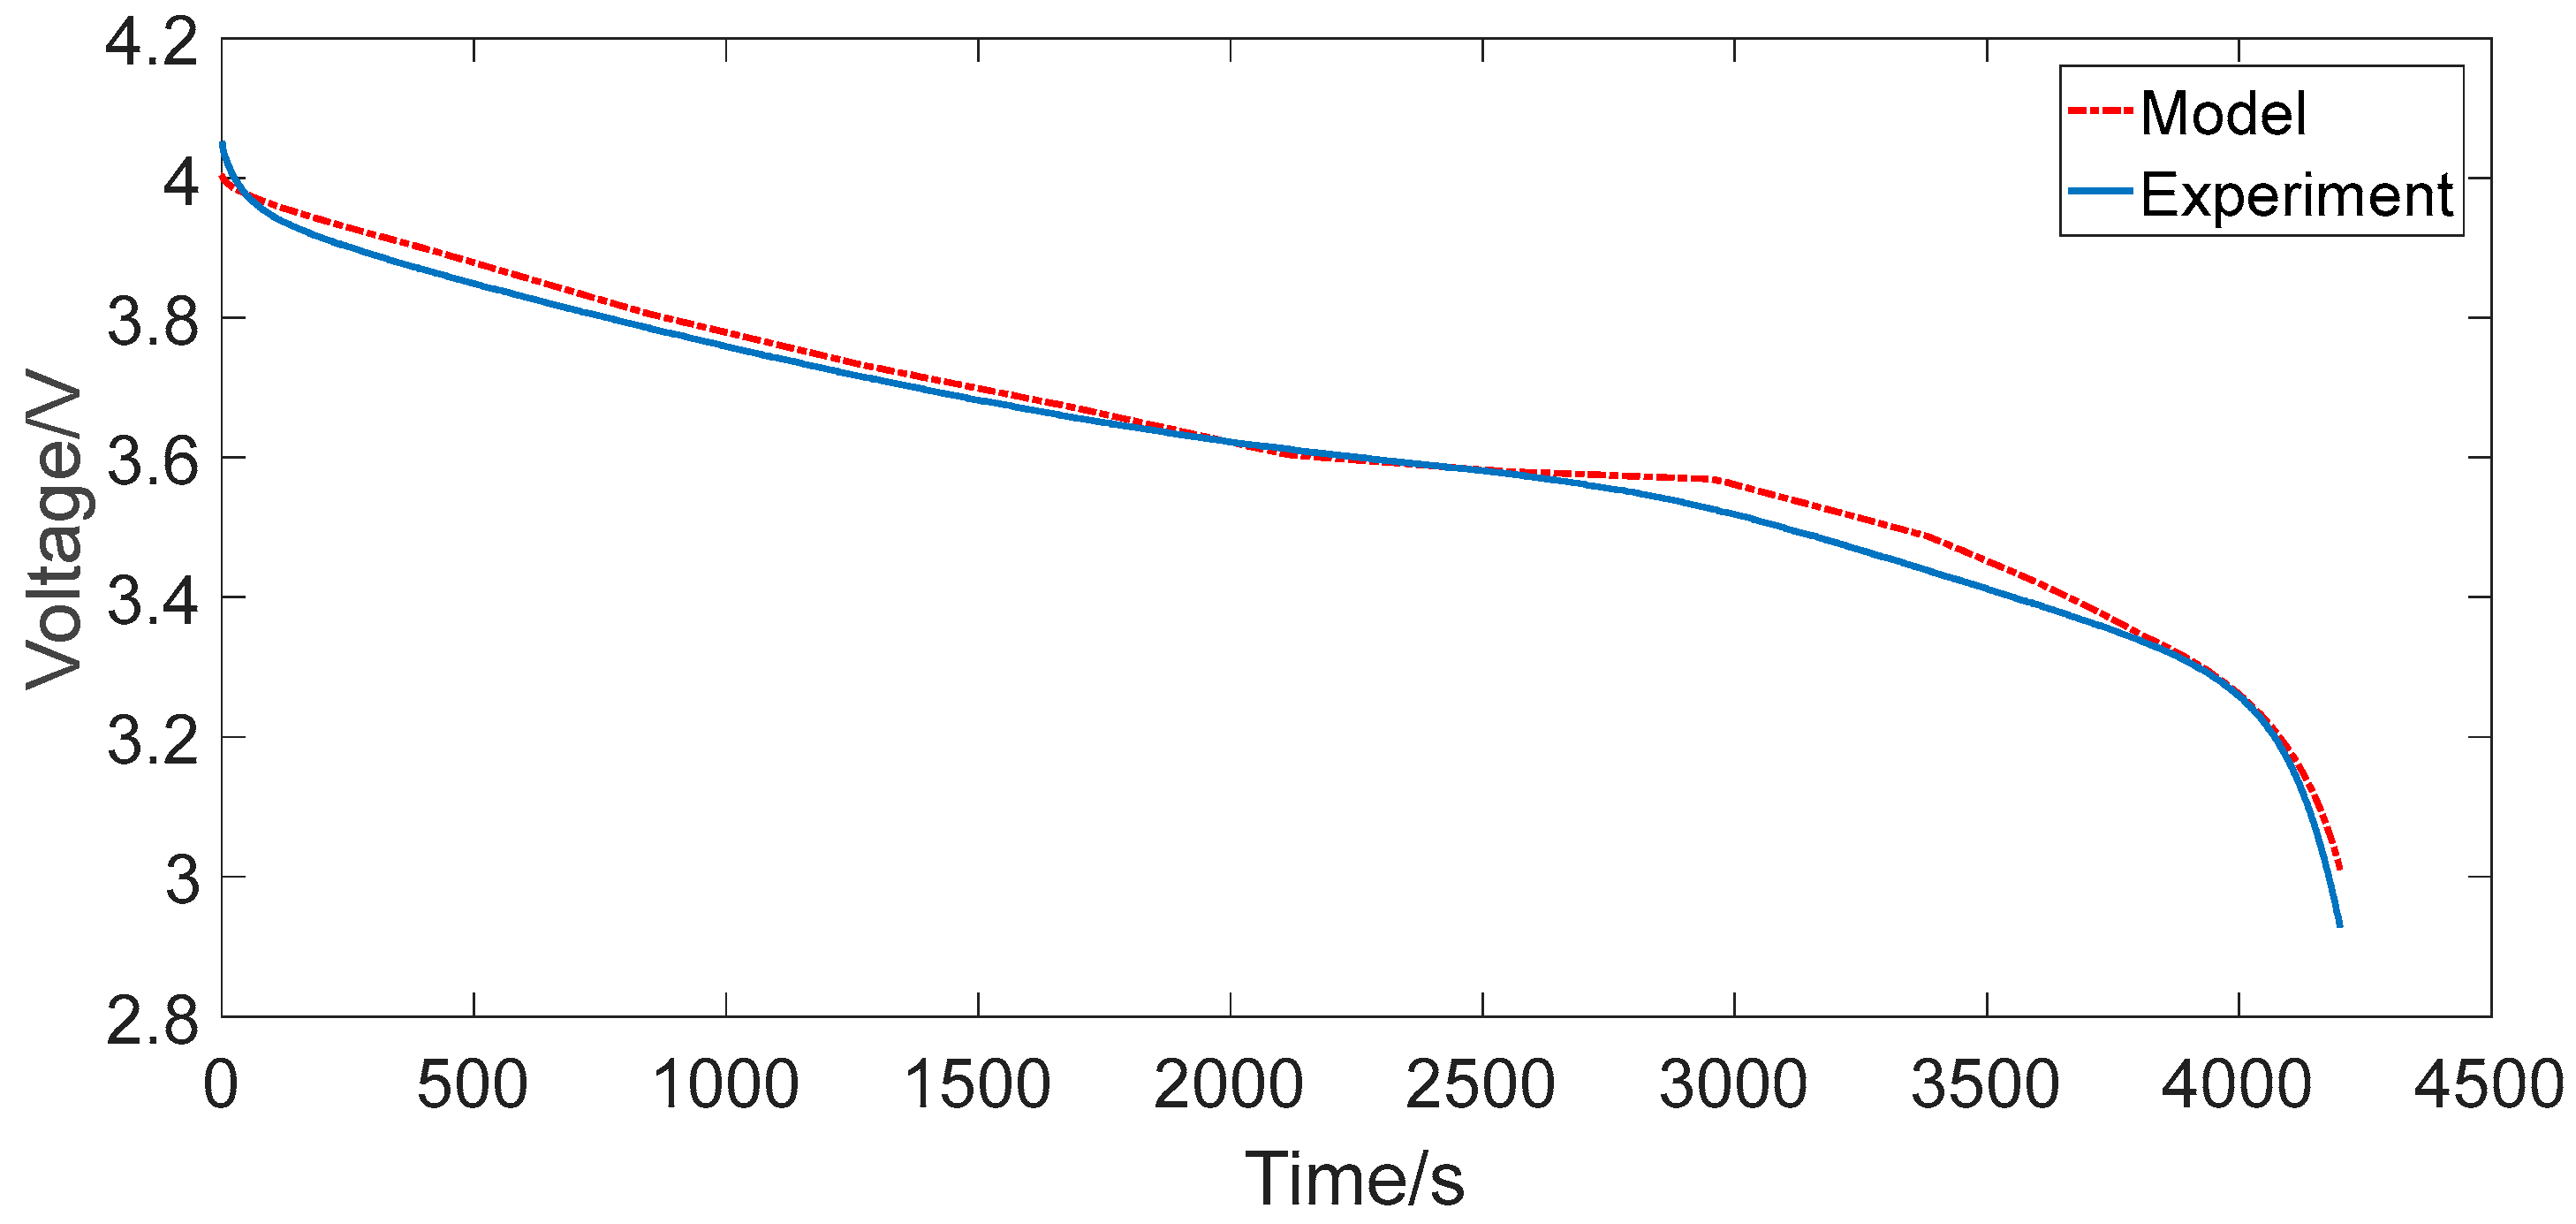
Figure 12.
The simulation output of the second-order RC model for 1C constant current discharging.

Figure 13.
Output errors of the first-order and second-order RC models for 1C constant current discharging.
Figure 13.
Output errors of the first-order and second-order RC models for 1C constant current discharging.
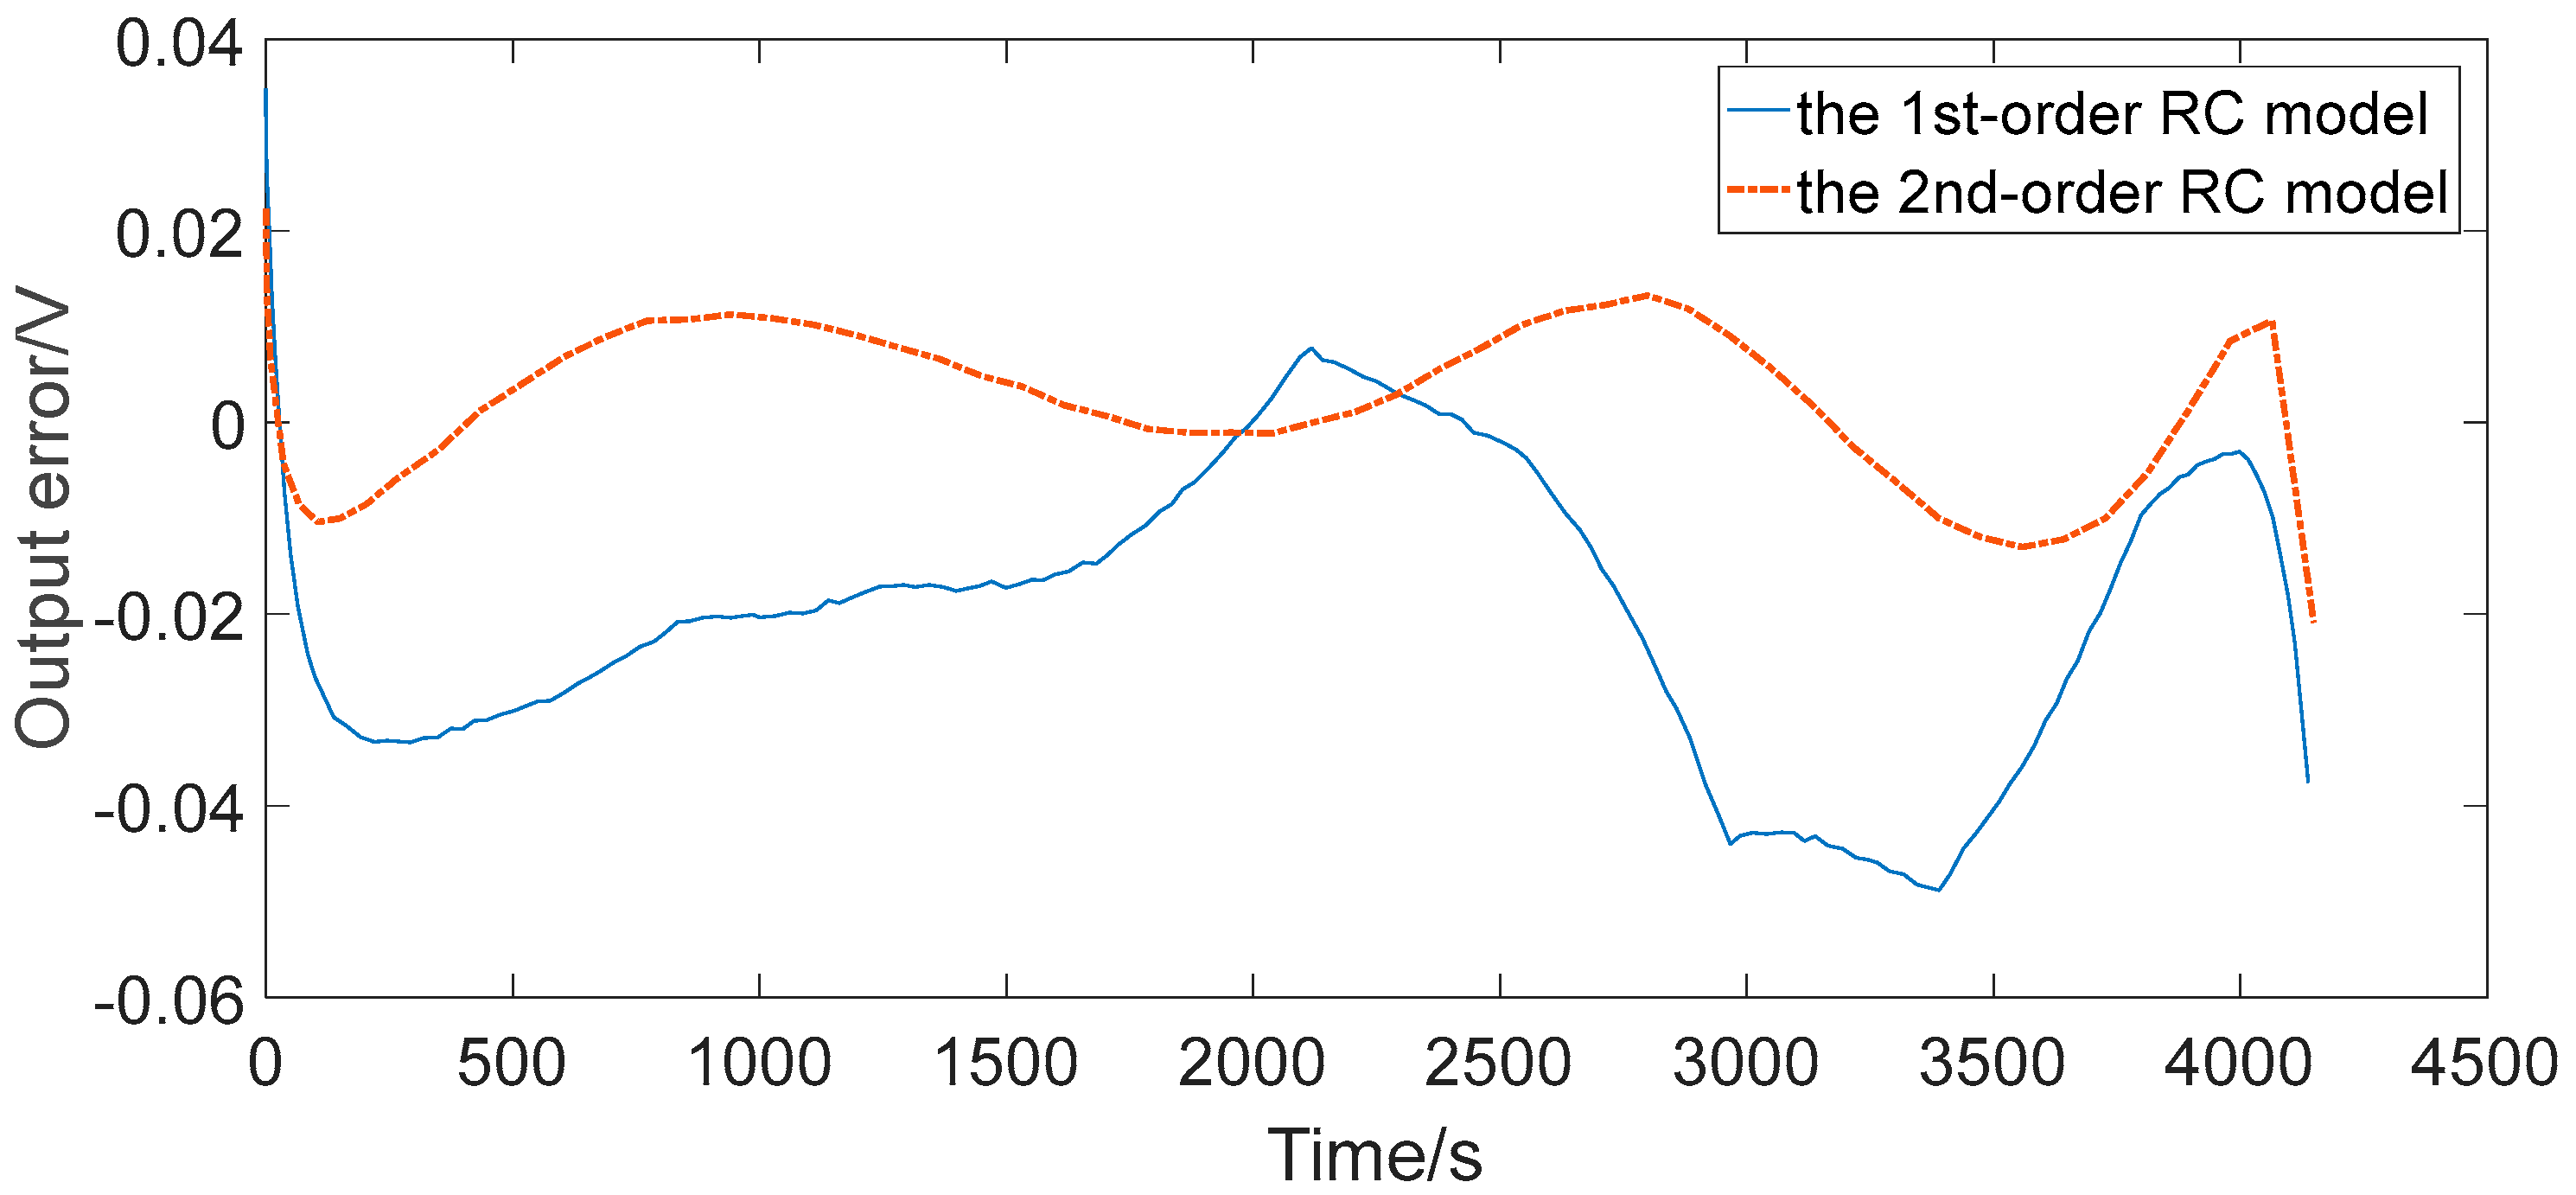
Figure 14.
The simulation output of the first-order RC model for the urban dynamometer driving schedule (UDDS) cycle.
Figure 14.
The simulation output of the first-order RC model for the urban dynamometer driving schedule (UDDS) cycle.

Figure 15.
The simulation output of the second-order RC model for the UDDS cycle.
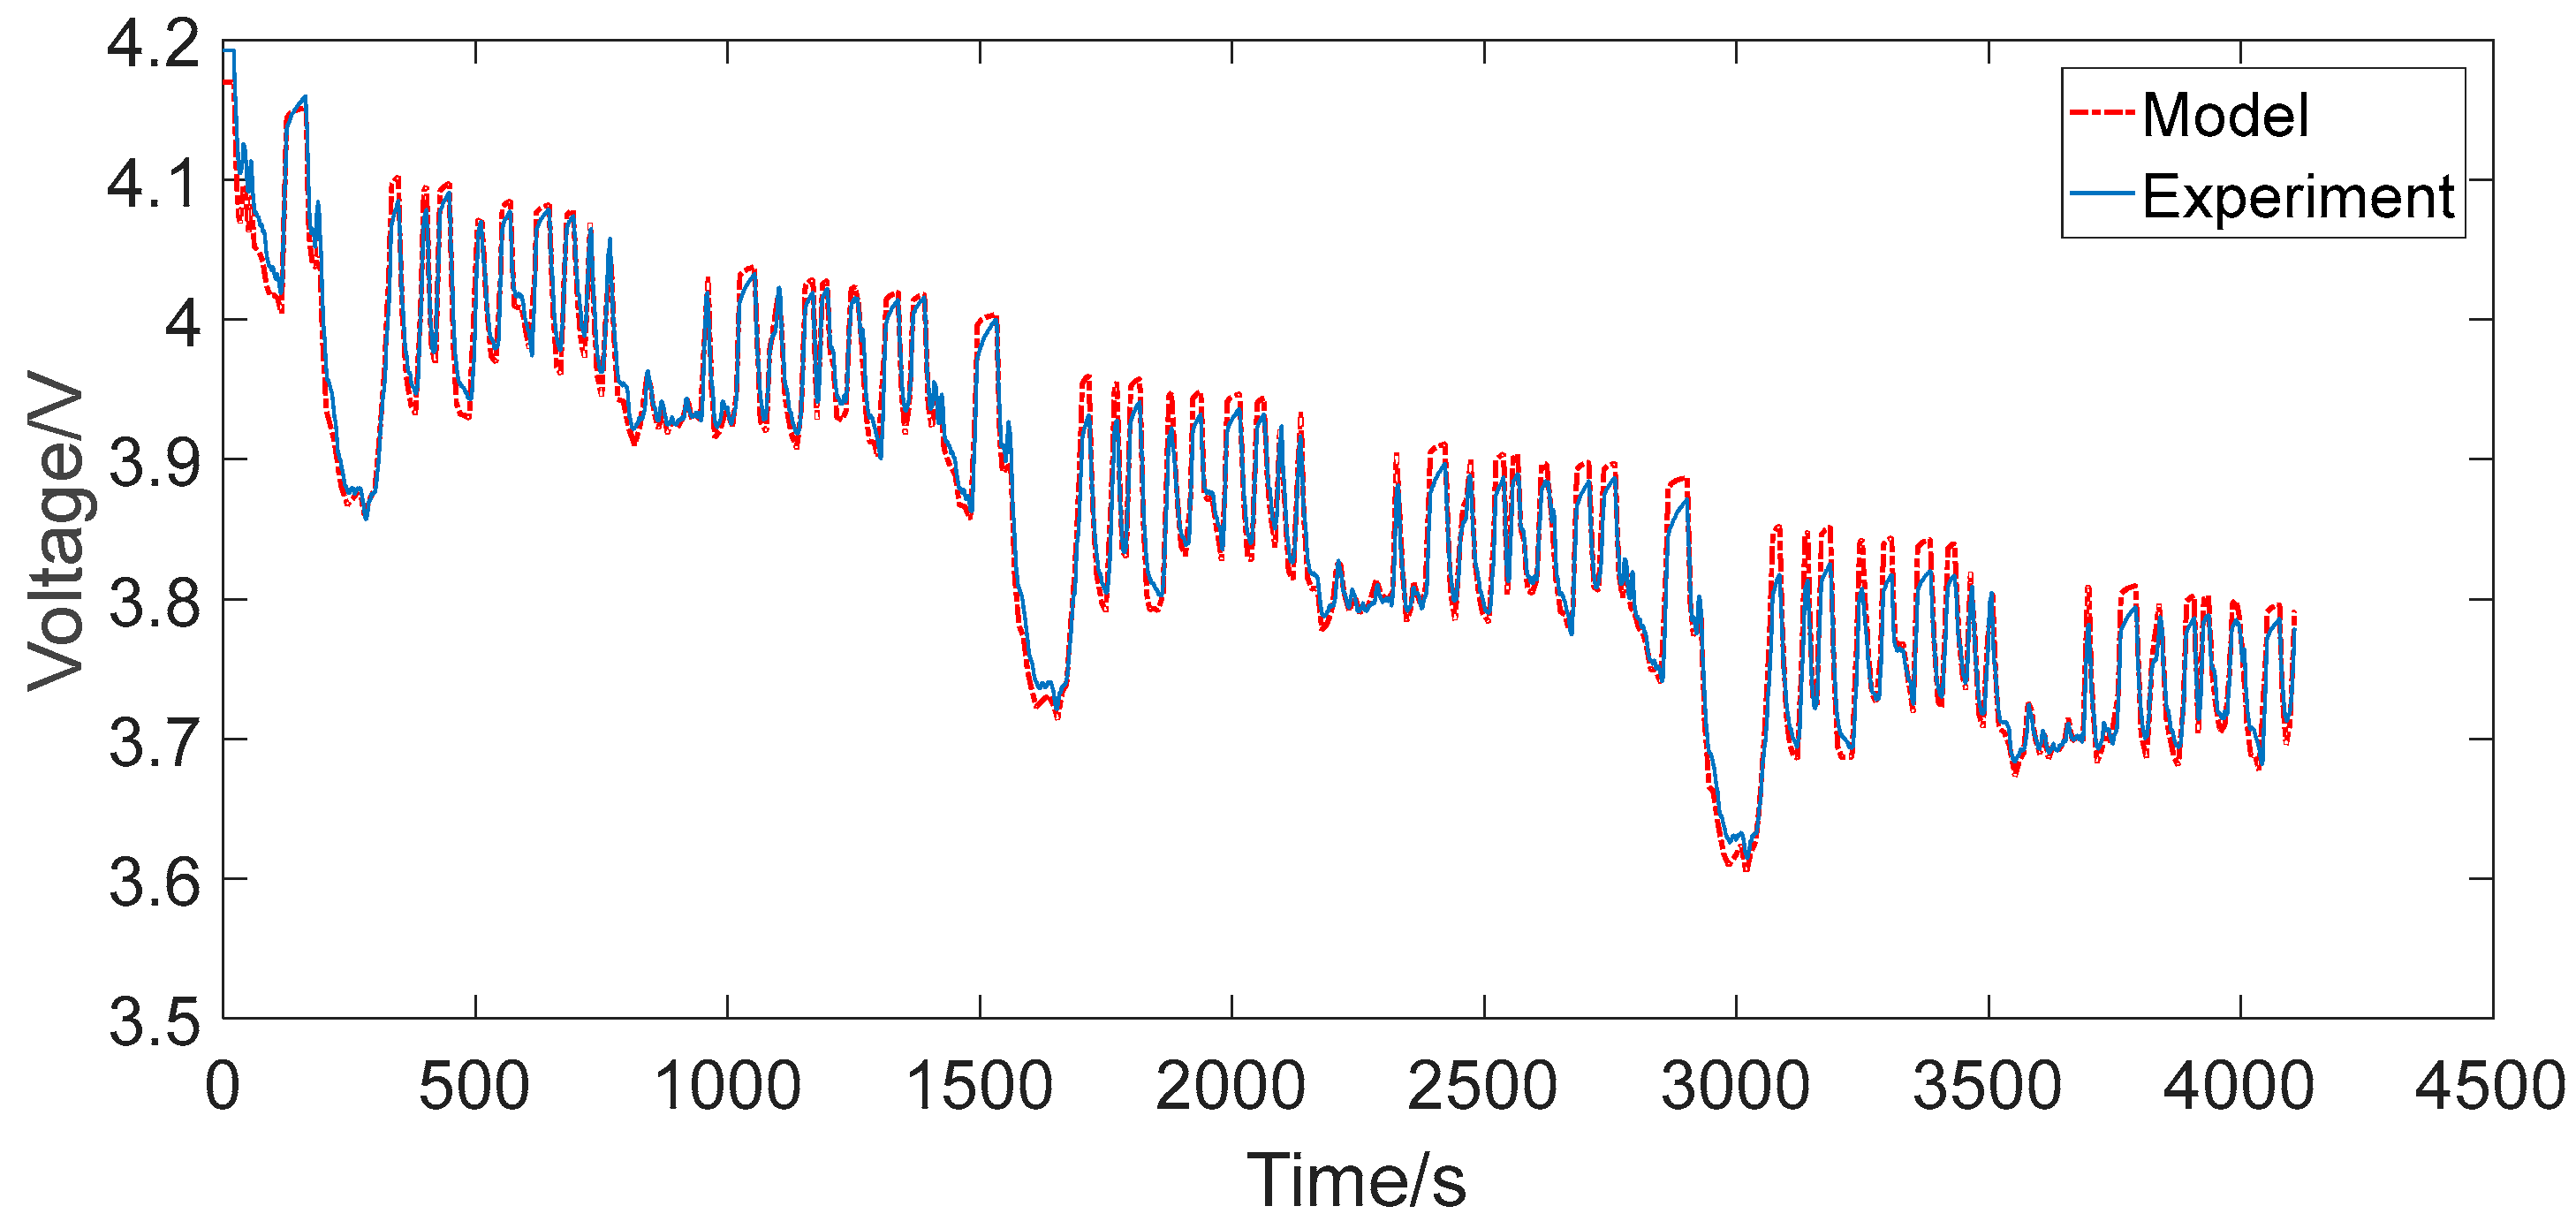
Figure 16.
Output errors of the first-order and second-order RC model for UDDS cycle.

Table 1.
The important parameters of the experimental scheme.
| BTS4000 Voltage Range (V) | BTS4000 Current Range (A) | BTS4000 Measuring Errors | Cell Nominal Capacity (mAh) | Cell Maximum Continuous Discharging Current (A) | Cell Limit Voltage (V) | Sampling Frequency | |
|---|---|---|---|---|---|---|---|
| Constant Current Discharge (Hz) | HPPC Test (Hz) | ||||||
| 0–10 | −6 to 6 | 0.5% | 2350 | 10 | 2.7–4.2 | 1 | 10 |
Table 2.
Polarization resistance and polarization capacitance values of lithium-ion batteries for the first-order RC model.
Table 2.
Polarization resistance and polarization capacitance values of lithium-ion batteries for the first-order RC model.
| SOC | τ1/s | R1/Ω | C1/103 F |
|---|---|---|---|
| 0 | 56.2430 | 0.0382 | 1.4743 |
| 0.05 | 42.8082 | 0.0263 | 1.6265 |
| 0.1 | 51.3875 | 0.0226 | 2.2758 |
| 0.15 | 47.5964 | 0.0244 | 1.9491 |
| 0.2 | 55.9597 | 0.0237 | 2.3622 |
| 0.3 | 34.7826 | 0.0203 | 1.7126 |
| 0.4 | 35.8938 | 0.0204 | 1.7612 |
| 0.5 | 41.9287 | 0.0211 | 1.9919 |
| 0.6 | 37.5657 | 0.0267 | 1.4049 |
| 0.7 | 40.6504 | 0.0242 | 1.6798 |
| 0.8 | 38.5654 | 0.0272 | 1.4178 |
| 0.9 | 37.3134 | 0.0235 | 1.5878 |
| 1 | 46.2321 | 0.0240 | 1.9287 |
Table 3.
The polarization resistance and polarization capacitance values of lithium-ion batteries for the second-order RC model.
Table 3.
The polarization resistance and polarization capacitance values of lithium-ion batteries for the second-order RC model.
| SOC | τ1/s | R1/Ω | C1/103 F | τ2/s | R2/Ω | C2/104 F |
|---|---|---|---|---|---|---|
| 0 | 1.4769 | 0.0334 | 0.0442 | 51.5996 | 0.0169 | 0.3044 |
| 0.05 | 5.5741 | 0.0051 | 1.0871 | 62.0732 | 0.0091 | 0.6801 |
| 0.1 | 5.2938 | 0.0041 | 1.2881 | 66.0502 | 0.0085 | 0.7804 |
| 0.15 | 7.8370 | 0.0043 | 1.8020 | 81.9001 | 0.0079 | 1.0314 |
| 0.2 | 5.3763 | 0.0040 | 1.3375 | 69.9301 | 0.0091 | 0.7719 |
| 0.3 | 18.7512 | 0.0072 | 2.6151 | 86.1204 | 0.0023 | 3.5084 |
| 0.4 | 15.5497 | 0.0045 | 3.4769 | 69.7350 | 0.0048 | 1.4490 |
| 0.5 | 2.9833 | 0.0025 | 1.1805 | 45.3309 | 0.0086 | 0.5300 |
| 0.6 | 7.1276 | 0.0047 | 1.5090 | 56.7859 | 0.0087 | 0.6500 |
| 0.7 | 6.7249 | 0.0052 | 1.2954 | 60.4230 | 0.0102 | 0.5897 |
| 0.8 | 4.6404 | 0.0047 | 0.9950 | 47.1254 | 0.0102 | 0.4634 |
| 0.9 | 5.3220 | 0.0049 | 1.0819 | 89.7116 | 0.0433 | 0.8196 |
| 1 | 10.8684 | 0.0043 | 2.5064 | 93.8967 | 0.0070 | 1.3357 |
Table 4.
The output error of the first-order and the second-order model for 1C constant current discharging. Root mean square (RMS): root mean square.
Table 4.
The output error of the first-order and the second-order model for 1C constant current discharging. Root mean square (RMS): root mean square.
| Model Type | Maximum Absolute Error (V) | Maximum Relative Error | RMS Error (V) |
|---|---|---|---|
| The first-order RC model | 0.0610 | 1.65% | 0.0221 |
| The second-order RC model | 0.0452 | 1.22% | 0.0156 |
Table 5.
The output error of the first-order and the second-order models for the UDDS cycle.
| Model Type | Maximum Absolute Error (V) | Maximum Relative Error | RMS Error (V) |
|---|---|---|---|
| The first-order RC model | 0.0695 | 1.88% | 0.0298 |
| The second-order RC model | −0.0628 | −1.69% | 0.0282 |
Table 6.
The area surrounded by the discharge curve of the first-order and the second-order models for UDDS cycle.
Table 6.
The area surrounded by the discharge curve of the first-order and the second-order models for UDDS cycle.
| Model Type | The Area Surrounded by the Discharge Curve (Vs) |
|---|---|
| The first-order RC model | 15,896 |
| The second-order RC model | 15,875 |
| Experimental data curve | 15,873 |
© 2017 by the authors. Licensee MDPI, Basel, Switzerland. This article is an open access article distributed under the terms and conditions of the Creative Commons Attribution (CC BY) license (http://creativecommons.org/licenses/by/4.0/).
Share and Cite
MDPI and ACS Style
Zhang, L.; Peng, H.; Ning, Z.; Mu, Z.; Sun, C. Comparative Research on RC Equivalent Circuit Models for Lithium-Ion Batteries of Electric Vehicles. Appl. Sci. 2017, 7, 1002. https://doi.org/10.3390/app7101002
AMA Style
Zhang L, Peng H, Ning Z, Mu Z, Sun C. Comparative Research on RC Equivalent Circuit Models for Lithium-Ion Batteries of Electric Vehicles. Applied Sciences. 2017; 7(10):1002. https://doi.org/10.3390/app7101002
Chicago/Turabian StyleZhang, Lijun, Hui Peng, Zhansheng Ning, Zhongqiang Mu, and Changyan Sun. 2017. "Comparative Research on RC Equivalent Circuit Models for Lithium-Ion Batteries of Electric Vehicles" Applied Sciences 7, no. 10: 1002. https://doi.org/10.3390/app7101002
Note that from the first issue of 2016, this journal uses article numbers instead of page numbers. See further details here.