Cyber–Physical–Social Frameworks for Urban Big Data Systems: A Survey


1
Institute for Communication Systems (ICS), University of Surrey, Guildford GU2 7XH, UK
2
Evrythng Limited, Unit 4, 122 East Road, London N1 6FB, UK
*
Author to whom correspondence should be addressed.
Appl. Sci. 2017, 7(10), 1017; https://doi.org/10.3390/app7101017
Submission received: 9 August 2017
/
Revised: 25 September 2017
/
Accepted: 26 September 2017
/
Published: 2 October 2017
Abstract
:The integration of things’ data on the Web and Web linking for things’ description and discovery is leading the way towards smart Cyber–Physical Systems (CPS). The data generated in CPS represents observations gathered by sensor devices about the ambient environment that can be manipulated by computational processes of the cyber world. Alongside this, the growing use of social networks offers near real-time citizen sensing capabilities as a complementary information source. The resulting Cyber–Physical–Social System (CPSS) can help to understand the real world and provide proactive services to users. The nature of CPSS data brings new requirements and challenges to different stages of data manipulation, including identification of data sources, processing and fusion of different types and scales of data. To gain an understanding of the existing methods and techniques which can be useful for a data-oriented CPSS implementation, this paper presents a survey of the existing research and commercial solutions. We define a conceptual framework for a data-oriented CPSS and detail the various solutions for building human–machine intelligence.

1. Introduction
The emerging computing paradigm of Cyber–Physical–Social Systems (CPSS) builds on the technology developments in Cyber–Physical Systems (CPS) and Cyber–Social Systems (CSS) [1,2,3]. As depicted in Figure 1, a variety of sensors and actuators monitor the behavior and phenomena in the physical world and the resultant data are moved to the cyber world, where they are analyzed to infer the state of the physical world and generate corresponding digital representations of the involved physical entities [4,5]. The digital representation is used to derive knowledge about the state of the physical world and to optimize and control it through actions implemented through actuators. The related research area that is concerned with the integration of physical processes and computation in order to merge the physical and cyber world is termed CPS [6]. The Internet of Things (IoT) paradigm, which seeks to interconnect computers to objects with self-configuring capabilities, plays an important role in the convergence of the physical and cyber worlds by ensuring secure and energy-efficient transfer of information (in both directions) between them [5]. The confluence of CPS with IoT has resulted in an impactful association of the physical world observations, sensed by the connected smart objects, with the computational processes of the cyber world. It has enabled modeling and reasoning of the physical phenomena, which coupled with efficient communication and data processing, can result in effective actuation [7].
The variety of devices that can monitor the physical environment, as depicted in Figure 1, encompass fixed sensor network installations (e.g., Wireless Sensor Networks (WSNs) for environment monitoring [8,9,10], smart home installations [11] and sensor deployments for air quality monitoring [12]). The high installation cost of fixed sensor networks and insufficient spatial coverage has led to mobile sensing initiatives, primarily by city authorities [13], which involve sensors mounted on public transportation vehicles (e.g., for environment monitoring [14,15,16]).
The growing use of sensor-enabled smartphones and tighter interactions between them and their users means that such personal devices are becoming important tools to sense and inform about the ambient environment. Large numbers of such mobile smartphone users can then form a versatile sensing source, providing localized information, e.g., noise levels [18], traffic conditions [19], etc. This sensed information can then be aggregated and analyzed by the processes in the cyber world. Analogously, increasing numbers of people sharing information, in near real-time, about city-related events (e.g., traffic incidents [20,21] or earthquakes [22]) on online social networking platforms means that they can act as a complementary or corroborative information source of city dynamics [20]. The related technology paradigm, termed CSS, uses data on social behaviors and relationship analysis to provide relevant information services [1], for example, to discover neighborhoods and communities in a city or discovering the functions of different urban regions [23,24,25,26,27]. The technology paradigm that considers human and social dynamics as an integral part of CPS is termed CPSS [28]. CPSS are characterized by a deep interplay between sensors, actuators and smart objects that reside in the physical world; “richer technology-mediated social interactions” [29] and advanced reasoning applied to the collective intelligence.
Smart cities are typical CPSS, being made possible by deployments of low-cost sensors, government initiatives on openly available city-centric data and citizens sharing and exchanging city-related messages on social networks. The vast amounts of data obtained by the sensing of physical phenomena by distributed sensor networks and those contributed by city inhabitants through their sensor-enabled smartphones and on online social networks, can offer near real-time large-scale sensing for intelligence mining to facilitate responsive and intelligent services in urban settings [13]. Extracting knowledge out of the data, typically through big data analytics techniques, can help to build a picture of urban dynamics, which can enable intelligent applications and services, and guide decision-making, both for city authorities and city inhabitants [21]. Implementations of CPSS applications are emerging in everyday life in smart urban systems, in domains as varied as command and control, smart environments, smart transportation, smart social production systems and so on [19,30,31,32,33,34,35]. Such applications rely on efficient monitoring of the urban physical infrastructure and ambient environment and combine the collected data through intelligent cyber processes to deliver improved services to citizens; for example, by adjusting traffic signal timings based on vehicle and cyclist arrival information [19,36], developing sustainable waste management systems [37] and recommending events/venues based on citizen preferences, proximity, road and environment (pollution levels) conditions [38,39]. The resulting urban big data system offers the potential of creating more sustainable and environment-friendly future cities [40].
While a number of CPSS implementations have focused on architectural views including fog [41] and cloud-based implementations [42] as well as multivariate data distribution platforms [43], a more data-centric view is needed to realize CPSSs for urban areas [40]. Such a data-centric perspective can help to create abstractions of the high-dimensional and high-volume data generated and exchanged by the heterogeneous devices, which can then be analyzed and fused through analytics and reasoning techniques to build city intelligence. As the sensed physical world data is largely dependent on its surrounding environment, external information (e.g., locations, time, events gleaned from mobile crowd sensing that may influence sensed data) needs to be taken into account to derive relevant knowledge.
A number of recent studies have reviewed urban CPSS from different aspects, with some focusing on the development stages of CPSS and the applicability of different system-level design methods for CPSS design [1,44]. Shih et al. [45] review the middleware, computation model, data quality and run-time environments necessary for smart building and smart city implementations, while Salim et al. [46] survey approaches for engaging human interaction with urban computing technologies. A survey of mobile crowd sensing approaches [13] that is closely aligned to this paper, presents a taxonomy based on the data collection steps, processing architecture and resulting applications. In contrast to these surveys, this article collects works on urban CPSS implementations and organizes them from a data perspective. The reviewed works are those that include all the three aspects of cyber-physical-social, i.e., the data collected involves both the physical world and mobile crowd sensed (social) data that is manipulated through various data processing techniques to fuse them together for collective urban intelligence. Both research studies and commercial solutions are reviewed, with a focus on methods for cross-space data fusion and collaborative sensing techniques. Thus, this paper makes the following contributions to the field of CPSS:
- A conceptual framework for urban CPSS from the data perspective, based on the recognition, in current state of the art [29,46,47], of the need for multitier computation and abstraction methods (along the lines of the data–information–knowledge–wisdom (DIKW) pyramid proposed in [29]) to meet the challenges of dealing with big data in urban CPSS.
- An analysis of the state-of-the-art data analytics and cross-space data fusion methods for integrating sensor data with social intelligence.
- Categorizations of techniques adopted by existing works relevant to the different layers of the identified conceptual framework.
The remainder of this article is organized as follows: Section 2 presents the background on the development of CPSS and its relation to the related concepts of CPS, IoT and human-in-the-loop CPS. Section 3 compares the reviewed works along the identified dimensions and introduces the proposed CPSS conceptual framework, detailing the different layers that are necessary from a data-centric perspective. Section 4, Section 5, Section 6 and Section 7 present the details of the processes and corresponding existing solutions for each of the different layers of the framework, including data collection, processing, fusion and resulting application areas, respectively. Challenges and promising research areas are discussed in Section 8, with conclusions drawn in Section 9.
2. Background of Cyber–Physical–Social Systems
Figure 2 shows the development of the CPSS paradigm, depicting the relevant background concepts and technological disciplines on which it is based. Moving from the bottom to the top of the inverted triangle in the figure represents increased levels of abstraction and increasing data volume.
Studies on CPS development [44,48] trace the beginning of its evolution to mechatronic systems [49], which combine the disciplines of mechanical, control and electrical engineering in industrial processes. Examples of mechatronic systems include drive train and vehicle vibration analysis study [50]. In terms of abstraction, at this level, the design processes are well-defined and support the translation of the designed procedures into the physical systems [44]. In embedded systems, the focus is on the computational system embedded within a physical system (where the execution of the code takes place), example being a thermostat.
CPS frameworks, which are designated to be successors of embedded systems [34], integrate computing with communication technology, together with control methodology. CPS are typically concerned with the sensing and control of physical phenomena through networks of interconnected devices to achieve defined goals. The field, which started from an engineering perspective, deals with the control and monitoring of physical environments through a tightly coupled distributed system of sensors and actuators [7]. Such systems have been geared towards disseminating the data sensed by mobile CPS with minimal delay to provide real-time services [51]. Examples of CPS implementation include adaptive air ventilation systems [52] and the MediaCup [53], which detects the temperature of the contents and warns users if it is too hot. In terms of abstraction and the relationship between the physical and cyber parts, it is defined by function [44].
The concept of IoT is closely linked with that of CPS in recent studies, with disparate views on the similarities and distinctions between the two concepts. Some studies [46] assert that while CPS focus on bridging the physical and cyber worlds, IoT is concerned with the unique identification of heterogeneous devices and smart objects and their connectivity to the Internet. Some authors [4] state that while there are similarities between CPS and IoT, i.e., device cooperation to reach defined goals, IoT has a horizontal view comprised of hardware components interacting with each other, whereas CPS takes a vertical approach encompassing networked hardware, computational processes and control mechanisms. Other studies [45], while acknowledging the difference in system architectures of CPS and IoT, refer to them interchangeably. An increased level of abstraction in IoT is attributed to a large number of undefined factors, which are known only in terms of contribution to the system operation [44].
In contrast to classical CPS, recent studies have recognized the importance and possibility of human-in-the-loop (HiTL) CPS which involve control loops with humans interacting as inherent actors in it. Such HiTL systems are mainly individual-centric in that the focus is to learn the human state, including physical, emotional and physiological condition, through brain-computer systems, enabling adaptability to human needs. In such systems, “humans need to be instrumented and be an integral part of the system” [46], which is recognized as infeasible and undesirable in urban computing scenarios [46]. HiTL systems have applications in areas such as assisted living, brain–computer systems and factory settings with a human in the control center. Studies surveying HiTL systems include a survey of the field by Nunes et al. [7], and by Lee et al. for medical CPS [54].
Finally, CPSS integrate the various data originating from the physical, cyber and social spaces through fusion techniques to provide human-understandable abstractions and inferences. CPSS implementations in urban settings are geared towards reacting to the physical world and deriving knowledge of its state.
3. Data-Centric Cyber–Physical–Social Urban Big Data Systems
There have been a number of recent initiatives on data-oriented CPSS architecture implementations. However, these have largely orientated towards a particular focus, for instance, the underlying technologies being used (e.g., semantic web-based mechanisms [38,55]), data abstraction requirements [56] or application [33,57].
To arrive at a conceptual framework for urban CPSS, we start from the well-documented layer diagram [4] of a CPS, as shown in Figure 3a. The elements of a CPS implementation are recognized to include the sensor and actuator networks that sense and interact with the physical world; control components that retrieve the sensor data, perform local processing and manage the actuators in accordance to specified goals; data analytics (software) components that are responsible for the storage, processing and filtering of data obtained from the control elements; computation elements that are used to adapt the CPS to internal or external changes through “switching between operation modes” [4]; and communication elements that encompass a variety of technologies to support connectivity in the system.
For a data-oriented perspective of a CPSS implementation in urban settings, the emphasis needs to be on the data sourcing, collection and analysis mechanisms in order to obtain city intelligence [29,40]. Thus, we recognize that the communication elements are not the focus in a CPSS framework conceptualization since they can be assumed to be taken into account by the public/private institutions deploying the sensor networks (e.g., wired or wireless networks for data transfer), part of the enabling technologies (3 G, 4 G or WiFi networks) in the case of mobile crowd-sensing by smartphone-accompanied citizens or implicitly present as is the case in crowd observations posted on online social networks. Since urban CPSS are not designed to be tightly bound control loop architectures, the control and computation elements are also not translated into a CPSS conceptualization. Furthermore, it has been recognized in the current state of the art that CPSS computing requires multitier computation based on the DIKW dimensions, supported by mechanisms that deliver increasing abstractions to make the data human-understandable [29]. Each level of such a multi-tiered framework consists of a series of horizontal and vertical operators, with the horizontal operators responsible for mapping the multimodal data to common concepts to support integration within each level; and the vertical operators in charge of the translations from raw data to higher-level knowledge. We thus identify the following requirements of a data-driven CPSS framework, derived from the layer architecture of [40]:
- Collaborative sensing sources: since different sources may provide data about the same physical resource (i.e., location, phenomenon, etc.) from different aspects due to their inherent capabilities, the resulting data must be combined to achieve collaborative sensing. Smartphone-carrying citizens are valuable sensing resources due to their inherent mobility around different parts of a city, together with observations made by citizens on online social networks about specific city-relevant situations. Citizen-contributed data can be a cooperative source of relevant data to complement that obtained from physical sensor networks.
- Data analysis: in addition to preliminary steps such as data cleaning, redundancy elimination, etc., data analysis should consider the inherent correlation between the data from different spaces (i.e., online or physical world) through detection of patterns and thematic–spatiotemporal context relevance [58]. Thematic–spatiotemporal context awareness consists of associating the physical world numerical sensing data with external influencing information (e.g., locations, time, events that may influence sensed data), since urban data is often highly localized.
- Cross-space data fusion: with the multimodal data collected from heterogeneous data sources, advanced mining techniques are needed to fuse the data which may be in different scales of measurement [59], for instance, physical sensor data which is usually in interval or ratio scale (involving quantitative variables) and open datasets which correspond to nominal or ordinal scale (involving qualitative classifications).
Following the identification of the requirements, the layers for the proposed conceptual framework can be identified to consist of four layers: data sources, data processing and analytics, data fusion, and applications, as shown in Figure 3b.
Data sources: this layer involves heterogeneous data sources for gathering urban data, including data from both fixed and mobile sites as well as user-contributed data. The corresponding data collection mechanisms cover a wide range, including data upload and retrieval from sensor gateways through Representational State Transfer (RESTful) Application Programming Interface (API) [60] or Constrained Application Protocol (CoAP) [61], opportunistic data transmission from mobile sensors [15,62], such as those mounted on public transport vehicles. User-contributed data involves citizens explicitly uploading data from their sensor-rich mobile phones as well as urban data information extracted from online social networks.
Data processing: this layer details the various machine learning-based or logic-based data processing methods that are employed in the state of the art to derive information from the physical sensor networks data or from user data, usually in isolation, before being merged.
Data fusion: this layer consists of various statistical or logic-based methods to integrate the outputs from the data processing layer in order to achieve a cohesive view of urban awareness. Crucial to achieving this urban intelligence is the fusion of cross-space, heterogeneous and multimodal data.
Applications: this layer consists of the different kinds of applications that are enabled by CPSS.
A Taxonomy and Conceptual Framework for CPSS Solutions
Following the identification of the data-specific elements for an urban CPSS implementation and its constituent layers, Table 1 provides a summary of the surveyed works and commercial solutions, delineating the methods applied for each of the layer implementations. In addition to the data-specific elements identified above, Table 1 also lists the system components encountered in the reviewed works (if specified in the related articles).
To analyze the various disparate existing methods for data manipulation and the resulting applications in the CPSS domain as reviewed in this article, we outline the various functional blocks of a conceptual CPSS framework, as presented in Figure 4.
4. Data Sources
The data sources in a typical CPSS that can provide (near) real-time sensing capabilities of the urban environment, cover a broad field since they encompass both fixed and mobile sensor networks installed by city authorities as well as human contributed data, both with explicit knowledge (e.g., by users uploading city-related data from their sensor enabled smartphones) as well as passively (e.g., citizens contributing observations to social networks, that can then be analyzed for information in a specific city situation [80]). Figure 5 depicts a taxonomy of the various involved data sources, with the following sub-sections describing them in detail.
Many CPSS frameworks also derive intelligence by using domain knowledge, such as that contained in open datasets available in online repositories or city mapping data: this aspect of data source is outside the scope of this paper as the information is application-specific and also relatively static.
4.1. Physical Sensor Deployments
A basic sensor network deployment approach in urban areas involves fixed installations, where the location configurations of the deployed sensors remain static. Without any change in the location, the sensed data generated by the sensors form a continuous time-series, whose resolutions depend on the sampling rate of the sensors. The London Air Quality Network (LAQN) (https://www.londonair.org.uk/LondonAir/Default.aspx) is one such real deployment which has multiple types of weather sensors and air pollution sensors in London. LAQN deploys sensors in four different types of locations, including roadside, suburban, urban background, and industrial. The sensed air pollution data mainly consists of Carbon Monoxide (CO), Nitrogen Dioxide (NO2), Ozone (O3), PM10 Particulates, PM2.5 Particulates, and Sulphur Dioxide (SO2). These data are normally sampled every 15 min by each sensing site. LAQN offers access to the real-time air pollution data through heat maps and historical data downloads in comma-separated values (CSV) format. The available data includes the following parameters: site ID, sensing species, measurement date and time, measured value, measurement units, and whether the value is provisional or ratified. It also enables APIs for data access in eXtensible Markup Language (XML) and JavaScript Object Notation (JSON) formats according to different sensing sites or sensing species. Due to the provenance of the sensed data and known static context, fixed sensing has been applied for numerous sensing applications, such as air quality sensing [32,65], weather conditions [72], water distribution data [71] and traffic data [56,72]. Different supporting frameworks are also proposed [18,40,56]. The fixed sensors involved in the water distribution network system [71] include the water sensors, which monitor the flow and pressure, and water quality sensors. The fixed sensor installation in the noise mapping architecture in [18] is based on the SmartSantander IoT architecture and is a realization of a WSN for urban sensing, with sensors mounted on public properties such as on street and traffic lights and on building facades. Mobile extensions for this architecture include sensors mounted on vehicles.
The SmartSantander (http://www.smartsantander.eu/) project aims at a large number of sensor deployments in four different places: Belgrade, Guildford, Lübeck and Santander. The Santander testbed is a notable one as it has deployed heterogeneous sensors at a city scale. The sensors cover multiple areas: (1) environmental monitoring that can provide data for temperature, CO, noise, light and car presence; (2) traffic monitoring that involves data for traffic volumes, road occupancy, vehicle speed or queue length; (3) availability of parking slots; and (4) agriculture monitoring that provides data for moisture, temperature and humidity, pluviometer, anemometer. These data are publicly accessible through the SmartSantander Map (http://maps.smartsantander.eu/) in JSON and HTML format. The data contains information fields such as sensor node id, location of the sensor node, encoded sensing value, update date and time and multiple sensing values. An example of a SmartSantander observation data point is shown in Figure 6.
In addition to deployments of fixed sensors, SmartSantander also has deployments consisting of sensors attached to public vehicles, which enable a mobile sensing scenario that provides sensing data with changing locations. Similar initiatives have been adopted in Madrid [81], where pollen sensors have been mounted on public transport buses. Mobile sensors mounted on buses have also been deployed in a city in China [15], that monitor both urban physical environment and road conditions. The corresponding data are stored in databases and retrieved in XML format, containing the following fields: bus ID, bus line, temperature, humidity, speed, latitude, longitude, tested data, tested time and illumination data. Mobile sensing gives an opportunity for large scale environmental monitoring with limited number of sensors, however, it also needs a proper approach for managing the fast changes in the locations of data and data sources [62].
Another example can be found in the city of Barcelona and its multiple Smart City initiatives [75]. The city started to deploy sensors across the city in 2012, focusing on the areas of public transit, street lighting and waste management. Smart meters, smart bins, location sensors in public transport, sensors in the asphalt to detect parking spaces, air quality sensors, irrigation and water levels in public fountains are some of the sensors that have been successfully deployed. The sensor network relies on Sentilo [82], an open source data acquisition and sharing platform based on Web technologies.
Intelligent Transportation Systems (ITS) applications involve a number of fixed sensor installations such as those in parking places (cameras at entrances, ultrasonic or infrared detectors in each parking space), road-side units providing traffic signal timing information, road size and pavement state [19].
4.2. Mobile Crowd Sensing
4.2.1. Participatory Sensing
This type of data source involves smartphone-carrying citizens forming participatory sensor networks for local knowledge gathering. This type of sensing involves explicit participation by the involved users. Citizens can be as well transformed into valuable data sources derived from their daily activity and usage of resources, both in the city and in their own spaces.
The concept of participatory sensing was first introduced in [83]. The authors define it as tasks that gather, analyze, and share local knowledge through personal mobile handsets with or without intentional actions by handset owners. The handset owners can provide data for sensing or trigger sensing actions. The concept of participatory sensing is further distinguished from opportunistic sensing in [84] by whether humans are involved in the generation of sensing data. The involvement of humans in the sensing process however, may lead to subjective sensing results, trust issues, errors and privacy issues. Experiments for participatory sensing include those by Kuznetsov et al. [31], where sensing devices were given to people in four communities. Air quality sensors were given to participants, who can deploy the sensors, monitor and share related data with others. As cyclists are one of the communities, the sensing data thus involves mobility as well. How people use the sensors is discussed according to the different communities. In another work, subjective feelings on air quality are obtained through a questionnaire presented in an app [65]. These subjective data are further linked with objective air quality sensing data. Szabó et al. [70] provide a framework for smart city applications based on participatory sensing. The framework is built using the publish-subscribe service of eXtensible Messaging and Presence Protocol (XMPP) based on three elements: producers, consumers, and service providers. These elements and techniques enable participatory sensing through designed apps. Users can report information through the apps installed in their mobile phones. Sensed data depend on how the app is designed. Sensing data comprising of position, temperature and other sensing measurements are collected in the XML format and sent to the XMPP server.
In [39], Arduino boards installed in the cars of a selected user group were used to report on the speed and position of the cars on the road network. This was used to calculate the average car speed on the corresponding roads, in order to detect congested roads or traffic incidents. Participatory sensing involving mobile phones and handheld devices was used in [18] to complement the noise data from the fixed infrastructure and to provide a mechanism for citizens in the city of Melbourne to file noise complaints and give feedback on their perceptions of noise and urban sounds.
Smart City initiatives, such as Sentilo from the city of Barcelona [82] are already opening their platform for citizens to share their own sensors, creating an extended network of real-time information about the city accessible by everyone. Commercial platforms oriented to the Smart Home market also provide users with means to share their own sensors, however, this is usually restricted to the context of the ecosystem created by the solution. SmartThings [76] and Nest [77], to name a few, support the integration of multiple sensors related to the home environment (thermostats, light control, door locks, window controllers, cameras, etc.). Alternatively, there are as well already commercial products that provide consumers with sensors they can use on their own, while at the same time contribute to create a shared aggregation of sensor data that benefit the community. This is the case for example of CleanSpace [74], currently operating in London, a portable battery-less pollution monitor that tracks the pollution level of the route followed by the user, but also shares that data to create a pollution map of the city.
4.2.2. User-Contributed Data from Online Social Networks
The immediacy of messages posted on social networks means that these can act as a rich and timely source of city-specific information. With research (eMarketers.com [85]) on social network usage revealing that 2.34 billion people, equating to approximately 68% of the global population with internet access, use social networks such as Twitter [86] and Foursquare [87], they are “being widely recognized as a complementary or corroborative information source for city events” [20,21]. The information mined from these networks can be combined with data obtained from sensor networks or provide a semantic context to events extracted from such physical-world data.
The Twitter micro-blogging platform allows its users to post messages, called tweets, of up to 140 characters in length, thus constituting the textual component of social network data sources. Twitter supports both push (via a streaming API) and pull-based (via a RESTful API) methods for retrieval of tweets. The streaming API streams a sample of public tweets (estimated to be about 1% [88]). It can be filtered when requested, for example by location or containing a certain hashtag. The REST API is used for querying public user accounts or past data, with rate limit restrictions on the number of requests per hour. With its adoption in many countries (over 500 million users world-wide [20]), many research works have mined tweets as a source of reliable city information. The extracted tweets are in the following format: message text, user ID, tweet ID and published date. Popular uses of Twitter messages in urban CPSS applications have been to gather user perception of air pollution in a city [32], mine representative terms for traffic incidents [89] and to decipher trip intent [19]. As pointed out in [21], the restrictive message length of tweets and the informal nature of social networking means that messages do not follow grammar syntax, contain misspelled or noisy words and also lack context.
The Foursquare social network comprises of users ‘checking-in’ to a venue, with the list of available venues dependent on the user’s location. The user location is determined either by using the mobile phone’s GPS sensors or specified by the application. Recently, (as of mid-2014), the social elements of the Foursquare network, which include the checking-in feature as well as the possibility of sharing it with friends, has been moved to an app called Swarm. The data available through the specified API includes the time, type, user details and venue details (name, location, category, etc.). The modality and format of the available data (primarily numeric) enables its direct manipulation through statistical methods as well as integration with numerical time-series data obtained from physical sensors.
The available access methods feature a REST API with restrictions on the number of requests per hour, dependent on the type of the request. Moreover, developers are not able to search for public check-ins, but can gain access to public check-ins if they know the corresponding check-in ID. Other data access methods include a User Push API and Venue Push API, which involves notifications to an application when a check-in occurs. However, data through this method is only made available to venue owners or authorized users. Surveyed works using Foursquare check-in data include [57], where data from the FourSquare API was sampled every 30 min, with venue locations arranged in a grid of “listening posts”. The obtained data included the time of the query, the current check-ins and total check-ins from which the authors derived the difference in users checking in since the last recorded check in.
4.3. CPSS Elements as Abstract Concepts
Due to the unstructured or semi-structured nature of data collected from the various CPSS elements and their inherent non-uniformity, some approaches have applied low-order tensors for representing and subsequently, processing, this disparate data in a uniform model. Tensors are a type of high-dimensional matrix. The various types of data are modeled as elements in a tensor space as per their initial formats. In [42], the authors introduce tensors for modeling the various data elements of a CPSS: unstructured data such as video clips, semi-structured data such as social relationships and structured data such as XML and GPS data. They propose an extensible order tensor model to represent the various data types, with a base part representing the general characteristics of CPSS data and an extended part capturing the special characters, e.g., XML attributes, video frames information. The base part comprises of time, location (latitude, longitude, altitude), user and cyber resource information. Social relationships are represented using a third-order tensor (corresponding to the two involved users and the relationship), four-order tensors are used for representing Resource Description Framework (RDF) or Web Ontology Language (OWL) triple data and physical world data such as GPS is modeled as a four-order tensor. In [67], high-order tensors are used to represent the relationships between users and their devices or objects in a smart home setting. Third-order tensor models are also employed in [66] to define a ‘space–time user-behavior’ model, which represents the behavior of a user in a spatiotemporal plane.
The suitability of human capability to perform tasks in a CPSS environment has been investigated in [68], where the concept of human ‘compute units’ and its utilization for a certain task within a time window has been formalized. A more formal representation has been presented in [80] with a ‘human service capability description’ model that represents a person’s identity, the tasks that the person can perform, the interfaces for interacting and the necessary qualifications.
5. Data Processing
This section presents the various data processing mechanisms as well as advanced analytics techniques applied to the collected data. It is assumed that the data has already undergone any required pre-processing, including removing noisy instances, redundancy filtering, missing value estimation or pre-sorting [90]. Data processing usually involves cross-space corroborative information, for instance, data in the same modalities, such as numerical data, e.g., GPS traces from vehicle mounted sensors and those obtained from citizens’ smartphones. For multimodal cross-space data that is also in different scales of measure, the physical world and social data are processed in isolation to derive relevant patterns and abstractions, which can then be subjected to data fusion methods to derive knowledge. An example instance is the case of numerical GPS trajectory data (physical world data) and complementary textual data from the Twitter platform.
5.1. Rule Formulation and Management
A number of the reviewed works that involve the generation of rules and management of defined tasks involve semantic web-based technologies. The Wi-City-Plus [38] smart city system employs rules expressed in fuzzy logic to determine the minimum average customer satisfaction for an event or service (using social network data). The rules are implemented using SPARQL Protocol and RDF Query Language (SPARQL) queries. An ontology-based CPSS framework is proposed in this work, with data from both public and private databases of city interest, and data from participatory sensing, mapped to a defined city ontology. The ontology model consists of two parts: the urban environment model that describes concepts related to user behavior, urban infrastructures and city services and a user model ontology that represents a user’s preferences and context. The environment monitoring data, in JSON format, is mapped to the RDF format according to the defined ontology. It is then available to be retrieved by SPARQL queries that can return values for instance, for temperature recorded by the closest weather station.
Another ontology-based effort for a self-organizing resource network has been proposed in [11,55]. The authors represent the physical, cyber and human space of a CPSS through sets of resources. Physical devices and humans are modeled as agents, which have structural (tasks to be solved by the agent) and parametric (situation knowledge, characterized by context) knowledge and a profile (including preferences, provided services and the related functionality). Ontology matching is employed to match the capabilities of the modeled agents with application-specific tasks, for example, to determine the resources (both sensors and actuators) that are in the specific states for a smart home cleaning scenario [11].
Seldom do commercial systems use a specific semantic standard. Nest defines its own data models, and does not include any reference to standard ontologies. SmartThings started defining their own models too, but recently are moving towards utilizing Open Connectivity Foundation (OCF) [91], which aims at defining a standard model to represent devices and their capabilities tailored for the IoT. Other initiatives along these lines are the Web of Things Model [92], the purpose of which is to provide a standard semantic model to describe physical objects on the Web.
5.2. Clustering and Classification of Data Streams
Du et al. [32] provide an approach of assessing air quality from social media and structured air pollution data. The air pollution data are analyzed by different technologies: association rules, clustering, and classification. Association rules are used to infer the impacts caused by the interplay of the different parameters. Clustering partitions the data into different groups based on the numeric attributes, while classification classifies datasets based on categorical attributes. Finally, the numeric and categorical attributes are mapped together. The results of these processing methods are used for sentiment analysis of tweets expressing public opinion on air quality.
A supervised classification approach is employed in [64], where the call data records are mined for features that are then assigned to the most representative label of the activity type of the nearby venues. The cell towers attributed to the call data records are also clustered by using the Density-based Spatial Clustering Algorithm (DBSCAN) [93] that clusters geographically proximate towers, based on the 2-dimensional geo-coordinate information. A clustering algorithm (k-nearest neighbors) is also used in [66] to identify groups from the user behavior modeled as an approximate tensor.
A density-based clustering algorithm is used in [33] for determining the nearest parking space candidates for public buses. The algorithm defines a candidate selection method that detects the possible parking spots based on location parameters (GPS coordinates) and historical data consisting of points-of-interest (POI) vectors within a defined range. The identified parking points are used as passenger pick-up and drop-off locations. The k-Nearest Neighbors (kNN) algorithm [94] is used to discover groups in a tensor model in [66].
In terms of data streams processing, Sentilo provides a pub/sub infrastructure with agents that support alerts based on the sensor data. However, more mechanisms are needed in the infrastructure for the actual processing, with the specific use cases deciding on the choice of techniques, which are not disclosed currently for the analyzed applications. Likewise, the commercial systems analyzed in Section 4.2.1 do not expose details of the specific algorithms used in their data processing mechanisms. However, Nest claims to be using machine-learning algorithms to gather insights into usage of the devices, which helps to optimize the configuration of the Smart Home based on the users’ preferences. In the case of SmartThings, a rule engine based on the sensors/actuators present in the system provides the data processing aspect.
5.3. Event Detection
Event detection mechanisms in the surveyed works are targeted at both socio-cultural or traffic event extraction from physical and social data as well as anomalous events detected in data streams.
In most cases, sensing data follows a normal pattern, which is not of much concern computationally as no additional action needs to be considered in response. A concern of data analytics is the detection of anomalous patterns, which could be of interest to citizens and city authorities and may require corresponding actions. In addition, by focusing on only the anomalies, further processing and analysis can be concentrated to the data within the spatial and temporal range of the detected anomalies’ context. The cost of consequent analysis can thus be reduced. Sensor data anomaly detection is employed for assessment of data integrity in [79].
Pan et al. detect traffic anomalies through changes in the traffic flow detected from road segment information and GPS trajectory data from taxis [89]. Trajectories are modeled in a graph consisting of origin, destination, and passed segments. The routes which have the same origin and destination but have longer passed distances are considered as anomalies. Zheng et al. provide a traffic anomaly detection approach that takes into account different data sources [95]. These data sources contain data about POIs, road network data, emergency call data, taxi flow data, and bike renting information. Multiple datasets are modeled in a Multiple-Source Latent-Topic model for estimation of distribution, and analyzed in a Spatiotemporal Likelihood Ratio Test model for anomaly detection. Szabó et al. [70] highlight the importance of anomaly detection for data analysis and actionable information in smart city applications. They propose various machine learning algorithms for the detection of anomalous events. The algorithms include decision tree, Naive Bayes, Support Vector Machines, kNN clustering, Random Forest, and Linear Discriminant Analysis/Quadratic Discriminant Analysis (LDA/QDA).
A spatiotemporal anomaly detection algorithm is proposed in [71] for the data stream obtained from the sensors in a water distribution network. The authors propose two extensions to the Local Indicators of Spatial Association (LISA) metric [96] for anomaly detection, involving extending the local neighborhood to contain both temporal (past measurements) and spatial factors (neighbor node measurements) and limiting the mean and sigma calculations to the local base station node measurements.
Social data is used in the Wi-City Plus [39] smart city urban CPSS to suggest relevant events that receive a satisfactory score and match the stated preferences of the users. Car drivers can also report traffic incidents such as accidents through mobile phone apps. In [69], spatiotemporal conditions and stored user schedules are detected in order to trigger events, which are then used for situational reasoning. The events are used to restrict the discovery scope to object entities that are matched to the generated event. Traffic events such as accidents, traffic jams or road congestion are detected in the IBM Star City platform [72] by taking into account traffic sensor data from humans and city sensor data.
5.4. Decision Support
Decision support mechanisms encountered in the reviewed works have consisted of prediction algorithms that support further insights through data fusion. The bus passenger demand prediction system, detailed in [33], proposes three models to solve three identified challenges: a time varying Poisson model for non-homogeneous data that can detect the average number of passenger demands, a weighted time varying Poisson model for seasonal burstiness periods of expected events, and the autoregressive integrated moving average (ARIMA) model for a better accuracy for data with irregular periodicity. The three models are also combined in a sliding window ensemble framework. All the models are applied for predicting the spatial distribution of passenger demands, which can be used by the bus company for improved location-based services and by city authorities for gathering insights into urban planning and transport resource usage. A solution to enable cyclists to pass through traffic lights with an automated green light request [36] proposes three kinds of models to reduce energy usage on the cyclist’s mobile phone: constant sleep time model, logarithm model based on distance between the cyclist and the traffic light, and a boundary model based on the speed of the cyclist.
6. Data Fusion
This section presents the prevalent data fusion methods that have been implemented in urban CPSSs, with the aim of achieving either stated system goals or high levels of situation awareness. The fusion techniques ensure that there is actually a combination of computers, smart devices and people working together, rather than just people using the system [80]. Data integration is also a prerequisite to derive value from the high-dimensional, semantically hybrid and noisy CPSS big data [42].
6.1. Tensor Decomposition
The tensor-based methods are employed in existing approaches for data fusion that can detect hidden information and community structure. Following representation of a video clip, an ontology document capturing cyber-space data and social relationships as low-order ranked tensors, Higher-Order Singular Value Decomposition (HOSVD) is then employed to extract the core data which contains the more valuable information [42]. A similarity computation approach is then applied, with a supervised learning method making use of a similarity tensor model, for relation establishment between the various CPSS data objects.
A similar technique is employed in [67], which uses a distributed and incremental version of the tensor decomposition method HOSVD to capture object and social connections between three families and their smart objects. The tensor method first detects the underlying community structure, which is also updated from time to time using incremental HOSVD (IHOSVD).
Tensor decomposition is used to analyze the behavior similarity of users in [66]. The authors reduce the dimensionality of user behavior data and address the data sparsity by mapping the initial data to a denser approximate tensor representation. Group-centric data fusion is performed based on the approximate tensor, with each element in the approximate tensor representing the prevalence of the corresponding behavior in the group. By calculating the weight to be assigned to each behavior, the authors perform group discovery based on the tensor approximation.
6.2. Semantic Reasoning
Semantic web-based methods have been used in the Wi-City Plus urban CPSS [38] to map proprietary relational datasets, environment monitoring data streams and participatory sensing data to sets of interconnected triples in the RDF format, which can then be queried using SPARQL. The resulting semantics-enabled decision support system provides a number of functionalities: mobility and logistics recommendation to mobile users, e.g., nearest services matched to user interest and the route to get there, taking into account current traffic and real-time weather data from monitoring stations; alerts about accidents or polluted areas; event recommendations based on personal and social data; and assistance to the elderly at home based on the fusion of health condition and indoor environment data.
Semantic rule-based reasoning is used in a smart airport use case study [69], where device and environment capabilities are modeled as social objects and this data is then combined (using match filters) with user preferences to form a dynamic social structure of things. A ranking algorithm is first defined to determine service relevance matched to a user’s short-term situational goals, authorization permissions and service ratings. The reasoner, incorporating a ‘semantic service relevance rule engine’, then derives object relevance, which is used to determine a locality-oriented list of objects that can provision the required services, to achieve situational awareness.
6.3. Social Intelligence as Context Descriptor
A number of research works use the patterns detected from social data as a complementary or explanatory evidence to support the physical sensing data analysis. Kuznetsov et al. [31] provide physical sensors to different communities of people for them to monitor and check air quality data. The authors focus on analysis of variability of data across time and space across four different communities, i.e., parents, bicyclists, homeless, and activists. The analysis of the data combines the physical characteristics of the air quality data with social information about features of the communities, giving indicators for community togetherness and public activism. Pan et al. [89] focus on traffic anomaly detection and describe the detected anomaly by mining terms from social networks. Interlinks between anomaly and mined terms are based on the same context, i.e., same location and same temporal context for data from the different data sources. Zheng et al. [95] evaluate anomaly detection efficiency by utilizing events information reported in nycinsiderguide.com as ground truth.
6.4. Cross-Space Data Fusion through Correlation
Cross-space data fusion has taken the form of statistical methods being applied to calculate correlation between (usually) numerical data streams derived from the physical and social space. These include utilizing the data generated by citizens in social networking platforms in conjunction with data from sensor installations to build a model of the city’s dynamics. These mainly utilize location-based social sensing services. The research by Komninos et al. [57] analyzed Foursquare check-in data and its correlation with diurnal pollutant levels and traffic volume in Patras, Greece. The correlation and its p-value was calculated between the diurnal cumulative pollutant level averages for NOx and CO and diurnal Foursquare check-ins, with the check-in data closely following the pollution patterns. Jara et al. [63] correlated the traffic behavior with temperature in the city of Santander, discovering a fine-grained correlation in the evolution of both flows.
7. CPSS Applications
Figure 7 depicts the four CPSS domains which encompass the representative applications enabled by the novel fusion of fixed and mobile sensing with social data. The following sub-sections present the various applications, supported by descriptions of the types of typical data sources, data processing and fusion mechanisms encountered in them.
7.1. Smart Home
Smart Home solutions are already mature enough to have a wide range of commercially available systems that go beyond the maker community and provide platforms that combine sensors with human interactions to create intelligent environments. Most of the commercial solutions provide the basic functionality of monitoring and control. However, some already display a sense of social data and urban intelligence to the benefit of the users. Nest, for example, collects alerts from energy companies in specific areas on energy peaks, so that the heating or cooling systems in a house/building can be automatically configured to save energy and money. SmartThings provides a powerful rule engine to configure the intelligence of the sensors and actuators present in the environment, however it does not provide a direct application of social data.
The localized nature of data sources in a smart home setting allows modeling of human factors in terms of their capabilities and the relationships between humans and smart objects, as has been done in [42,66,67] through tensor-based modeling and fusion approaches. Another approach has been localized and individualized modeling of explicit or implicitly derived goals and health conditions that are semantically matched with service and environmental data for better living conditions [38].
7.2. Urban Intelligence
With the growing attention to the concept of smart cities, both from the research community and by local governments, the integration of physical sensed and social data can provide innovative ways to achieve an awareness of urban dynamics. The resulting applications take into account social data (citizen contributed activity and mobility related messages on location-based social networks), fixed sensing infrastructure data and open datasets to deliver a data-enabled collaborative approach. The deployed applications can enable a responsive urban area that can help inform people’s decision making and enable urban authorities to plan for the best possible use of limited city resources.
Representative applications include those that try to build an understanding of the urban environment, such as prediction of the activity or dominant venue category (e.g., food/work/travel, etc.) of existing urban neighborhoods [64], dynamics of human activity (manifest through check-ins on online social networks at different types of venues) and its relation to traffic and pollution in the city [57] and noise mapping and monitoring [18]. Other urban applications include those that enable situational awareness in a smart airport setting [69] and trip planning and event/venue recommendations that draw upon a mix of monitoring infrastructure, participatory sensing and social data [38,39].
7.3. Intelligent Transportation Systems (ITS)
Applications in the ITS domain take advantage of fixed and mobile sensing infrastructure as well as crowd-sourced social intelligence. A combination of on-board vehicle sensors and infrastructure sensors have been employed in [38] for applications that report traffic dynamics such as congested roads or accidents. Other forms of traffic dynamics applications include smart parking systems that involve various sensor installations including cameras at entrances and infrared detectors for each parking space and dynamic control systems that tell drivers about signal timings of intersections and offers speed guidance; the control system also enables optimization of the traffic signal timing plans by using real-time vehicle arrival information [19]. Recent applications include social networks’ derived intelligence such as trip intent to evaluate existing traffic control plans [19]. Individual trip planning and recommendation applications [38] have been developed within the Wi-City Plus CPSS that take into account current traffic and real-time weather data from monitoring stations.
7.4. Environmental Monitoring
Environment monitoring applications involve the full spectrum of data sources, often including both fixed and mobile sensing nodes as well as both participatory and recently, crowd-sensed social network sources. Environmental monitoring is an important application of CPSS as it highly impacts public health. To fuse these sensing data with social intelligence, many researches provide their diverse approaches. One kind of linkage is that made between air quality data with sentiment analysis results from social data. Sentiment analysis can be applied in social data from social networks such as Twitter [32]. Similar results can also be investigated from public surveys [65]. Regression analysis or correlations can then be applied on the two kinds of data. In a different approach, Kuznetsov et al. [31] divide communities into four kinds and provide analysis on air quality data directly from the data collected from the different communities. The analysis results can then be compared to show community togetherness and public activism.
8. Discussion
In this section, we discuss the key research or technical challenges that need to be met for truly multimodal, cross-space CPSS framework deployments as well as the involved societal challenges.
From a technology perspective, a key feature that has emerged from this review of CPSS in urban areas is concerned with the highly inhomogeneous and distributed nature of the data sources, including that of the sensors themselves and their interaction mechanisms [97]. With the increasing deployment of mobile sensor nodes in typical smart city implementations, data source detection and data collection mechanisms need to evolve to manage the resultant mobility issues. An interesting search mechanism for retrieving observation data from mobile sources has been detailed in [62]. As pointed out in [98], data collection methods need to leverage Big Data techniques and distributed intelligence to be able to facilitate cooperative sensing and transparent access to data processing mechanisms.
A number of system modeling methodologies [1,44,99,100,101] have been proposed for the cyber-physical parts of a CPSS, however, current approaches lack feasible methods to uniformly model the physical, cyber and social spaces. Concurrently, the models need to take into account the fact that the cross-space data can either fit continuous time models (i.e., physical data) or be unstructured (e.g., tweets from the Twitter social network). An initial effort in this direction is outlined in [1] where the design decisions of a single-user CPSS are modeled with a flow based model that formally captures the relationships between the physical object, human and cyber actors. The data flow is represented through directed acyclic graphs.
Current reasoning strategies employed for data analysis and fusion fall under the deductive reasoning category. This could be combined with probabilistic reasoning methods to handle uncertainty situations. The approach consists of truth tables which give the “probabilities of what is likely to be true” [102], which can provide estimates on the likelihood of events. Another possible aligned approach concerned with non-stationary environments, which are typical in CPSS scenarios, is that of learning in dynamic or evolving environments. The approach, termed concept drift learning [103,104], is used to detect changes in the environment with some degree of confidence in order to trigger adaptive strategies.
The growing prevalence of mobile crowd sensing in urban scenarios is transforming citizens into data sources. However, this engenders societal issues that will need to be solved, such as the trust level of the data, specially where it is involved in decision making processes. Annotating data with provenance metadata, such as the W3C provenance ontology, PROV-O [105], can be a possible solution to provide a degree of trust to data contributed by citizen smartphones. Closely aligned with the issue of trust is that of privacy and control of data. In current implementations, the service providers, who have access to usage statistics and users’ personal data, become the de-facto owners after the data collection step. Some studies [5] propose the use of a personal Databox [106] system, which stores personal data along with access policies, which is then contacted by service providers to negotiate on the data access.
9. Conclusions
In this paper, we have analyzed the CPSS domain and proposed a conceptual framework for urban CPSS from the data perspective. We studied both academic approaches as well as analyzed some commercial solutions that are enabling and proposing ways of integrating social data with sensor deployments. The contributing features of this study include a focus on passively contributed user data extracted from social networks and data fusion techniques for cross-space, inhomogeneous and multimodal data streams. Urban data processing requires an infrastructure that can handle the volume of data in a real-time fashion for most of the use cases, therefore innovative techniques for data processing that consider the real-time aspects and the heterogeneity of the data are needed. Combining the sensor data with the social streams will also become a powerful tool to understand the operation of the environment and how people interact with it, enabling a whole new set of applications, that can benefit not only local environments, as for example the Smart Home case, but that also has city wide implications, optimizing resources and providing new services that will eventually impact the operation of the city and their communities.
A glance at the reviewed works reveals that the inclusion of social factors in urban CPSS has involved numerical fusion methods, and that multimodal fusion has largely taken the form of using social intelligence to give semantic meaning to patterns detected in sensor data streams. An interesting future direction of research is thus, to derive statistical patterns from social data which can then be numerically correlated with the non-relational sensor data streams.
Acknowledgments
This paper describes work undertaken in the context of the TagItSmart! project (www.tagitsmart.eu). TagItSmart! is a collaborative project supported by the European Horizon 2020 program, contract number: 688061. The authors would like to express their thanks to the anonymous reviewers, whose comments and recommendations greatly helped to improve the presentation and readability of this paper.
Author Contributions
Suparna De, Yuchao Zhou, and Klaus Moessner were jointly involved in designing the CPSS conceptual framework and taxonomy. Suparna De, Yuchao Zhou and Iker Larizgoitia Abad wrote the paper. Suparna De, Yuchao Zhou and Klaus Moessner revised the paper.
Conflicts of Interest
The authors declare no conflict of interest. The funding sponsors had no role in the design of the study; in the collection, analyses, or interpretation of data; in the writing of the manuscript, and in the decision to publish the results.
References
- Zeng, J.; Yang, L.T.; Lin, M.; Ning, H.; Ma, J. A survey: Cyber-physical-social systems and their system-level design methodology. Future Gener. Comput. Syst. 2016. [Google Scholar] [CrossRef]
- Ning, H.; Liu, H.; Ma, J.; Yang, L.T.; Huang, R. Cybermatics: Cyber–physical–social–thinking hyperspace based science and technology. Future Gener. Comput. Syst. 2016, 56, 504–522. [Google Scholar] [CrossRef]
- Zhuge, H. Cyber-Physical Society—The science and engineering for future society. Future Gener. Comput. Syst. 2014, 32, 180–186. [Google Scholar] [CrossRef]
- Bordel, B.; Alcarria, R.; Robles, T.; Martín, D. Cyber–physical systems: Extending pervasive sensing from control theory to the Internet of Things. Perv. Mob. Comput. 2017, 40, 156–184. [Google Scholar] [CrossRef]
- Conti, M.; Passarella, A.; Das, S.K. The Internet of People (IoP): A new wave in pervasive mobile computing. Perv. Mob. Comput. 2017, 41, 1–27. [Google Scholar] [CrossRef]
- Lee, E.A. Cyber Physical Systems: Design Challenges. In Proceedings of the 11th IEEE International Symposium on Object and Component-Oriented Real-Time Distributed Computing (ISORC), Orlando, FL, USA, 5–7 May 2008; pp. 363–369. [Google Scholar]
- Nunes, D.S.; Zhang, P.; Silva, J.S. A Survey on Human-in-the-Loop Applications towards an Internet of All. IEEE Commun. Surv. Tutor. 2015, 17, 944–965. [Google Scholar] [CrossRef]
- Othman, M.F.; Shazali, K. Wireless Sensor Network Applications: A Study in Environment Monitoring System. Procedia Eng. 2012, 41, 1204–1210. [Google Scholar] [CrossRef]
- Posnicek, T.; Kellner, K.; Brandl, M. Wireless Sensor Network for Environmental Monitoring with 3G Connectivity. Procedia Eng. 2014, 87, 524–527. [Google Scholar] [CrossRef]
- Dunfan, Y.; Daoli, G.; Wei, W. Application of wireless sensor networks in environmental monitoring. In Proceedings of the 2009 2nd International Conference on Power Electronics and Intelligent Transportation System (PEITS), Shenzhen, China, 19–20 December 2009; pp. 205–208. [Google Scholar]
- Smirnov, A.; Kashevnik, A.; Ponomarev, A. Multi-level Self-organization in Cyber-Physical-Social Systems: Smart Home Cleaning Scenario. Procedia CIRP 2015, 30, 329–334. [Google Scholar] [CrossRef]
- London Air Quality Network. Available online: https://www.londonair.org.uk/LondonAir/Default.aspx (accessed on 8 August 2017).
- Guo, B.; Wang, Z.; Yu, Z.; Wang, Y.; Yen, N.Y.; Huang, R.; Zhou, X. Mobile Crowd Sensing and Computing: The Review of an Emerging Human-Powered Sensing Paradigm. ACM Comput. Surv. 2015, 48, 1–31. [Google Scholar] [CrossRef]
- Sanchez, L.M.L.; Galache, J.A.; Sotres, P.; Santana, J.R.; Gutierrez, V.; Ramdhany, R.; Gluhak, A.; Krco, S.; Theodoridis, E. Smartsantander: Iot experimentation over a smart city testbed. Comput. Netw. 2014, 61, 217–238. [Google Scholar] [CrossRef]
- Kang, L.; Poslad, S.; Wang, W.; Li, X.; Zhang, Y.; Wang, C. A Public Transport Bus as a Flexible Mobile Smart Environment Sensing Platform for IoT. In Proceedings of the 2016 12th International Conference on Intelligent Environments (IE), London, UK, 14–16 September 2016; pp. 1–8. [Google Scholar]
- Zhou, Y.; De, S.; Wang, W.; Moessner, K. Enabling Query of Frequently Updated Data from Mobile Sensing Sources. In Proceedings of the 13th IEEE International Conference on Ubiquitous Computing and Communications (IUCC 2014), Chengdu, China, 19–21 December 2014; IEEE Computer Society: Chengdu, China, 2014. [Google Scholar]
- Conti, M.; Das, S.K.; Bisdikian, C.; Kumar, M.; Ni, L.M.; Passarella, A.; Roussos, G.; Tröster, G.; Tsudik, G.; Zambonelli, F. Looking ahead in pervasive computing: Challenges and opportunities in the era of cyber–physical convergence. Perv. Mob. Comput. 2012, 8, 2–21. [Google Scholar] [CrossRef]
- Jin, J.; Gubbi, J.; Marusic, S.; Palaniswami, M. An information framework for creating a smart city through Internet of things. IEEE Intern. Things J. 2014, 1, 112–121. [Google Scholar] [CrossRef]
- Guo, W.; Zhang, Y.; Li, L. The integration of CPS, CPSS, and ITS: A focus on data. Tsinghua Sci. Technol. 2015, 20, 327–335. [Google Scholar] [CrossRef]
- Anantharam, P.; Barnaghi, P.; Thirunarayan, K.; Sheth, A. Extracting City Traffic Events from Social Streams. ACM Trans. Intell. Syst. Technol. 2015, 6, 1–27. [Google Scholar] [CrossRef]
- Zhou, Y.; De, S.; Moessner, K. Real World City Event Extraction from Twitter Data Streams. Procedia Comput. Sci. 2016, 98, 443–448. [Google Scholar] [CrossRef] [Green Version]
- Sakaki, T.; Okazaki, M.; Matsuo, Y. Earthquake shakes Twitter users: Real-time event detection by social sensors. In Proceedings of the 19th International Conference on World Wide Web, Raleigh, NC, USA, 26–30 April 2010; pp. 851–860. [Google Scholar]
- Cranshaw, J.; Schwartz, R.; Hong, J.I.; Sadeh, N. The Livehoods Project: Utilizing Social Media to Understand the Dynamics of a City. In Proceedings of the International AAAI Conference on Web and Social Media (ICWSM), Dublin, Ireland, 4–7 June 2012. [Google Scholar]
- Zhang, A.X.; Noulas, A.; Scellato, S.; Mascolo, C. Hoodsquare: Modeling and Recommending Neighborhoods in Location-Based Social Networks. In Proceedings of the International Conference on Social Computing (SocialCom), Washington, DC, USA, 8–14 September 2013. [Google Scholar]
- Noulas, A.; Scellato, S.; Mascolo, C.; Pontil, M. Exploiting Semantic Annotations for Clustering Geographic Areas and Users in Location-based Social Networks. In Proceedings of the Social Mobile Web, AAAI Workshops, Barcelona, Catalonia, Spain, 21 July 2011. [Google Scholar]
- Silva, T.H.; Melo, P.O.S.V.D.; Almeida, J.M.; Salles, J.; Loureiro, A.A.F. Revealing the City That We Cannot See. ACM Trans. Internet Technol. 2014, 14, 1–23. [Google Scholar] [CrossRef]
- Yuan, J.; Zheng, Y.; Xie, X. Discovering regions of different functions in a city using human mobility and POIs. In Proceedings of the 18th ACM SIGKDD International Conference on Knowledge Discovery and Data Mining, Beijing, China, 12–16 August 2012; pp. 186–194. [Google Scholar]
- Wang, F.Y. The Emergence of Intelligent Enterprises: From CPS to CPSS. IEEE Intell. Syst. 2010, 25, 85–88. [Google Scholar] [CrossRef]
- Sheth, A.; Anantharam, P.; Henson, C. Physical-Cyber-Social Computing: An Early 21st Century Approach. IEEE Intell. Syst. 2013, 28, 78–82. [Google Scholar] [CrossRef]
- Liu, Z.; Yang, D.S.; Wen, D.; Zhang, W.M.; Mao, W. Cyber-Physical-Social Systems for Command and Control. IEEE Intell. Syst. 2011, 26, 92–96. [Google Scholar] [CrossRef]
- Kuznetsov, S.; Davis, G.; Cheung, J.; Paulos, E. Ceci n’est pas une pipe bombe: Authoring urban landscapes with air quality sensors. In Proceedings of the Sigchi Conference on Human Factors in Computing Systems, Vancouver, BC, Canada, 7–12 May 2011; pp. 2375–2384. [Google Scholar]
- Du, X.; Emebo, O.; Varde, A.; Tandon, N.; Chowdhury, S.N.; Weikum, G. Air quality assessment from social media and structured data: Pollutants and health impacts in urban planning. In Proceedings of the 2016 IEEE 32nd International Conference on Data Engineering Workshops (ICDEW), Helsinki, Finland, 16–20 May 2016; pp. 54–59. [Google Scholar]
- Zhou, C.; Dai, P.; Wang, F.; Zhang, Z. Predicting the passenger demand on bus services for mobile users. Perv. Mob. Comput. 2016, 25, 48–66. [Google Scholar] [CrossRef]
- Frazzon, E.M.; Hartmann, J.; Makuschewitz, T.; Scholz-Reiter, B. Towards Socio-Cyber-Physical Systems in Production Networks. Procedia CIRP 2013, 7, 49–54. [Google Scholar] [CrossRef]
- Ding, K.; Jiang, P. Incorporating Social Sensors and CPS Nodes for Personalized Production under Social Manufacturing Environment. Procedia CIRP 2016, 56, 366–371. [Google Scholar] [CrossRef]
- Anagnostopoulos, T.; Ferreira, D.; Samodelkin, A.; Ahmed, M.; Kostakos, V. Cyclist-aware traffic lights through distributed smartphone sensing. Perv. Mob. Comput. 2016, 31, 22–36. [Google Scholar] [CrossRef]
- Digiesi, S.; Facchini, F.; Mossa, G.; Mummolo, G.; Verriello, R. A Cyber—Based DSS for a Low Carbon Integrated Waste Management System in a Smart City. IFAC PapersOnLine 2015, 48, 2356–2361. [Google Scholar] [CrossRef]
- Costanzo, A.; Faro, A.; Giordano, D.; Spampinato, C. An ontological ubiquitous city information platform provided with Cyber-Physical-Social-Systems. In Proceedings of the 13th IEEE Annual Consumer Communications & Networking Conference (CCNC), Las Vegas, NV, USA, 9–12 January 2016; pp. 137–144. [Google Scholar]
- Costanzo, A.; Faro, A.; Giordano, D.; Spampinato, C. Implementing Cyber Physical social Systems for smart cities: A semantic web perspective. In Proceedings of the 13th IEEE Annual Consumer Communications & Networking Conference (CCNC), Las Vegas, NV, USA, 9–12 January 2016; pp. 274–275. [Google Scholar]
- Guo, B.; Yu, Z.; Zhou, X. A Data-Centric Framework for Cyber-Physical-Social Systems. IT Prof. 2015, 17, 4–7. [Google Scholar] [CrossRef]
- Jayaraman, P.P.; Gomes, J.B.; Nguyen, H.L.; Abdallah, Z.S.; Krishnaswamy, S.; Zaslavsky, A. Scalable Energy-Efficient Distributed Data Analytics for Crowdsensing Applications in Mobile Environments. IEEE Trans. Comput. Soc. Syst. 2015, 2, 109–123. [Google Scholar] [CrossRef]
- Kuang, L.; Yang, L.; Liao, Y. An Integration Framework on Cloud for Cyber Physical Social Systems Big Data. IEEE Trans. Cloud Comput. 2015. [Google Scholar] [CrossRef]
- Misra, S.; Goswami, S.; Taneja, C. Multivariate Data Fusion-Based Learning of Video Content and Service Distribution for Cyber Physical Social Systems. IEEE Trans. Comput. Soc. Syst. 2016, 3, 1–12. [Google Scholar] [CrossRef]
- Hehenberger, P.; Vogel-Heuser, B.; Bradley, D.; Eynard, B.; Tomiyama, T.; Achiche, S. Design, modelling, simulation and integration of cyber physical systems: Methods and applications. Comput. Ind. 2016, 82, 273–289. [Google Scholar] [CrossRef]
- Shih, C.S.; Chou, J.J.; Reijers, N.; Kuo, T.W. Designing CPS/IoT applications for smart buildings and cities. IET Cyber Phys. Syst. Theory Appl. 2016, 1, 3–12. [Google Scholar] [CrossRef]
- Salim, F.; Haque, U. Urban computing in the wild: A survey on large scale participation and citizen engagement with ubiquitous computing, cyber physical systems, and Internet of Things. Int. J. Hum. Comput. Stud. 2015, 81, 31–48. [Google Scholar] [CrossRef]
- Zheng, Y.; Capra, L.; Wolfson, O.; Yang, H. Urban Computing: Concepts, Methodologies, and Applications. ACM Trans. Intell. Syst. Technol. 2014, 5, 1–55. [Google Scholar] [CrossRef]
- Moldovan, D.; Copil, G.; Dustdar, S. Elastic systems: Towards cyber-physical ecosystems of people, processes, and things. Comput. Stand. Interfaces 2017. [Google Scholar] [CrossRef]
- Harashima, F.; Tomizuka, M.; Fukuda, T. Mechatronics—“What Is It, Why, and How?” An editorial. IEEE/ASME Trans. Mech. 1996, 1, 1–4. [Google Scholar] [CrossRef]
- Institute of Mechatronic Systems, Vehicle Vibration Analysis and Compensation. Available online: https://www.imes.uni-hannover.de/36.html?&L=1&tx_tkforschungsberichte_pi1%5BshowUid%5D=495&tx_tkforschungsberichte_pi1%5Bbackpid%5D=11&tx_tkforschungsberichte_pi1%5Btx_tkinstpersonen_pi1-showUid%5D=81&tx_tkforschungsberichte_pi1%5Btx_tkinstpersonen_pi1-projekte%5D=1&cHash=edd1b837fe36bed5a708b18274432e42 (accessed on 8 September 2017).
- Lin, C.C.; Deng, D.J.; Jhong, S.Y. A Triangular NodeTrix Visualization Interface for Overlapping Social Community Structures of Cyber-Physical-Social Systems in Smart Factories. IEEE Trans. Emerg. Top. Comput. 2017. [Google Scholar] [CrossRef]
- Fan, X.; Huang, H.; Qi, S.; Luo, X.; Zeng, J.; Xie, Q.; Xie, C. Sensing Home: A Cost-Effective Design for Smart Home via Heterogeneous. Wirel. Netw. Sens. 2015, 15, 29797. [Google Scholar]
- Beigl, M.; Gellersen, H.-W.; Schmidt, A. Mediacups: Experience with design and use of computer-augmented everyday artefacts. Comput. Netw. 2001, 35, 401–409. [Google Scholar] [CrossRef]
- Lee, I.; Sokolsky, O.; Chen, S.; Hatcliff, J.; Jee, E.; Kim, B.; King, A.; Mullen-Fortino, M.; Park, S.; Roederer, A.; et al. Challenges and Research Directions in Medical Cyber-Physical Systems. Proc. IEEE 2012, 100, 75–90. [Google Scholar]
- Smirnov, A.; Levashova, T.; Shilov, N.; Sandkuhl, K. Ontology for cyber-physical-social systems self-organisation. In Proceedings of the 16th Conference of Open Innovations Association FRUCT, Oulu, Finland, 27–31 October 2014; pp. 101–107. [Google Scholar]
- Puiu, D.; Barnaghi, P.; Tönjes, R.; Kümper, D.; Ali, M.I.; Mileo, A.; Parreira, J.X.; Fischer, M.; Kolozali, S.; Farajidavar, N.; et al. CityPulse: Large Scale Data Analytics Framework for Smart Cities. IEEE Access 2016, 4, 1086–1108. [Google Scholar] [CrossRef]
- Komninos, A.; Stefanis, V.; Plessas, A.; Besharat, J. Capturing Urban Dynamics with Scarce Check-In Data. Perv. Comput. IEEE 2013, 12, 20–28. [Google Scholar] [CrossRef]
- De, S.; Christophe, B.; Moessner, K. Semantic Enablers for Dynamic Digital-Physical Object Associations in a Federated Node Architecture for the Internet of Things. Ad Hoc Netw. 2014, 18, 102–120. [Google Scholar] [CrossRef] [Green Version]
- Stevens, S.S. On the Theory of Scales of Measurement. Science 1946, 103, 677–680. [Google Scholar] [CrossRef] [PubMed]
- Fielding, R.T. Architectural Styles and the Design of Network-based Software Architectures; University of California: Irvine, CA, USA, 2000. [Google Scholar]
- IETF. The Constrained Application Protocol (CoAP); In Request for Comments; Universitaet Bremen: Bremen, Germany, 2014; Volume 7252. [Google Scholar]
- Zhou, Y.; De, S.; Wang, W.; Moessner, K.; Palaniswami, M. Spatial Indexing for Data Searching in Mobile Sensing Environments. Sensors 2017, 17, 1427. [Google Scholar] [CrossRef] [PubMed]
- Jara, A.J.; Genoud, D.; Bocchi, Y. Big data for smart cities with KNIME a real experience in the SmartSantander testbed. Softw. Pract. Exp. 2015, 45, 1145–1160. [Google Scholar] [CrossRef]
- Noulas, A.; Mascolo, C.; Frias-Martinez, E. Exploiting Foursquare and Cellular Data to Infer User Activity in Urban Environments. In Proceedings of the IEEE 14th International Conference on Mobile Data Management, Milan, Italy, 3–6 June 2013; Volume 1, pp. 167–176. [Google Scholar]
- Yang, B.; Castell, N.; Pei, J.; Du, Y.; Gebremedhin, A.; Kirkevold, Ø. Towards Crowd-Sourced Air Quality and Physical Activity Monitoring by a Low-Cost Mobile Platform. In Proceedings of the International Conference on Smart Homes and Health Telematics, Wuhan, China, 25–27 May 2016; pp. 451–463. [Google Scholar]
- Zhang, Y. GroRec: A Group-Centric Intelligent Recommender System Integrating Social, Mobile and Big Data Technologies. IEEE Trans. Serv. Comput. 2016, 9, 786–795. [Google Scholar] [CrossRef]
- Wang, X.; Yang, L.T.; Feng, J.; Chen, X.; Deen, M.J. A Tensor-Based Big Service Framework for Enhanced Living Environments. IEEE Cloud Comput. 2016, 3, 36–43. [Google Scholar] [CrossRef]
- Candra, Z.C.M.; Truong, H.L.; Dustdar, S. On Monitoring Cyber-Physical-Social Systems. In Proceedings of the IEEE World Congress on Services (SERVICES), San Francisco, CA, USA, 27 June–2 July 2016; pp. 56–63. [Google Scholar]
- Hussein, D.; Park, S.; Han, S.N.; Crespi, N. Dynamic Social Structure of Things: A Contextual Approach in CPSS. IEEE Intern. Comput. 2015, 19, 12–20. [Google Scholar] [CrossRef]
- Szabó, R.; Farkas, K.; Ispány, M.; Benczur, A.A.; Bátfai, N.; Jeszenszky, P.; Laki, S.; Vágner, A.; Kollár, L.; Sidló, C. Framework for smart city applications based on participatory sensing. In Proceedings of the IEEE 4th International Conference on Cognitive Infocommunications (CogInfoCom), Budapest, Hungary, 2–5 December 2013; pp. 295–300. [Google Scholar]
- Difallah, D.E.; Cudré-Mauroux, P.; McKenna, S.A. Scalable Anomaly Detection for Smart City Infrastructure Networks. IEEE Intern. Comput. 2013, 17, 39–47. [Google Scholar] [CrossRef]
- Lécué, F.T.-D.S.; Hayes, J.; Tucker, R.; Bicer, V.; Sbodio, M.; Tommasi, P. Smart traffic analytics in the semantic web with star-city: Scenarios, system and lessons learned in dublin city. Web Semant. Sci. Serv. Agents World Wide Web 2014, 27–28, 26–33. [Google Scholar] [CrossRef]
- Theodoridis, E.M.G.; Chatzigiannakis, I. Developing an iot smart city framework. In Proceedings of the Fourth International Conference on Information, Intelligence, Systems and Applications (IISA), Piraeus, Greece, 10–12 July 2013. [Google Scholar]
- Cleanspace tag. Available online: https://our.clean.space/ (accessed on 8 August 2017).
- How Smart City Barcelona Brought the Internet of Things to Life. Available online: http://datasmart.ash.harvard.edu/news/article/how-smart-city-barcelona-brought-the-internet-of-things-to-life-789 (accessed on 8 August 2017).
- SmartThings. Available online: http://docs.smartthings.com/en/latest/architecture/ (accessed on 5 August 2017).
- Nest. Available online: https://nest.com/ (accessed on 5 August 2017).
- Delmastro, F.; Arnaboldi, V.; Conti, M. People-centric computing and communications in smart cities. IEEE Commun. Mag. 2016, 54, 122–128. [Google Scholar] [CrossRef]
- Campbell, A.T.; Eisenman, S.B.; Lane, N.D.; Miluzzo, E.; Peterson, R.A. People-centric urban sensing. In Proceedings of the 2nd Annual International Workshop on Wireless Internet, Boston, MA, USA, 2–5 August 2006; p. 18. [Google Scholar]
- Sowe, S.K.; Simmon, E.; Zettsu, K.; Vaulx, F.D.; Bojanova, I. Cyber-Physical-Human Systems: Putting People in the Loop. IT Prof. 2016, 18, 10–13. [Google Scholar] [CrossRef] [PubMed]
- Cervigón, P.; Gutiérrez, M.; Díaz, J.; Aránguez, E. Forecasting for Poaceae pollen with temporal series by applying ARIMA predictive model. In Proceedings of the 7th International Congress Aerobiology, Montebello, QC, Canada, 5–9 August 2002. [Google Scholar]
- Barcelona Digital City—Sentilo. Available online: http://ajuntament.barcelona.cat/digital/en/digital-transformation/urban-technology/sentilo (accessed on 5 August 2017).
- Burke, J.A.; Estrin, D.; Hansen, M.; Parker, A.; Ramanathan, N.; Reddy, S.; Srivastava, M.B. Participatory Sensing; Center for Embedded Network Sensing: Los Angeles, CA, USA, 2006. [Google Scholar]
- Lane, N.D.; Eisenman, S.B.; Musolesi, M.; Miluzzo, E.; Campbell, A.T. Urban sensing systems: Opportunistic or participatory? In Proceedings of the 9th Workshop on Mobile Computing Systems and Applications, Napa Valley, CA, USA, 25–26 February 2008; pp. 11–16. [Google Scholar]
- eMarketers. Nearly One-Third of the World Will Use Social Networks Regularly This Year. Available online: https://www.emarketer.com/Article/Nearly-One-Third-of-World-Will-Use-Social-Networks-Regularly-This-Year/1014157#sthash.6swVYg2Q.dpuf (accessed on 5 August 2017).
- Twitter. Available online: https://twitter.com/?lang=en-gb (accessed on 5 July 2017).
- Foursquare. Available online: https://foursquare.com/ (accessed on 19 July 2017).
- Morstatter, F.; Pfeffer, J.; Liu, H.; Carley, K.M. Is the Sample Good Enough? Comparing Data from Twitter’s Streaming API with Twitter’s Firehose. In Proceedings of the ICWSM, Cambridge, MA, USA, 8–11 July 2013. [Google Scholar]
- Pan, B.; Zheng, Y.; Wilkie, D.; Shahabi, C. Crowd sensing of traffic anomalies based on human mobility and social media. In Proceedings of the 21st ACM SIGSPATIAL International Conference on Advances in Geographic Information Systems, Orlando, FL, USA, 5–8 November 2013; pp. 344–353. [Google Scholar]
- Wang, W.; De, S.; Zhou, Y.; Huang, X.; Moessner, K. Distributed sensor data computing in smart city applications. In Proceedings of the IEEE 18th International Symposium on A World of Wireless, Mobile and Multimedia Networks (WoWMoM), Macau, China, 12–15 June 2017; pp. 1–5. [Google Scholar]
- OCF Specification 1.0. Available online: https://openconnectivity.org/developer/specifications (accessed on 5 July 2017).
- Web of Things Model. Available online: https://www.w3.org/Submission/wot-model/ (accessed on 5 July 2017).
- Ester, M.; Kriegel, H.-P.; Sander, J.; Xu, X. A density-based algorithm for discovering clusters a density-based algorithm for discovering clusters in large spatial databases with noise. In Proceedings of the Second International Conference on Knowledge Discovery and Data Mining, Portland, OR, USA, 2–4 August 1996; pp. 226–231. [Google Scholar]
- Yang, S.; Cheema, M.A.; Lin, X.; Wang, W. Reverse k nearest neighbors query processing: Experiments and analysis. Proc. VLDB Endow. 2015, 8, 605–616. [Google Scholar]
- Zheng, Y.; Zhang, H.; Yu, Y. Detecting collective anomalies from multiple spatio-temporal datasets across different domains. In Proceedings of the 23rd SIGSPATIAL International Conference on Advances in Geographic Information Systems, Bellevue, WA, USA, 3–6 November 2015; pp. 1–10. [Google Scholar]
- Anselin, L. Local Indicators of Spatial Association—LISA. Geogr. Anal. 1995, 27, 93–115. [Google Scholar] [CrossRef]
- Cassandras, C.G. Smart Cities as Cyber-Physical Social Systems. Engineering 2016, 2, 156–158. [Google Scholar] [CrossRef]
- Zhou, Y.; De, S.; Wang, W.; Moessner, K. Search Techniques for the Web of Things: A Taxonomy and Survey. Sensors 2016, 16, 600. [Google Scholar] [CrossRef] [PubMed] [Green Version]
- Xue, Y.; Bogdan, P. Constructing compact causal mathematical models for complex dynamics. In Proceedings of the 8th International Conference on Cyber-Physical Systems, Pittsburgh, PA, USA, 18–21 April 2017; pp. 97–107. [Google Scholar]
- Xue, Y.; Rodriguez, S.; Bogdan, P. A spatio-temporal fractal model for a CPS approach to brain-machine-body interfaces. In Proceedings of the Design, Automation & Test in Europe Conference & Exhibition, Dresden, Germany, 14–18 March 2016; pp. 642–647. [Google Scholar]
- Ghorbani, M.; Bogdan, P. A cyber-physical system approach to artificial pancreas design. In Proceedings of the International Conference on Hardware/Software Codesign and System Synthesis (CODES+ISSS), Grenoble, France, 29 September–4 October 2013; pp. 1–10. [Google Scholar]
- Håkansson, A.; Hartung, R.; Moradian, E. Reasoning Strategies in Smart Cyber-Physical Systems. Procedia Comput. Sci. 2015, 60, 1575–1584. [Google Scholar] [CrossRef]
- Alippi, C.; Roveri, M. The (Not) Far-Away Path to Smart Cyber-Physical Systems: An Information-Centric Framework. Computer 2017, 50, 38–47. [Google Scholar] [CrossRef]
- Ditzler, G.; Roveri, M.; Alippi, C.; Polikar, R. Learning in Nonstationary Environments: A Survey. IEEE Comput. Intell. Mag. 2015, 10, 12–25. [Google Scholar] [CrossRef]
- W3C. PROV-O: The PROV Ontology. Available online: http://www.w3.org/TR/prov-o/ (accessed on 5 September 2017).
- Haddadi, H.; Howard, H.; Chaudhry, A.; Crowcroft, J.; Madhavapeddy, A.; McAuley, D.; Mortier, R. Personal Data: Thinking Inside the Box. In Proceedings of the 5th Decennial Aarhus Conferences, Aarhus, Denmark, 17–21 August 2015. [Google Scholar]
Figure 1.
Cyber–Physical-–Social Systems (CPSS) (adapted from [17]). WSN:Wireless Sensor Networks.
Figure 1.
Cyber–Physical-–Social Systems (CPSS) (adapted from [17]). WSN:Wireless Sensor Networks.

Figure 2.
Evolution of CPSS.

Figure 3.
From Cyber–Physical Systems (CPS) to a data-driven CPSS; (a) main elements of a CPS framework and (b) data-oriented CPSS functional elements.
Figure 3.
From Cyber–Physical Systems (CPS) to a data-driven CPSS; (a) main elements of a CPS framework and (b) data-oriented CPSS functional elements.

Figure 4.
A conceptual framework for CPSS.

Figure 5.
A taxonomy of CPSS data sources.

Figure 6.
SmartSantander data example and access interface.

Figure 7.
CPSS Application Domains.


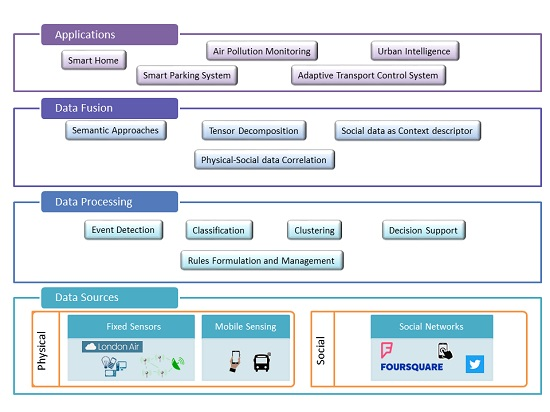
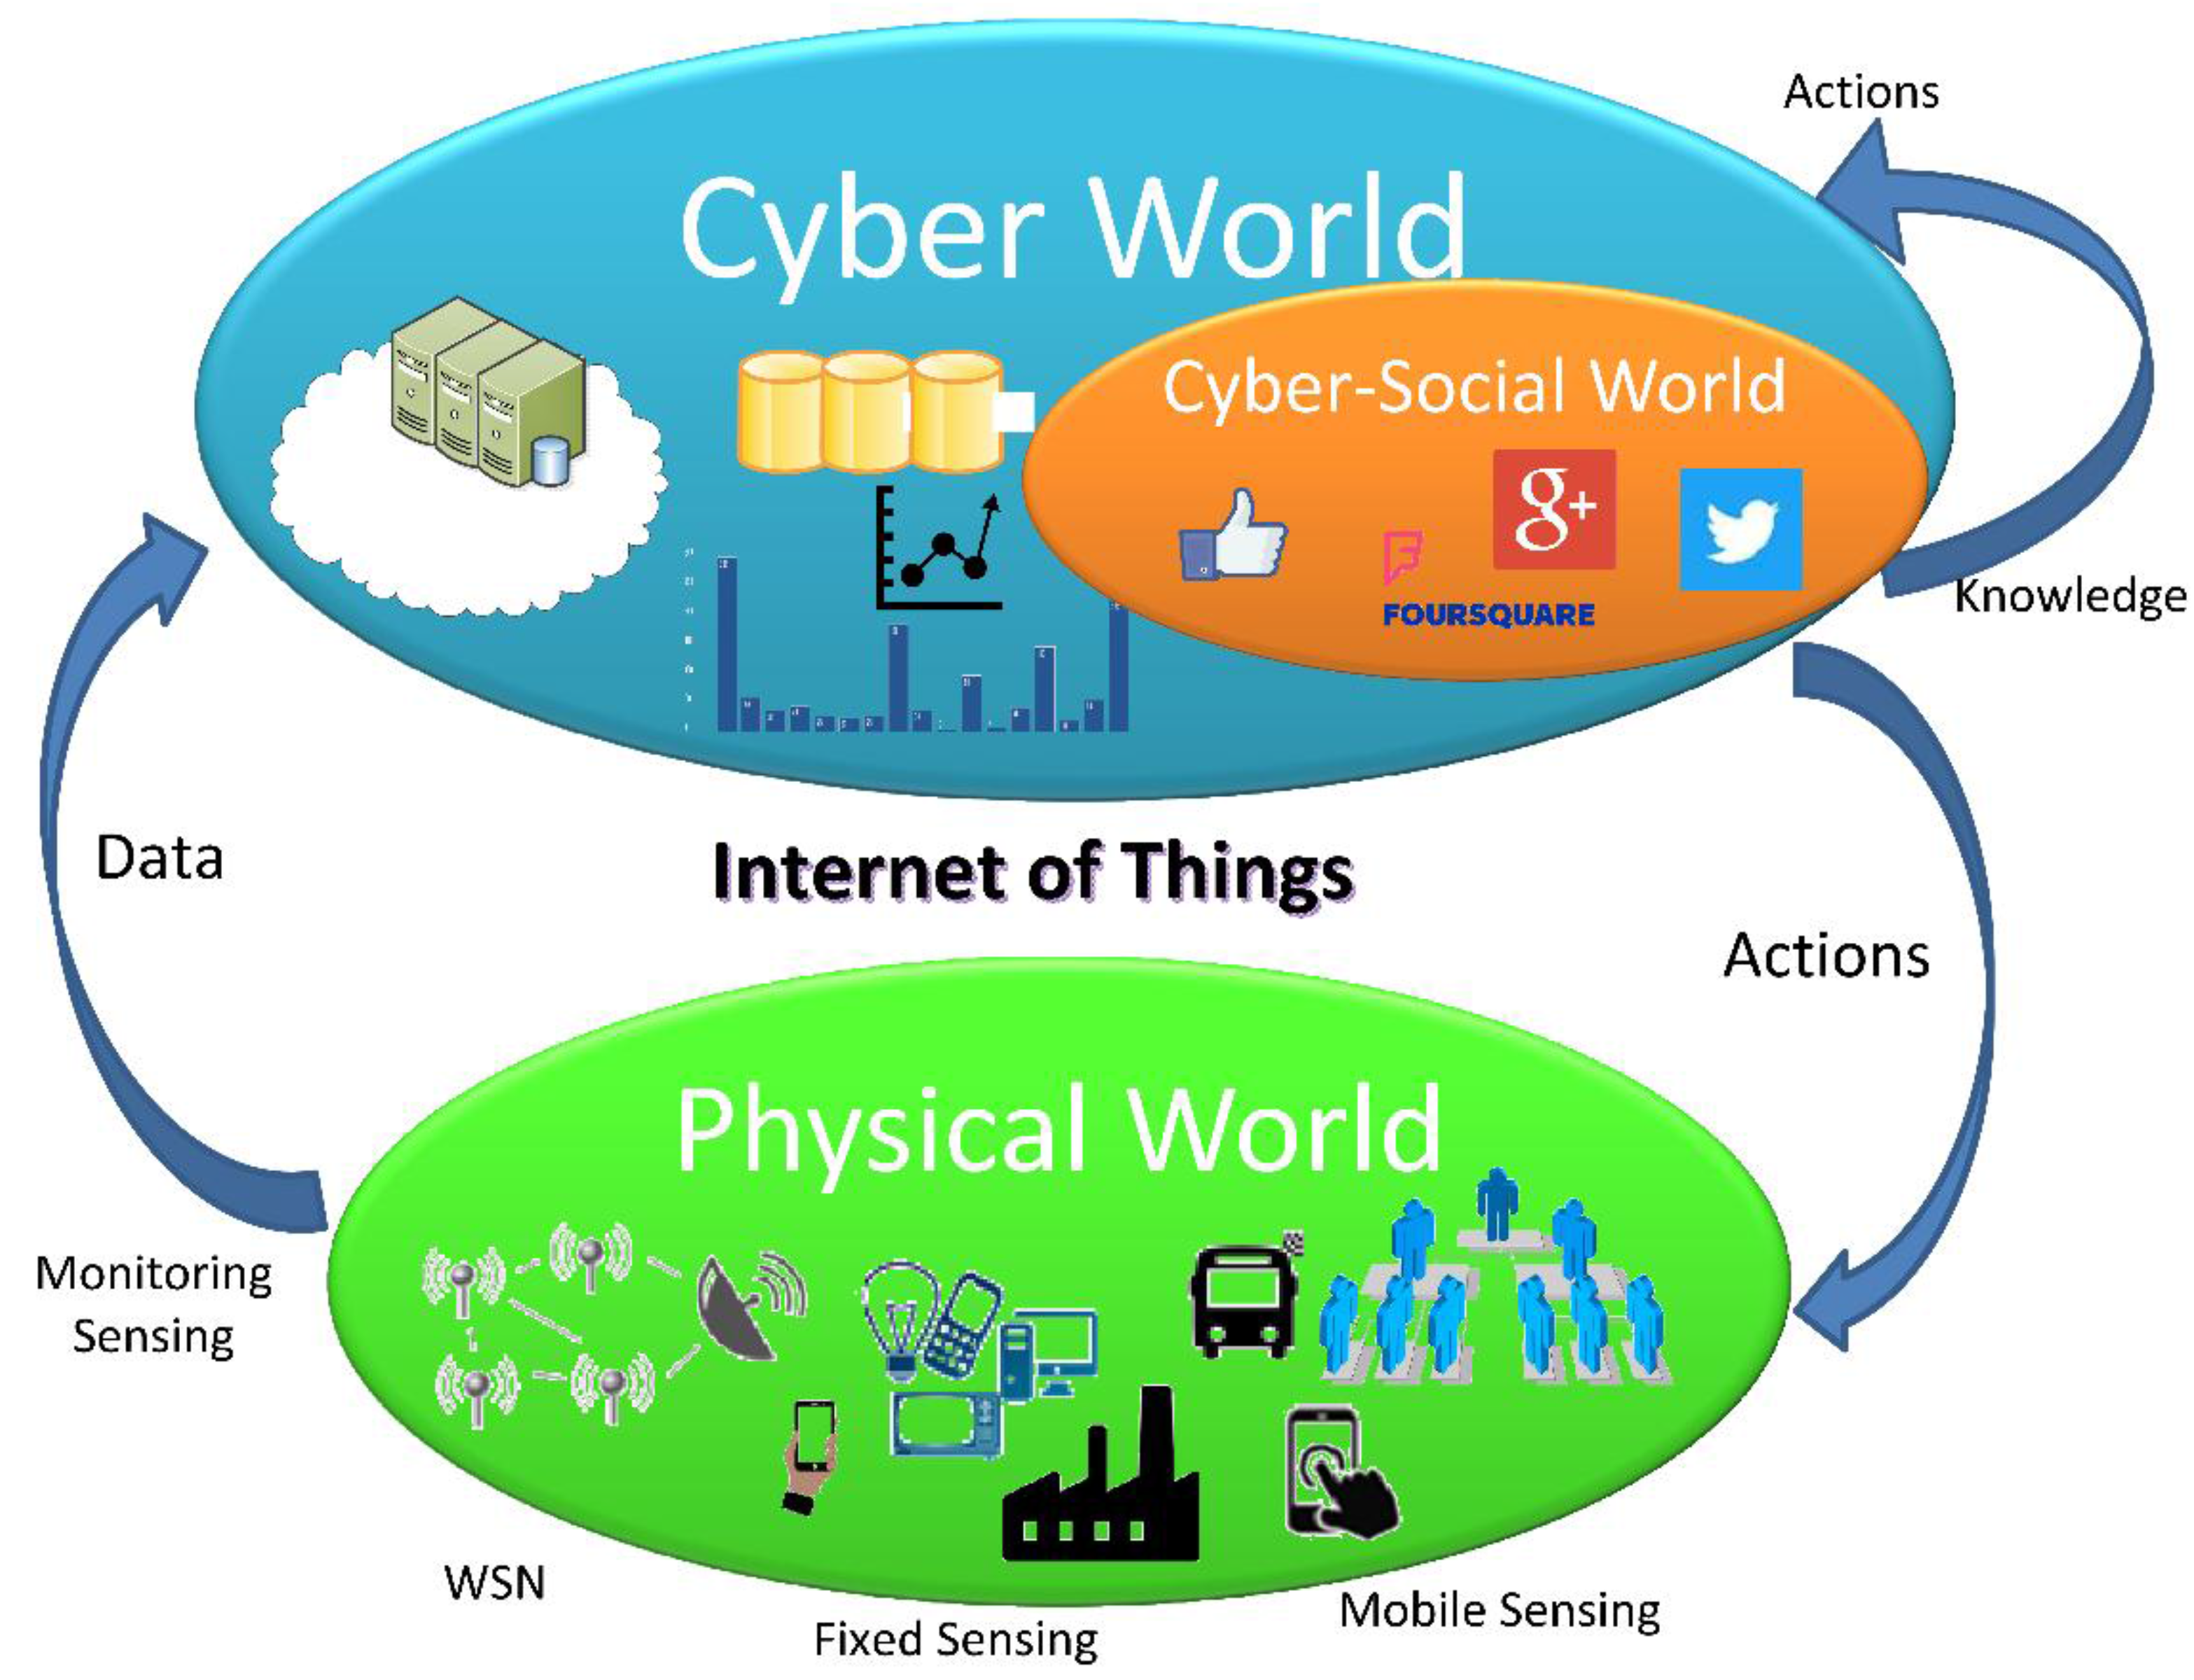
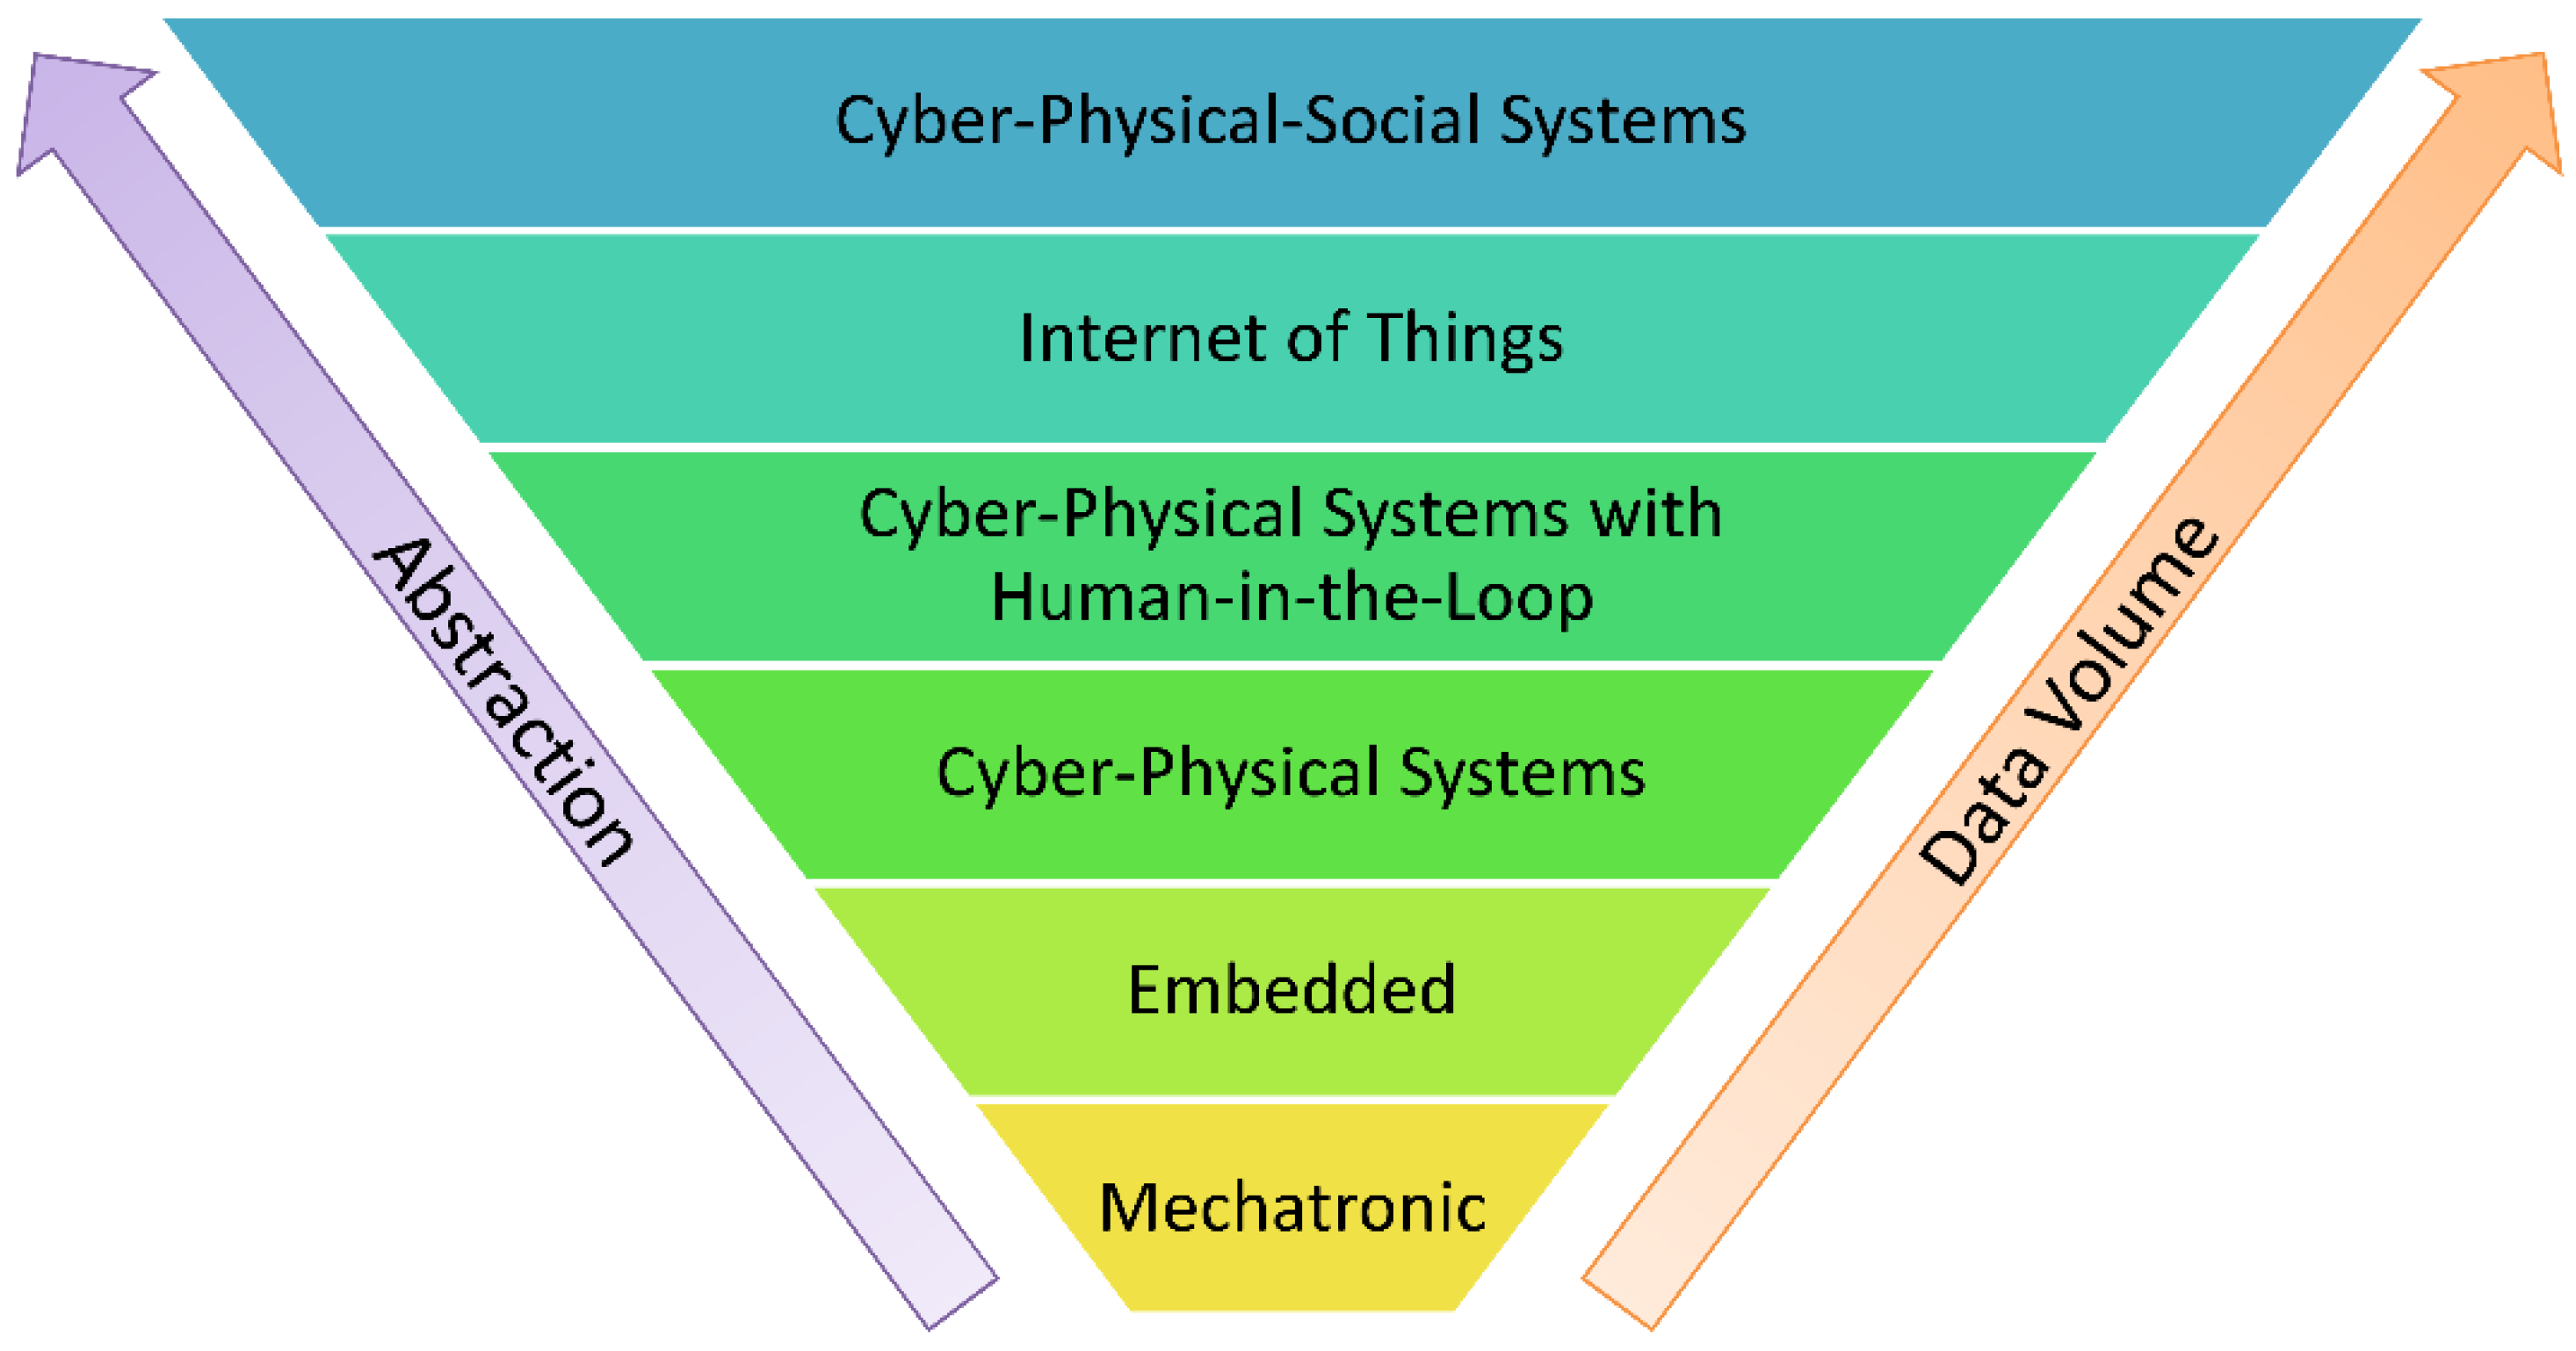
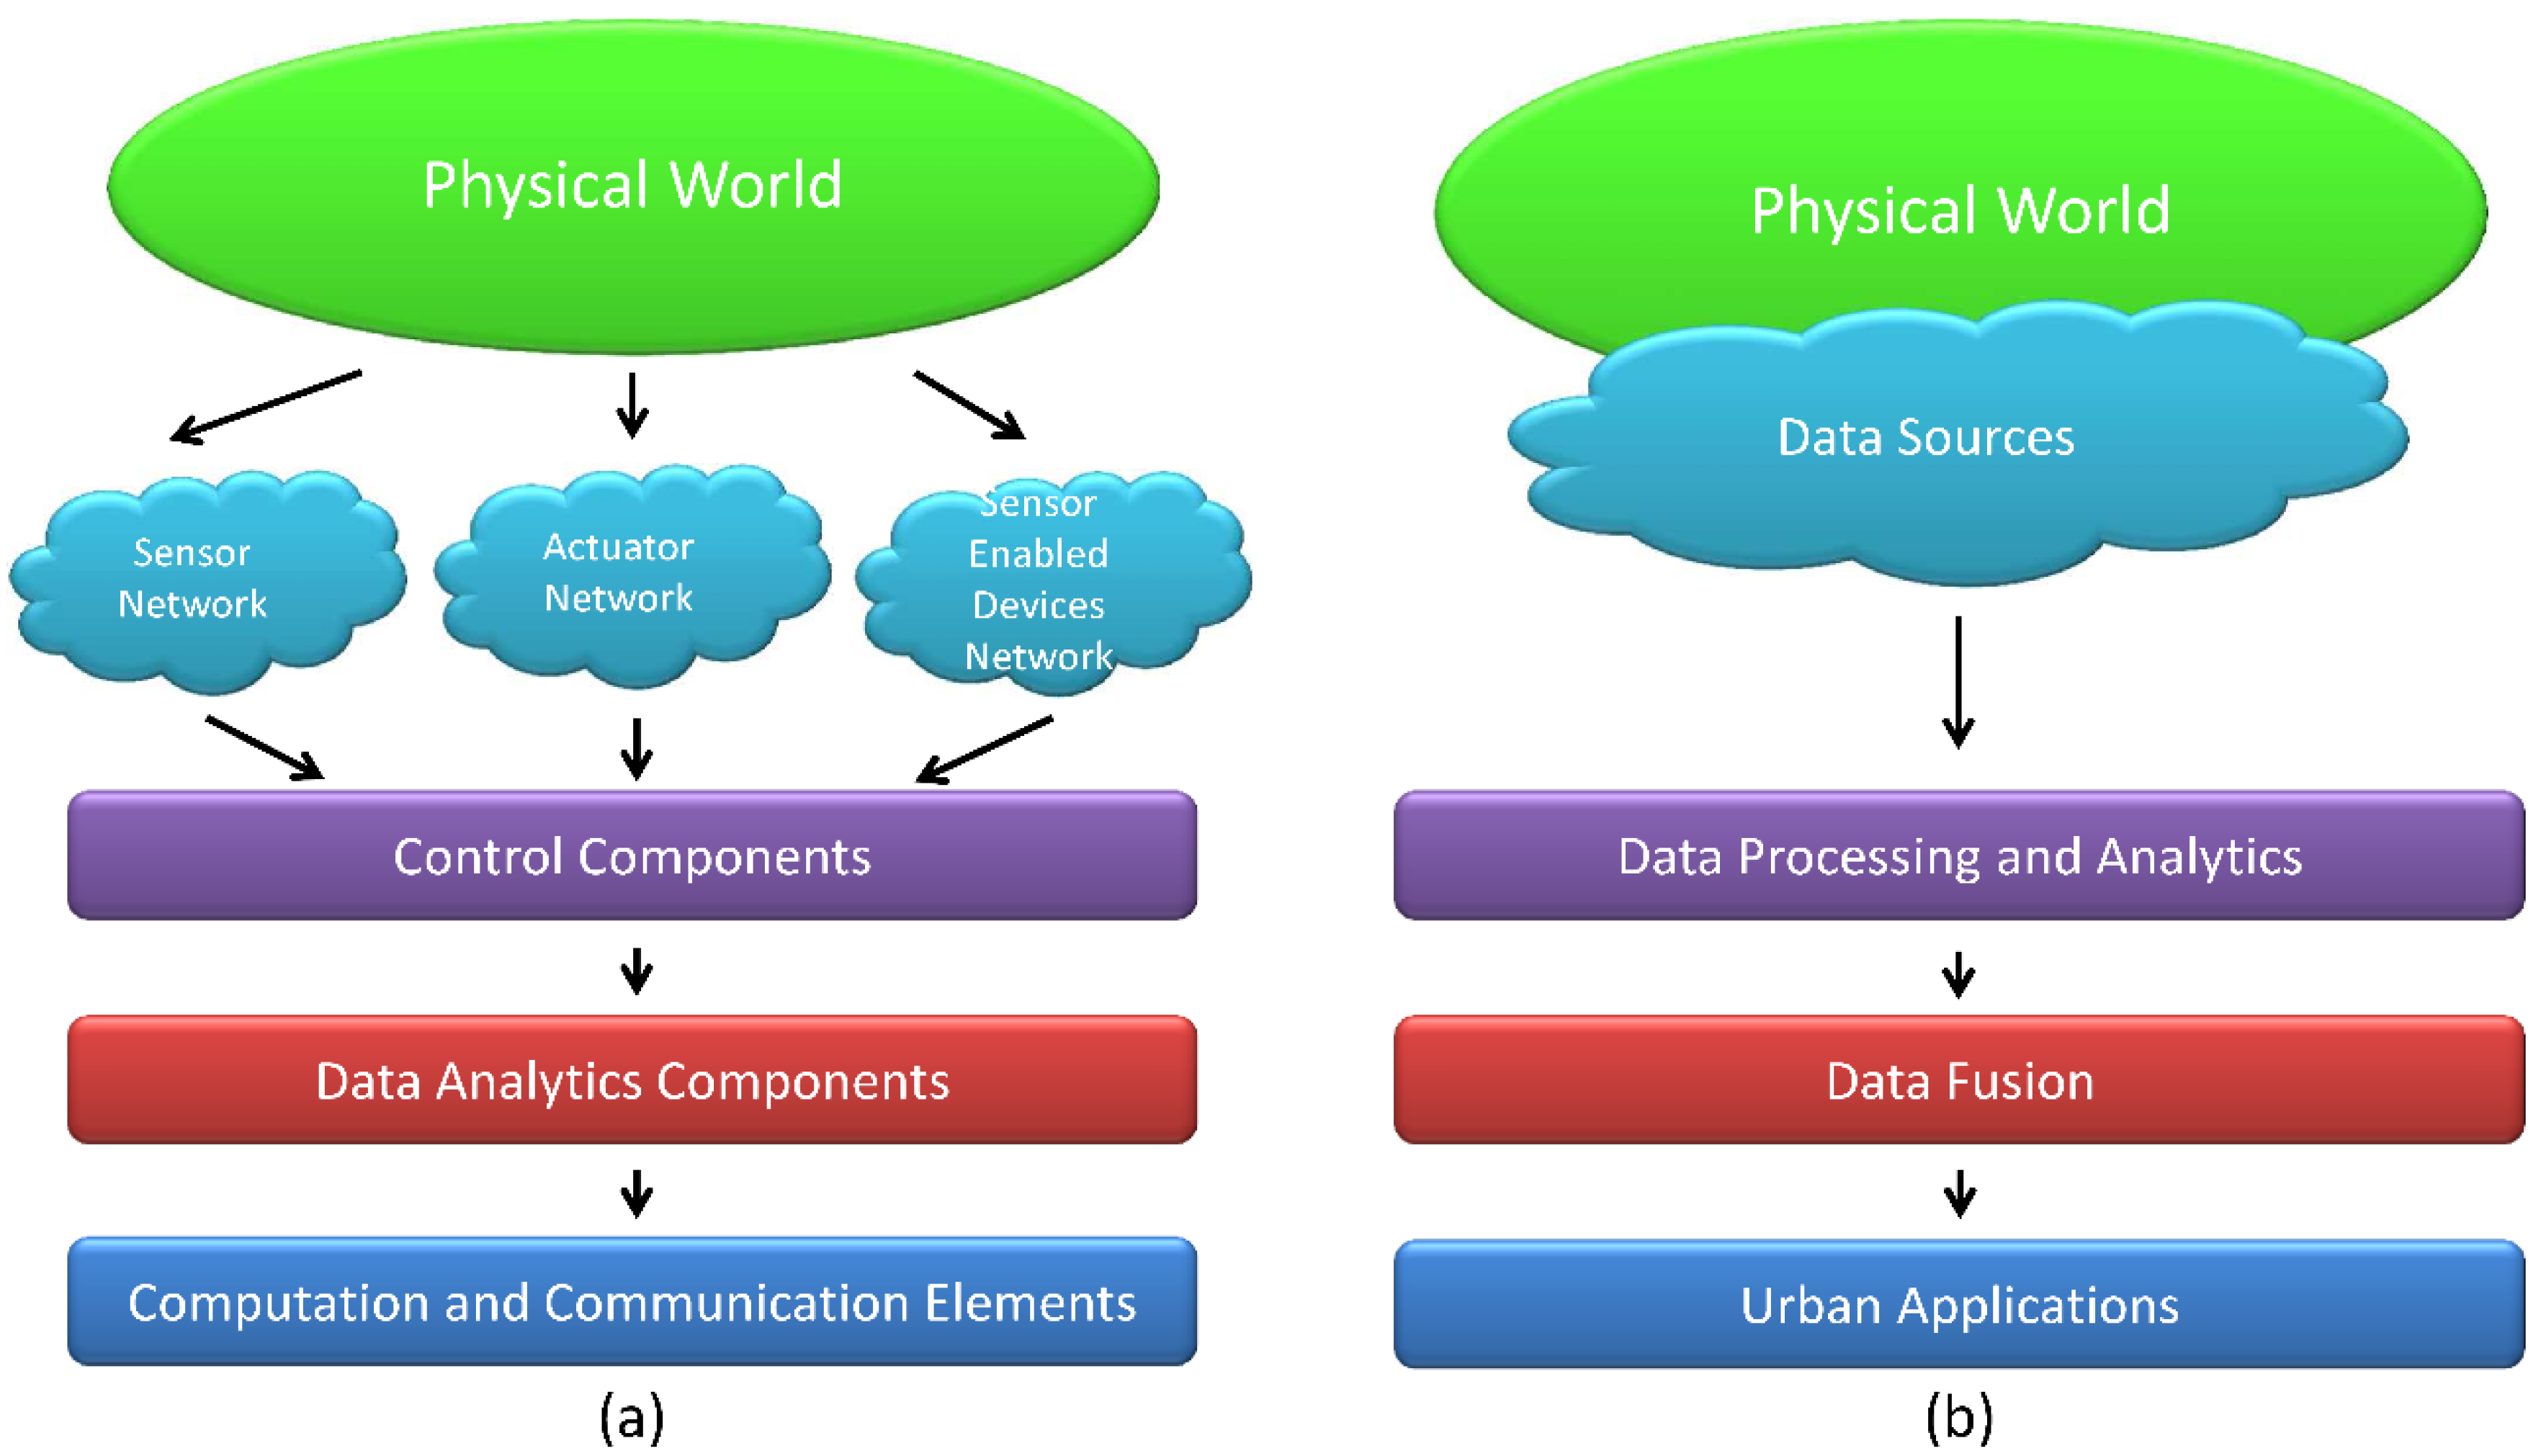
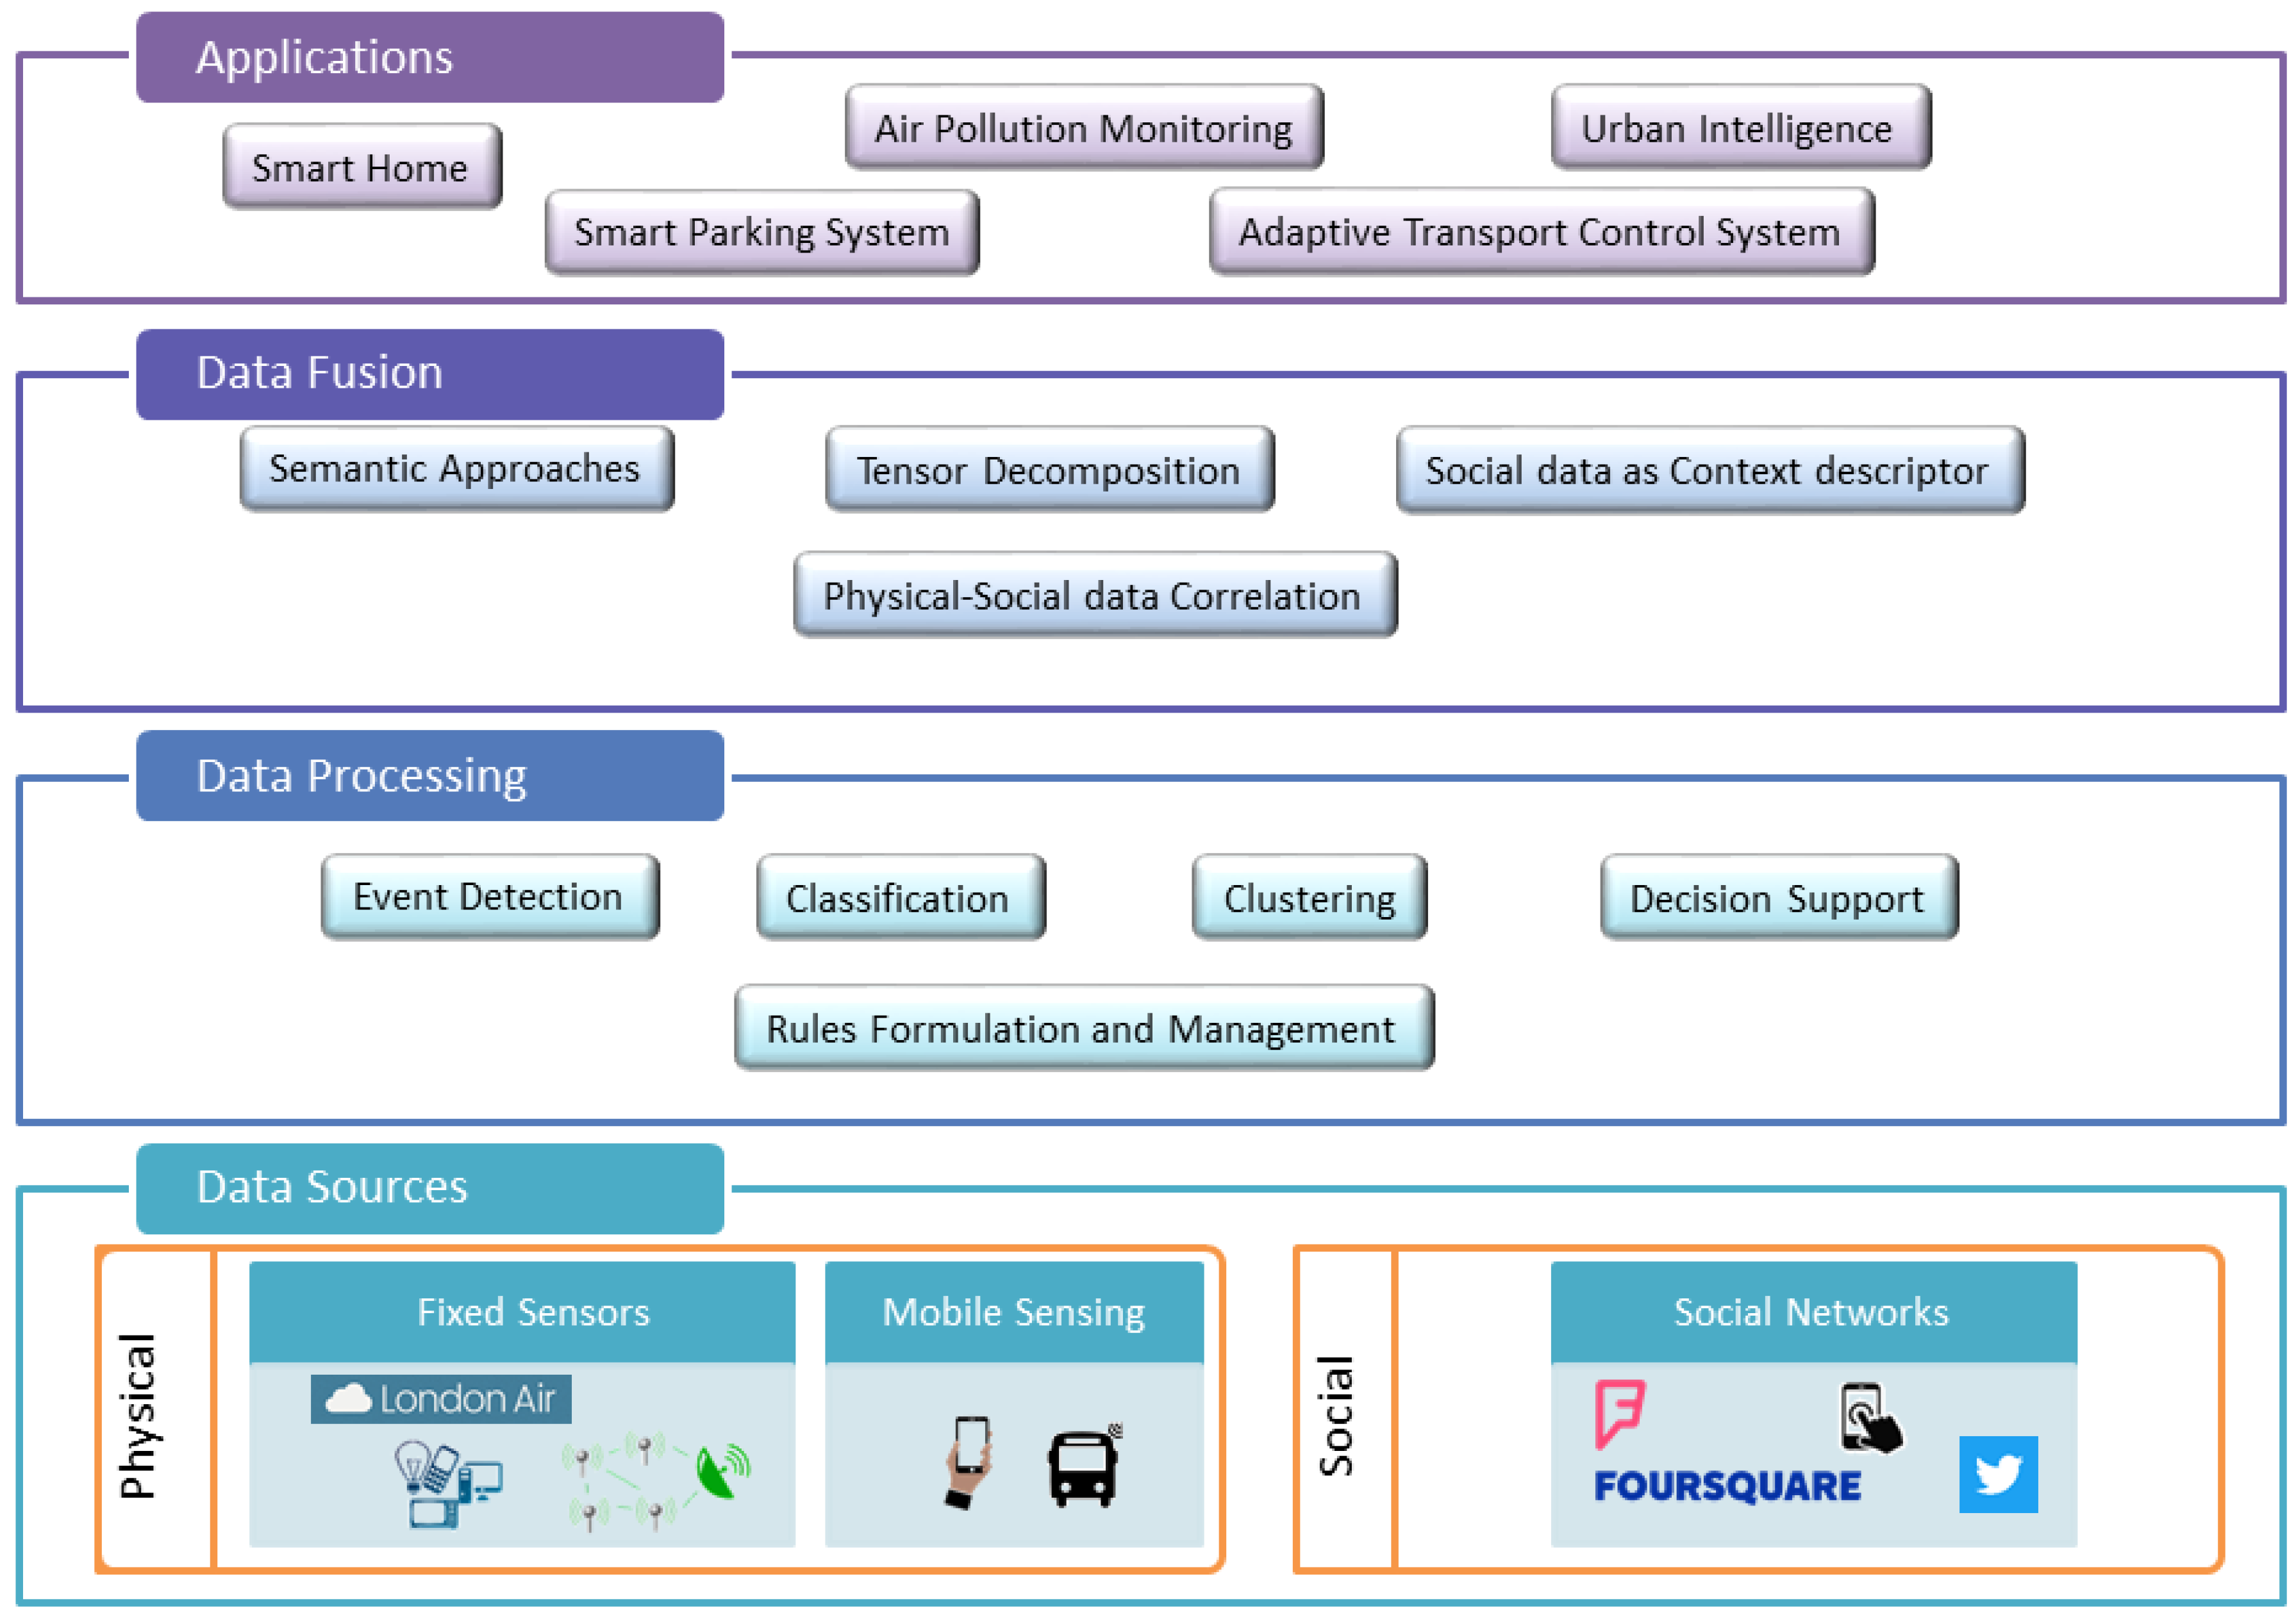
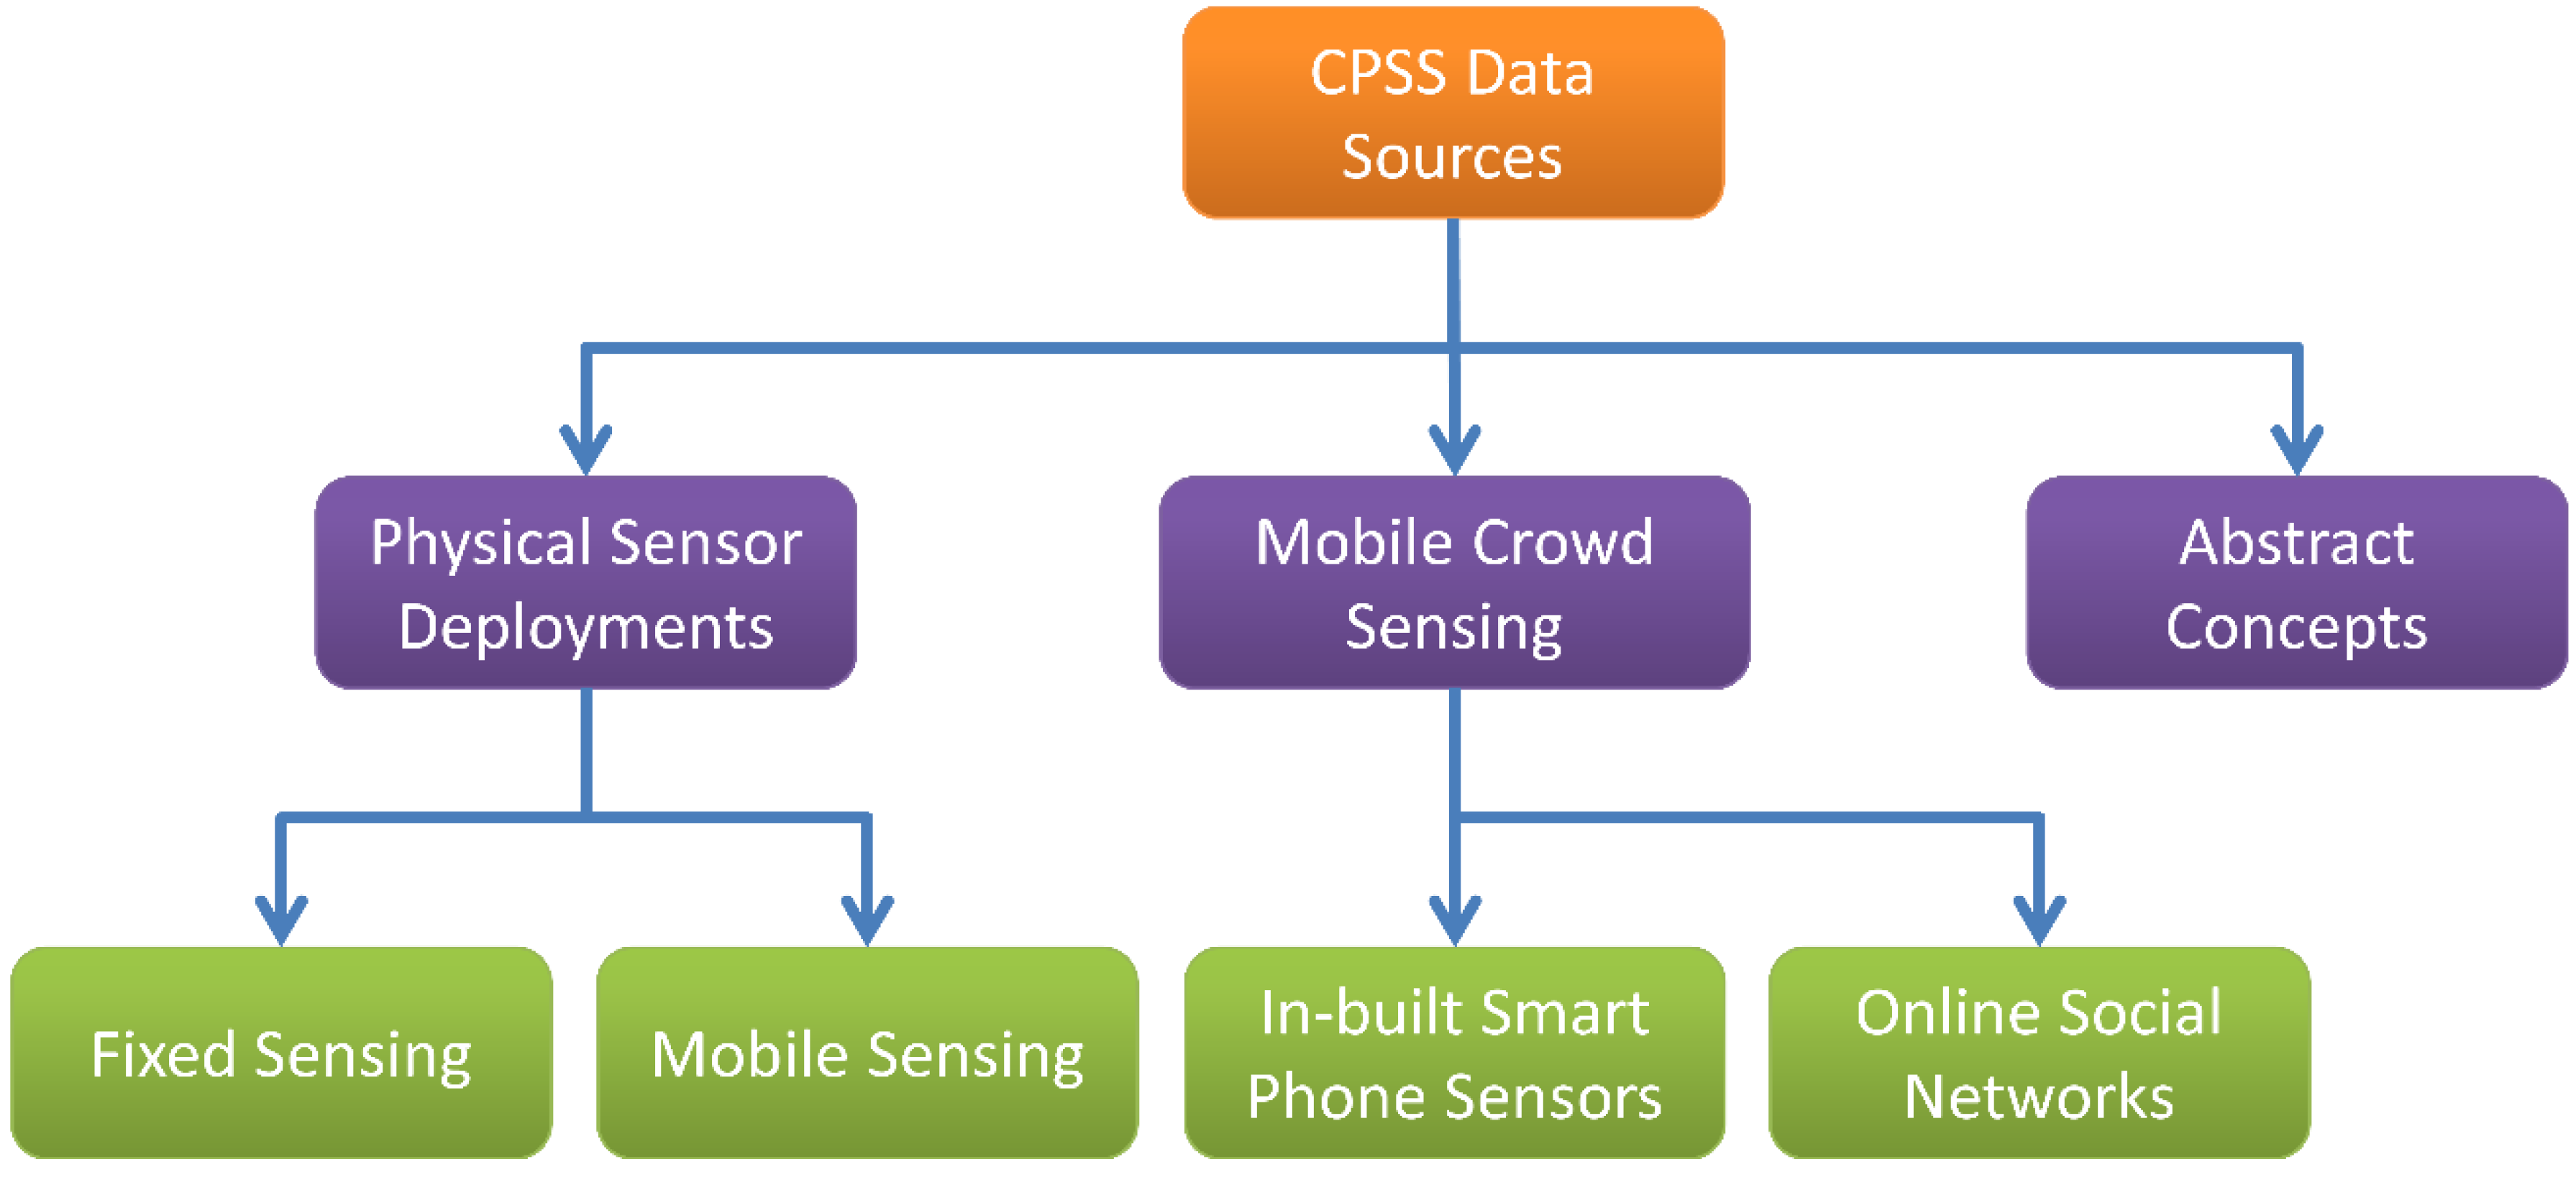
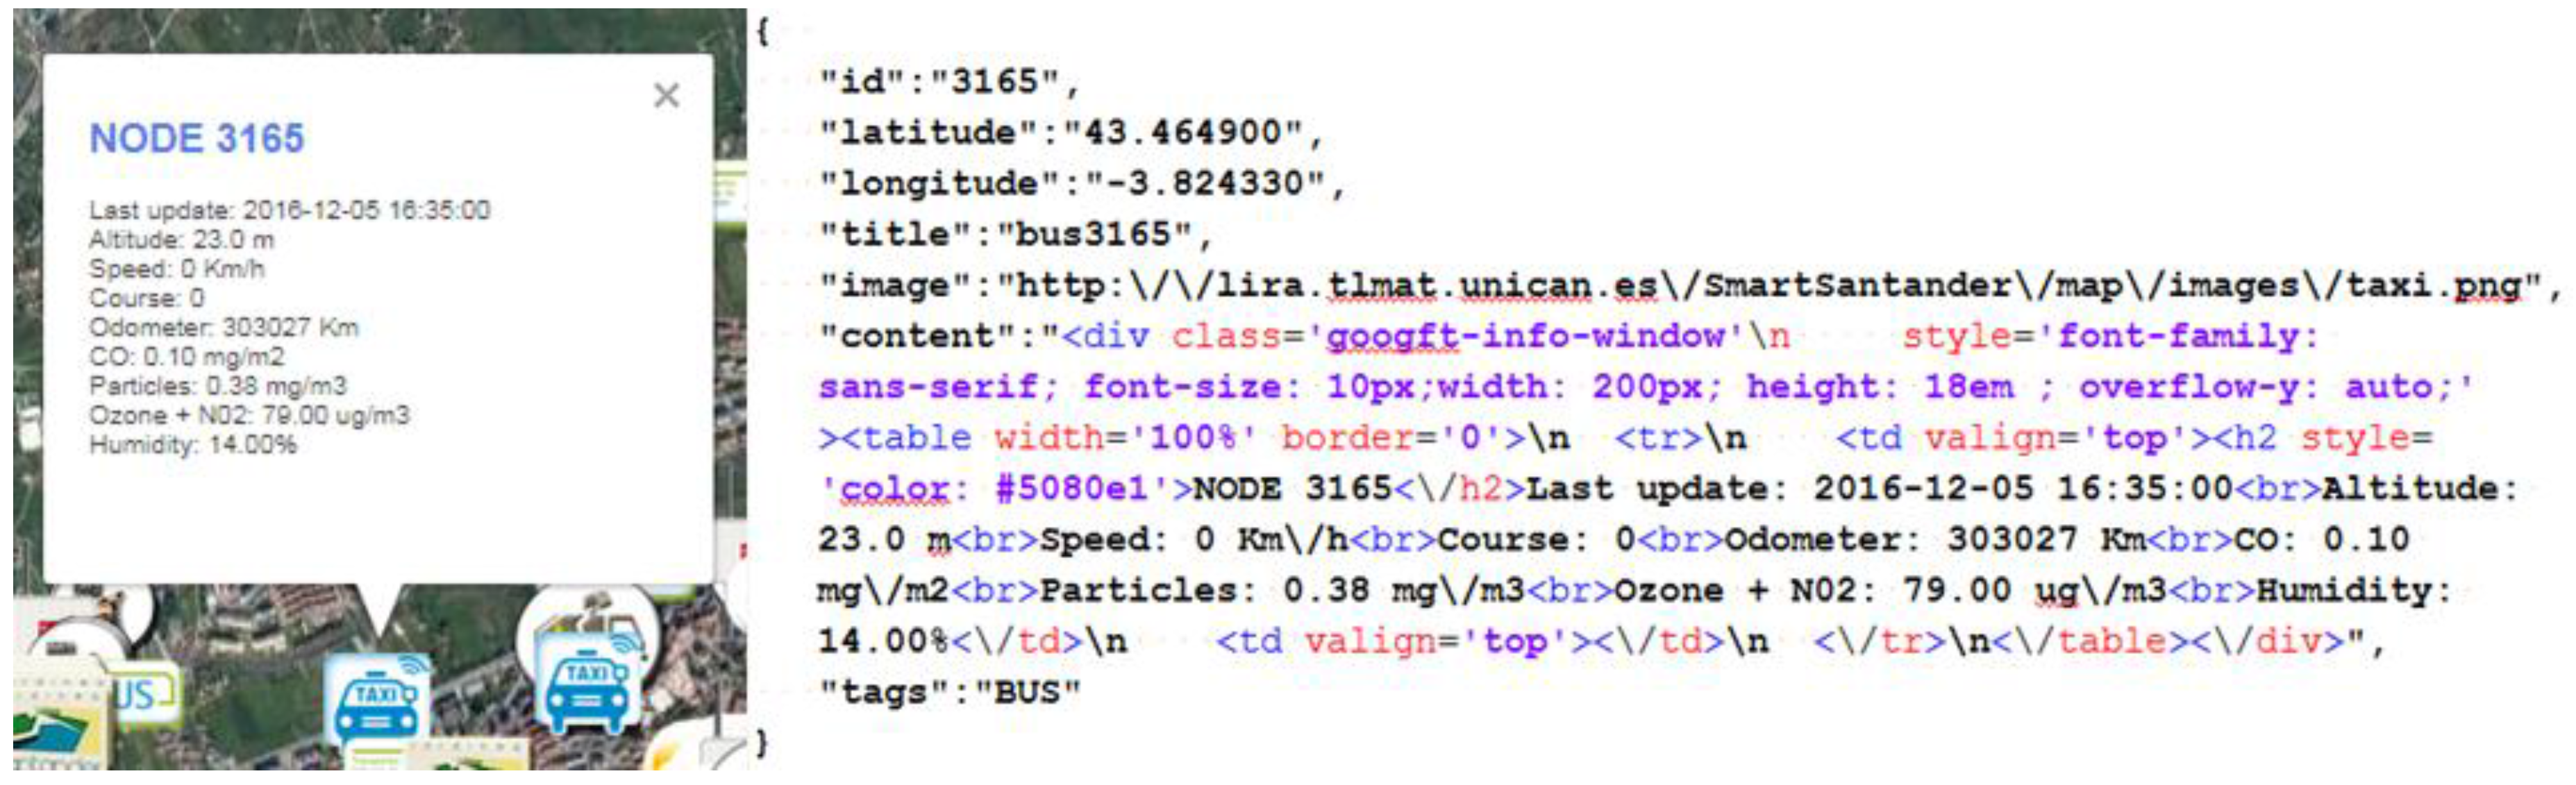
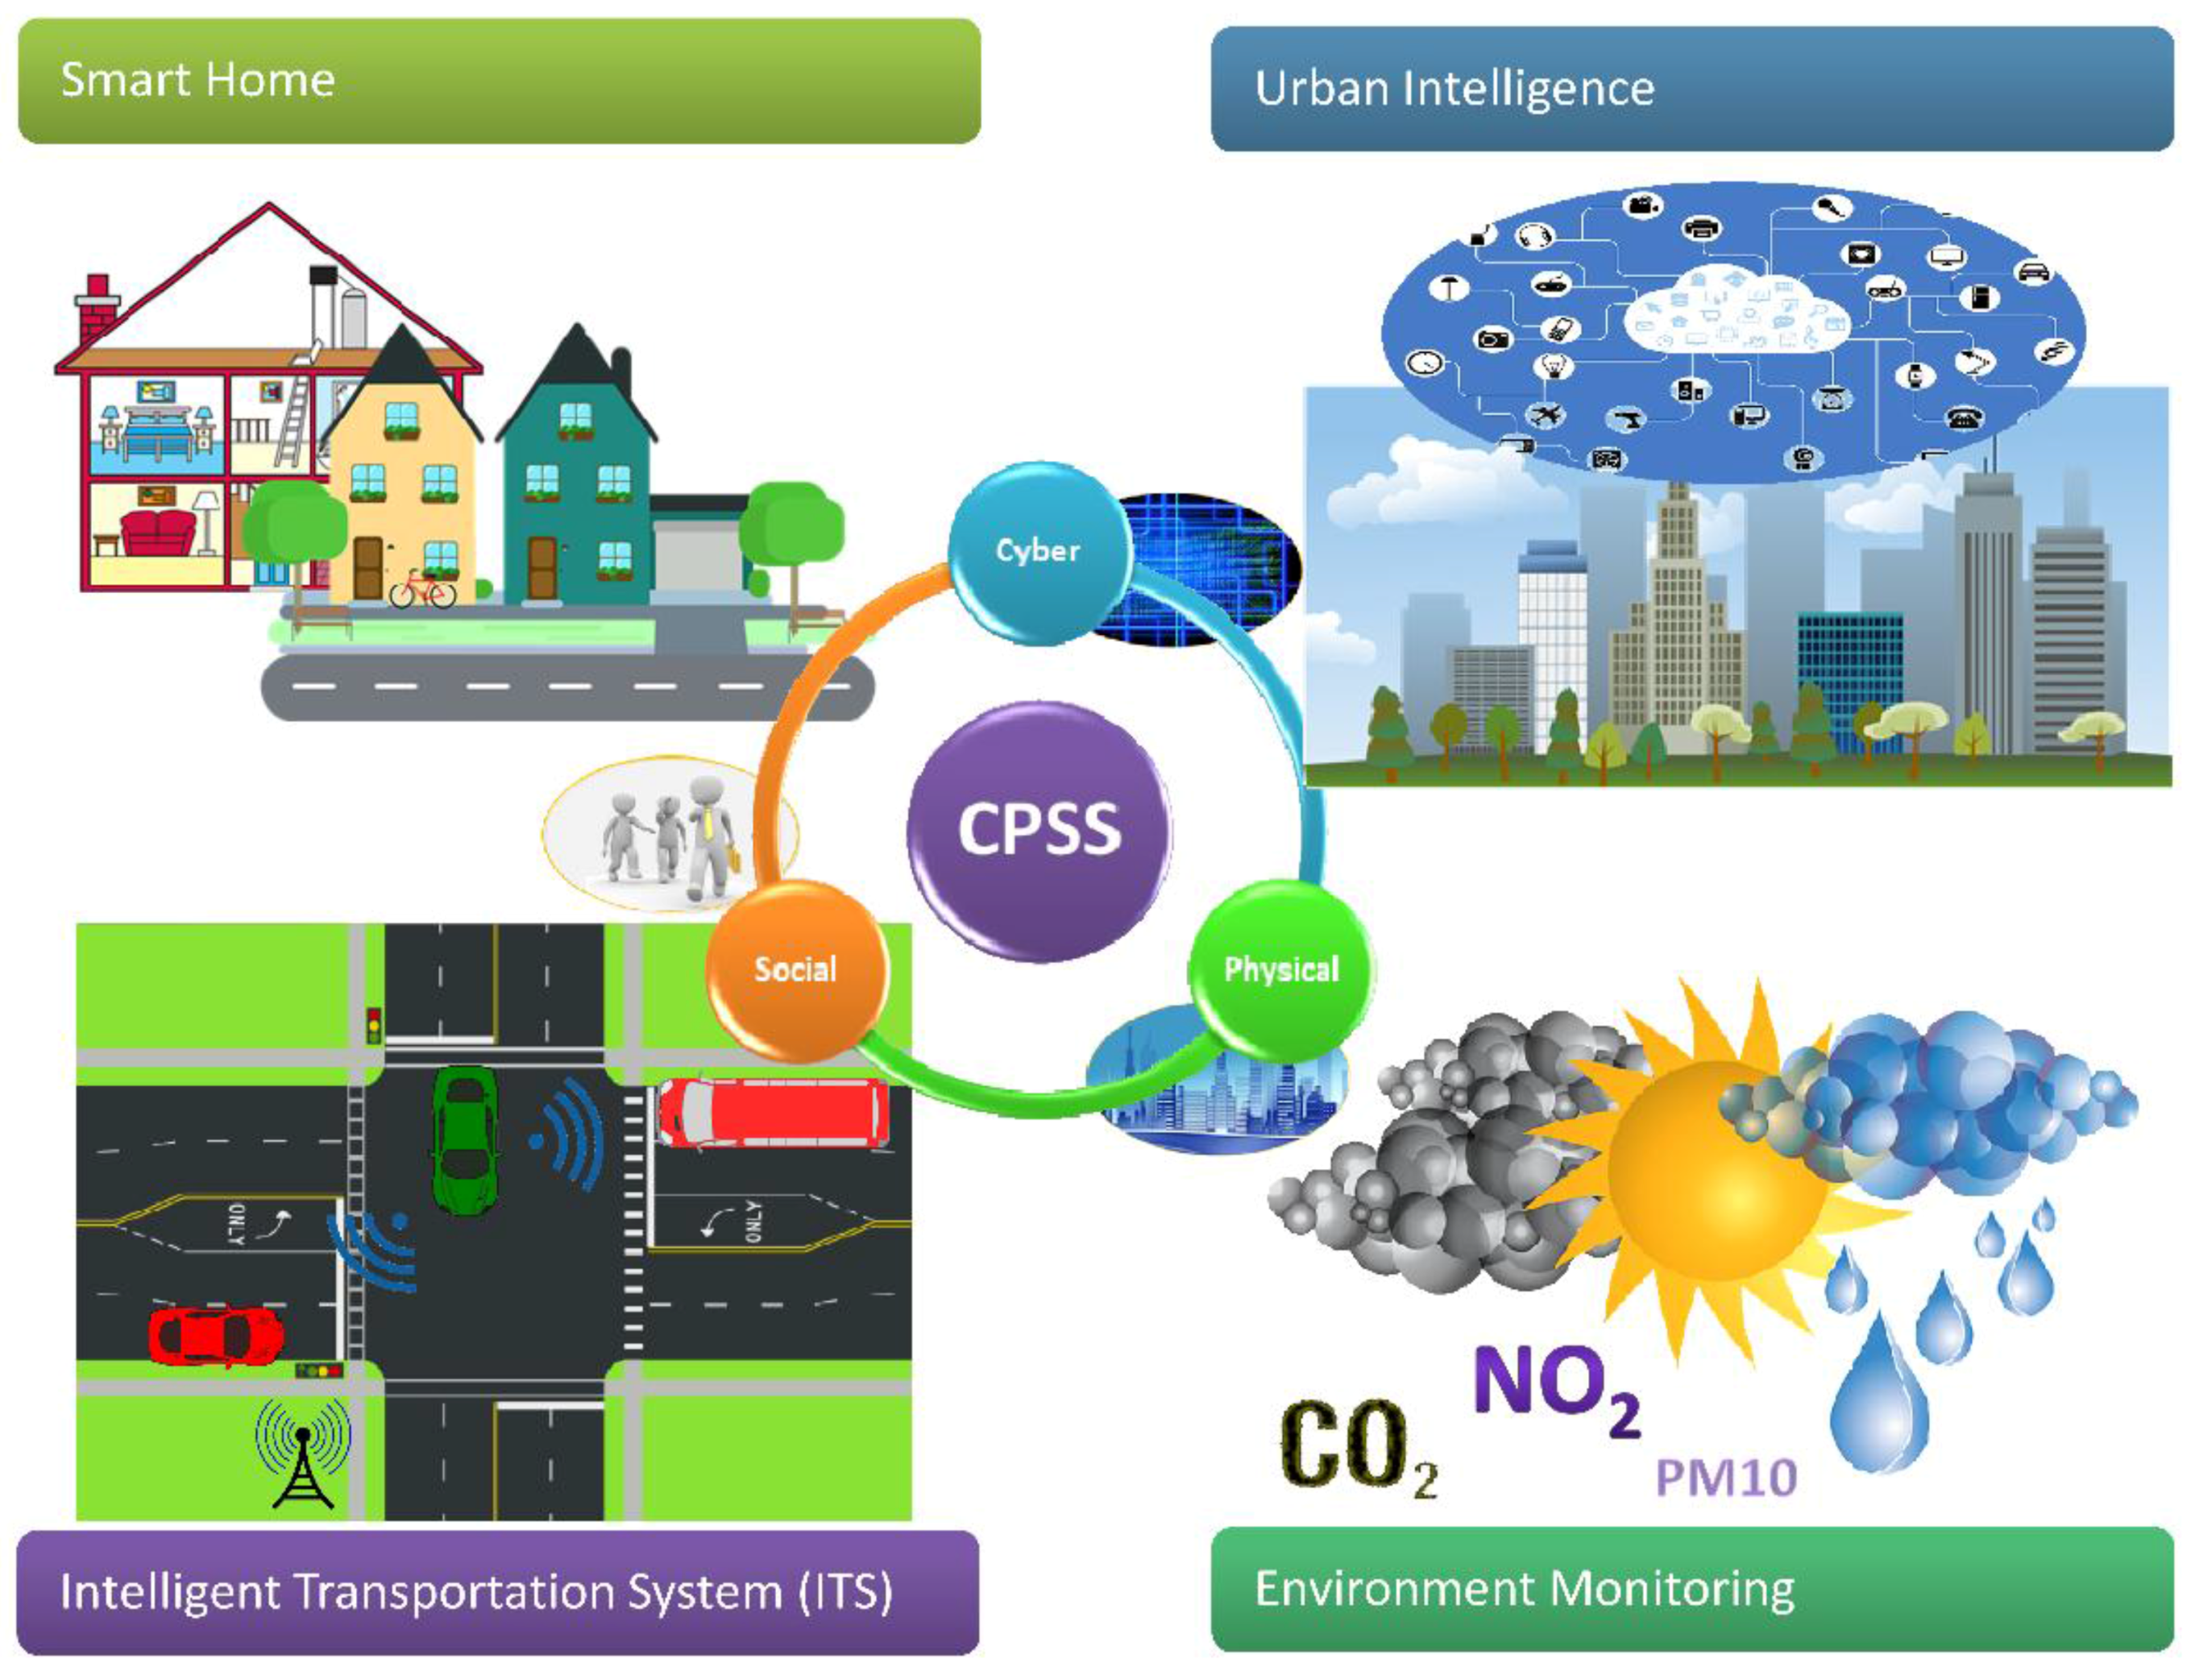
Table 1.
A Taxonomy of Urban CPSS Implementations.
| Reference | System Components | Data Sources | Data Processing | Data Fusion | Applications |
|---|---|---|---|---|---|
| Wi-City-Plus [38,39] | Communication layer, monitoring layer, application layer, semantic layer | Environment monitoring data, weather data, user health data, Static information (city ontologies), Participatory sensing for traffic conditions | Fuzzy rules through SPARQL Protocol and RDF Query Language (SPARQL) | Semantics-based mobility and logistics recommendation | Decision support system for Event and path recommendation, Road incident alerts, Elderly care |
| Komninos et al. [57] | Social media cloud, Web-based Geographic Information System (GIS), Mobile/Web apps, Cloud-based service infrastructure | Foursquare check-ins, Traffic volume measurements, Pollutant levels | Diurnal cumulative average | Cross-space data correlation | Urban rhythm |
| J. Jin et al. [18] | Data collection, Data processing Data management Data interpretation | Fixed and mobile sensing infrastructure, Participatory sensing | Visualization of cloud stored data | - | Noise mapping |
| Jara et al. [63] | Data read, data cleaning, data selection and transformation, data integration, analysis and visualization | Traffic data, Temperature measurements | Data aggregation for global mean | Traffic patterns correlated with temperature | - |
| Noulas et al. [64] | - | Foursquare check-ins, call data records | Spatial clustering, supervised classification algorithm | Foursquare venue label correlated with cell tower location | Urban neighborhood activity characterization |
| Air quality assessment from social media [32] | - | Air pollution data Tweets | Association rules, clustering, classification of air pollution data Sentiment analysis from tweets | Air Quality Index (AQI) of air pollution data are combined with public opinion estimation through sentiment analysis of tweets | Public opinion estimation of Air Pollution |
| Yang et al. [65] | Air quality data Subjective air quality feeling Activity status data from wearable sensors Reported health symptoms | Computing of average of data | Regression analysis on different kinds of data | Public health and personal health | |
| Kuznetsov et al. [31] | Global Positioning System (GPS)-based air quality sensors deployed by different communities of people | Air quality data are analysed by different communities. People in different communities can check the data and give feedback. | By analyzing data in different communities, expressions in the communities are discussed. | Public activism analysis | |
| Guo et al. [40] | Resource management Cooperative sensing Data pre-processing Data analysis | Sensing data | Quality maintenance Redundancy elimination Conflict resolution Semantic representation | Cross-Space Data Fusion | - |
| GroRec [66] | - | Different aspects of data from social networks, including user behaviors, reviews, and ratings etc. | Tensor model for spatiotemporal user behaviors, clustering for group discovery | Tensor decomposition, Group behavior data fusion for group discovery Pearson correlation for friendships | Group recommendation |
| Kuang et al. [42] | - | User behavior, spatiotemporal context | Tensor model for video clips, user relationships, RDF documents | Tensor decomposition | Smart home |
| Wang et al. [67] | - | User and device context | Tensor model for relationships between users and devices | Tensor decomposition | Enhanced living environment |
| Candra et al. [68] | CPSS monitoring framework Thing-based systems Software-based systems Human-based systems | Human, Software, Things-related data | Quality of data evaluation | - | Quality aware data delivery |
| Dynamic Social Structure of Things [69] | User context and profile management, Semantic rule engine, Natural Language Processing (NLP) | User profile, Object capabilities modelled as social objects | Event retrieval, goal determination | Dynamic social structure of Things model generated through semantic reasoning Object and service relevance | Smart Airport |
| Smirnov et al. [55] | - | - | Ontology modeling of physical, cyber and human spaces of a CPSS | - | Self-organizing resource network |
| Szabó et al. [70] | Streaming and persistence Serialization and caching Mobile data processing framework User defined functions | Participatory sensing data | Anomaly detection Visualization | - | Live transit feed Smart campus |
| Difallah et al. [71] | Water sensors Stream-processing subsystem array database management system | Real-time water sensing data | Local Indicators of Spatial Association (LISA) for Anomaly detection | - | Water Distribution Networks monitoring |
| Star-City [72] | Data access Data transportation | Weather conditions Bus data stream Social media feeds Planned events and roadworks Static city map | Spatiotemporal data analysis by SWRL (http://www.w3.org/Submission/SWRL/) rules | Semantic reasoning | Traffic prediction |
| CityPulse [56] | Large scale data stream processing modules Adaptive decision support modules | (near) real-time IoT data Social media data streams | Event detection Semantic Modeling Reasoning | Complementary interpretation | Travel planner Parking monitoring |
| SmartSantander [14,73] | IoT node tier IoT gateway tier Server tier | Environmental sensing data Parking Agriculture sensing data Participatory sensing | - | - | Environmental monitoring Parking management Participatory sensing etc. |
| CleanSpacce [74] | - | Pollution Temperature | Simple aggregations of pollution levels | Sensor information from all the users is combined based on location to create a map of the city | Personal journey optimization |
| Sentilio/Barcelona [75] | Apps Data Processing Agents Realtime Storage Security/Governance/Monitoring Catalog Providers | Smart meters smart bins location sensors in public transport sensors in the asphalt to detect parking spaces air quality sensors irrigation and water levels | Rules on sensor data (methods not disclosed) | - | Urban optimization, street lights, parking spaces, energy savings |
| SmartThings [76] | Application Management Event Stream Layer Connectivity Layer API Layer | Lights and Switches Outlets Motion Sensor Moisture Sensor Door/window sensor Camera/door locks | Rule engine conditions on sensors | Sensor information can be combined in different ways to create rules. External systems can also be integrated directly. | Smart Home control |
| Nest [77] | Service Layer (details not disclosed) API Layer | Thermostat/Temperature Sensors Smoke/CO sensors Presence sensor Energy Peaks | Machine learning from usage (method not disclosed) Rules on alerts | Combines data in the household to learn about habits and configures the thermostat accordingly. | Smart Home optimization, energy savings |
| W. Guo et al. [19] | Perception, communication, computing, control, application | V2I data, parking system sensors (cameras, infrared sensors), mobile sensors | Person trip intent derivation | Trip intent to influence traffic control system | Smart parking, adaptive traffic control |
| Delmastro et al. [78] | Client side app, Server side | Qualitative environment data, traffic data posted by users, personal activity data | - | - | Participatory sensing platform |
| Anagnostopoulos et al. [36] | Client side app, Server side | Sensing data from smart phones (GPS, time, velocity and direction) | Different sleep models for energy efficiency | - | Intelligent traffic light control for cyclists |
| Zhou et al. [33] | Client side app, Server side | Bus information streams, Passenger GPS traces, Points-of-Interest (POI) data | Density-based clustering, Different prediction models for passenger demand | - | Bus passenger demand prediction |
| MetroSense [79] | Server Tier, SAP (Sensor Access Point) Tier, Sensor Tier | Static and mobile sensors | Sensor data mining, Sensor data anomaly detection | - | People-centric Urban Sensing enabling |
| Smirnov et al. [11] | Physical level, planning level, strategic level | Ontology modeling of sensors and actuators (vacuum, cleaning robot) | Ontology matching | - | Smart home cleaning scenario |
© 2017 by the authors. Licensee MDPI, Basel, Switzerland. This article is an open access article distributed under the terms and conditions of the Creative Commons Attribution (CC BY) license (http://creativecommons.org/licenses/by/4.0/).
Share and Cite
MDPI and ACS Style
De, S.; Zhou, Y.; Larizgoitia Abad, I.; Moessner, K. Cyber–Physical–Social Frameworks for Urban Big Data Systems: A Survey. Appl. Sci. 2017, 7, 1017. https://doi.org/10.3390/app7101017
AMA Style
De S, Zhou Y, Larizgoitia Abad I, Moessner K. Cyber–Physical–Social Frameworks for Urban Big Data Systems: A Survey. Applied Sciences. 2017; 7(10):1017. https://doi.org/10.3390/app7101017
Chicago/Turabian StyleDe, Suparna, Yuchao Zhou, Iker Larizgoitia Abad, and Klaus Moessner. 2017. "Cyber–Physical–Social Frameworks for Urban Big Data Systems: A Survey" Applied Sciences 7, no. 10: 1017. https://doi.org/10.3390/app7101017
Note that from the first issue of 2016, this journal uses article numbers instead of page numbers. See further details here.