Soil–Structure–Equipment Interaction and Influence Factors in an Underground Electrical Substation under Seismic Loads


1
School of Civil Engineering, Xi’an University of Architecture & Technology, Xi’an 710055, China
2
School of Humanities, Xi’an Polytechnic University, Xi’an 710048, China
*
Author to whom correspondence should be addressed.
Appl. Sci. 2017, 7(10), 1044; https://doi.org/10.3390/app7101044
Submission received: 25 July 2017
/
Revised: 27 August 2017
/
Accepted: 25 September 2017
/
Published: 12 October 2017
(This article belongs to the Special Issue Development and Application of Nonlinear Dissipative Device in Structural Vibration Control)
Abstract
:Underground electrical substations play an increasingly significant role in urban economic development for the power supply of subways. However, in recent years, there have been few studies on the seismic performance of underground electrical substations involving the interaction of soil–structure–equipment. To conduct the study, three-dimensional finite element models of an underground substation are established. The implicit dynamic numerical simulation analysis is performed by changing earthquake input motions, soil characteristics, electrical equipment type and structure depths. According to a seismic response analysis, acceleration amplification coefficients, displacements, stresses and internal forces are obtained and analyzed. It is found that (1) as a boundary condition of soil–structure, the coupling boundary is feasible in the seismic response of an underground substation; (2) the seismic response of an underground substation is sensitive to burial depth and elastic modulus; (3) the oblique incidence of input motion has a slight influence on the horizontal seismic response, but has a significant impact on the vertical seismic response; and (4) the bottom of the side wall is the seismic weak part of an underground substation, so it is necessary to increase the stiffness of this area.
1. Introduction
In order to meet the requirements of the rapid growth of urban power load under the constraint of densely populated urban land, the number of underground electrical substations has been increasing in recent years. The disaster prevention and mitigation issue of underground structures, including with regard to underground electrical substations, is receiving increasing attention. Therefore, many scholars have focused on the interaction of structure–equipment and the seismic performance of underground structures.
Suarezn and Singh (1989) [1] first developed the interaction principle of primary–secondary structure and obtained response spectrum curves based on the different floors by a simple model involving equipment–structure interaction. Pires (1996) [2] established a simulation model of a San Francisco substation for seismic reliability analysis and compared the numerical substation damages with the real damages caused by Loma Prieta earthquake in 1989. Bazán-Zurita (2009) [3] illustrated concepts interpreting and supplementing the seismic provisions of Manual 113 (Kempner, 2008 [4]) which defined seismic design spectra as simultaneous occurrence of ground motion in three mutually perpendicular directions and estimation of deflections under seismic loading. Poor seismic performance of these system components could result in extended power outages that might propagate far beyond the local epicentral region. Knight and Kempner, Jr. (2009) [5] proposed a Seismic Vulnerability Reduction Program (SVRP) design method to improve the seismic weak parts of substation and present several suggestions on the seismic design of a transformer substation. The international atomic energy agency (IAEA, [6]) provided seismic evaluation criteria on the interaction of structure–equipment in a nuclear power plant. Furthermore, from the study of the interaction between the main plant and electrical equipment (EE) in transformer substations, it was found that the seismic response of the main structure and equipment was not usually synchronized and equipment had a negative effect on the seismic ability of the substation (Wen and Niu, 2013 [7]; Wen et al., 2015 [8]).
To date, many researchers have focused on the interaction of soil–structure. Assuming that interaction force is transformed by a spring and damper, Yuan (1970, [9]) introduced the soil–structure interaction principle. Rodriguez (1985, [10]) analyzed the static interaction between soil and the tunnel lining and found that the force between soil and structure had a significant relationship with contact surface roughness. Penzien (2000, [11]) developed an analytic method involving shear interaction between soil and structure. Based on Penzien’s studies, Huo (2000, [12]) established a hysteretic non-linear soil model to investigate the load transfer mechanisms between underground structure and surrounding soil. Therefore, dynamic finite element analyses were conducted to investigate the load transfer mechanisms between underground structure and surrounding soil. Gong (2002, [13]) studied the responses of an underground structure under vertical seismic excitation through the shaking table test, analyzing the dynamic interaction of soil and underground structure. Based on the background of metro construction in Nanjing city, China, a shaking table test was conducted to model the interaction of soil–metro structure with a liquefiable soil effect. Chen and Zhuang (2006, 2007, [14,15]) studied the dynamic damage characteristics of underground structures in far-field earthquake motions and near-field earthquake motions. According to the static and dynamic coupling effects on the underground structure and surrounding rock system, Du (2009, [16]) proposed stress viscoelastic artificial boundary conditions to establish an underground structure–soil computational model. Tao (2012, [17]) calculated the side wall deformation and structural internal force of a single-story frame of Zhijing line subway in Beijing with different geological conditions and cover depths. In order to understand the distribution of internal force of the underground shield tunnel under earthquake motions, Geng (2013, [18]) investigated the seismic response of underground tunnels in different site types using a quasi-static method and indicated that such a method was more suitable to underground tunnels in soft foundation. Debiasi (2013, [19]) proposed a nonlinear static analysis of a rectangular tunnel by using several different simplified numerical methods, and the qualitative relationship between seismic dynamic strength and structure geometry, overburden thickness and soil stiffness were obtained. Liu (2014, [20]) put forward a Pushover analysis method with good accuracy and reliability, which applied to substructure seismic analysis and design. Kang (2014, [21]) studied the influence of foundation liquefaction on the substructure and conducted an experimental study and numerical analysis on the seismic response of a circular subsurface structure using a modified simple calculating method. Kyriazis (2014, [22]) performed a numerical analysis on an arched tunnel using finite element software and found that some given parameters such as the sectional area of arch, and the thickness of surrounding rock and soil characteristic, had a significant influence on the tunnel seismic response.
From the above research, it is known that underground structure types become more complicated and there are few studies on the seismic performance of underground substations involving the interaction of soil–structure–equipment. In past studies, such interaction in underground substations was usually ignored, and the seismic response caused by characteristics of electrical equipment and soil were neglected. For these reasons, some positive research is proposed in this paper. A three-dimensional finite element model of an underground substation is established to conduct dynamic numerical simulation analysis. By changing some parameters such as ground motions, properties of surrounding soils, electrical equipment and structure depth, the dynamic results of acceleration amplification coefficients, displacements, stresses and internal forces under different earthquake motions are obtained and analyzed.
2. Dynamic Interaction Mechanism of Soil–Structure–Equipment
It is well known that the dynamic equation of structure under earthquake motions can be shown as Equation (1) (Clough and Penzien, 1993, [23]).
where is the mass matrix, is the acceleration vector, is the damping matrix, is the velocity vector, is the stiffness matrix, is the displacement vector, and is the load vector.
For the underground substation model, it usually includes three parts: soil, structure and electrical equipment. Similar to Equation (1), the dynamic equation of an underground substation can be described as Equation (2), in which subscripts s, c, and j are denoted as soil, structure, and electrical equipment respectively.
The approximate solution is solved by the Newton Method [24], as shown in Equations (3)–(5).
where is the exact solution of Equation (2) and is the approximate solution of Equation (2). The dynamic equation numerical solution is solved when a small enough number exists in Equation (5).
3. Numerical Simulations
3.1. Finite Element Models
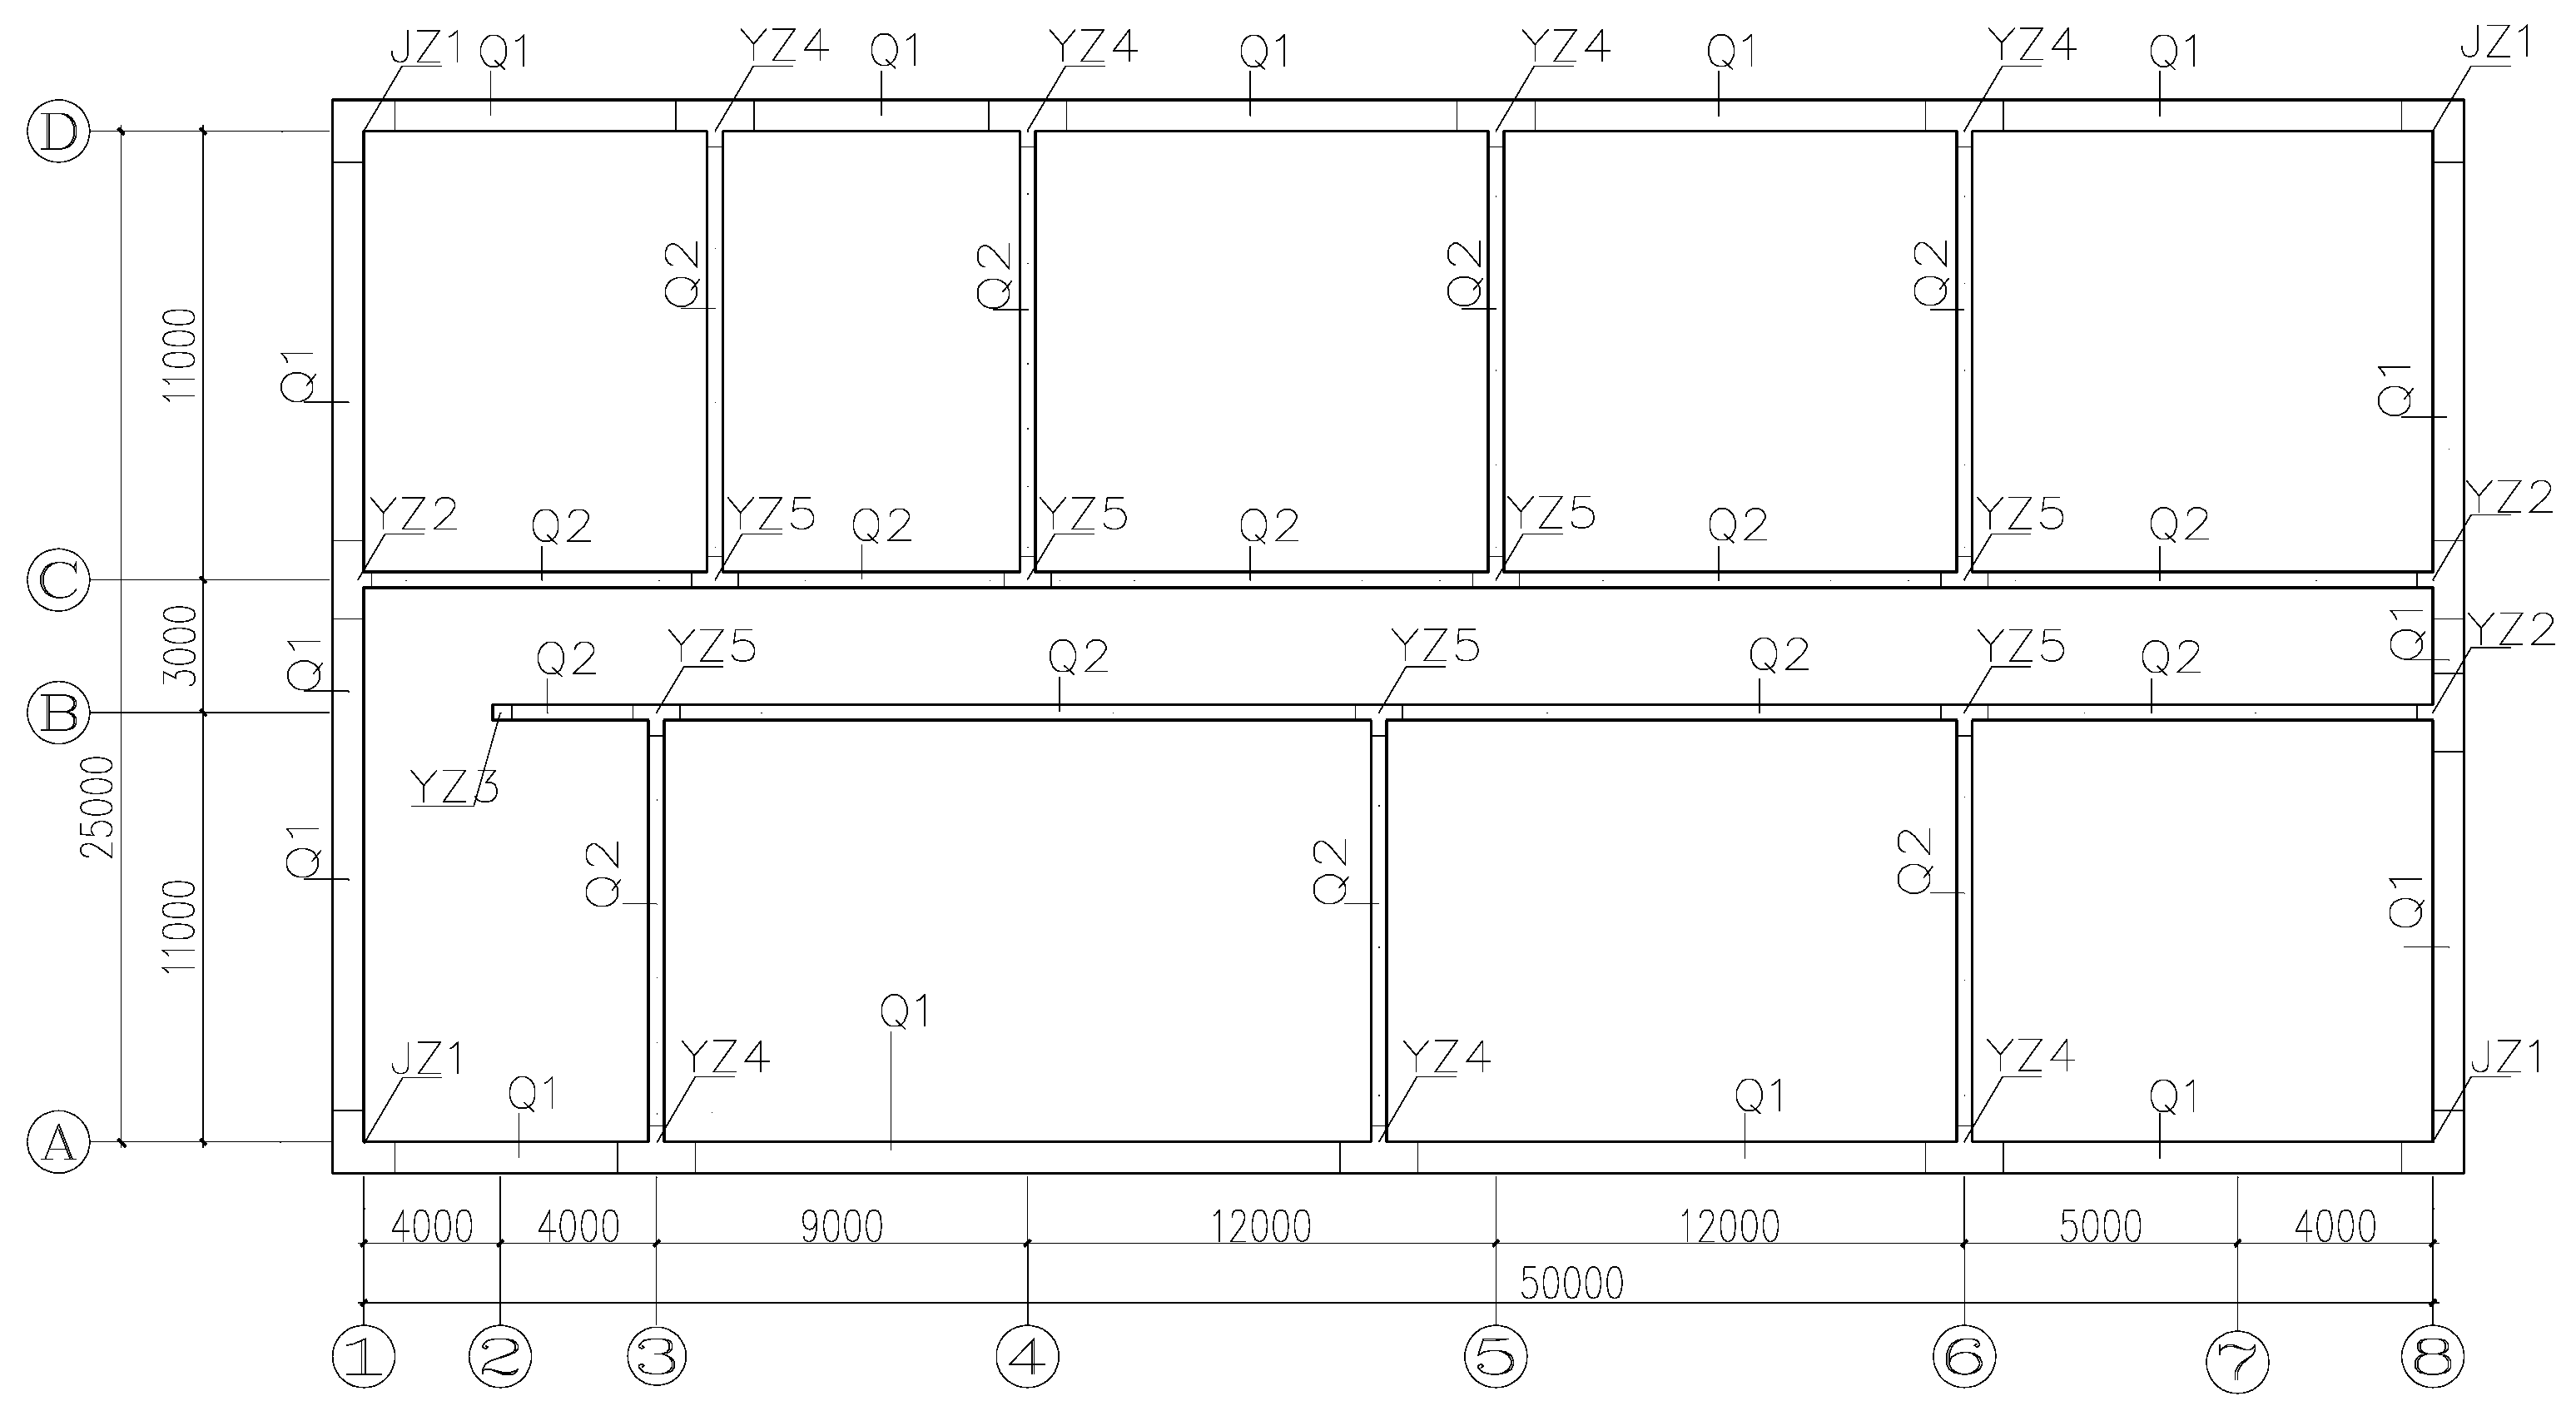
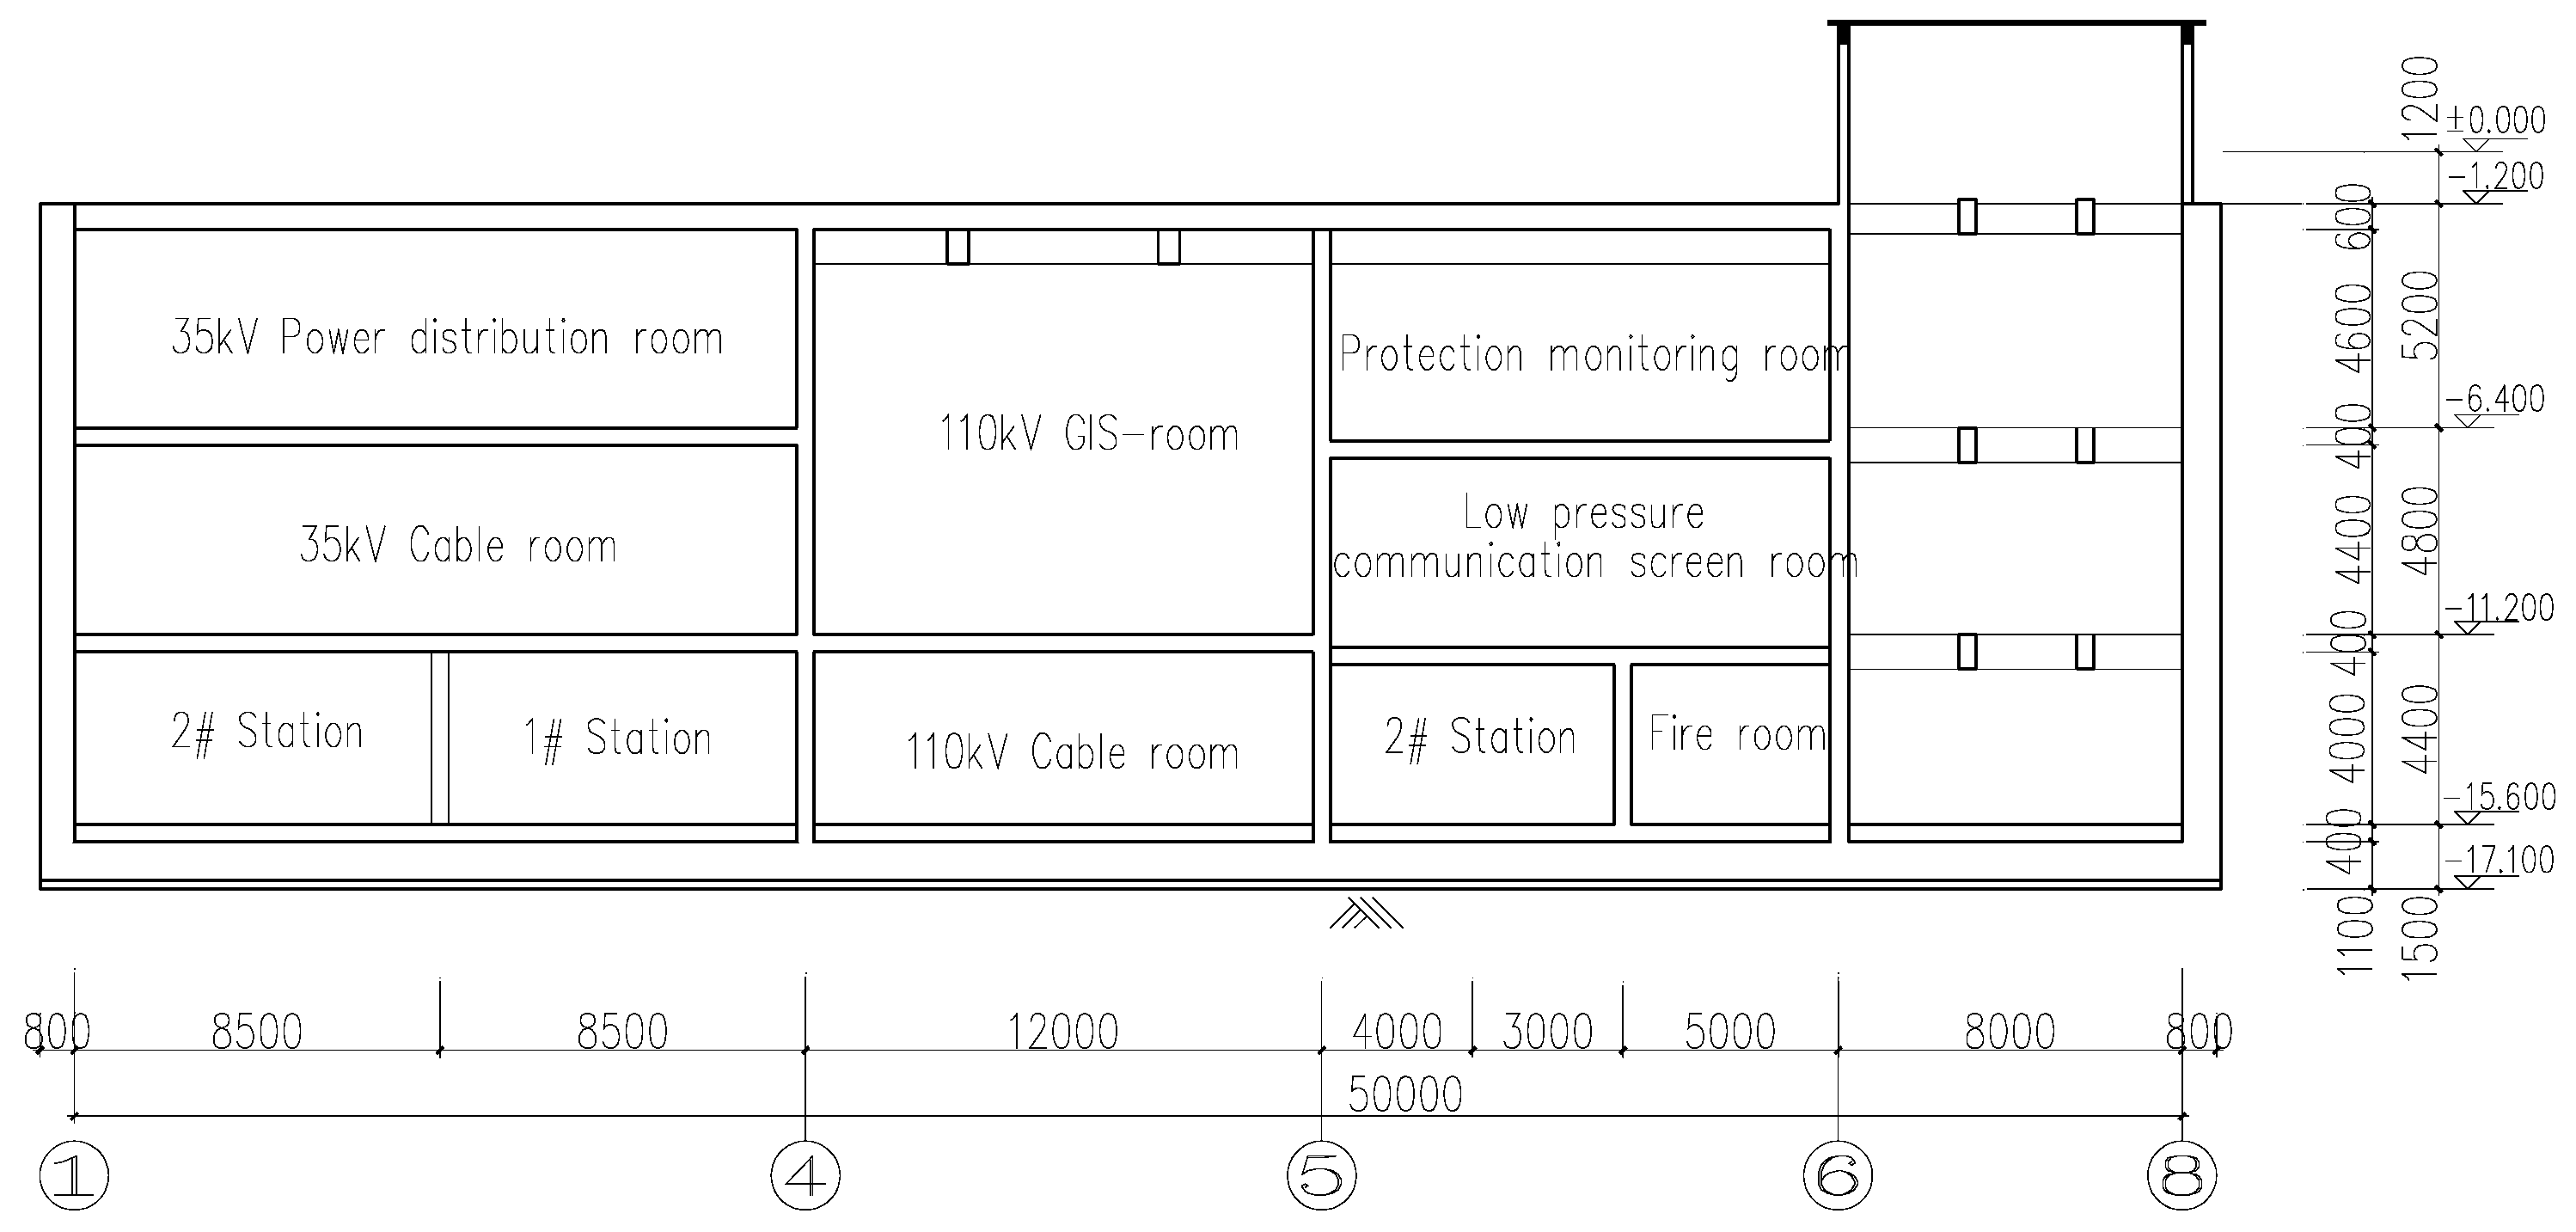
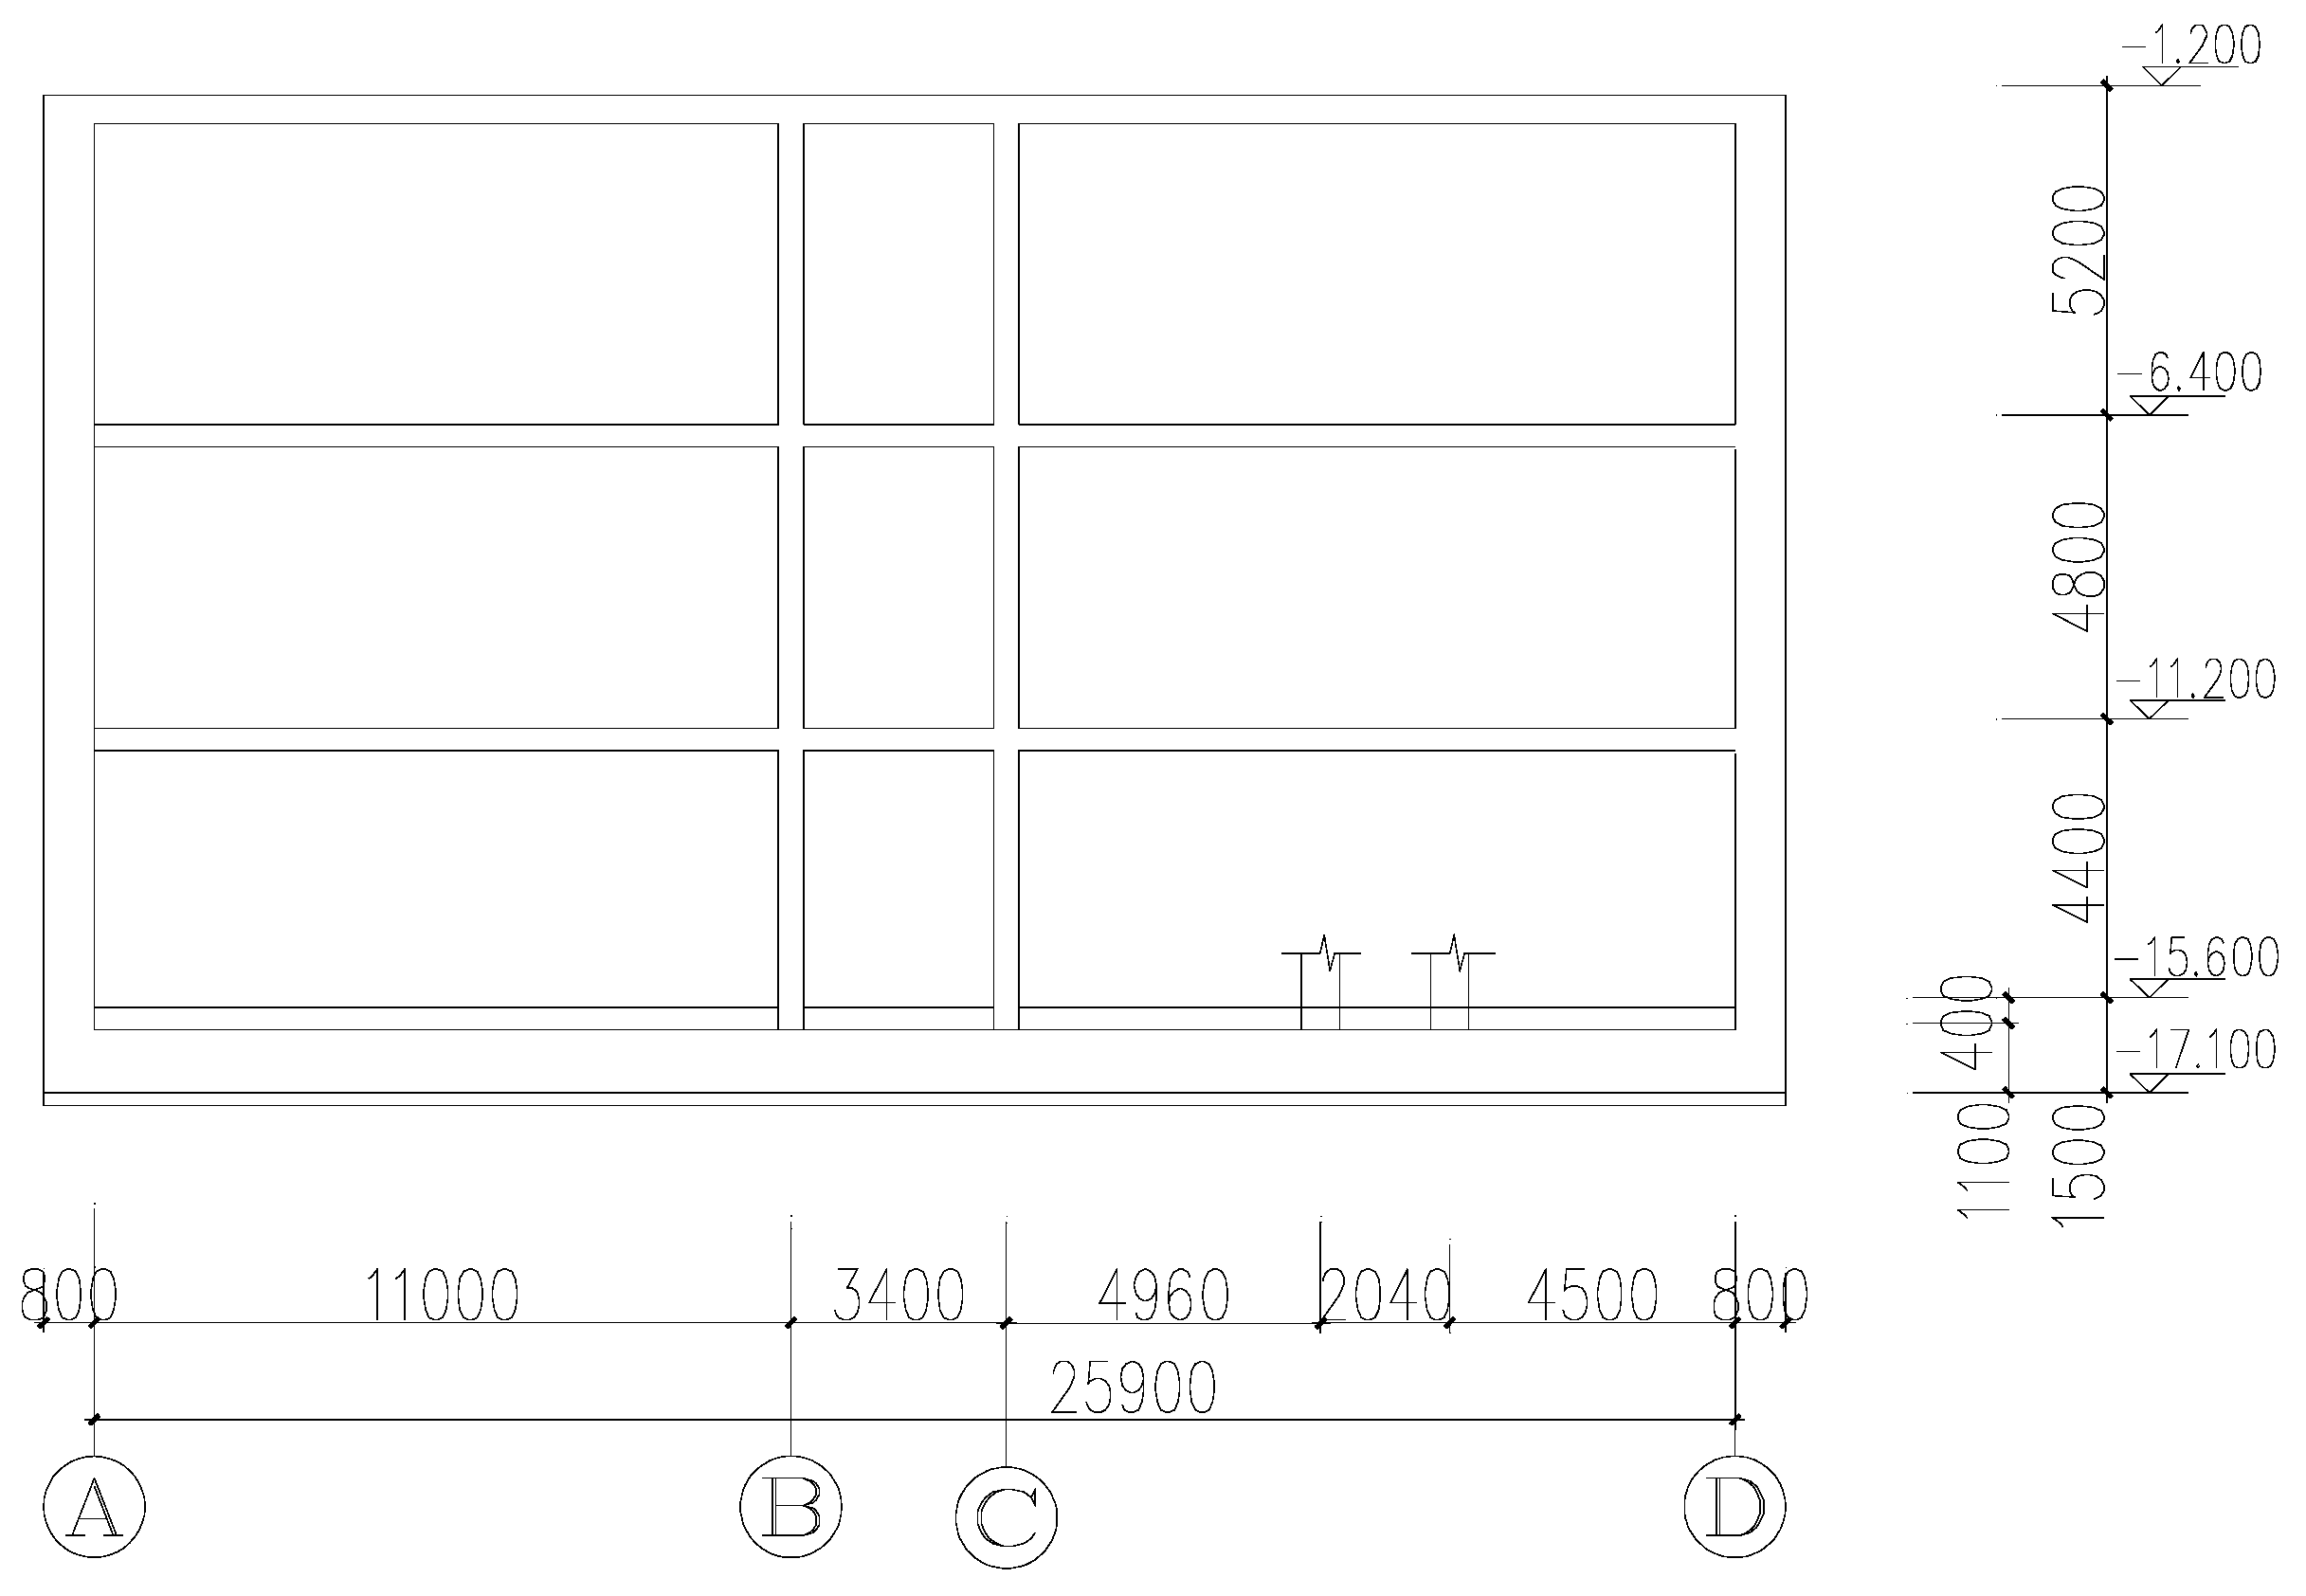
The prototype substation used in this study is selected from Urban underground substation design rule (2005, China) [25]. The main plant of the underground substation is a three-story, four-bay reinforced concrete shear wall structure, as shown in Figure 1, Figure 2, Figure 3 and Figure 4. The dimensions of the main plant are 50 m by 25 m, and floor heights from the bottom to top are 4.4 m, 4.8 m, and 5.2 m respectively.
The exterior wall of the main plant structure is made of a reinforced concrete wall, 0.45 m in width. The dimensions of the main beams are 600 × 1300 mm2, 500 × 1400 mm2, 500 × 1000 mm2 separately, and the cross-sectional dimension of the transverse beams is 400 × 1000 mm2. The thicknesses of the first, second, third, and roof slabs are 900 mm, 400 mm, 400 mm, and 600 mm respectively. The total weight of the plant is approximately 27,530 kN.
Ten sets of electrical equipment, shown in Figure 5, are installed on the second floor, the dimensions of which are 6.0 m (length), 2.0 m (width) and 3.5 m (height). The total weight of the equipment is approximately 964 kN, which corresponds to 3.5% of the plant weight.
The plant was designed by Chinese loading Code for Design of Building Structures (2012, [26]), in which gravity loads are selected as 1.8 kN/m2 for floors and 3.5 kN/m2 for the roof. Live loads are selected as 2.5 kN/m2 for floors and 2.0 kN/m2 for the roof. The gravity load of equipment is 8.0 kN/m2. The seismic design of the substation is allowed according to Chinese Code for Seismic Design of Buildings (2010, [27]) and Chinese Code for Seismic Design of Electrical Installations (2013, [28]). The underground substation is assumed to be located in Xi’an, China, where the design basis acceleration associated with 10% probability exceedance in 50 years is 0.2 g (g denotes the coefficient of gravitational acceleration). The compressive strength of concrete and the yield strength of steel are taken as fc = 30 MPa, and fy = 400 MPa, respectively. According to the first eigen-frequency, the factor is shown in Equation (6).
Based on a natural frequency extraction analysis of the interaction system, the first eigen-frequency is 0.39 rad/s. Therefore, is 0.179 s.
The models were developed and analyzed in ABAQUS (2006, [29]). The beams and columns are modeled in three-dimensional beam elements, the floors and concrete walls are modeled in shell elements, and the equipment is modeled in pipe elements, as shown in Figure 6. The three-dimensional finite element electrical equipment model is shown in Figure 7. The concrete plastic-damage model is used for the constitutive properties of concrete material and the double linear dynamic reinforcement model is used for rebar. Druker–Prager, a generalized Mises yield criterion, is adopted in soil dilation. The effect of hydrostatic pressure on yield and strength is used as the constitutive model of soil (Liu et al., 2006, [30]). The physical and mechanical parameters of soil, as determined by the penetration test and consolidation test, are listed in Table 1. Based on the artificial constrained boundary, the boundary element is used to simulate the infinite field of soil, and the horizontal reaction forces on the lateral boundary are determined by static analysis. According to the literature (Liu et al., 2006 [31]; Huang et al., 2010 [32]), the coupling analysis method is used in the soil boundary condition. Meanwhile, it is suggested from literature (Lou et al., 1999 [33]; Lou et al., 2000 [34]) that five times the width of the structure can be defined as the width of the computational area of soil in order to reduce the motion reflection on the boundary. Following this rule, five times the width of the structure is selected as the soil width in the finite element model. Therefore, the soil size of the finite element is 250 m × 132.5 m × 50 m and the size of the entire soil is 500 m × 265 m × 50 m. The arbitrary Lagrangian Eulerian (ALE) adaptive meshing method is used to maintain a high-qualified meshing system for soil, which allows the meshes to move independently when large deformation of liquefied soils occurs. The soil element meshes are shown in Figure 8, in which the finite element of soil is simulated by unit C3D8R. In order to simulate the most realistic condition of soil and simplify some less salient factors in this paper, the following basic assumptions are advised in analysis (Chen [35], 2015; Novak [36], 1972).
- (1)
- Each layer of soil is homogeneous, and extends infinitely in the horizontal direction;
- (2)
- There is no relative sliding among different layers of soil;
- (3)
- Earthquake excitations are supposed from the bottom of the foundation;
- (4)
- The movement of each point on the bottom of the foundation is consistent without a traveling motion effect.
According to the classification of site type and seismic fortification intensity, three earthquake records—El-Centro record, Taft record and Lanzhou record—were derived from the registered seismic data. Moreover, in order to obtain earthquake motions, three earthquake records were back-calculated to the bottom of the foundation level by the SHAKE91 procedure (Idriss et al., 1992 [37]). According to the finite element division of the soil layer, soil properties such as density, shear velocity, shear modulus of elasticity, etc., were taken into account in earthquake motion inversion. Time-histories and spectra of these records after inversion are shown in Figure 9, Figure 10, Figure 11, Figure 12, Figure 13 and Figure 14.
3.2. Accuracy Verification of the Finite Element Model
The soil boundary condition of the coupling analysis method of the finite element and infinite element, which reasonably reflects the real boundary condition, gives a unified solving format, and makes the infinite element of the soil section become part of the finite element model (Liang et al., 2010 [38]; Meng et al., 2012 [39]). Compared with the viscoelastic boundary condition, the infinite element boundary condition can not only simulate the far field boundary to absorb seismic energy, but also correctly simulate the boundary conditions whose infinity displacement is zero. Therefore, the coupling analysis method of the finite element and infinite element is used as the soil boundary condition to simulate semi-infinite domain soil.
For the three-dimensional finite element model, the distance value r is first calculated from the random boundary node to the structure center. Secondly, normal spring stiffness, normal damping coefficient, tangential spring stiffness, and tangential damping coefficient of the node on the boundary are calculated by Equations (7) and (8). Finally, all of the boundary nodes are calculated cyclically in order to obtain a viscoelastic artificial boundary.
where cp is the longitudinal velocity of the medium, cs is the longitudinal velocity of the medium, ρ is density, λ and G are lame constants, and r is the distance from the artificial boundary point to the scattering source.
The soil surface is supposed to be a free boundary, and the horizontal reaction forces at the nodes on the lateral boundary and bottom boundary are calculated according to the artificially constrained boundary assumption (Liu et al., 2006 [31]; Huang et al., 2010 [32]). Therefore, the fixed boundary model, viscoelastic boundary model and coupling analysis model are set up to verify different soil boundary conditions, which are simplified as follows:
- Model 1 (M1): Coupling boundary between finite elements and infinite elements
- Model 2 (M2): Viscoelastic boundary
- Model 3 (M3): Fixed boundary
The acceleration time–history curves at the soil surface midpoint are shown in Figure 15.
From Figure 15, it can be inferred that the curves are almost the same in three different conditions before 4 s. After 4 s, only curves of Model 1 and Model 2 are similar to each other, while the acceleration values of Model 3 gradually increase compared to those of the other two curves. The reason is that seismic energy is absorbed and the seismic wave is rarely reflected when the motions pass through the infinite element boundary or viscoelastic artificial boundary, while seismic energy is greatly reflected when the motions pass through the fixed boundary, which leads to the accumulation of acceleration values on the free boundary. Therefore, compared with the viscoelastic boundary condition, the infinite element boundary condition does not need to be involved in the analytical solution expression in ABAQUS software. For this reason, Model 1 is selected as the soil boundary condition in this paper.
4. Numerical Simulation Analysis
The underground substation model involving interaction of soil–structure–equipment is established for numerical simulation analysis. Based on finite element analysis, the influence of some parameters on seismic response such as oblique incidence of input motion, properties of surrounding soils, and burial depth of the underground substation are analyzed.
4.1. The Seismic Response under Different Ground Motions
According to Chinese Code for Seismic Design of Buildings (2010, China [27]), the peak ground acceleration (PGA) is given in Table 2, in which the scales of PGA in X, Y and Z directions are adjusted to 0.20 g, 0.17 g, and 0.13 g, respectively.
4.1.1. Acceleration Responses
The acceleration amplification factors under 0.20 g are shown in Table 3, in which the acceleration amplification factor is defined as the ratio of the peak acceleration of the layer over the peak acceleration of input motion.
The following can be inferred from Table 3:
- (1)
- The acceleration amplification factors in the X-direction are larger than those in the Y-direction in M1 and M3, which means that the seismic response of the underground substation in the X-direction is more severe than that in the Y-direction. The seismic response including acceleration responses, displacement responses and internal force responses of 0.17 g PAG in the X-direction and 0.2 g PAG in the Y-direction would be reduced but the response rule is uniform.
- (2)
- The acceleration amplification factors in the Z-direction of M3 are larger than those in M2. The reason is that the seismic response is magnified under multi-direction earthquake motions compared with that under the one-direction earthquake input motion and the horizontal earthquake motions have a reverse effect on the seismic response in the Z-direction.
- (3)
- The peak vertical and horizontal acceleration amplification factors are 1.526 and 0.760, respectively, which means that the oblique incidence of input motion has a slight influence on the horizontal seismic response, but has a significant impact on the vertical seismic response.
4.1.2. Displacement Responses
The horizontal deformation of the side wall causes eccentric compression and a large bending moment, which can lead to damage of the side wall. Therefore, the horizontal layer drift of the underground substation is the major factor of side wall damage, and it is necessary to analyze the horizontal relative deformation of the underground substation under different ground motions.
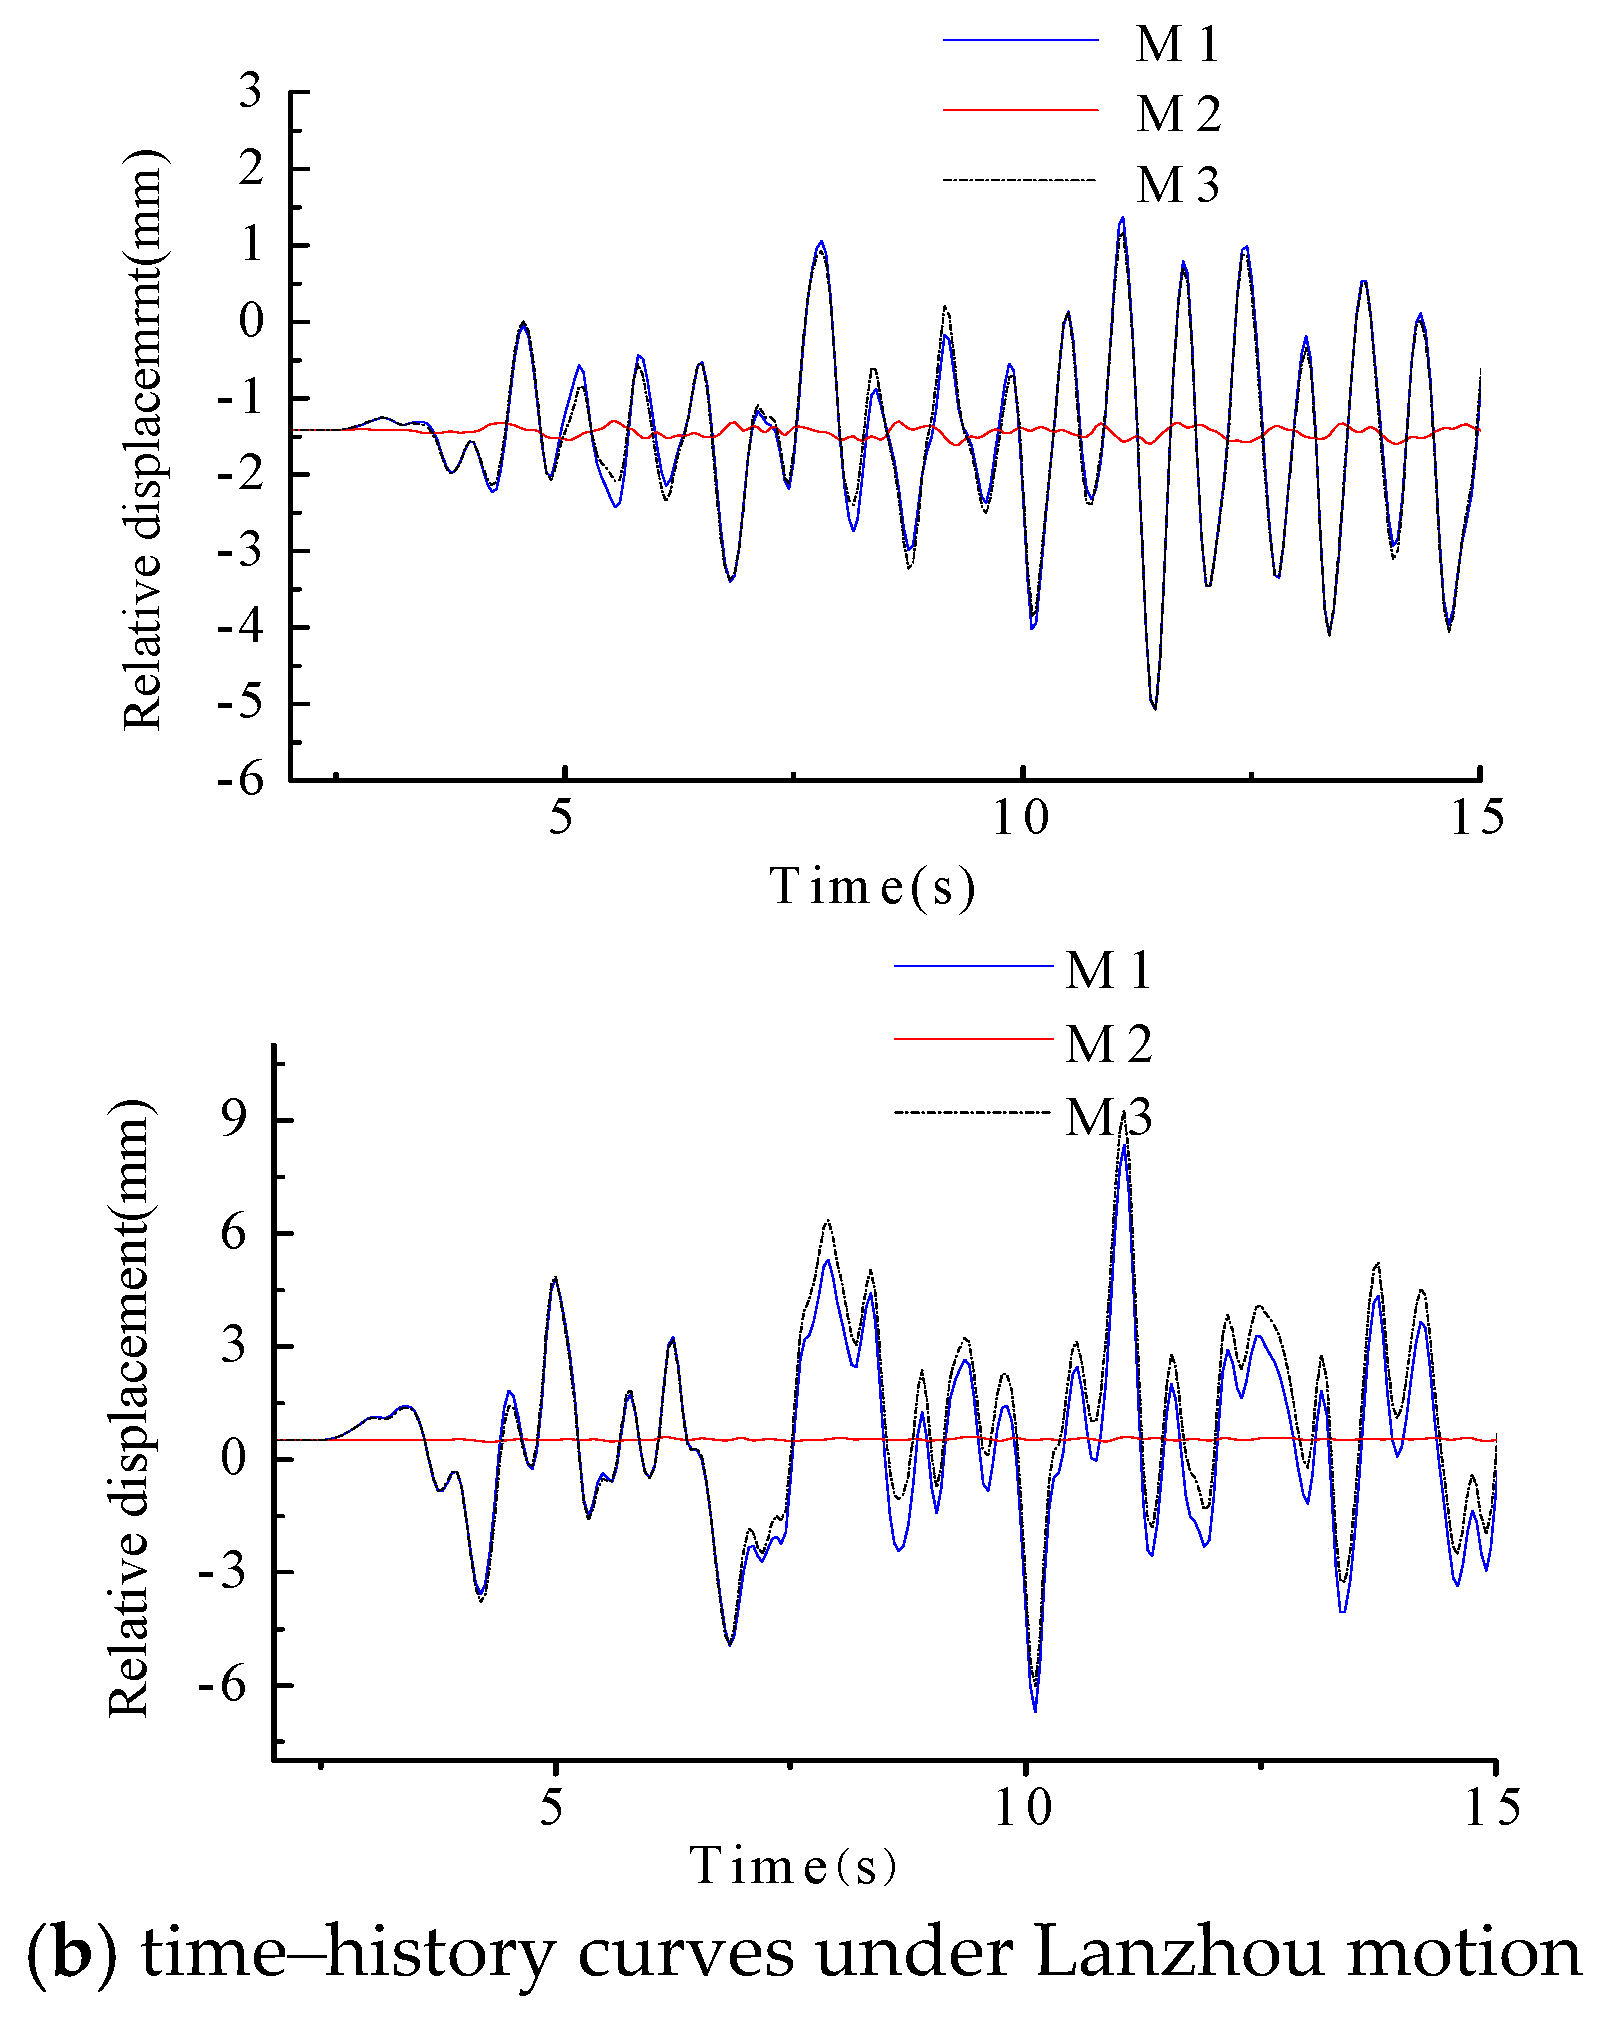
The relative displacement time–history curves of the top floor under El-Centro motion and Lanzhou motion are shown in Figure 16, in which the relative displacement is defined as horizontal displacement values, and layer drifts in M1 and M3 under 0.20 g are shown in Table 4.
It can be seen from Figure 16 and Table 4 that layer drifts in the Y-direction are larger than those in the X-direction, which coincides with the feature that stiffness in X-direction is larger than that in the Y-direction. There is only a 2% difference in the value of the drifts between one-way input motions and multi-way input motions in the X-direction, which indicates that there is no obvious difference in torsion coupling in the X-direction. On the other hand, in the Y-direction, the horizontal drifts with multi-way input motions are about 1.4 times larger than those with one-way input earthquake motion. Therefore, the drifts of the corner column under multi-way input motions are larger than those under one-way input motions, which leads to severe damage of the corner columns. It is essential to improve the constraints of corner columns and increase the number of stirrups in these columns, which can strengthen the deformation ability of such components.
4.1.3. Internal Force Responses
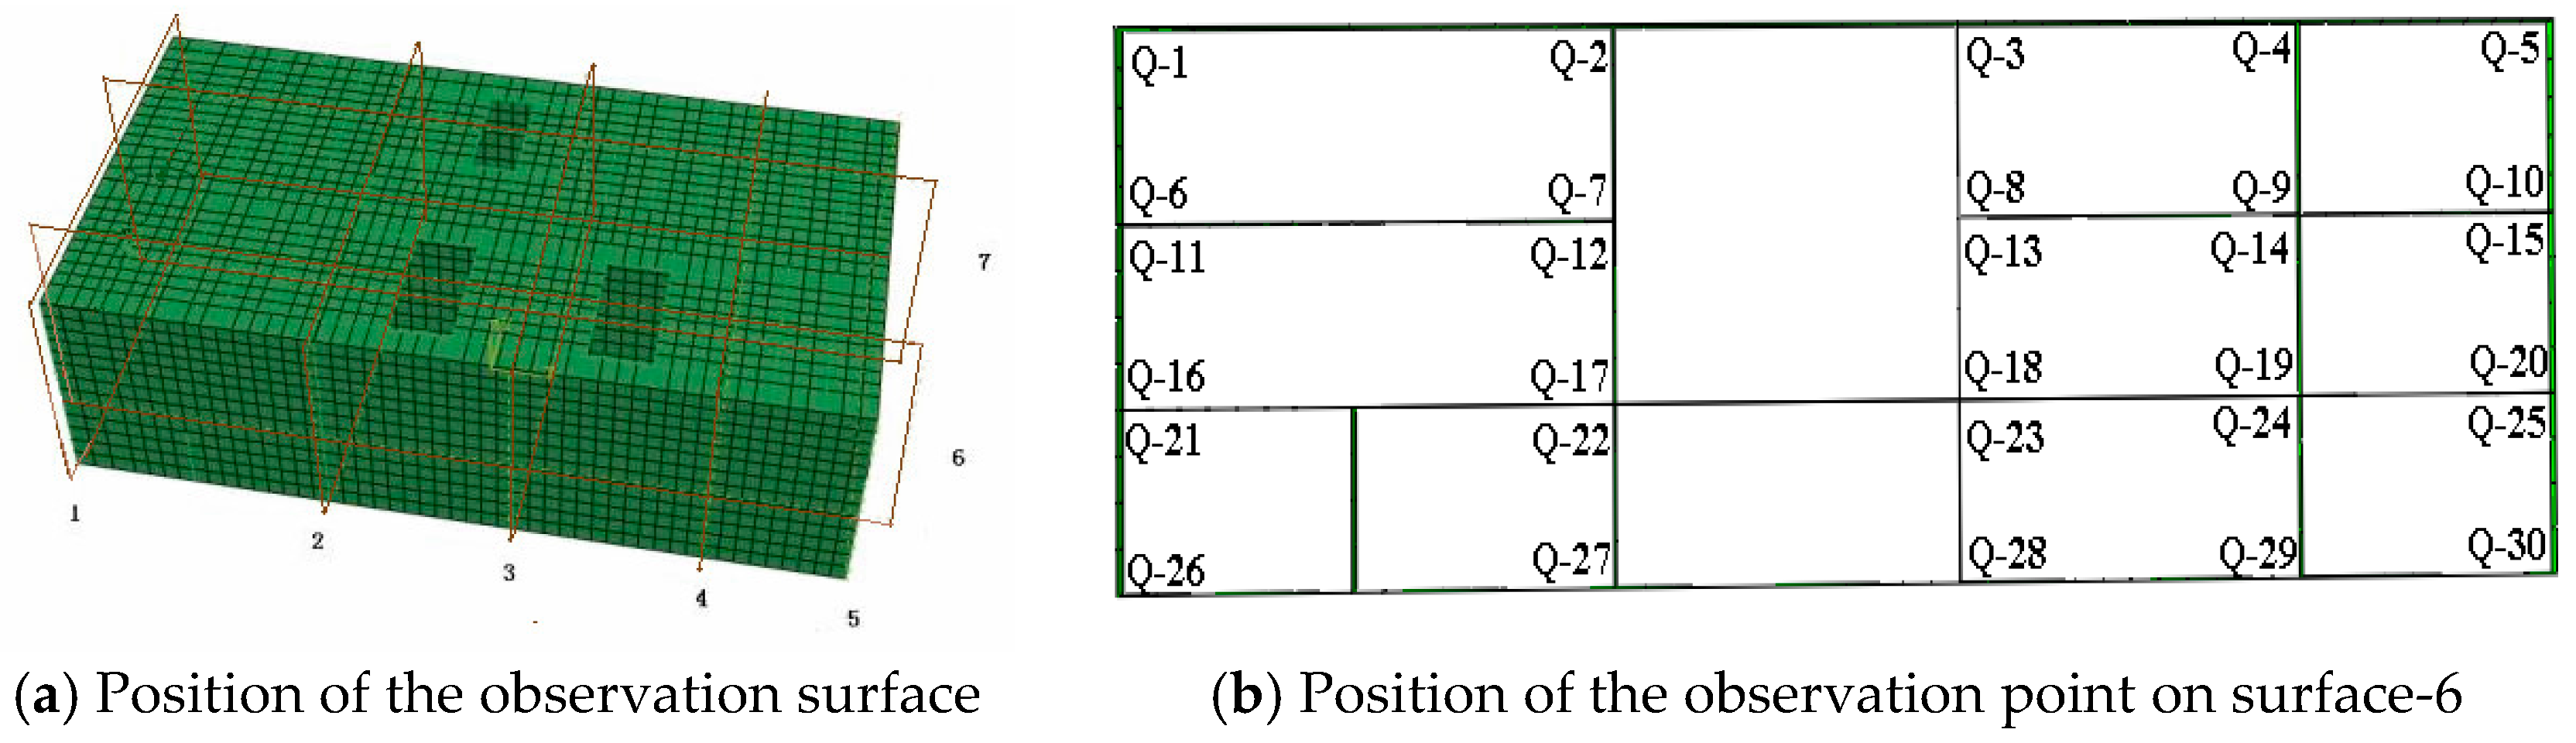
The shear wall is an important component under seismic action. As the first defense of energy dissipation under earthquake motions, coupling beams cannot bear the internal force value owing to the limited sectional dimension. Thus, the main internal force value is borne by the shear wall after internal force redistribution. There are six edges of concrete walls represented by Q-2, Q-7, Q-12, Q-17, Q-22 and Q-27 on surface-6, as shown in Figure 17. Furthermore, there is a similar seismic response among different sections. Therefore, the surface-6 section is selected to analyze the internal force response of the side walls. The peak internal forces in each section of surface-6 under 0.20 g are given in Table 5 and Figure 18.
- (1)
- Different input motions have different influences on the internal force of side walls. The shear forces of components are similar between horizontal direction motion and coupling input motion. Furthermore, the vertical pressure and bending moments of components under vertical seismic motion are similar to those in coupling input motion. Oblique incidence motion makes the vertical pressure and bending moments increase obviously.
- (2)
- In comparing the peak value of internal force in different sections, it can be seen that the shear force and vertical pressure of the bottom of the side wall on the third floor are, at most, about 1.03 × 10⁶ N/m and 3.67 × 10⁶ N/m respectively, values which are significantly greater than those on the other floors. So, the bottom of the side walls is the seismic weak part of the structure.
- (3)
- The bending moments at joint parts of the side wall on the second floor are larger than the rest of the structure, because the extra inertia force caused by the electrical equipment leads to the second floor being in a complex bend torsion condition. The bending moments of the second floor under coupling seismic action increase by 20% compared to those under horizontal seismic action. So, it can be speculated that the vertical pressure and bending moments increase in vertical seismic motion.
4.2. Soil Properties in the Seismic Response of the Underground Substation
In order to analyze the seismic response of soil and the underground substation, M1 (1 time soil elasticity modulus model), M2 (2 times soil elasticity modulus model) and M3 (3 times soil elasticity modulus model) were set up separately, the seismic response results of which are shown in Table 6.
4.2.1. Displacement Responses
The relative displacements under 0.20 g are shown in Figure 19. The layer drifts and layer drift angles under 0.20 g are shown in Table 7.
(1) From Figure 19, it can be inferred that the displacements of the side wall decrease with the increasing of the elastic modulus of soil and the horizontal drift diminishes mostly at the top of the side wall, and the horizontal relative displacement in the Y-direction decreases by about 73.9% in Lanzhou motion. The reason is that, with the increasing of the soil elastic modulus, the structure constraint increases and structural deformation decreases, which usually lead to the diminishing of horizontal drift.
(2) From Table 7, the drift angle is inversely proportional to the elastic modulus of surrounding soil. With the increase in the soil elastic modulus, the drift angle of each layer significantly reduces; the minimum value decreases sharply from 1/1611 to 1/7059. Therefore, the soil elastic modulus has a very important influence on the deformation of the underground substation.
4.2.2. Stress Responses
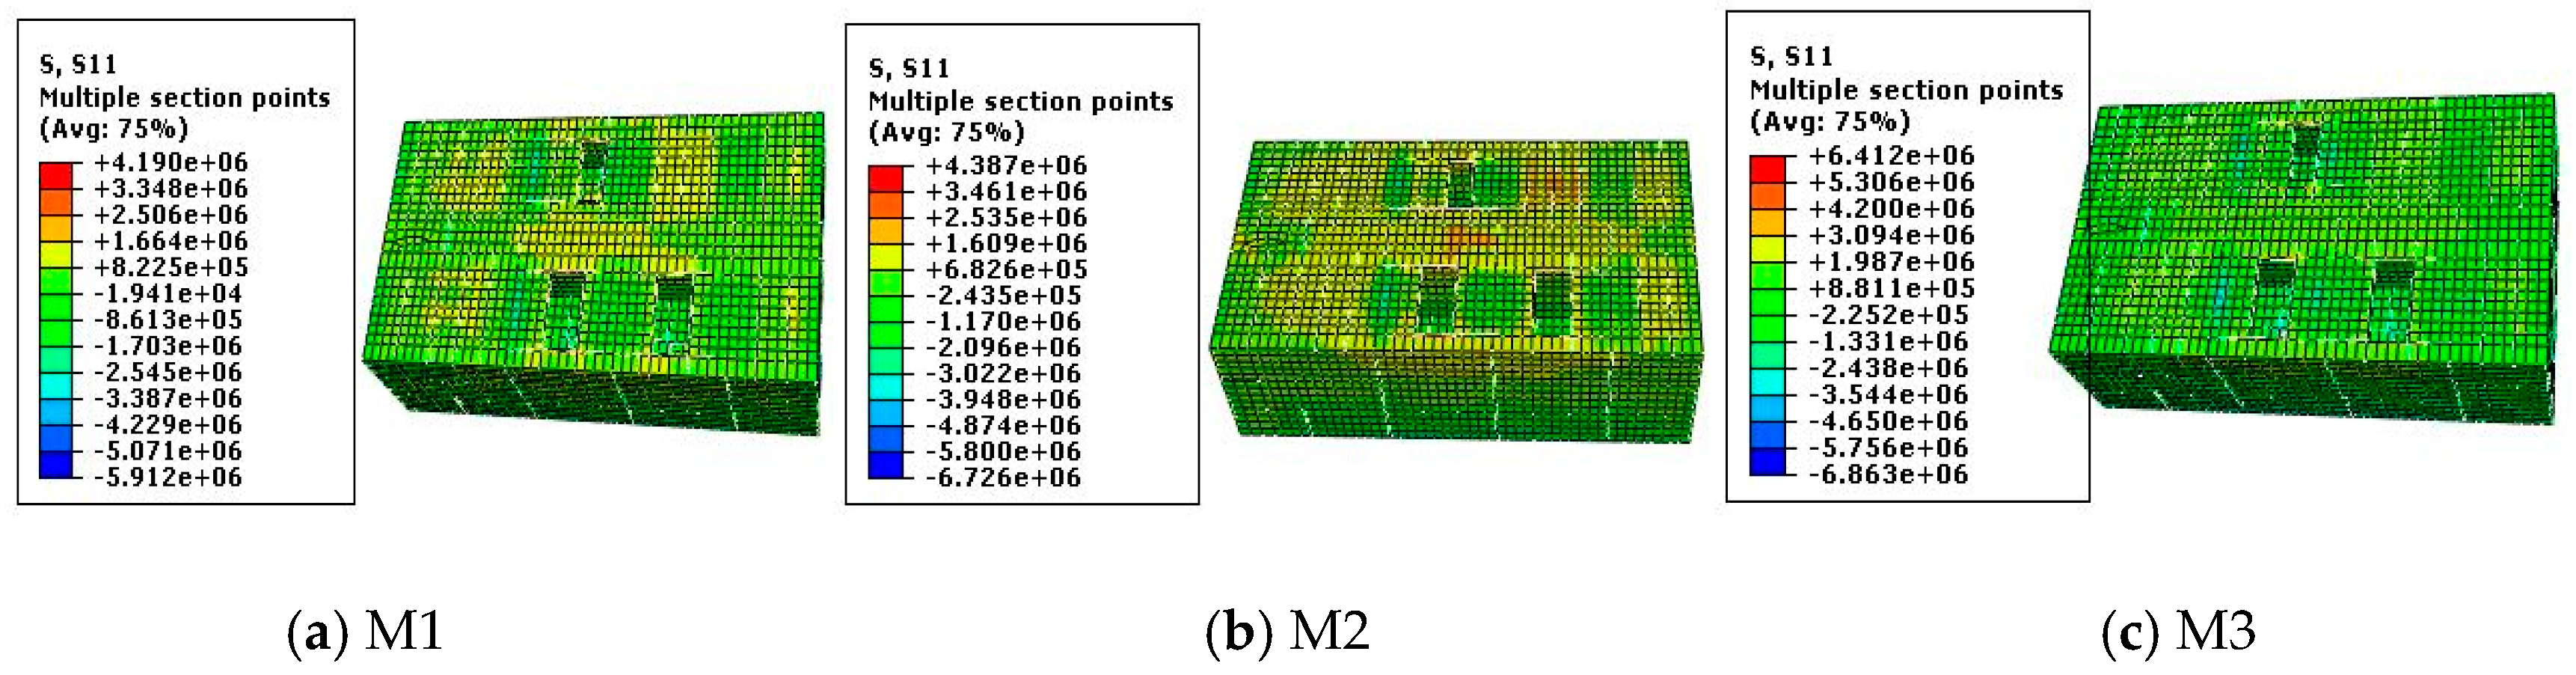
The stress responses of the underground substation are similar under El-Centro, Taft and Lanzhou earthquakes; therefore, the stress response of the structure under Lanzhou earthquake is taken as an example. The stress nephograms of the underground substation under 0.20 g are shown in Figure 20. The peak stresses and stress amplitude in different locations under 0.20 g are shown in Table 8.
With the increase in the elastic modulus of soil, stress amplitudes of layers and side walls do not simply decrease with the decrease of layer drift, but firstly decrease and then increase. The second-floor stress amplitude maximum value is 46.23% when the soil elastic modulus increases from two- to three-fold. The reason is that with the increase in the elastic modulus of soil, the deformation of soil reduces and the corresponding displacement of the structure reduces as well, which leads to a decrease in structure stress to some extent. However, some adverse factors, such as non-uniform stiffness, big holes in floors, large weight and the volume of electrical equipment, can lead to a nonlinear response in the internal forces.
4.2.3. Internal Force Responses
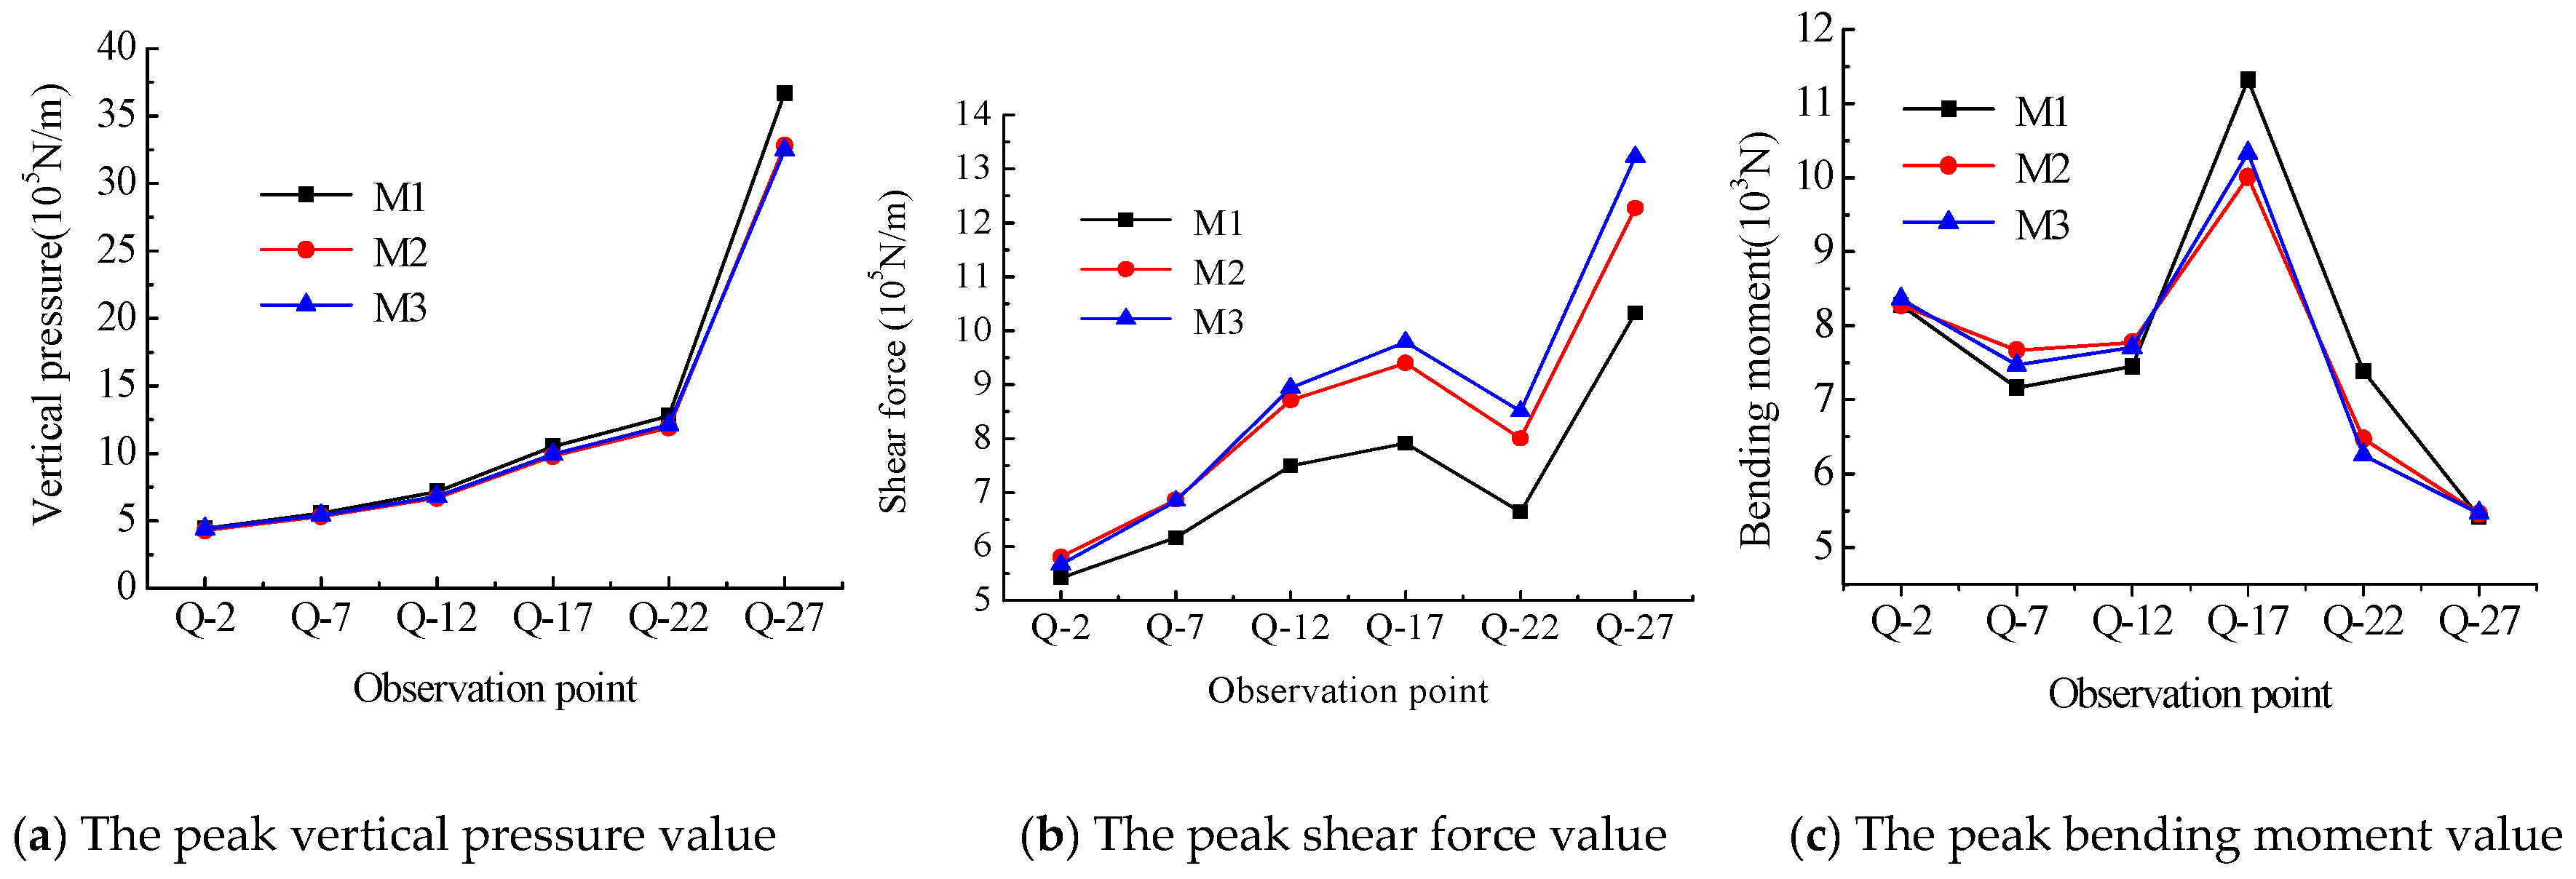
The peak internal forces of each section on surface-6 under different seismic motions are shown in Table 9 and the peak internal forces of different points on surface-6 are shown in Figure 21.
From Table 9 and Figure 21, it can be inferred that the shear forces of the underground substation gradually increase with the increase in the elastic modulus of the surrounding soil, while vertical pressure and bending moments change little under the same condition. The reason is that soil shear deformation reduced with the increase in the soil elastic modulus, and the corresponding displacements of the structure decreased as well.
The change of the soil’s physical properties has a great effect on the seismic response of the underground substation. Therefore, the interaction between the underground substation and soil should be taken into account in the seismic design.
4.3. Seismic Response Influence of Structure–Electrical Equipment Interaction
Due to its heavy weight and huge size, electrical equipment fixed on the floors of the substation usually produced additional inertial force, which had an additional effect on the structure under seismic load and bending torsional load.
In previous seismic designs of underground substations, the interaction between structure and equipment was usually ignored. When the size and weight of electrical equipment is low, such a method is acceptable. Nowadays, the size and weight of electrical equipment is larger than before, and such an equivalent load method would result in some error. For this reason, Model 1 (M1) of the underground substation with the interaction between electrical equipment and structure and Model 2 (M2) without the interaction between them were established. According to a comparison and analysis of the internal force and seismic response in these two models, the seismic performance effect of electrical equipment on the underground substation can be determined.
4.3.1. Acceleration Responses
The acceleration amplification factors under 0.40 g, with the interaction between electrical equipment and structure, are shown in Table 10, in which the acceleration amplification factor is defined as the ratio between the peak acceleration of both the layer and input seismic motion. Similarly, the soil acceleration amplification factor is defined as the value at the same level of the structure.
(1) Under the same direction and earthquake motion, acceleration amplification factors of soil and structure gradually increase; acceleration amplification factors in the horizontal X-direction are greater than those in the horizontal Y-direction. Meanwhile, the peak acceleration amplification factors of structure and soil are 1.070 and 1.772 (in the horizontal X-direction under Taft motion) respectively, which means that seismic responses are more severe in these cases than in other cases.
(2) Under different earthquake motions, acceleration amplification factors at the top of electrical equipment are different from each other. The peak acceleration amplification factor on the second floor under Taft motion is 3.52 (in the horizontal or the X-direction) which is much greater than 2.0 given in Code for the seismic design of electrical installations (2013, China). The acceleration amplification factors of electrical equipment in the X-direction are obviously greater than those on the same floor, which suggests that the acceleration response of the structure and electrical equipment is not synchronous. Therefore, the interaction between structure and equipment should be taken into account in the seismic design of an underground substation.
4.3.2. Displacement Responses
Time–history curves of displacement on the top floor in M1 and M2 under El-Centro motion and Lanzhou motion are shown in Figure 22. Layer drift and layer drift angle of each layer under 0.40 g are shown in Table 11.
From Figure 22 and Table 11, it can be seen that layer drift and layer drift angles of M1 are larger than those of M2 under 0.40 g. The reason is mainly that electrical equipment produces additional inertial force and extra relative displacement, which leads to structure displacement increasing at the same time. Therefore, the interaction of structure–equipment should be involved in seismic design. Only when the effect of electrical equipment is taken into account is the seismic design of an underground substation safe.
4.3.3. Internal Force Responses
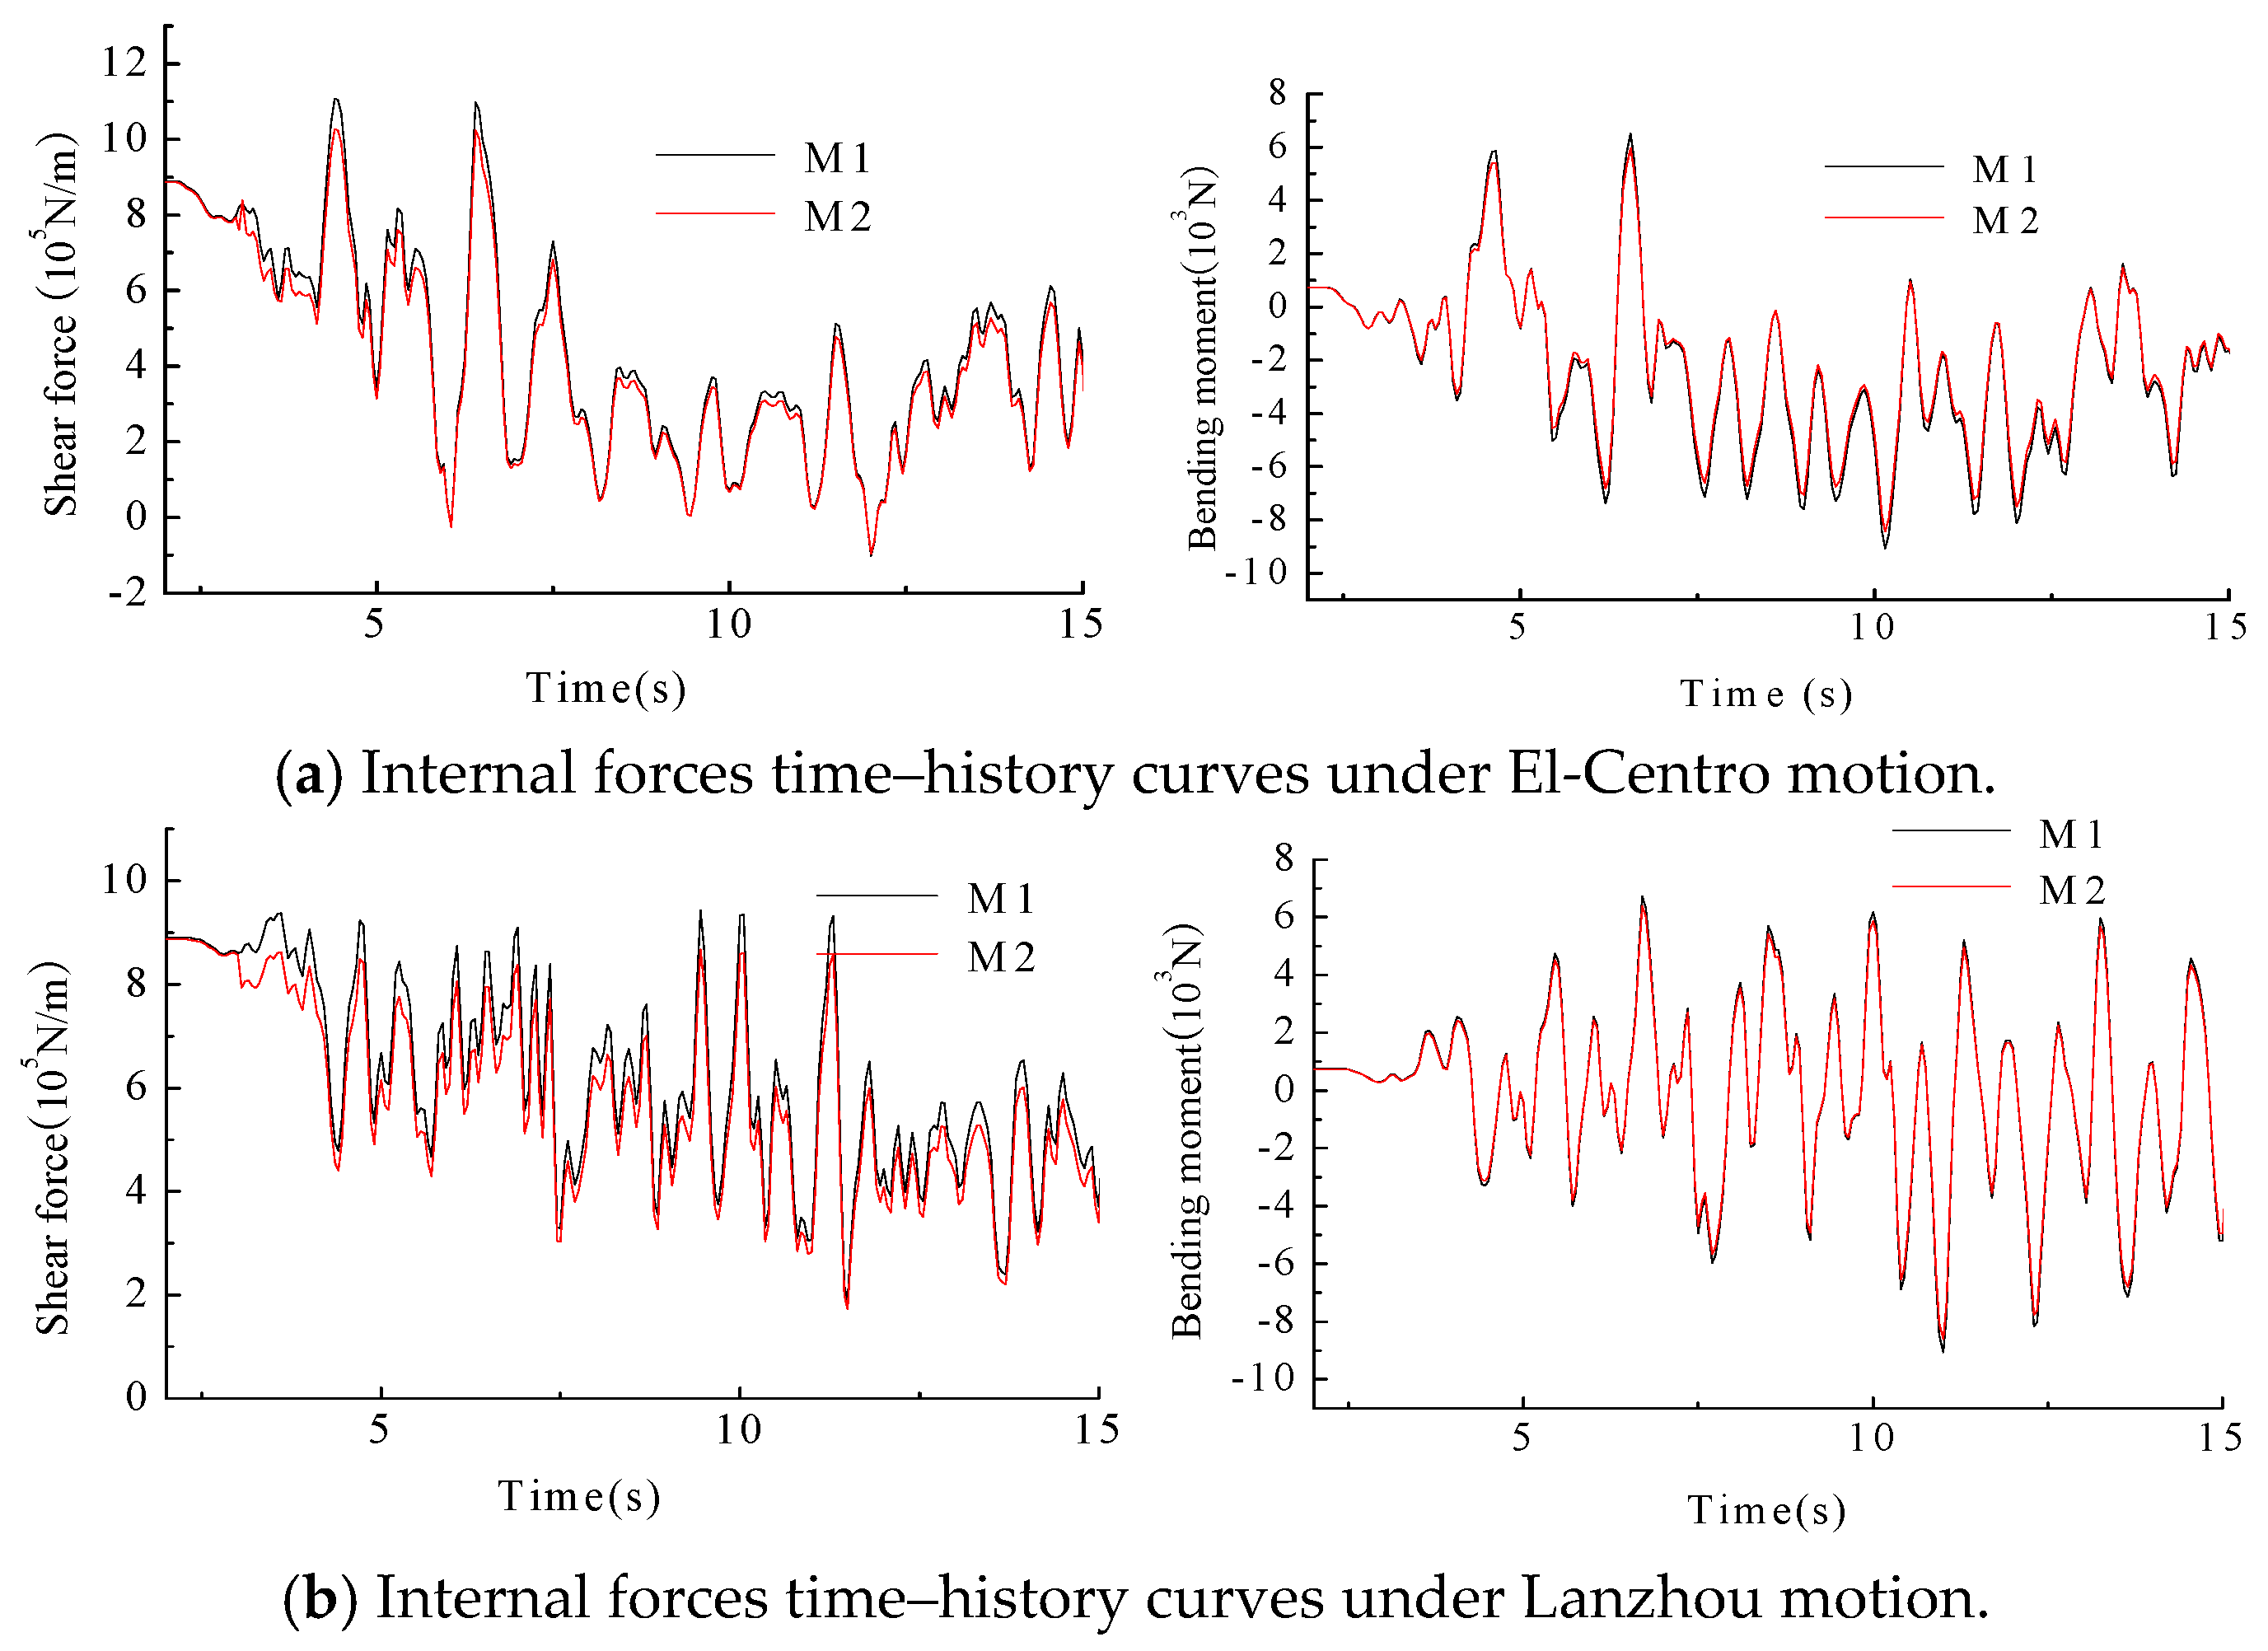
Shear force and bending moment time–history curves in the X-direction at the bottom of side wall 4 under 0.40 g are shown in Figure 23. The peak internal forces of the side wall under 0.40 g are shown in Table 12.
From Figure 23 and Table 12, it is shown that the difference of internal force is obvious in M1 and M2, in which the peak shear amplification is 18.99% from M2 to M1 and the peak bending moment difference increased by 19.93%. Such data reaffirm that the interaction between electrical equipment and structure could not be ignored.
4.4. Influence of Burial Depth
Burial depth is one of the important factors in the seismic response of the underground structure. The same underground structures may have different seismic responses in different burial depths. To study the influence of different burial depths on the seismic response of an underground substation in the horizontal direction, five conditions including different burial depth at 1.2 m (M1), 3 m (M2), 5 m (M3), 7 m (M4) and 9 m (M5) were chosen for the samples.
4.4.1. Displacement Responses
Layer drifts and drift angles under 0.20 g are shown in Table 13 under El-Centro motion.
(1) With the increase in buried depth, the relative horizontal displacements in the X-direction first increase and then decrease, and then reach the maximum values when the buried depth is 7.0 m. Simultaneously, the relative horizontal displacements in the Y-direction first decrease and then increase and reach the maximum values when the buried depth is 1.2 m. The layer drift of each floor has the same trend and the maximum layer drift angle value in the X-direction reaches 1/809 (the third underground floor when the buried depth is 7.0 m), which is close to the limit value of 1/800 stated in Code for seismic design of buildings (2010, China).
(2) It is usually believed that the deeper the structures are buried, the safer they are under earthquake motions. However, the rule is unsuitable for some special industrial structures such as an underground substation. The reasons are that equipment of high quality and stiffness with complex shapes makes displacements of structure complicated, and overlaying soil reduces the overall displacement of the structure with the increase in buried depth. The layer drift is critical in the Y-direction when the buried depth is shallow, while it is critical in the X-direction with the increase in buried depth. In order to prevent the danger caused by excessive displacement, buried depths which can cause a large seismic response should be avoided in underground substation seismic design.
4.4.2. Internal Force Responses
It has been previously demonstrated that the side wall is the weak area in the structure; therefore, shear force of side wall 3 is chosen to be analyzed and the results are shown in Table 14, in which the static values are defined as static computational results under the effect of gravity, and dynamic values are defined as dynamical computational results under earthquake motions.
Comparing shear force amplifications at the top and bottom of side walls in different buried depths, it can be concluded that dynamic load has a greater influence on the top of side walls when the buried depth is 1.2 m when the shear force amplifications of the top of the side wall are larger than those of bottom. With the increase of buried depths, dynamic loads have a greater effect on the base of side walls, and the shear force amplifications on the top of the side wall are less than those of the bottom, which causes shear forces within the bottom of the wall to reach the maximum values under static and dynamic loads. Thus, the bottom of the side wall is the weak part of the underground substation. Therefore, it should be given more attention during the seismic design of such a system.
5. Conclusions
Three-dimension finite element models involving the interaction of soil–structure–equipment are established, and dynamic numerical simulation analysis of such models is performed. By changing some parameters such as ground motion input motions, properties of surrounding soils, burial depth, etc., the seismic performance of underground substations is proposed, and simulated results, such as acceleration amplification coefficient, displacement, stress and internal forces, are obtained from research. The findings are summarized as follows:
- (1)
- The coupling boundary is selected as the boundary condition of soil–structure, which is feasible in a seismic response of an underground substation.
- (2)
- The seismic response of an underground substation is more sensitive to vertical earthquake motion than the seismic response of normal structures. Therefore, vertical earthquake motions should be taken into account in the seismic design of such underground structures.
- (3)
- Burial depth and elastic modulus are the main factors for the seismic performance of the underground electrical substation. With the increase in burial depth, layer drifts of an underground substation first increase and then decrease. With the increase in the elastic modulus of soil, the constraint of soil on structure increases and the deformation of structure decreases.
- (4)
- The acceleration amplification factors of electrical equipment are obviously greater than those of the same layer of the structure, and the peak drift of equipment is not synchronous with structure. Therefore, the interaction between structure and equipment should be taken into account in the seismic design of underground substations and some seismic measures should be proposed to control the dynamic response of electrical equipment.
- (5)
- The bottom of the side walls is the weak part of an underground substation. Therefore, it is necessary to increase the stiffness of side walls and strengthen the connection between the bottom floor and side walls.
Acknowledgments
The authors wish to express their gratitude towards the Major Program of the National Natural Science Foundation (No. 51590914) (in China), the National Natural Science Foundation Project (No. 51578450, No. 51378225) (in China).
Author Contributions
Bo Wen and Lu Zhang conceived and designed the models; Lu Zhang analyzed the data; Ditao Niu contributed analysis tools; Bo Wen wrote the paper; and Muhua Zhang searched some references.
Conflicts of Interest
The authors declare no conflict of interest. And the founding sponsors had no role in the design of the study; in the collection, analyses, or interpretation of data; in the writing of the manuscript, and in the decision to publish the results.
References
- Suarez, L.E.; Singh, M.P. Floor Spectra with Equipment Structure Equipment Interaction Effects. J. Eng. Mech. 1989, 115, 247–264. [Google Scholar] [CrossRef]
- Pires, J.A.; Ang, A.H.-S.; Villaverde, R. Seismic reliability of electrical power transmission systems. Nucl. Eng. Des. 1996, 160, 427–439. [Google Scholar] [CrossRef]
- Brzan-Zurita, E.; Bielak, J.; Digioia, A.M. Seismic Design of Substation Structures. In Proceedings of the Electrical Transmission and Substation Structures Conference ASCE, Fort Worth, TX, USA, 8–12 November 2009; pp. 1–12. [Google Scholar]
- Kempner, L.; Reston, V.A., Jr. (Eds.) Substation Design Guide; ASCE: Oakland, CA, USA, 2008. [Google Scholar]
- Knight, B.T.; Kempner, L. Vulnerabilities and Retrofit of High-Voltage Electrical Substation Facilities. In Proceedings of the Technical Council on Lifeline Earthquake Engineering Conference, Oakland, CA, USA, 28 June–1 July 2009; pp. 232–243. [Google Scholar]
- International Atomic Energy Agency (IAEA). Seismic Evaluation of Existing Nuclear Installations; IAEA: Vienna, Austria, 2008. [Google Scholar]
- Wen, B.; Niu, D.T. Seismic vulnerability analysis for the main building of the large substation. China Civ. Eng. J. 2013, 46, 19–23. (In Chinese) [Google Scholar]
- Wen, B.; Taciroglu, E.; Niu, D.T. Shake table testing and numerical analysis of transformer substations including main plant and electrical equipment interaction. Adv. Struct. Eng. 2015, 18, 1959–1980. [Google Scholar] [CrossRef]
- Yuan, H.F.; Walker, R.E. The Investigation of a Simple Soil-Structure Interaction Model. In Dynamic Waves in Civil Engineering; Howells, D.A., Haigh, I.P., Taylor, C., Eds.; Wiley: New York, NY, UAS, 1970; pp. 247–266. [Google Scholar]
- Rodriguez, B. Numerical Analysis of an Experimental Tunnel. Proceeding of the 11th International Conference on Soil Mechanics and Foundation Engineering San Francisco, San Francisco, CA, USA, 12–16 August 1985; pp. 789–792. [Google Scholar]
- Penzien, J. Seismically Induced Racking of Tunnel Linings. Earthq. Eng. Struct. Dyn. 2000, 29, 683–691. [Google Scholar] [CrossRef]
- Huo, H. Seismic Design and Analysis of Rectangular Underground Structures. Tunneling and Underground Space Tecnology United Kingdom. Ph.D. Thesis, Purdue University, West Lafayette, IN, USA, 2000. [Google Scholar]
- Gong, B.N.; Zhao, D.P. Experimental Study on Dynamic Interaction of Underground Structure and Soil. Undergr. Space 2002, 22, 320–324. (In Chinese) [Google Scholar]
- Zhuang, H.Y. Study on Dynamic Contact Properties of Soil-Subway Underground Structure Interaction System; Nanjing University of Technology: Nanjing, China, 2006. (In Chinese) [Google Scholar]
- Chen, G.X.; Zhuang, H.Y.; Du, X.L. Analysis of large-scale shaking table test of dynamic soil-subway station interaction. Earthq. Eng. Eng. Vib. 2007, 27, 171–176. (In Chinese) [Google Scholar]
- Li, L.Y.; Du, X.L.; Li, L. Review on Mechanical Performanical of Soil-Structure Contact. Adv. Mech. 2009, 39, 588–597. (In Chinese) [Google Scholar]
- Tao, L.J.; Wang, W.P.; Zhang, B. Difference law study of seismic design methods for subway structures. China Civ. Eng. J. 2012, 45, 170–176. (In Chinese) [Google Scholar]
- Geng, P.; He, C.; Tang, J.; Yan, Q.; Xu, Y. Appropriate Seismic Analysis Method of Subway Shield Tunnels in Soft Ground. Int. Efforts Lifeline Earthq. Eng. 2013, 283–290. [Google Scholar] [CrossRef]
- Debiasi, E.; Gajo, A.; Zonta, D. On the Seismic Response of Shallow-Buried Rectangular Structures. Tunn. Undergr. Space Technol. 2013, 38, 99–113. [Google Scholar] [CrossRef]
- Liu, J.B.; Wang, W.H.; Dasgupta, G. Pushover analysis of underground structures: Method and Application. Sci. China Technol. Sci. 2014, 57, 423–437. (In Chinese) [Google Scholar] [CrossRef]
- Kang, G.H.; Tobita, T.; Lai, S. Seismic simulation of liquefaction-induced uplift behavior of a hollow cylinder structure buried in shallow ground. Soil Dyn. Earthq. Eng. 2014, 64, 85–94. [Google Scholar] [CrossRef]
- Pitilakis, K.; Tsinidis, G.; Leanza, A.; Maugeri, M. Seismic behavior of circular tunnels accounting for above ground structures interaction effects. Soil Dyn. Earthq. Eng. 2014, 67, 1–15. [Google Scholar] [CrossRef]
- Clough, R.; Penzien, J. Dynamics of Structures; McGraw-Hill: New York, NY, USA, 1993. [Google Scholar]
- Zhang, F.; Cheng, C.S. A modified Newton method for radial distribution system power flow analysis. IEEE Trans. Power Syst. 2002, 12, 389–397. [Google Scholar] [CrossRef]
- 35kV–220kV Urban Underground Substation Design Rules; China Electric Power Press: Beijing, China, 2005. (In Chinese)
- Chinese Loading Code for Design of Building Structures; GB50009-2012; Architecture & Building Press: Beijing, China, 2012. (In Chinese)
- Chinese Code for Seismic Design of Buildings; GB50011-2010; Architecture & Building Press: Beijing, China, 2010. (In Chinese)
- Chinese Code for Seismic Design of Electrical Installations; GB50260-2013; Architecture & Building Press: Beijing, China, 2013. (In Chinese)
- Hibbitt, K.; Sorensen, I. ABAQUS User Subroutines Reference Manual; Elsevier Science Publishers: Philadelphia, PA, USA, 2006. [Google Scholar]
- Liu, J.L.; Luan, M.T.; Xu, C.S. Study on parametric characters of Drucker-prager criterion. Chin. J. Rock Mech. Eng. 2006, 25, 4009–4015. (In Chinese) [Google Scholar]
- Liu, J.B.; Gu, Y.; Du, Y.X. Consistent viscous-spring artificial boundaries and viscous-spring boundary elements. Chin. J. Geotech. Eng. 2006, 28, 1070–1075. (In Chinese) [Google Scholar]
- Huang, S.; Chen, W.Z.; Wu, G.J. Study of method of earthquake input in a seismic analysis for underground engineering. Chin. J. Rock Mech. Eng. 2010, 29, 1254–1262. [Google Scholar]
- Lou, M.L.; Chen, H.J. Research on the Effects of Lateral Boundary of Pile Seismic Response; Tongji University Press: Shanghai, China, 1999. (In Chinese) [Google Scholar]
- Lou, M.L.; Wang, W.J.; Zhu, T. Soil lateral boundary effect in shaking table model test of soil-structure system. Earthq. Eng. Eng. Vib. 2000, 20, 30–36. (In Chinese) [Google Scholar]
- Chen, G.X.; Chen, S.; Zuo, X. Shaking-table tests and numerical simulations on a subway structure in soft soil. Soil Dyn. Earthq. Eng. 2015, 76, 13–28. [Google Scholar]
- Novak, M.; Bereduge, Y.O. Vertical Vibration of Embedded Footings. J. Soil Mech. Found. Div ASCE 1972, 98, 1291–1310. [Google Scholar]
- Idriss, I.M.; Sun, J. User’s Manual for SHAKE91. Center Geotech. Model. 1992, 388, 279–360. [Google Scholar]
- Liang, X.W.; Qian, L.; Tan, L.N. The Concrete Damage Plastic Constitutive Relation Research Based on ABAQUS. In Proceedings of the 8th Session of the National Earthquake Engineering, Chongqing, China, 24–26 December 2010; Volume 32, pp. 646–648. (In Chinese). [Google Scholar]
- Meng, W.Y.; Wang, J.F.; Zhang, R. Comparison Analysis of Constitutive Models of Reinforced Concrete Structures Based on ABAQUS. J. North China Inst. Water Conserv. Hydroelectr. Power 2012, 33, 40–42. (In Chinese) [Google Scholar]
Figure 1.
Plan of the second floor.
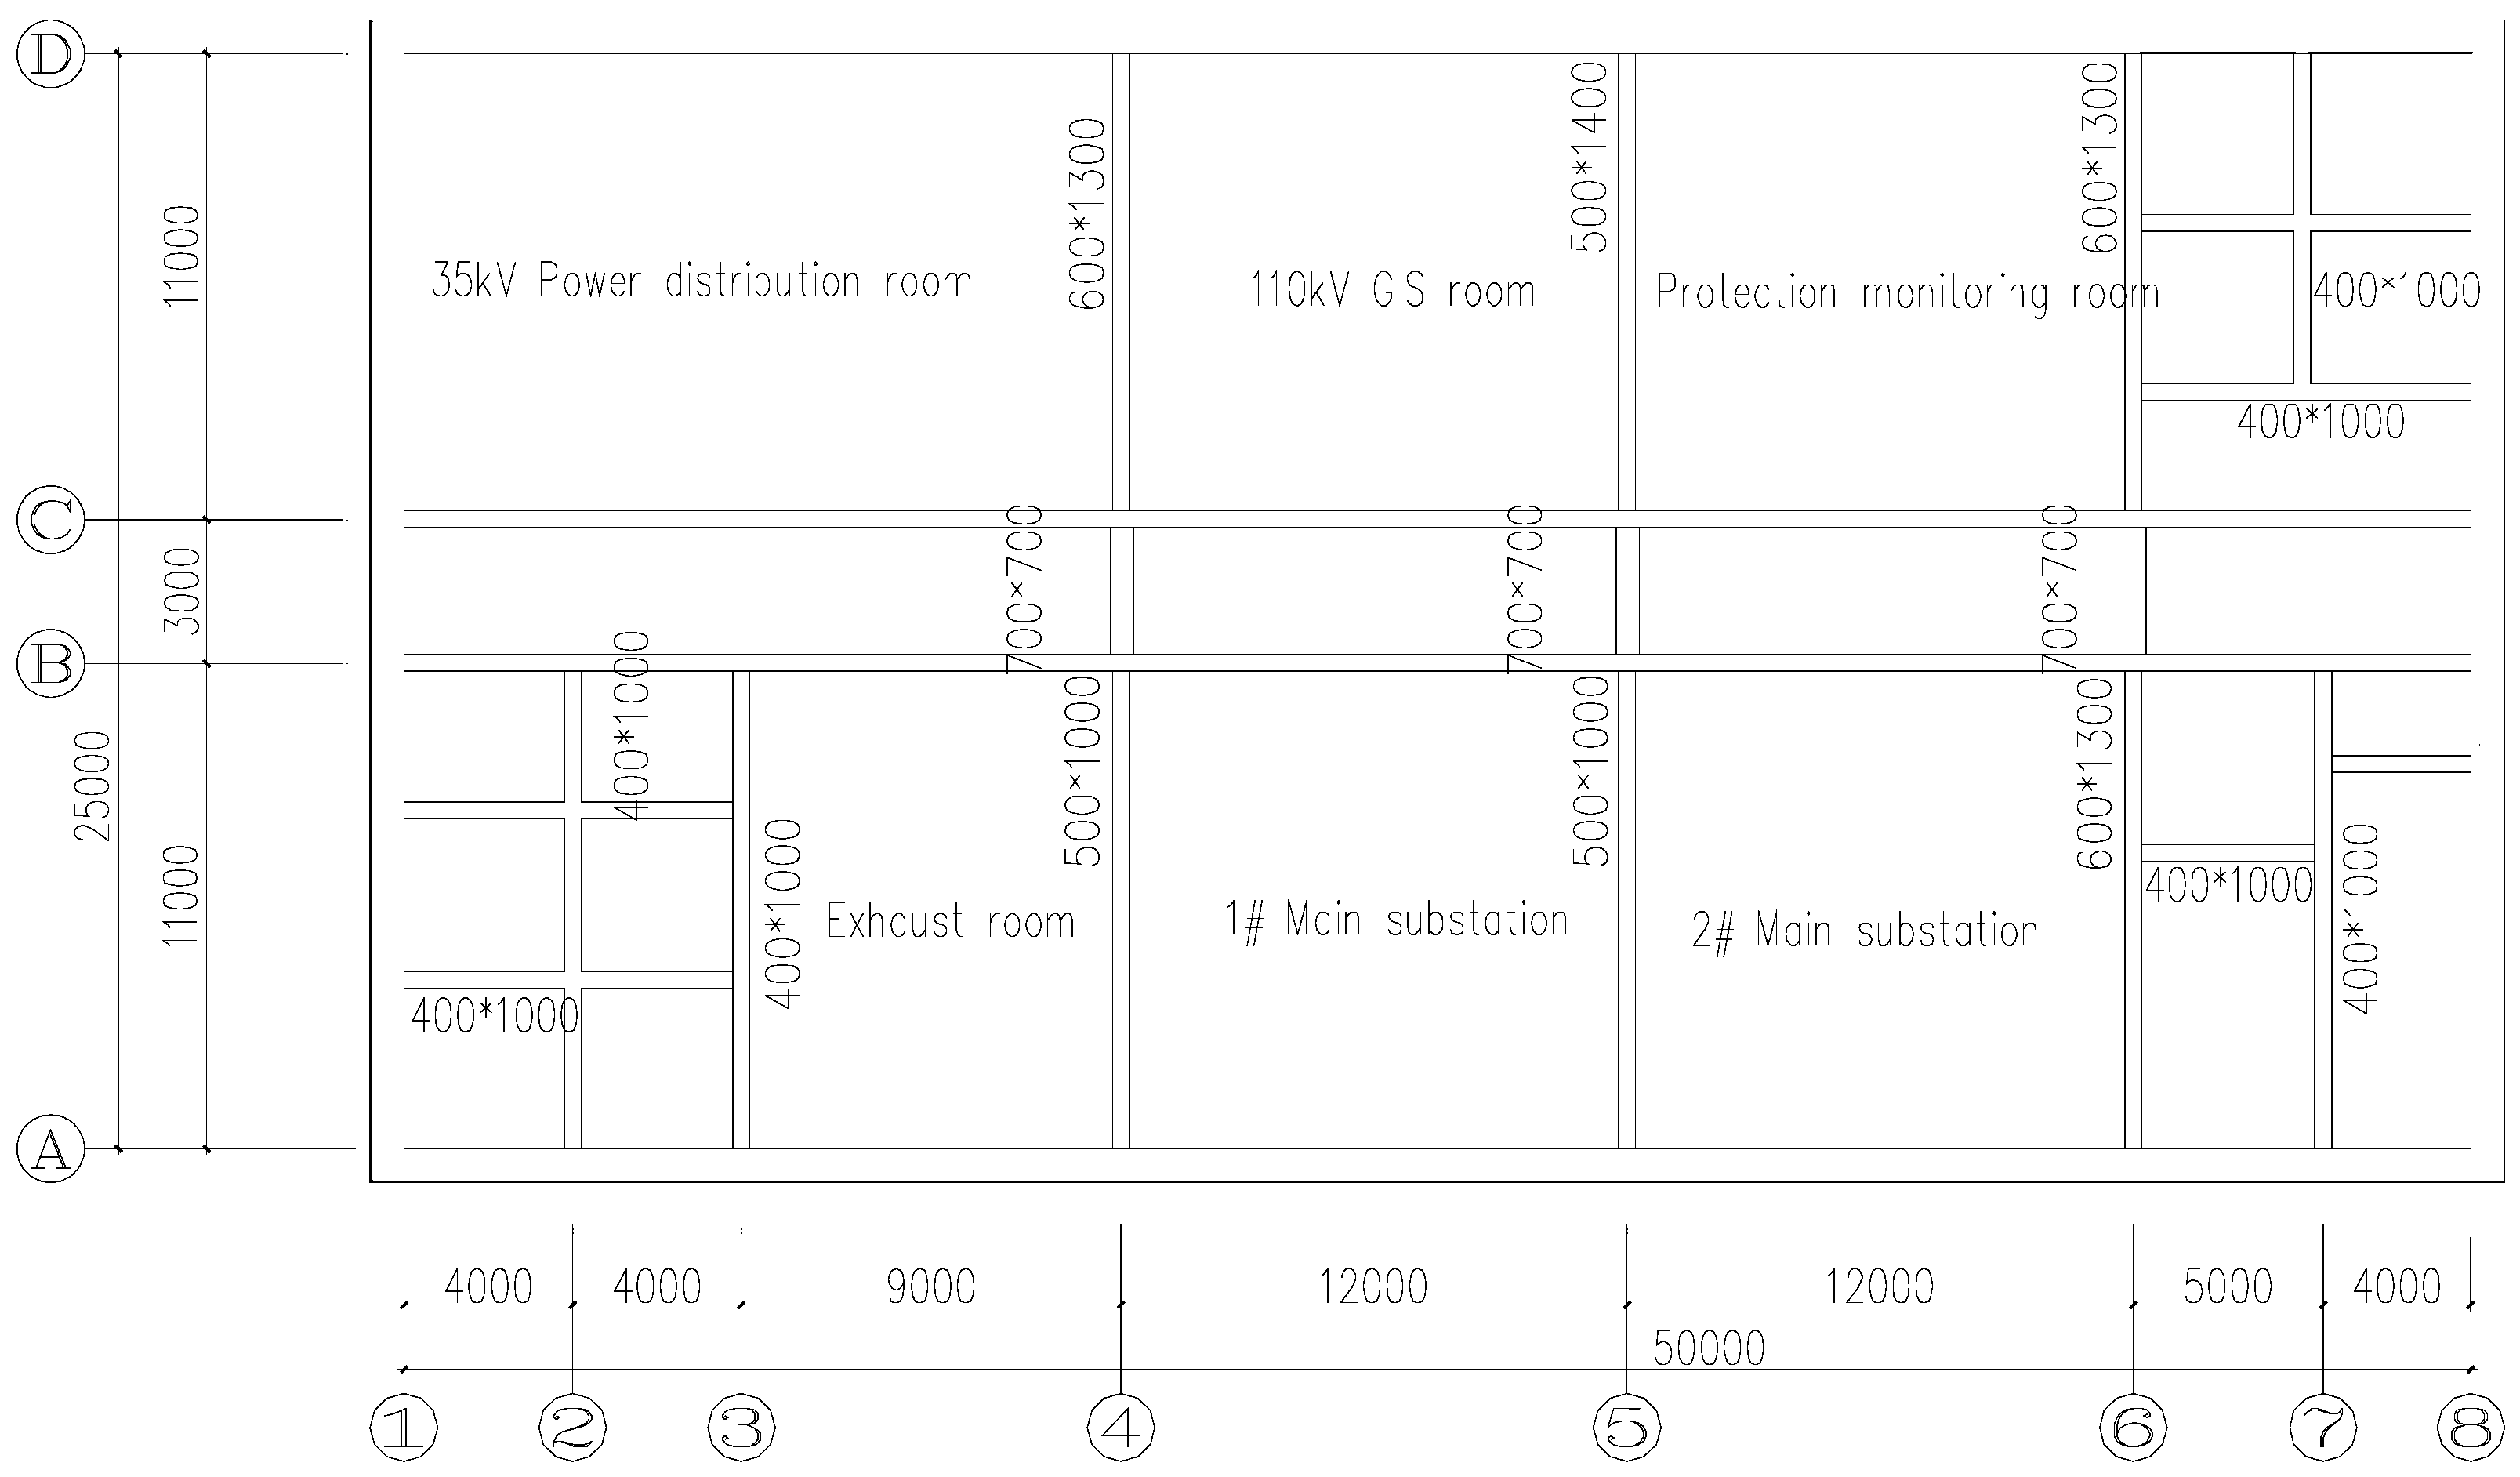
Figure 2.
Dimensions of the floor and wall.

Figure 3.
Long cross-section.

Figure 4.
Short cross-section.

Figure 5.
Electrical equipment.
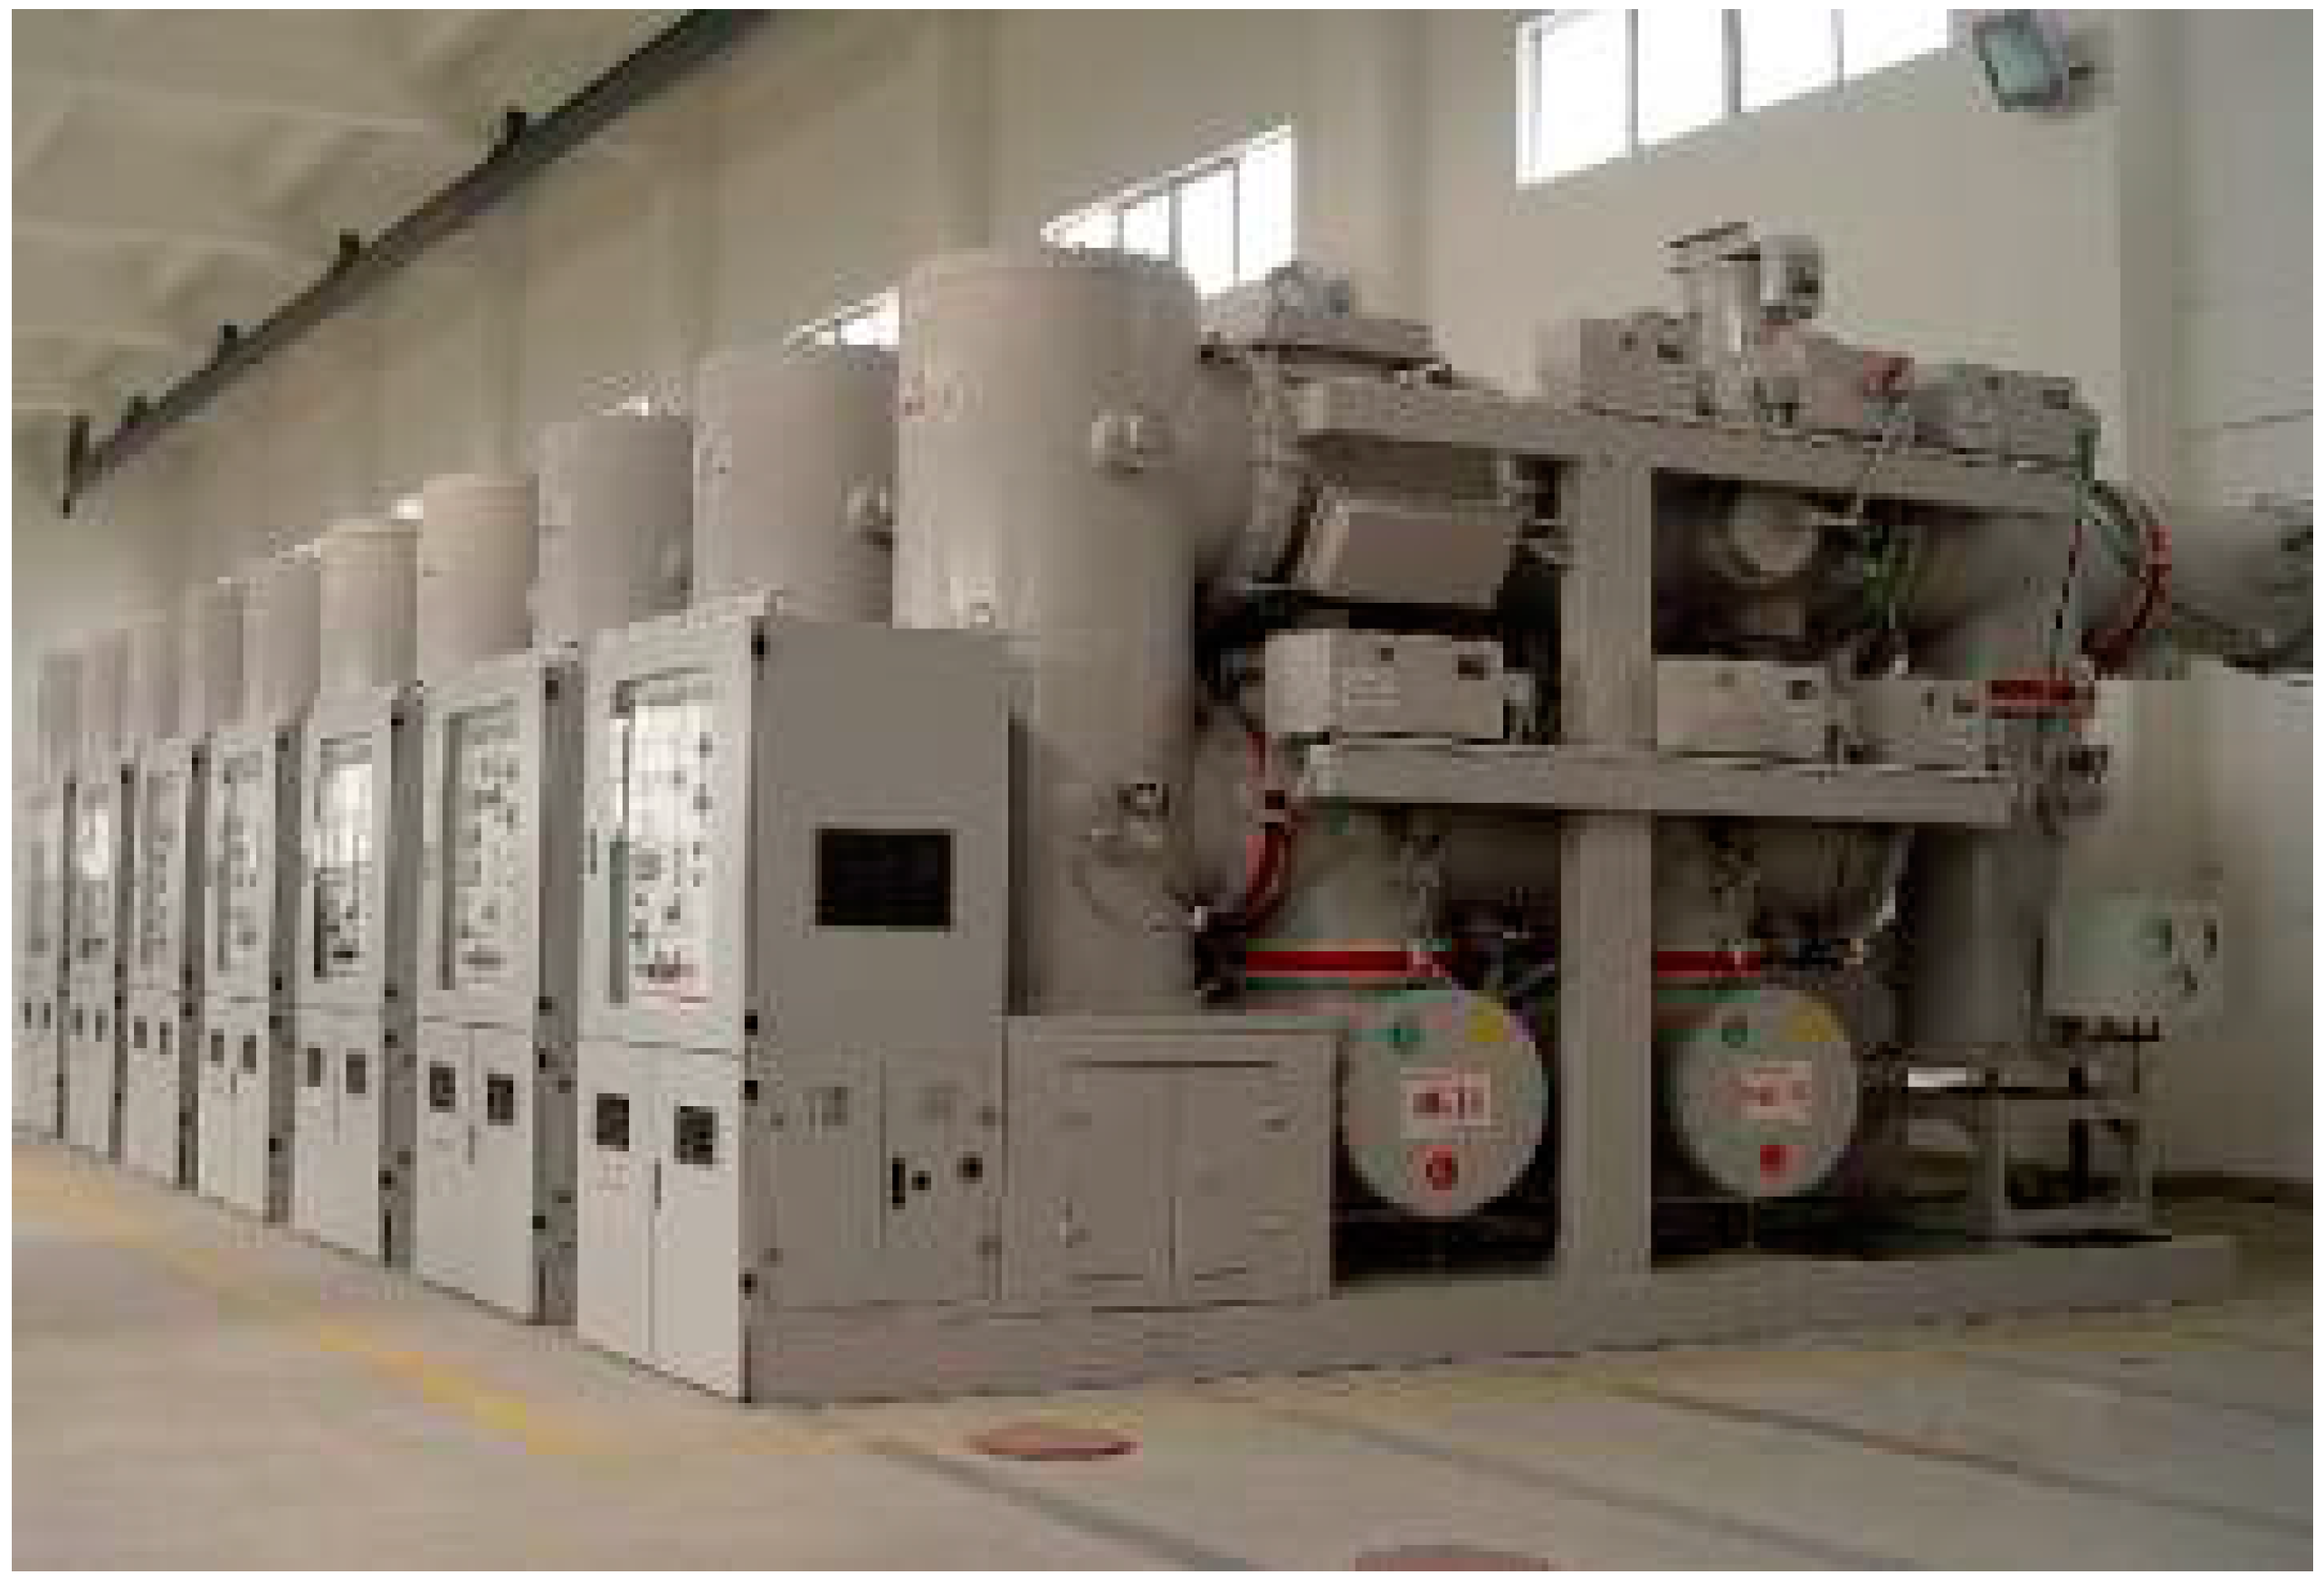
Figure 6.
Finite element model of a substation.
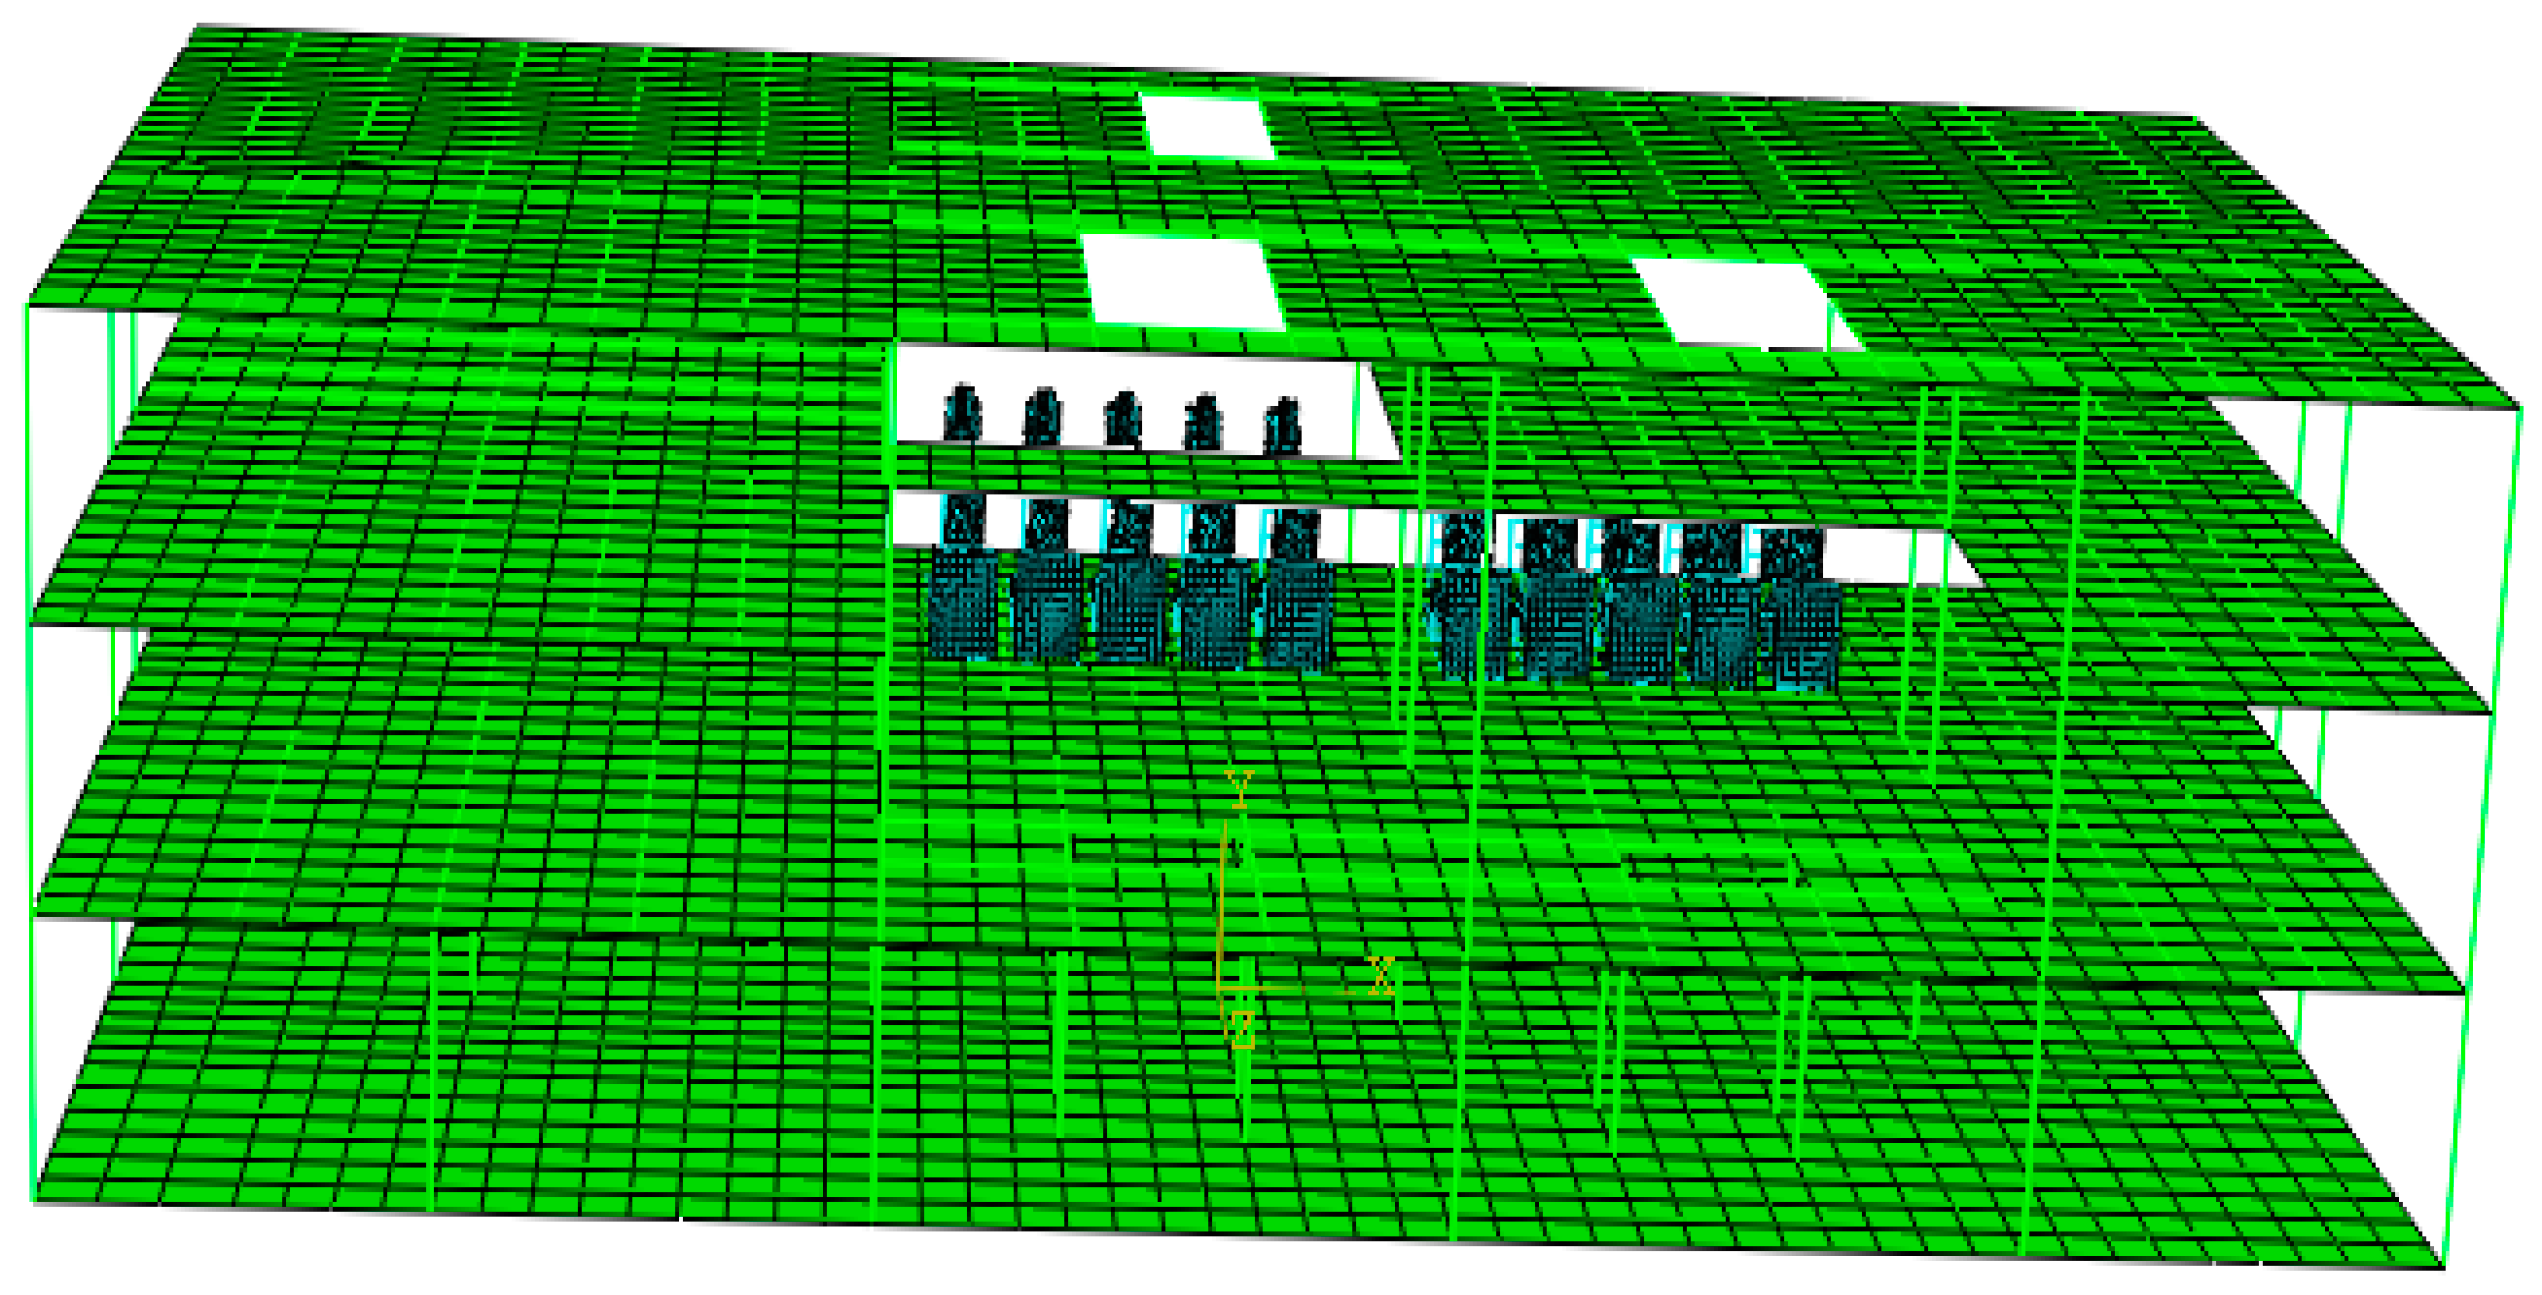
Figure 7.
Finite element model of equipment.
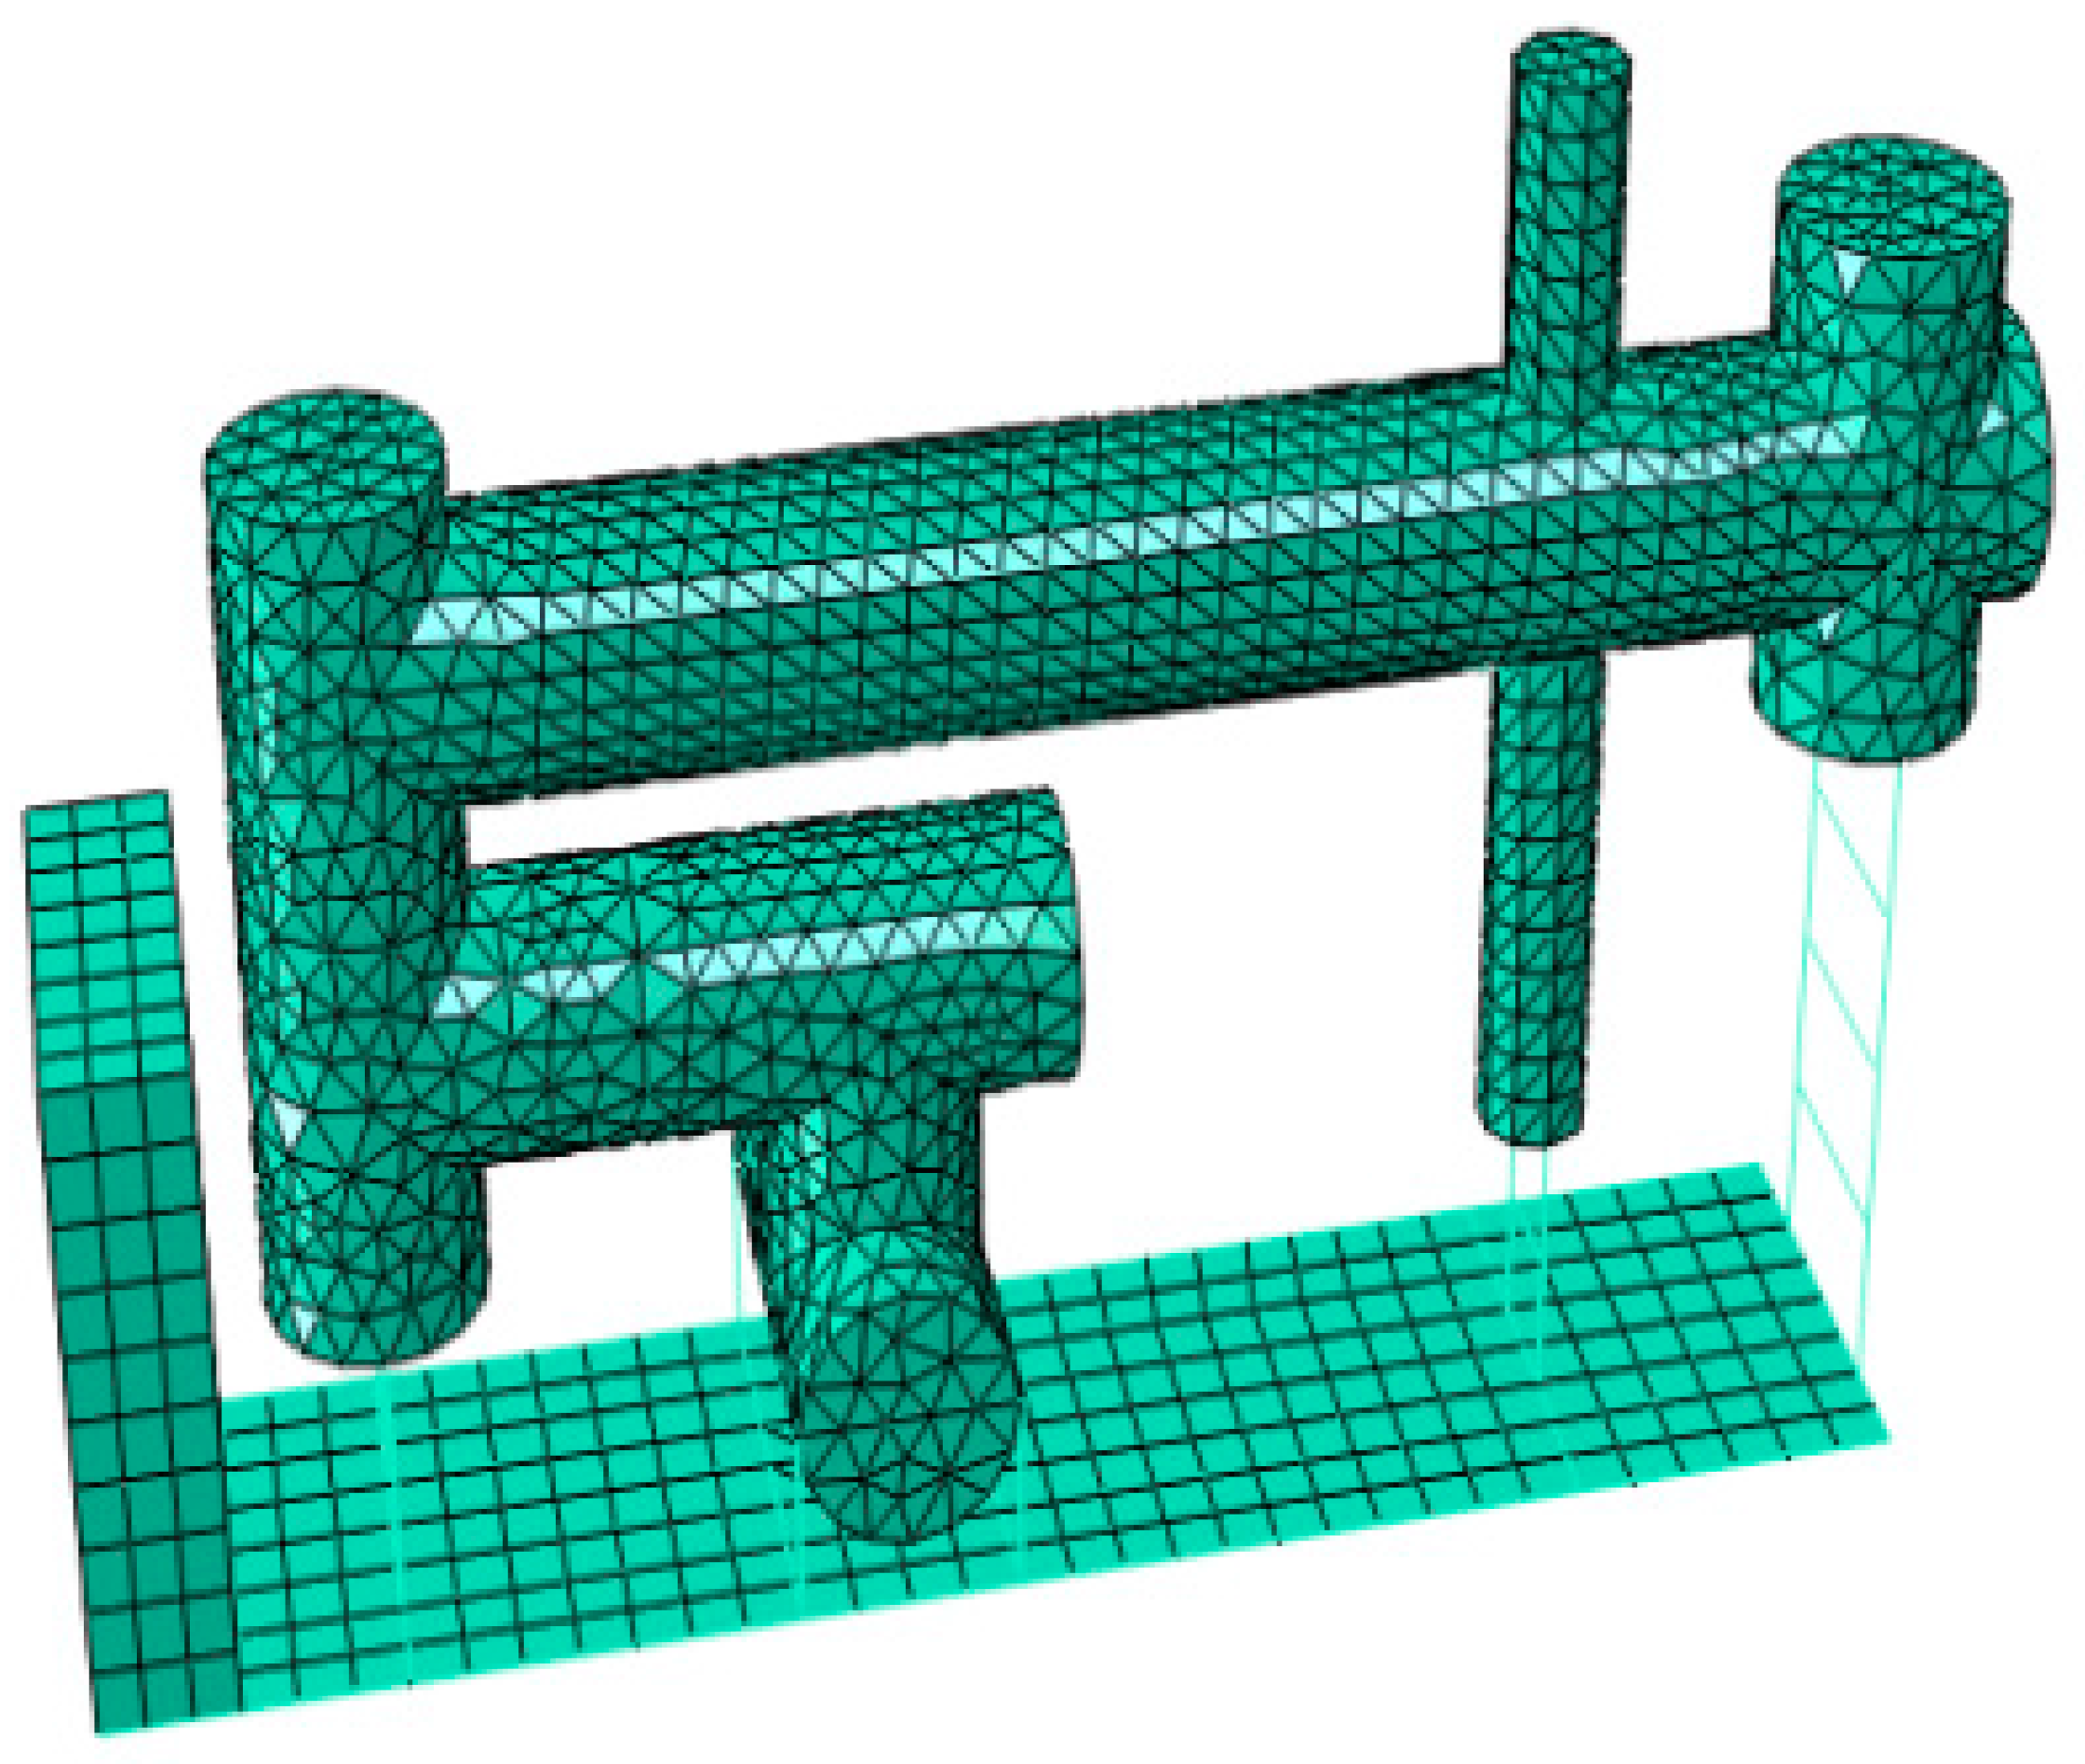
Figure 8.
Finite element model of soil.
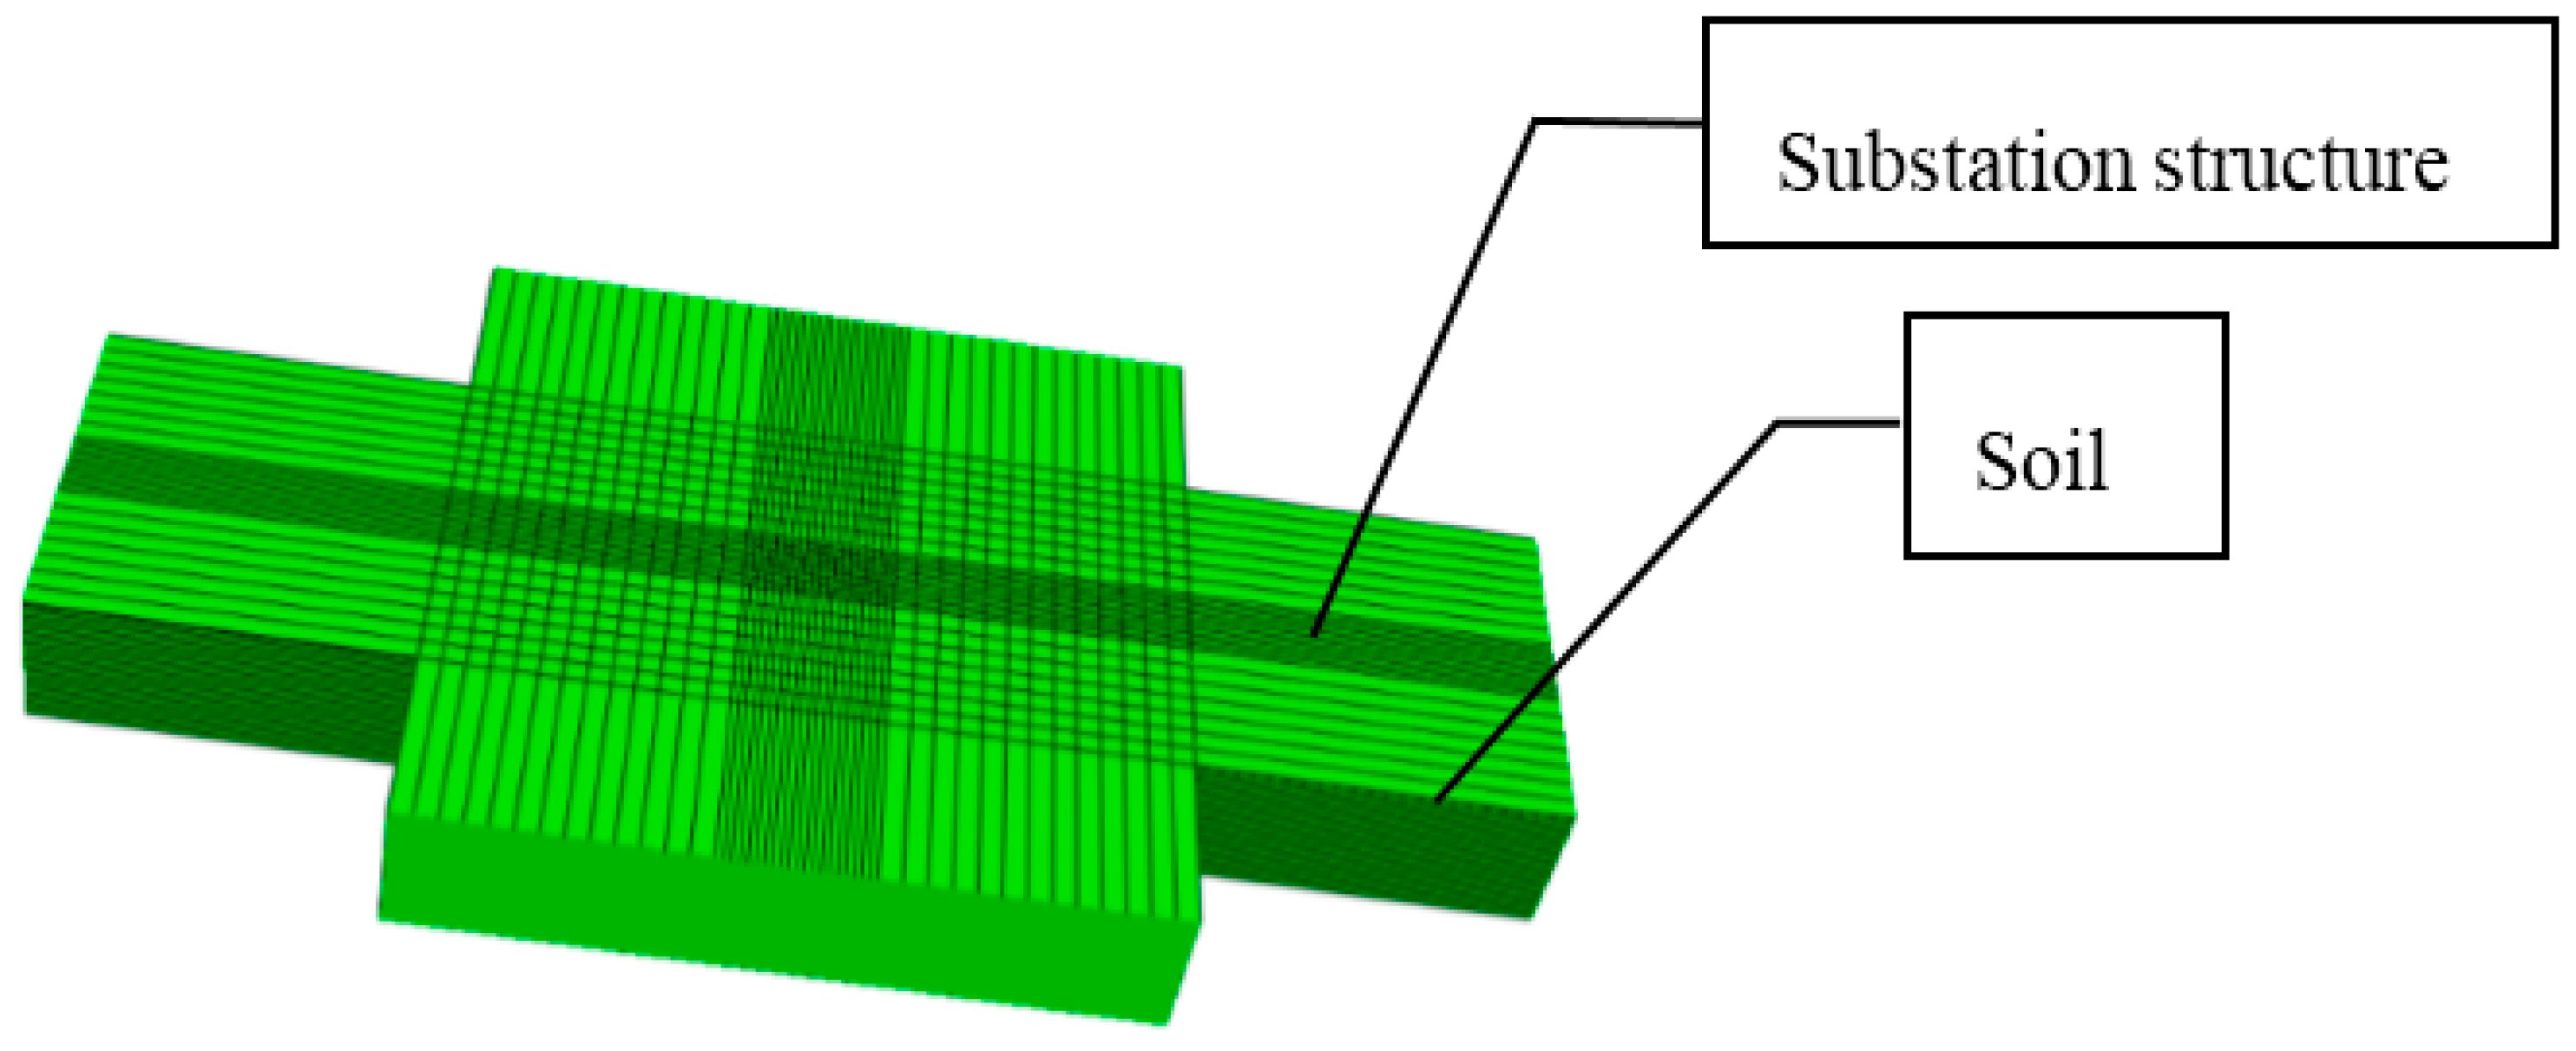
Figure 9.
El-Centro motion in the horizontal direction after inversion.
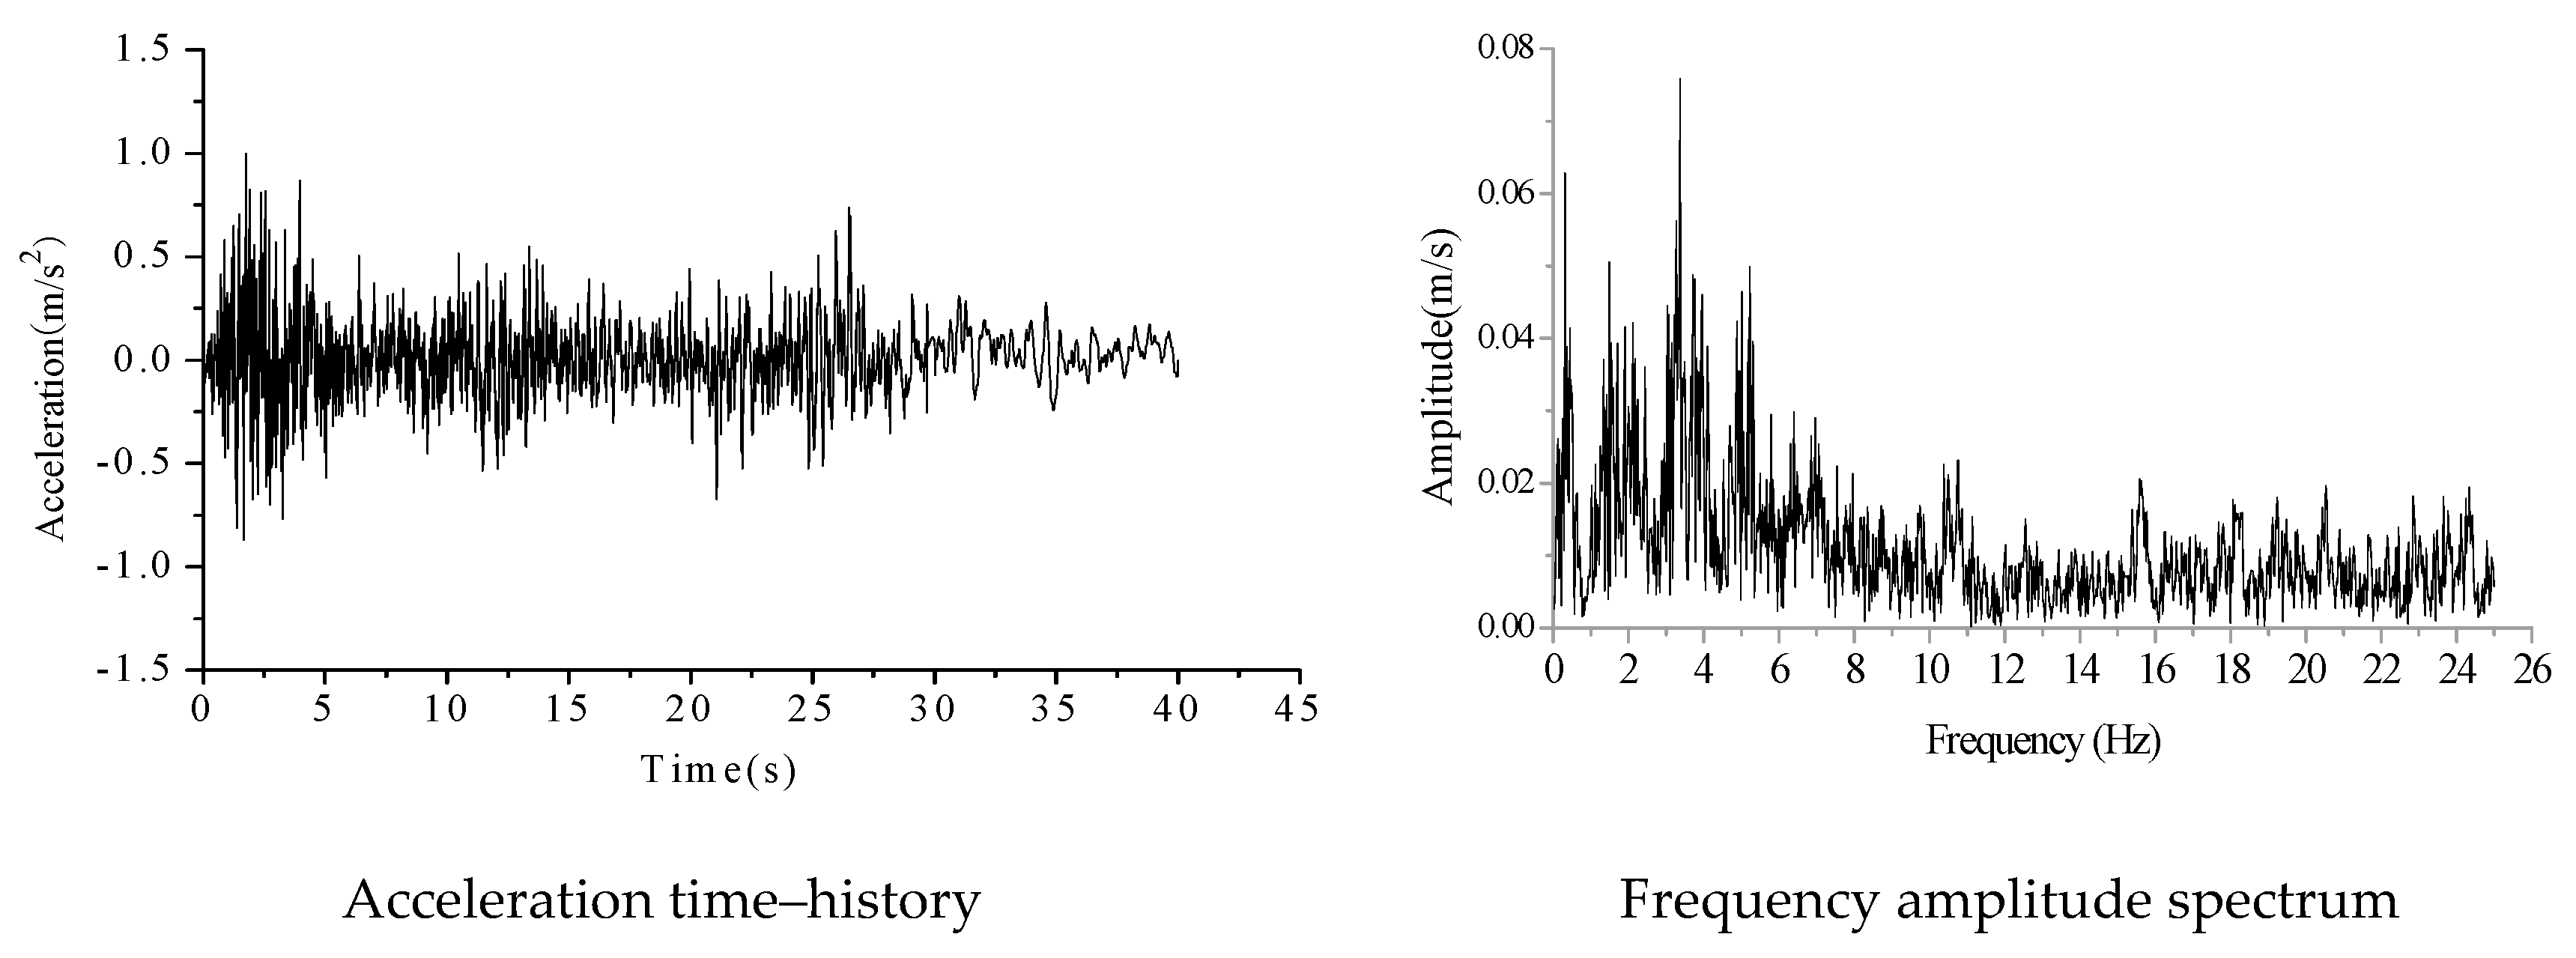
Figure 10.
El-Centro motion in the vertical direction after inversion.

Figure 11.
Taft motion in the horizontal direction after inversion.
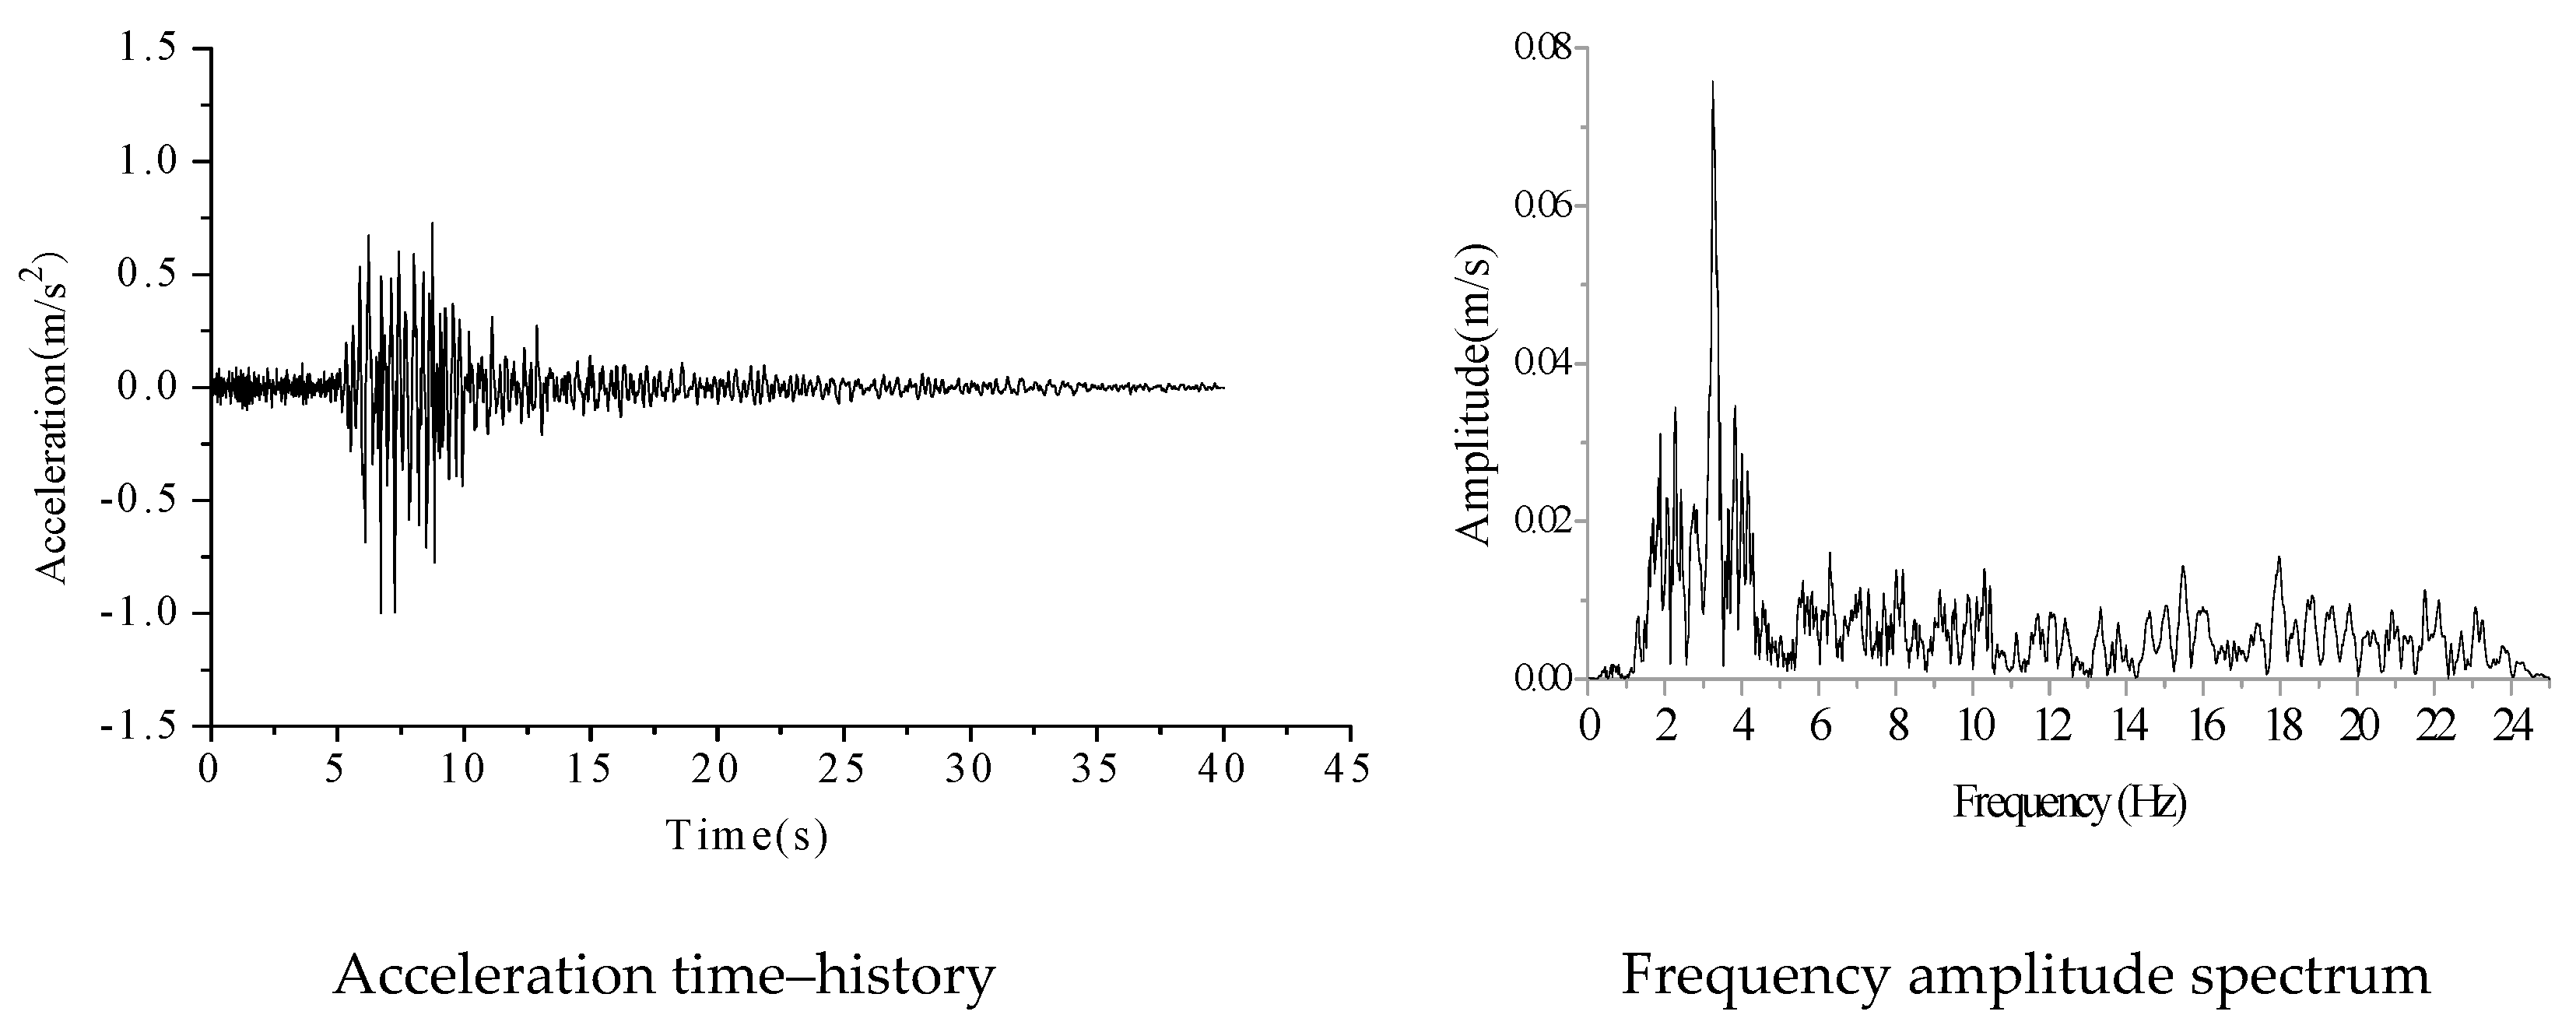
Figure 12.
Taft motion in the vertical direction after inversion.
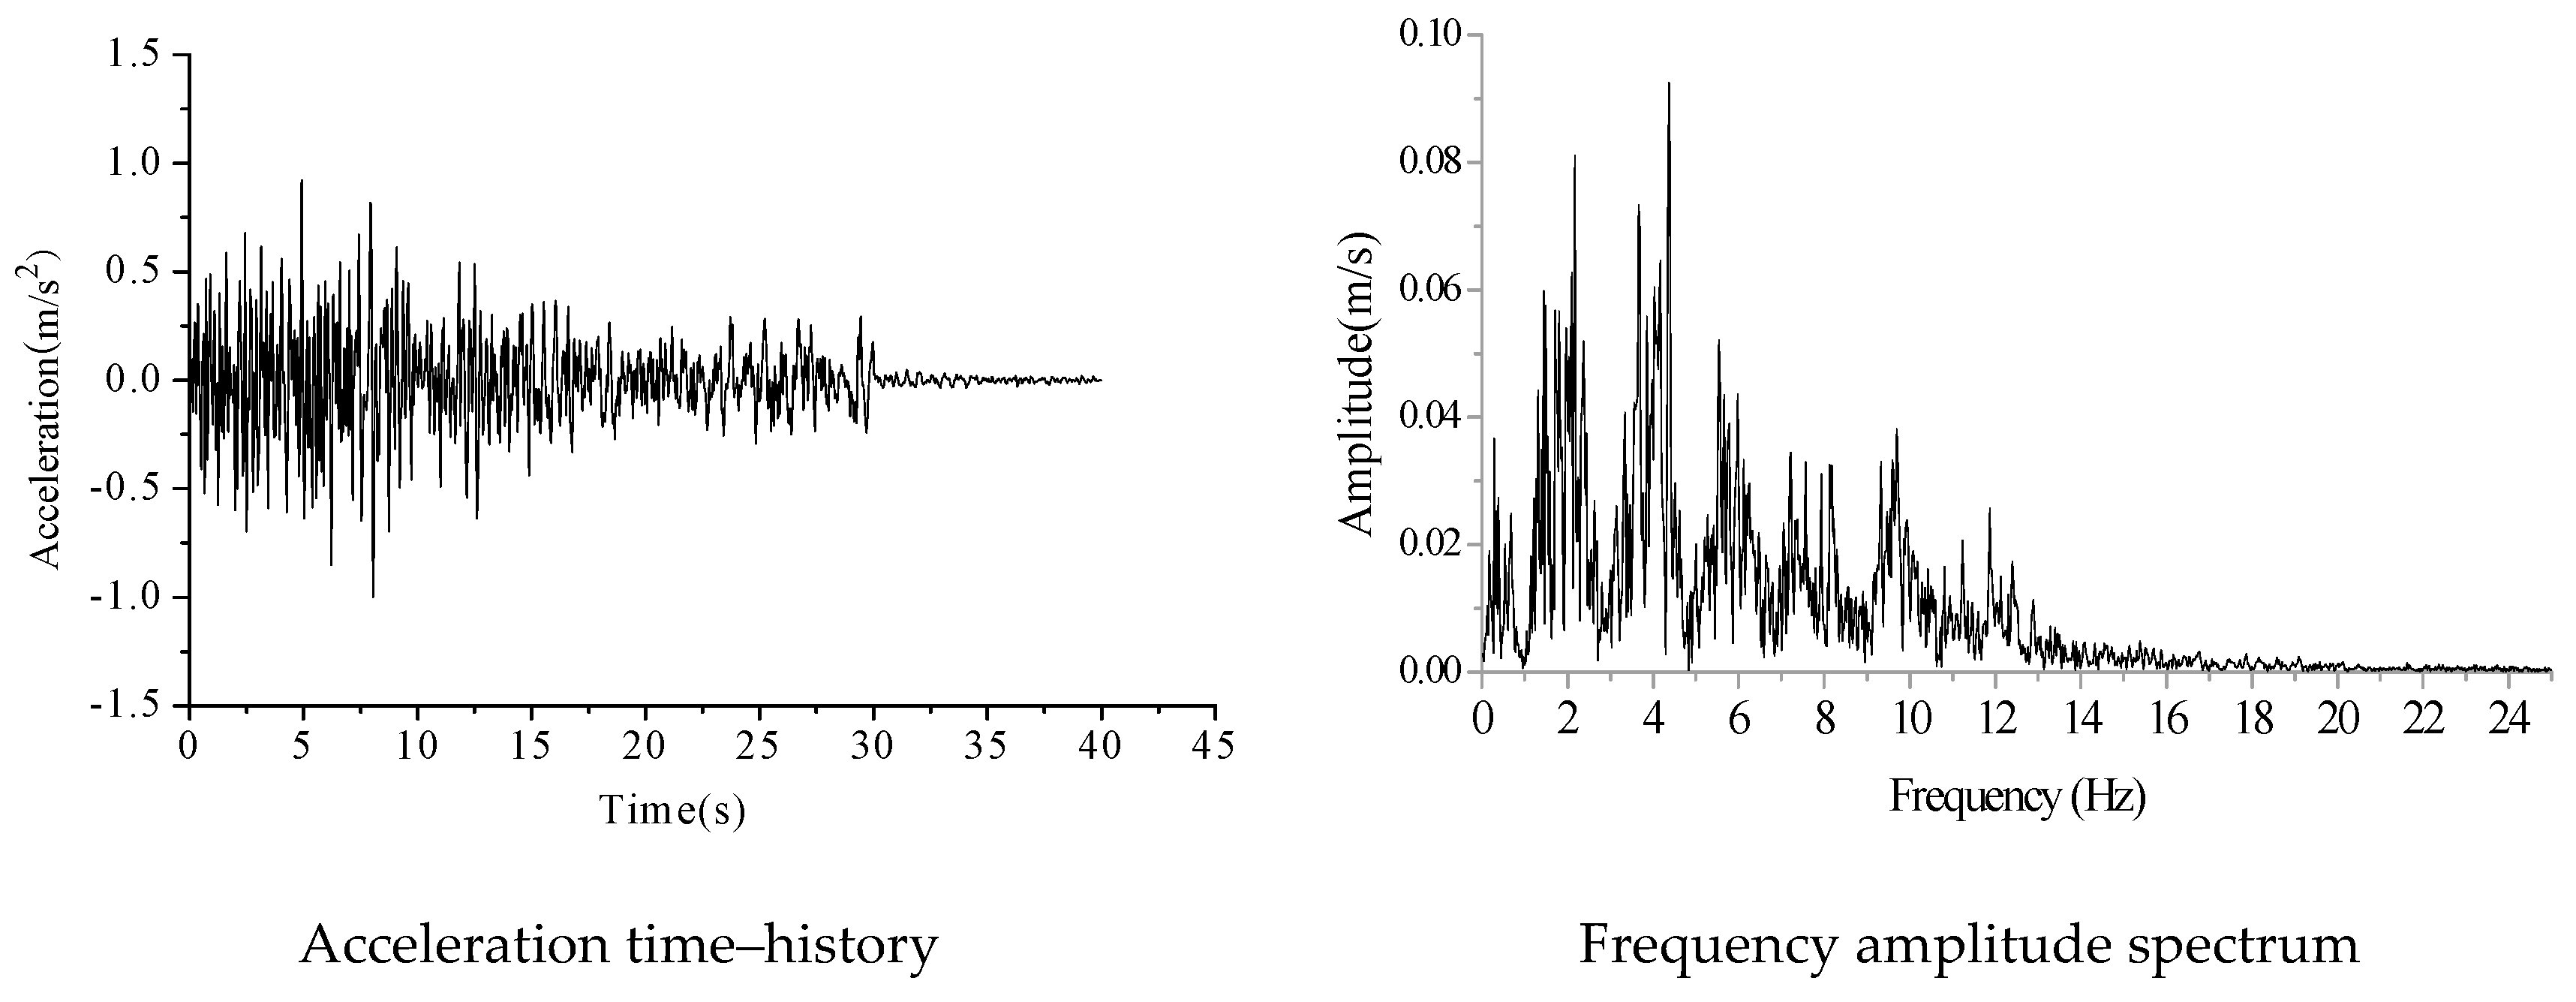
Figure 13.
Lanzhou motion in the horizontal direction after inversion.
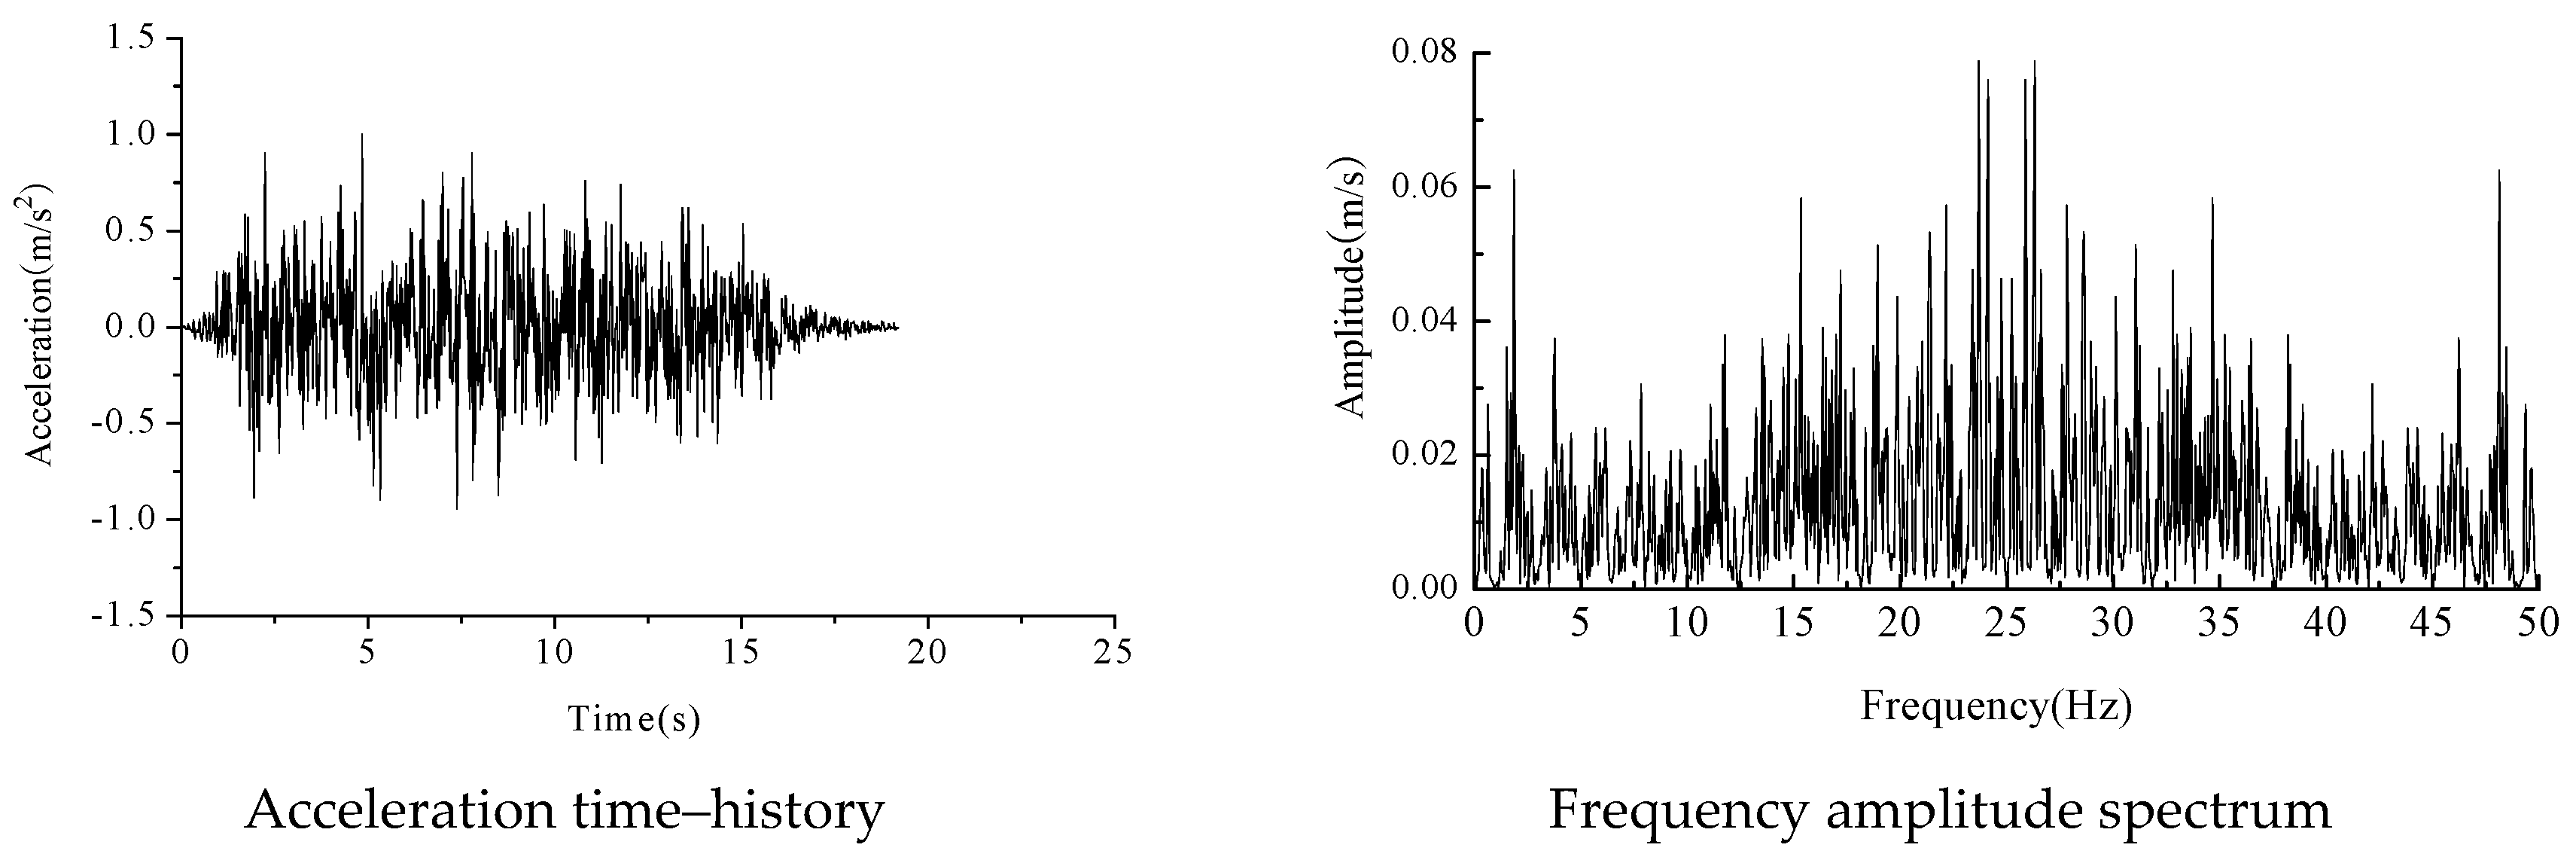
Figure 14.
Lanzhou motion in the vertical direction after inversion.
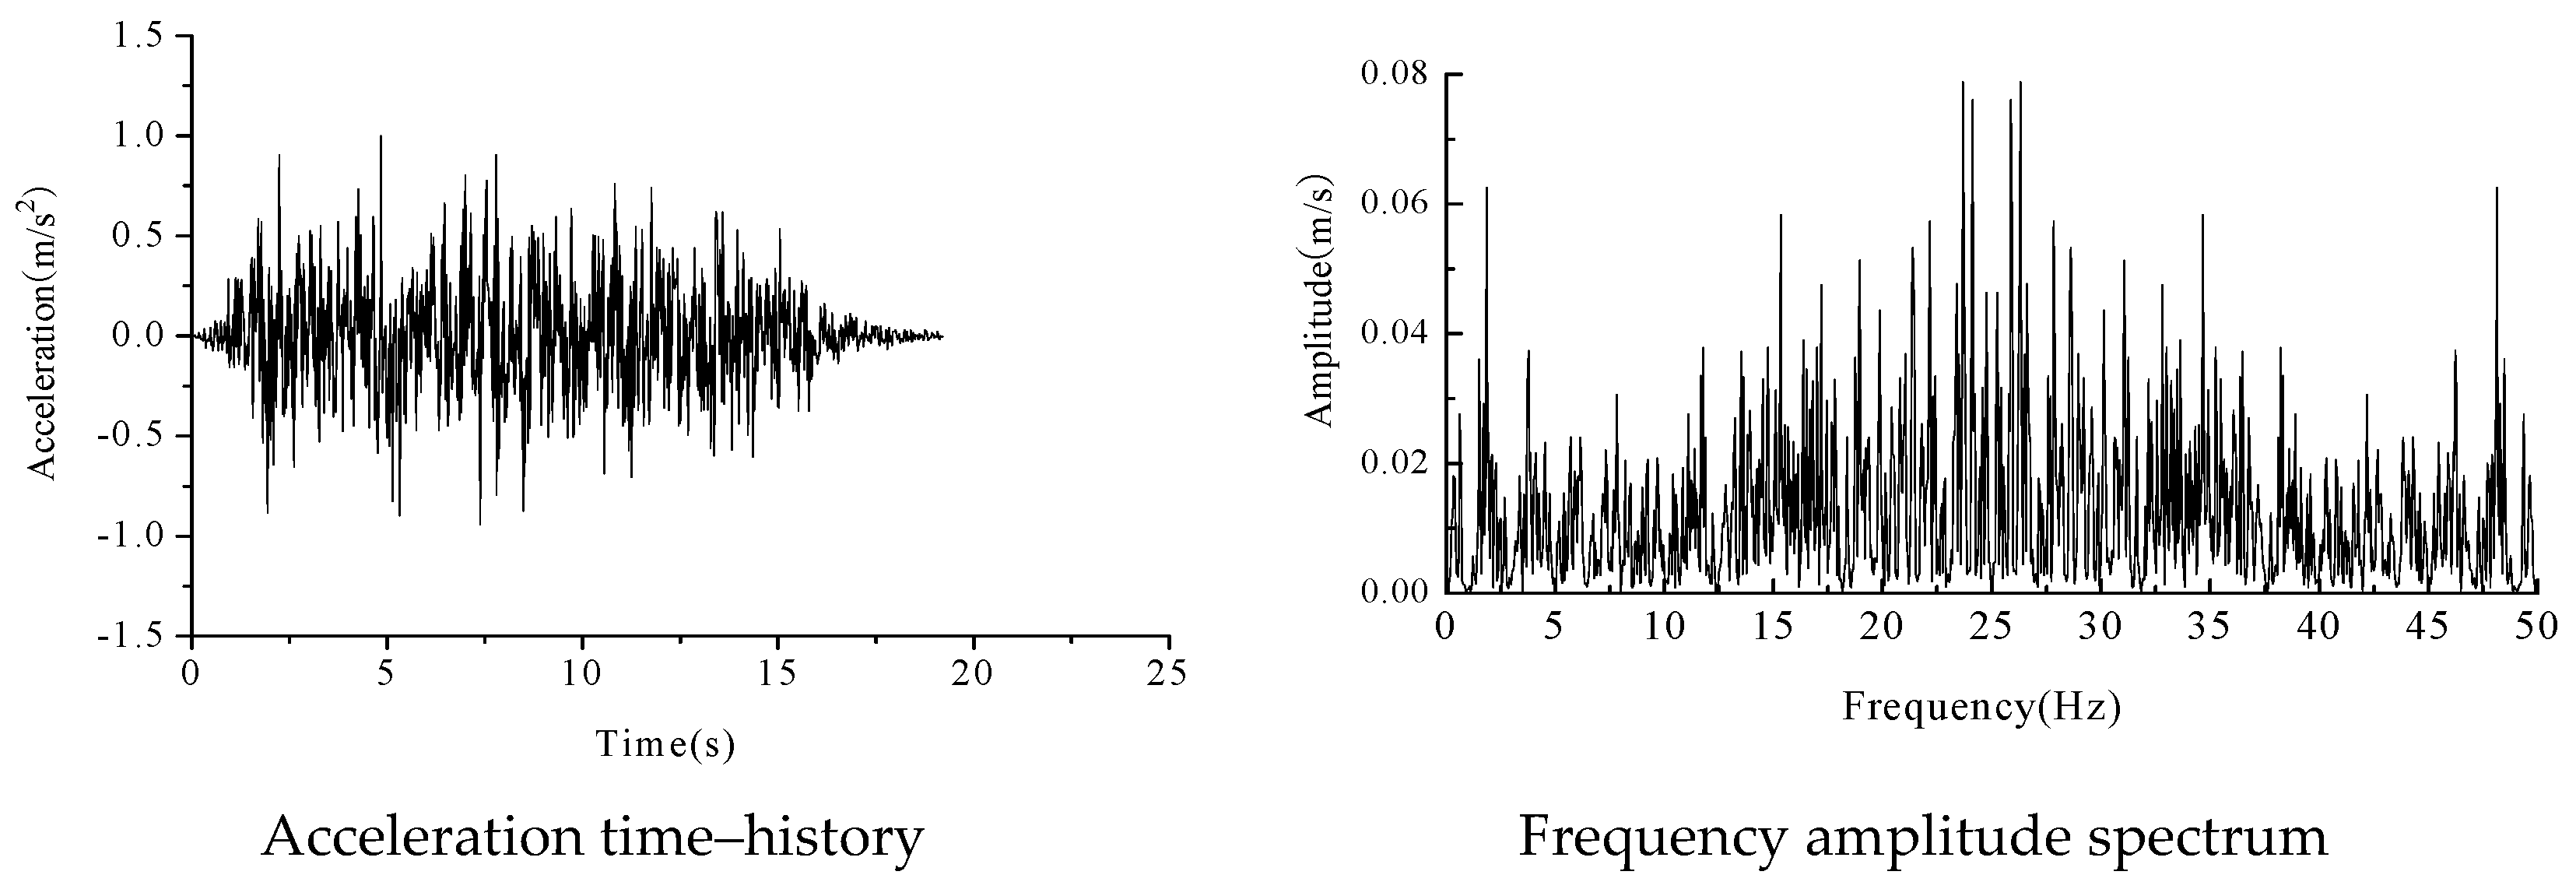
Figure 15.
Time–history curves of the midpoint’s acceleration of soil.
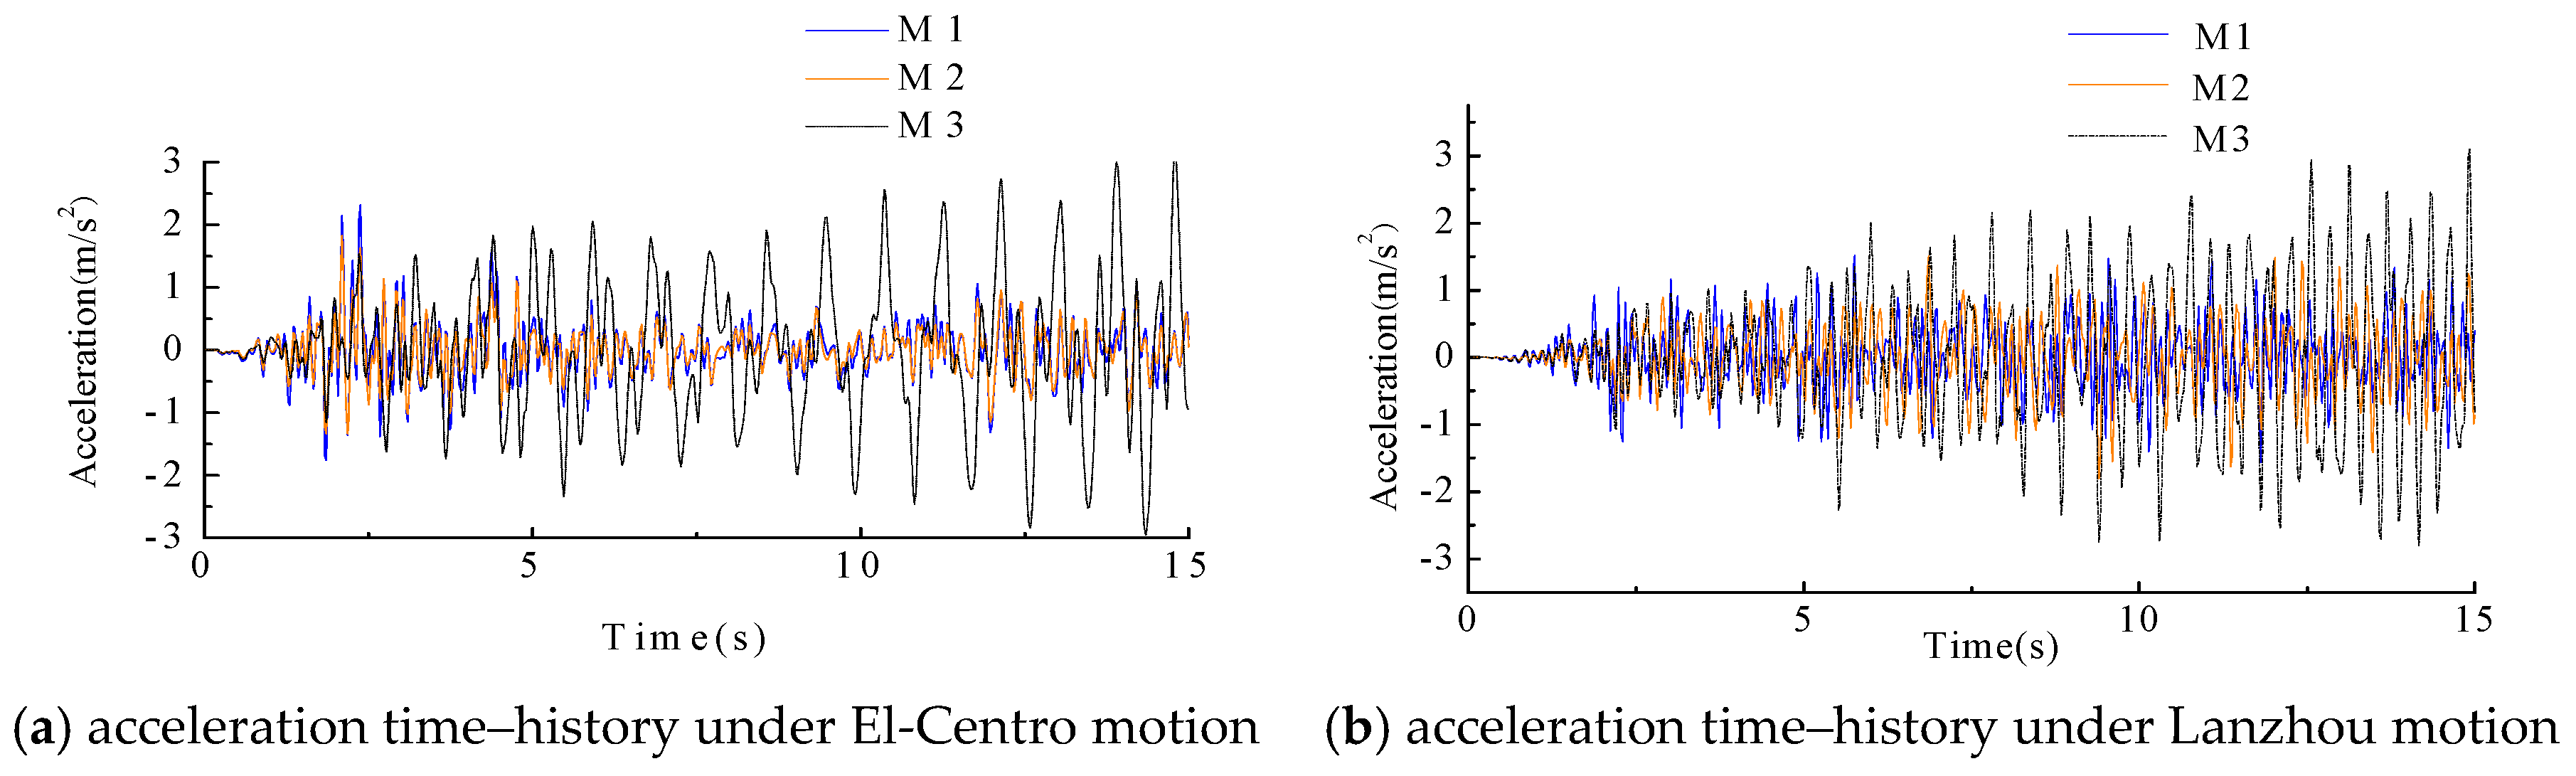
Figure 16.
Relative displacement curves of the top floor.
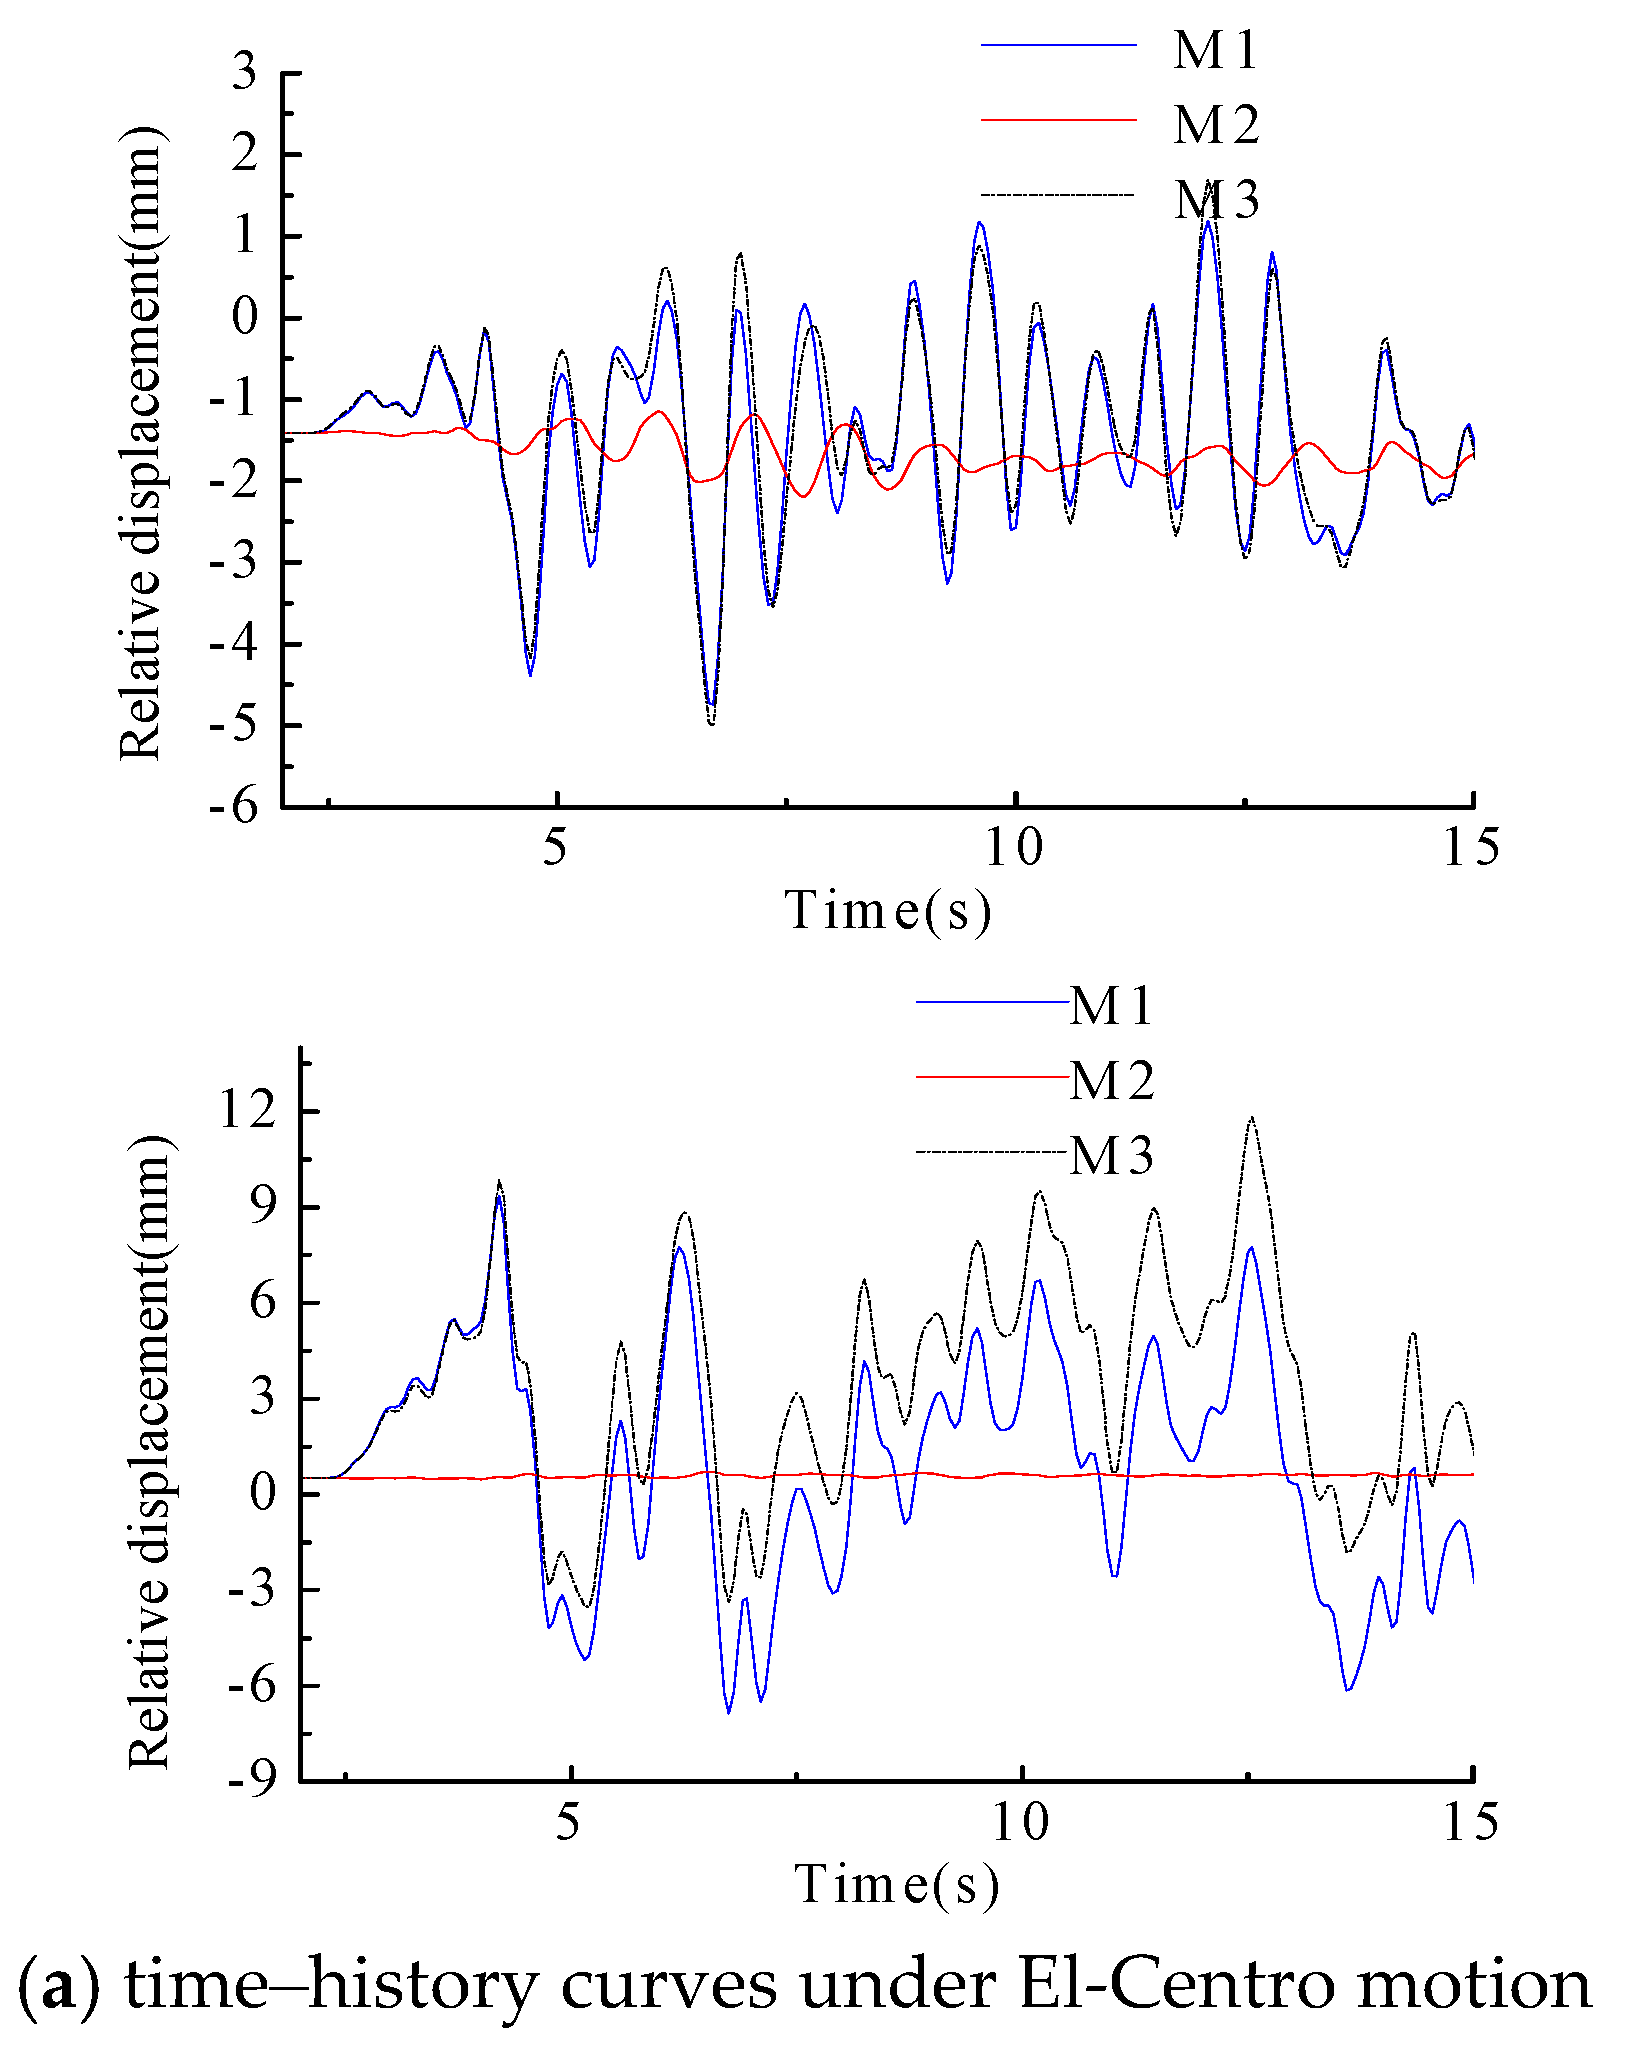

Figure 17.
Position of the observation surface and point.

Figure 18.
The peak internal forces of surface-6 under El-Centro motion.
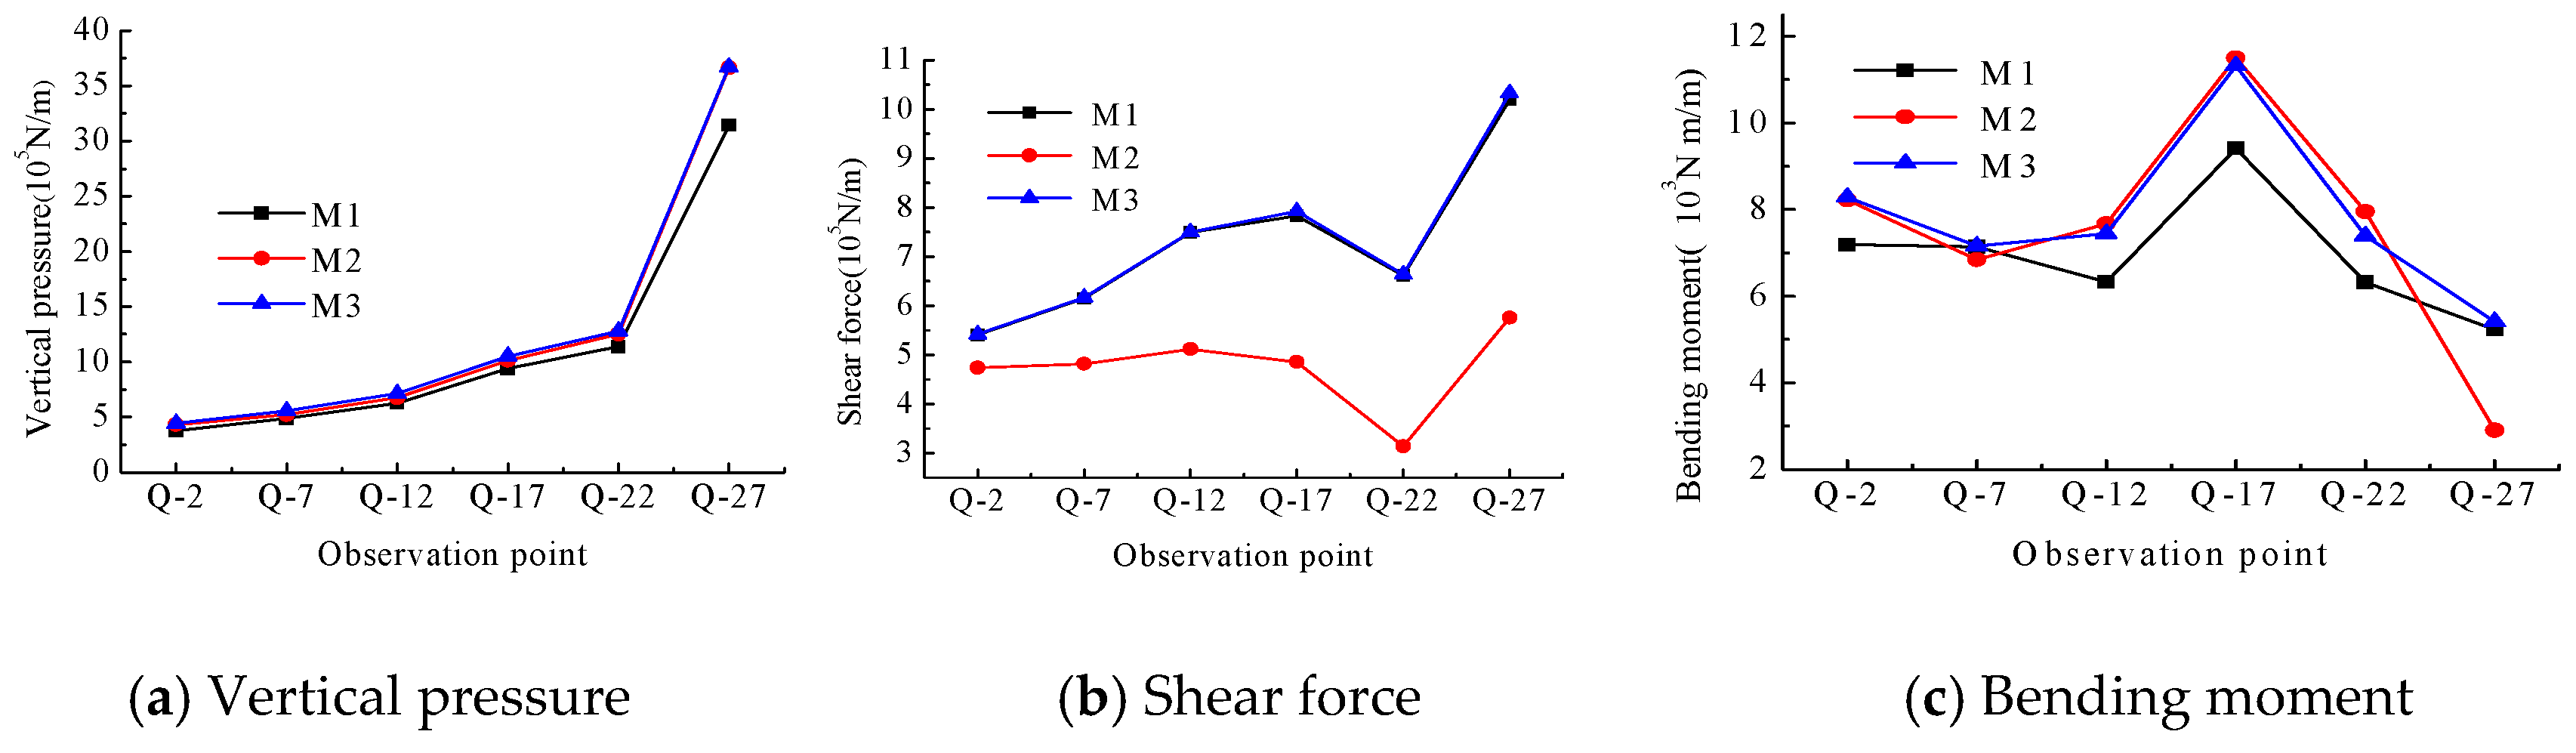
Figure 19.
Relative horizontal displacement of the side wall.
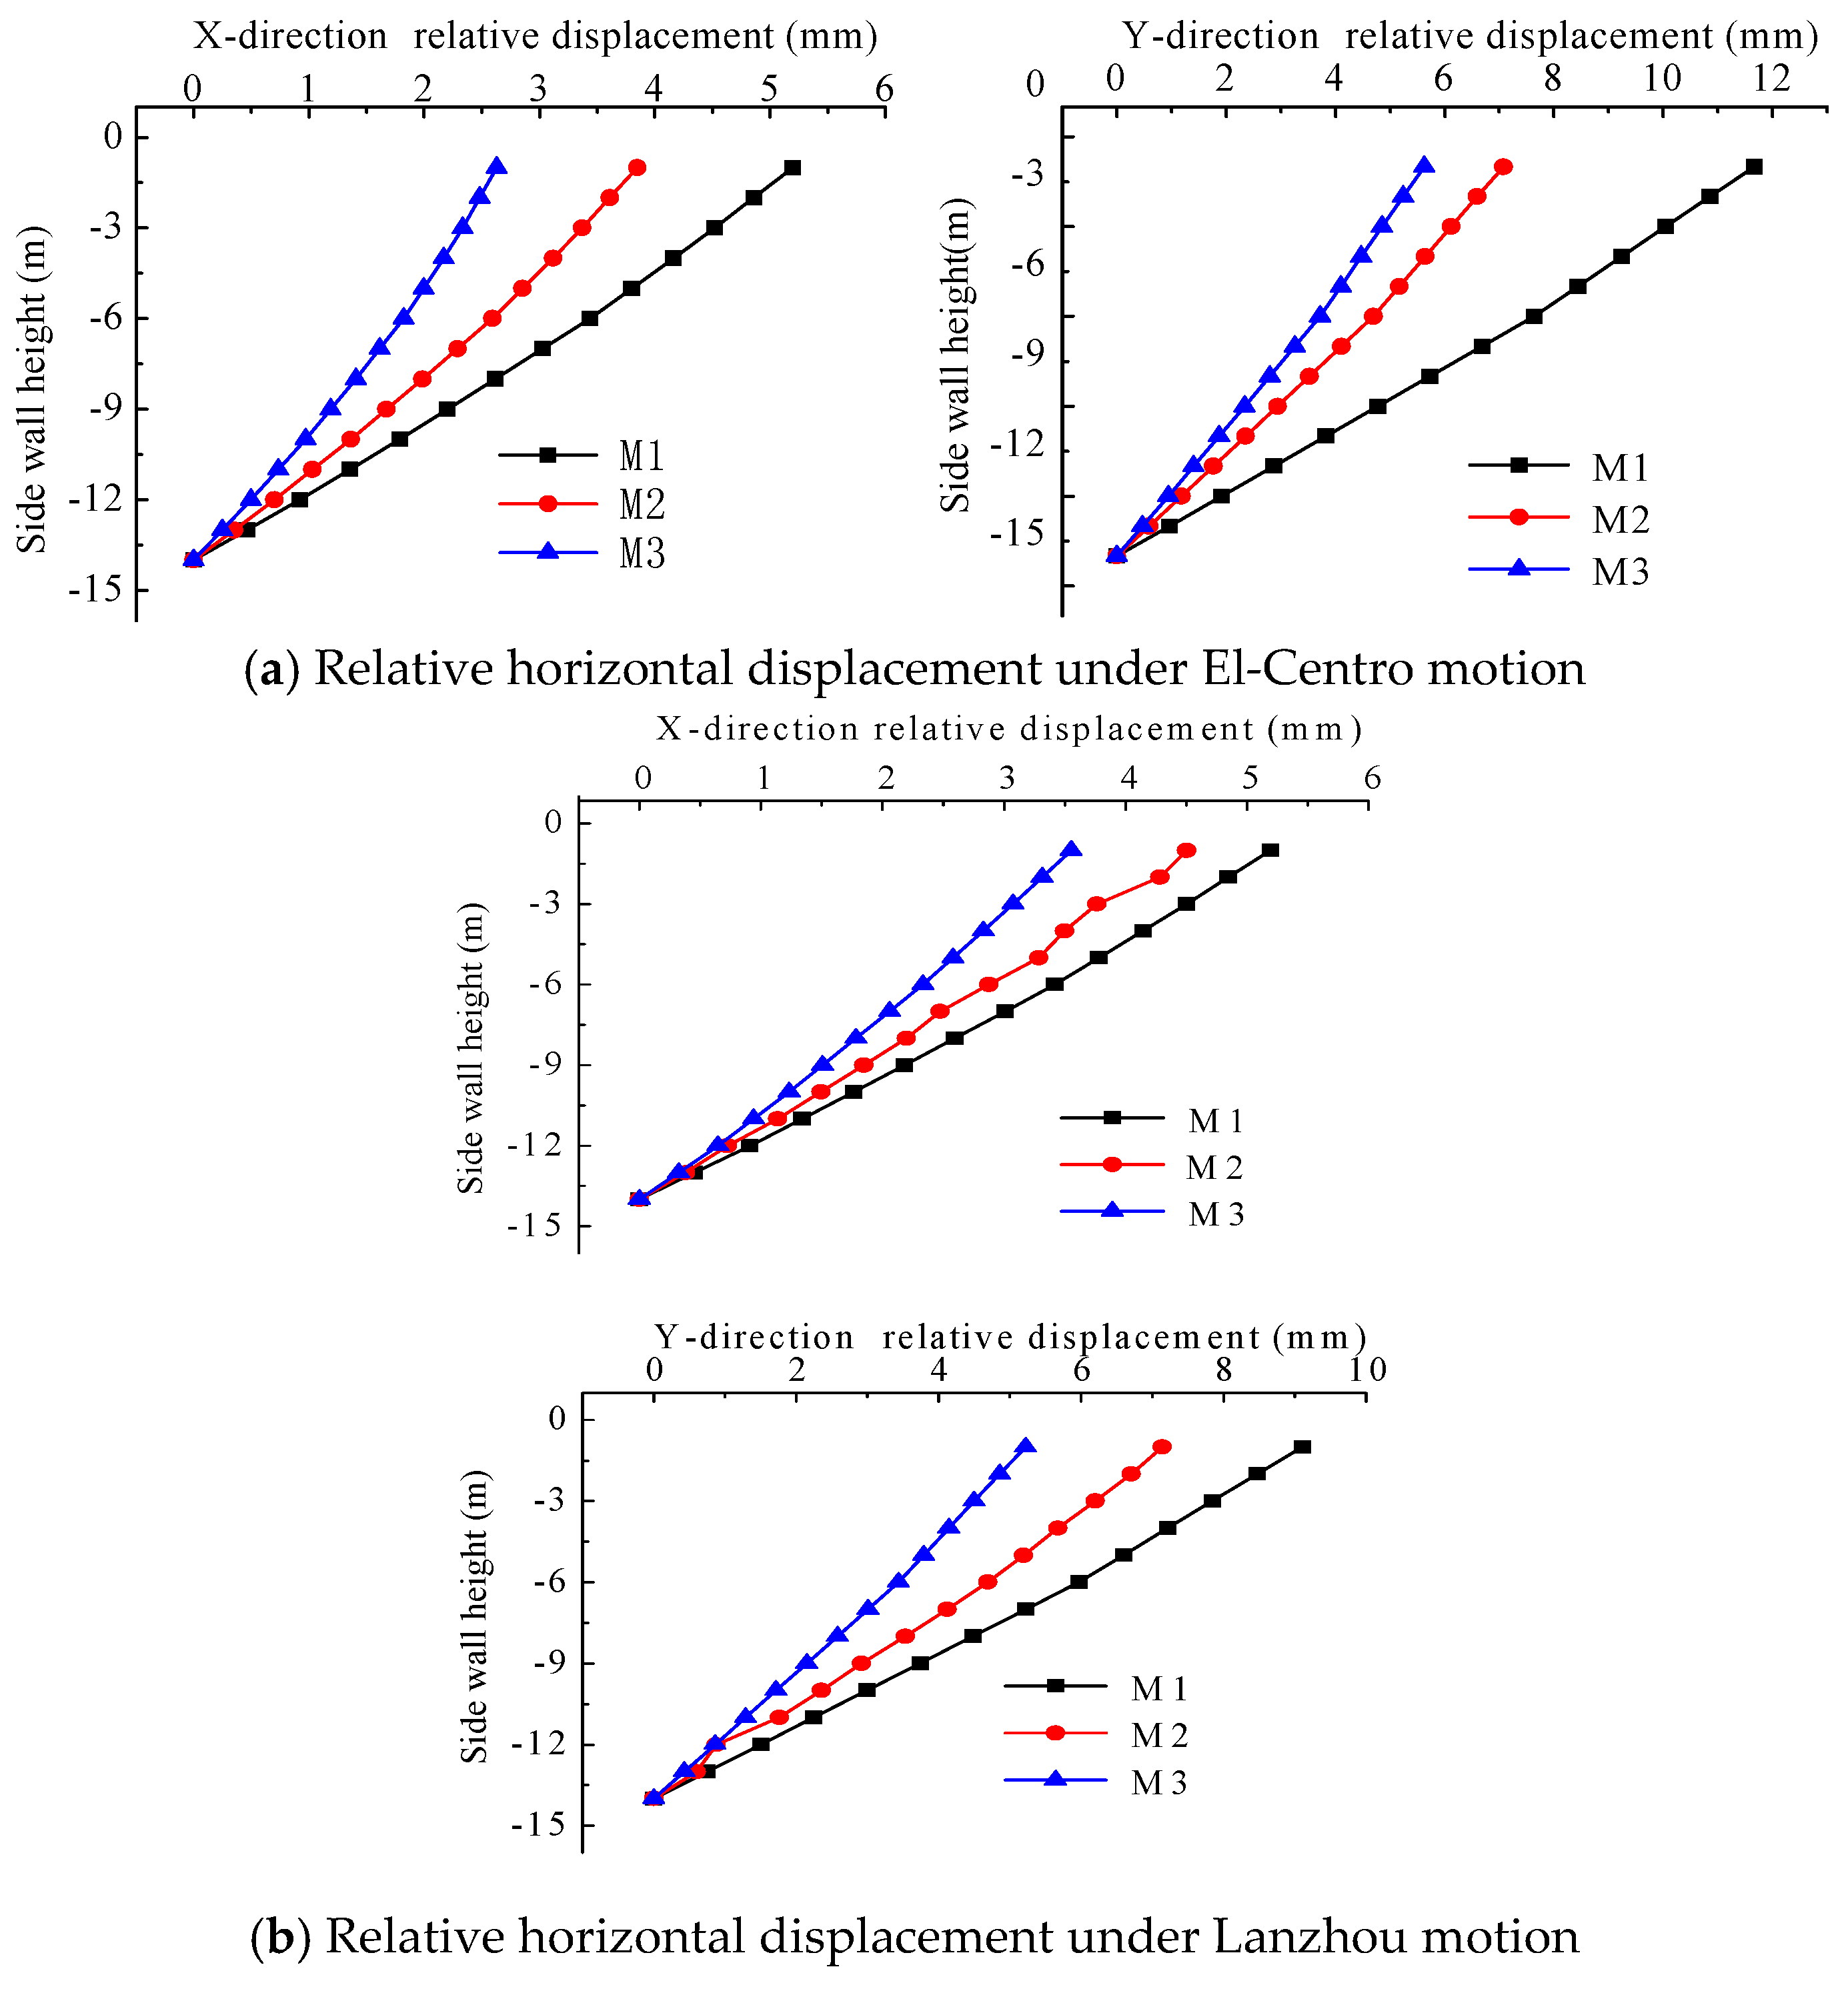
Figure 20.
Stress nephograms of the underground substation.

Figure 21.
The peak internal force of each section on surface-6 under El-Centro motion.

Figure 22.
Time–history curves of displacement on the top floor.
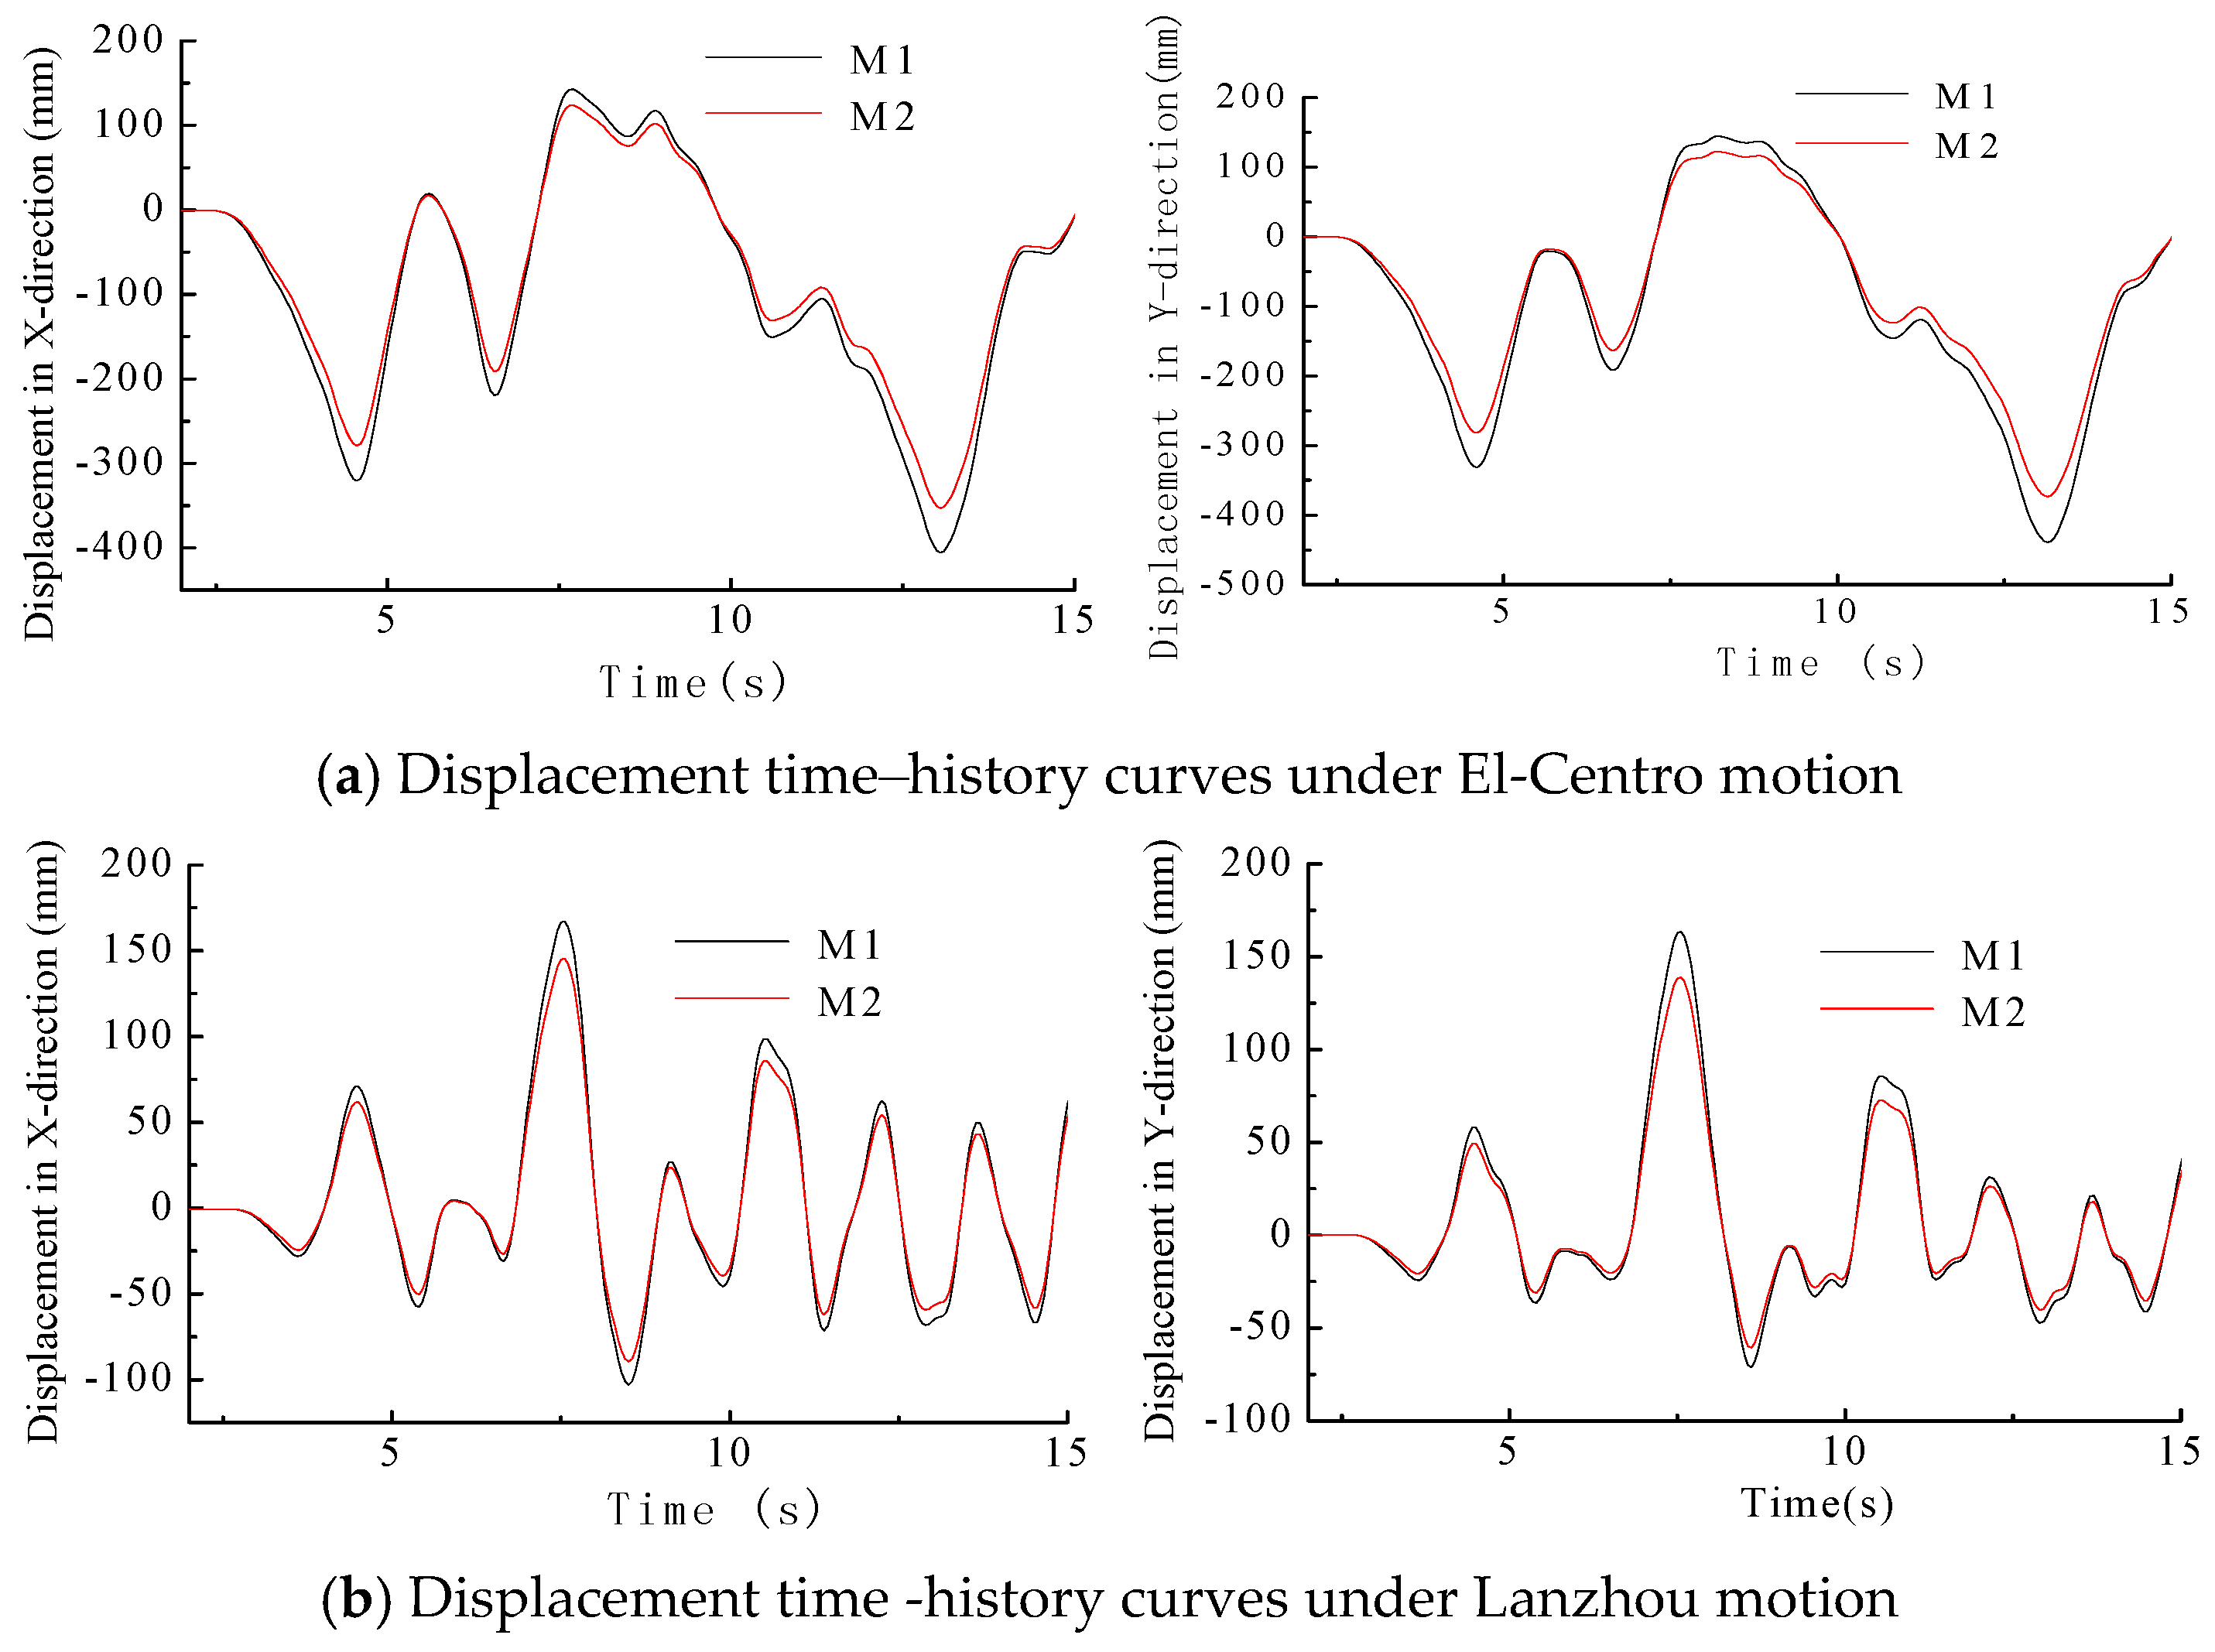
Figure 23.
Shear force and bending moment time–history curves in the X-direction at the bottom of side wall 4.
Figure 23.
Shear force and bending moment time–history curves in the X-direction at the bottom of side wall 4.

Table 1.
The physical and mechanical soil parameters.
| Number | Name of Soil | Density (kg/m3) | Elastic Modulus (MPa) | Poisson Ratio | Cohesion(kPa) | Internal Friction Angle (°) | Soil Depth (m) |
|---|---|---|---|---|---|---|---|
| 1 | Plain fill | 1720 | 5.0 | 0.39 | 22 | 15 | 4.30 |
| 2 | New loess | 1600 | 12.0 | 0.30 | 28 | 18 | 6.20 |
| 3 | Silty clay | 1950 | 15.0 | 0.30 | 45 | 15 | 1.70 |
| 4 | Pebble bed | 2250 | 55.0 | 0.15 | 0 | 45 | 2.10 |
| 5 | Silty clay | 1950 | 15.0 | 0.30 | 45 | 15 | 27.0 |
| 6 | Coarse ands | 1920 | 40.0 | 0.26 | 0 | 35 | 4.50 |
Table 2.
The conditions of peak ground acceleration (PGA).
| Model | Direction | Acceleration Input Value |
|---|---|---|
| M1 | Horizontal | 0.2 g:0.17 g (X:Y) |
| M2 | Vertical | 0.13 g (Z) |
| M3 | Coupling of horizontal and vertical | 0.2 g:0.17 g:0.13 g (X:Y:Z) |
Table 3.
Acceleration amplification factors under 0.20 g.
| Section | EL-Centro Motion | Lanzhou Motion | |||||
|---|---|---|---|---|---|---|---|
| M1 | M2 | M3 | M1 | M2 | M3 | ||
| Roof | X-direction | 0.671 | / | 0.683 | 0.683 | / | 0.714 |
| Y-direction | 0.468 | / | 0.480 | 0.489 | / | 0.502 | |
| Z-direction | / | 1.476 | 1.526 | / | 1.108 | 1.163 | |
| Floor 3 | X-direction | 0.677 | / | 0.695 | 0.699 | / | 0.726 |
| Y-direction | 0.573 | / | 0.582 | 0.503 | / | 0.520 | |
| Z-direction | / | 1.476 | 1.525 | / | 1.108 | 1.162 | |
| Floor 2 | X-direction | 0.679 | / | 0.719 | 0.722 | / | 0.742 |
| Y-direction | 0.595 | / | 0.623 | 0.536 | / | 0.565 | |
| Z-direction | / | 1.475 | 1.523 | / | 1.016 | 1.159 | |
| Floor 1 | X-direction | 0.708 | / | 0.721 | 0.746 | / | 0.760 |
| Y-direction | 0.681 | / | 0.692 | 0.568 | / | 0.590 | |
| Z-direction | / | 1.475 | 1.522 | / | 1.105 | 1.158 | |
Table 4.
Layer drifts (mm).
| Section | El-Centro Motion | Lanzhou Motion | ||||||
|---|---|---|---|---|---|---|---|---|
| M1 | M3 | M1 | M3 | |||||
| X-Direction | Y-Direction | X-Direction | Y-Direction | X-Direction | Y-Direction | X-Direction | Y-Direction | |
| Floor 3 | 1.65 | 2.47 | 1.76 | 4.03 | 1.62 | 2.18 | 1.77 | 3.14 |
| Floor 2 | 1.56 | 2.30 | 1.65 | 3.81 | 1.53 | 2.00 | 1.65 | 2.98 |
| Floor 1 | 1.70 | 2.50 | 1.79 | 3.83 | 1.68 | 2.10 | 1.77 | 2.99 |
Table 5.
The peak internal forces of each section on surface-6.
| Section | Vertical Pressure (105 N/m) | Shear Force (105 N/m) | Bending Moment (103 N·m/m) | ||||||||
|---|---|---|---|---|---|---|---|---|---|---|---|
| M1 | M2 | M3 | M1 | M2 | M3 | M1 | M2 | M3 | |||
| Floor 3 | El-Centro | Top | 3.74 | 4.32 | 4.43 | 5.41 | 4.74 | 5.42 | 7.19 | 8.22 | 8.28 |
| Bottom | 4.87 | 5.20 | 5.47 | 6.15 | 4.82 | 6.17 | 6.54 | 6.94 | 7.16 | ||
| Lanzhou | Top | 3.75 | 3.93 | 4.01 | 5.61 | 4.36 | 5.64 | 7.30 | 7.87 | 8.01 | |
| Bottom | 4.51 | 4.68 | 4.86 | 6.14 | 4.57 | 6.23 | 6.90 | 7.21 | 7.47 | ||
| Floor 2 | El-Centro | Top | 6.26 | 6.76 | 7.14 | 7.49 | 5.12 | 7.50 | 6.33 | 7.67 | 7.85 |
| Bottom | 9.39 | 10.13 | 10.31 | 7.83 | 4.86 | 7.92 | 9.41 | 11.50 | 11.62 | ||
| Lanzhou | Top | 5.75 | 6.07 | 6.24 | 7.04 | 4.82 | 7.22 | 6.33 | 6.97 | 6.97 | |
| Bottom | 8.69 | 9.05 | 9.44 | 7.00 | 4.53 | 7.35 | 9.08 | 10.07 | 10.13 | ||
| Floor 1 | El-Centro | Top | 11.39 | 12.52 | 12.77 | 6.62 | 3.14 | 6.64 | 6.32 | 7.95 | 8.19 |
| Bottom | 31.42 | 36.66 | 36.70 | 10.2 | 5.76 | 10.3 | 5.23 | 5.70 | 5.81 | ||
| Lanzhou | Top | 10.03 | 11.16 | 11.55 | 5.65 | 3.00 | 5.86 | 6.51 | 6.90 | 6.91 | |
| Bottom | 30.20 | 32.66 | 33.11 | 8.89 | 5.39 | 9.22 | 5.45 | 5.93 | 6.00 | ||
Table 6.
Soil elasticity modulus (MPa).
| Number | Name of Soil | M1 | M2 | M3 |
|---|---|---|---|---|
| 1 | Plain fill | 5.0 | 10.0 | 15.0 |
| 2 | New loess | 12.0 | 24.0 | 36.0 |
| 3 | Silty clay | 15.0 | 30.0 | 45.0 |
| 4 | Pebble bed | 55.0 | 110.0 | 165.0 |
| 5 | Silty clay | 15.0 | 30.0 | 45.0 |
Table 7.
Layer drifts (mm) and layer drift angles (rad).
| Section | El-Centro Motion | Lanzhou Motion | |||||
|---|---|---|---|---|---|---|---|
| M1 | M2 | M3 | M1 | M2 | M3 | ||
| Floor 3 | layer drift in the X-direction | 1.76 | 1.26 | 0.8 | 1.77 | 1.15 | 1.04 |
| layer drift angle in the X-direction | 1/2898 | 1/4048 | 1/6375 | 1/2881 | 1/4435 | 1/4904 | |
| layer drift in the Y-direction | 4.03 | 2.37 | 1.91 | 3.14 | 1.83 | 0.76 | |
| layer drift angle in the Y-direction | 1/1266 | 1/2025 | 1/2513 | 1/1529 | 1/2623 | 1/6316 | |
| Floor 2 | layer drift in the X-direction | 1.65 | 1.23 | 0.86 | 1.65 | 1.12 | 0.78 |
| layer drift angle in the X-direction | 1/2909 | 1/3902 | 1/5581 | 1/2909 | 1/4286 | 1/6154 | |
| layer drift in the Y-direction | 3.81 | 2.34 | 1.85 | 2.98 | 1.76 | 0.68 | |
| layer drift angle in the Y-direction | 1/1260 | 1/2051 | 1/2595 | 1/1611 | 1/2727 | 1/7059 | |
| Floor 1 | layer drift in the X-direction | 1.79 | 1.36 | 0.96 | 1.77 | 1.23 | 1.23 |
| layer drift angle in the X-direction | 1/2682 | 1/3529 | 1/5000 | 1/2712 | 1/3902 | 1/3902 | |
| layer drift in the Y-direction | 3.83 | 2.36 | 1.87 | 2.99 | 1.75 | 0.93 | |
| layer drift angle in the Y-direction | 1/1253 | 1/2034 | 1/2567 | 1/1605 | 1/2743 | 1/5161 | |
Table 8.
The peak stresses and stress amplitudes under Lanzhou motion.
| Section | M1 | M2 | M3 | ||||
|---|---|---|---|---|---|---|---|
| Static (MPa) | Dynamic (MPa) | Amplification | Dynamic (MPa) | Amplification | Dynamic (MPa) | Amplification | |
| −1 Floor | 3.97 | 4.95 | 24.66 | 4.80 | 20.89 | 5.08 | 27.89 |
| −2 Floor | 3.61 | 4.22 | 16.90 | 4.13 | 14.40 | 5.28 | 46.23 |
| −3 Floor | 3.90 | 4.43 | 13.74 | 4.65 | 19.38 | 5.51 | 41.39 |
| Side wall 1 * | 1.99 | 2.27 | 14.09 | 2.10 | 5.44 | 2.23 | 11.98 |
| Side wall 3 | 2.93 | 3.32 | 13.38 | 3.26 | 11.26 | 3.58 | 22.16 |
| Side wall 4 | 5.43 | 6.56 | 20.80 | 6.11 | 12.59 | 6.51 | 19.97 |
| Side wall 5 | 7.72 | 8.54 | 10.70 | 8.36 | 8.33 | 9.04 | 17.08 |
| Side wall 6 | 4.15 | 4.70 | 13.14 | 4.65 | 12.36 | 5.41 | 30.23 |
| Side wall A | 4.14 | 4.71 | 13.88 | 4.40 | 6.48 | 4.73 | 14.49 |
| Side wall B | 4.09 | 4.14 | 1.09 | 4.10 | 0.25 | 4.22 | 3.07 |
| Side wall C | 3.73 | 5.19 | 39.08 | 4.79 | 28.28 | 5.14 | 37.69 |
| Side wall D | 2.48 | 2.60 | 4.70 | 2.59 | 4.43 | 2.81 | 13.19 |
* Side wall 1 means the number of the wall, i.e., located at the cross of axis 1. The rest have similar meanings.
Table 9.
The peak internal forces of each section on surface-6 under 0.20 g.
| Section | Peak Vertical Pressure (105 N/m) | Peak Shear Force (105 N/m) | Peak Bending Moment (103 N·m/m) | ||||||||
|---|---|---|---|---|---|---|---|---|---|---|---|
| M1 | M2 | M3 | M1 | M2 | M3 | M1 | M2 | M3 | |||
| Floor 3 | El-Centro motion | Top | 4.43 | 4.28 | 4.40 | 5.42 | 5.67 | 5.81 | 8.28 | 8.28 | 8.36 |
| Bottom | 5.57 | 5.32 | 5.39 | 6.17 | 6.80 | 6.85 | 7.16 | 7.67 | 7.87 | ||
| Lanzhou motion | Top | 4.61 | 4.14 | 4.50 | 5.44 | 5.47 | 5.61 | 8.01 | 8.28 | 8.61 | |
| Bottom | 5.30 | 4.83 | 5.27 | 6.13 | 6.26 | 6.59 | 7.17 | 7.18 | 7.36 | ||
| Floor 2 | El-Centro motion | Top | 7.14 | 6.69 | 6.81 | 7.50 | 8.72 | 8.94 | 7.45 | 7.77 | 7.96 |
| Bottom | 10.51 | 9.80 | 9.92 | 7.92 | 9.40 | 9.79 | 9.32 | 10.01 | 10.33 | ||
| Lanzhou motion | Top | 6.94 | 6.19 | 6.70 | 7.22 | 7.51 | 8.20 | 6.97 | 7.62 | 8.02 | |
| Bottom | 9.84 | 9.20 | 9.71 | 7.35 | 7.57 | 8.44 | 9.93 | 10.10 | 11.06 | ||
| Floor 1 | El-Centro motion | Top | 12.77 | 11.91 | 12.11 | 6.64 | 8.00 | 8.51 | 5.39 | 6.47 | 6.75 |
| Bottom | 36.70 | 32.79 | 32.48 | 10.33 | 12.27 | 13.22 | 5.21 | 5.46 | 5.67 | ||
| Lanzhou motion | Top | 12.25 | 11.32 | 12.00 | 5.26 | 5.55 | 6.62 | 6.91 | 6.98 | 7.22 | |
| Bottom | 35.11 | 31.27 | 34.19 | 8.22 | 8.47 | 9.91 | 5.26 | 5.52 | 5.69 | ||
Table 10.
Acceleration amplification factors.
| Acceleration Amplification Factor | Soil Surface | Roof | Floor 3 | Floor 2 | Floor 1 | Equipment Top | ||
|---|---|---|---|---|---|---|---|---|
| El-Centro motion | Structure | X-direction | / | 0.817 | 0.82 | 0.823 | 0.824 | 2.600 |
| Y-direction | / | 0.498 | 0.582 | 0.661 | 0.738 | 1.194 | ||
| Soil | X-direction | 0.752 | 0.810 | 0.985 | 1.064 | 1.219 | / | |
| Y-direction | 0.594 | 0.780 | 0.817 | 0.841 | 0.864 | / | ||
| Lanzhou motion | Structure | X-direction | / | 0.805 | 0.828 | 0.845 | 0.865 | 2.554 |
| Y-direction | / | 0.502 | 0.515 | 0.545 | 0.599 | 1.096 | ||
| Soil | X-direction | 0.812 | 1.287 | 1.327 | 1.319 | 1.457 | / | |
| Y-direction | 0.788 | 0.822 | 0.836 | 0.829 | 0.845 | / | ||
| Taft motion | Structure | X-direction | / | 0. 90 | 0.924 | 1.047 | 1.070 | 3.518 |
| Y-direction | / | 0.69 | 0.759 | 0.807 | 0.954 | 1.494 | ||
| Soil | X-direction | 1.267 | 1.342 | 1.551 | 1.583 | 1.772 | / | |
| Y-direction | 1.021 | 1.036 | 1.049 | 1.093 | 1.177 | / | ||
Table 11.
Layer drift (mm) and layer drift angle (rad).
| Section | El-Centro Motion | Lanzhou Motion | |||
|---|---|---|---|---|---|
| M1 | M2 | M1 | M2 | ||
| Floor 3 | layer drift in the X-direction | 3.110 | 2.737 | 2.949 | 2.589 |
| layer drift angle in the X-direction | 1/1640 | 1/1863 | 1/1729 | 1/1970 | |
| layer drift in the Y-direction | 8.074 | 6.803 | 5.373 | 4.611 | |
| layer drift angle in the Y-direction | 1/632 | 1/750 | 1/949 | 1/1106 | |
| Floor 2 | layer drift in the X-direction | 2.984 | 2.623 | 2.808 | 2.463 |
| layer drift angle in the X-direction | 1/1609 | 1/1830 | 1/1709 | 1/1949 | |
| layer drift in the Y-direction | 7.660 | 6.454 | 5.185 | 4.510 | |
| layer drift angle in the Y-direction | 1/627 | 1/744 | 1/926 | 1/1064 | |
| Floor 1 | layer drift in the X-direction | 3.135 | 2.754 | 2.952 | 2.610 |
| layer drift angle in the X-direction | 1/1531 | 1/1743 | 1/1626 | 1/1839 | |
| layer drift in the Y-direction | 8.132 | 6.796 | 5.402 | 4.621 | |
| layer drift angle in the Y-direction | 1/590 | 1/706 | 1/889 | 1/1039 | |
Table 12.
Peak internal forces of the side wall.
| Section | Shear Force (105 N/m) | Bending Moment (103 N·m/m) | |||||
|---|---|---|---|---|---|---|---|
| M1 | M2 | Increase (%) | M1 | M2 | Increase (%) | ||
| Side wall 1 | El-Centro motion | 6.53 | 5.80 | 12.59 | 135 | 122 | 10.66 |
| Lanzhou motion | 6.01 | 5.49 | 9.47 | 130 | 117 | 11.11 | |
| Side wall 3 | El-Centro motion | 10.98 | 9.79 | 12.16 | 947 | 850 | 11.41 |
| Lanzhou motion | 9.76 | 8.68 | 12.44 | 893 | 812 | 9.98 | |
| Side wall 4 | El-Centro motion | 11.08 | 9.42 | 17.62 | 650 | 542 | 19.93 |
| Lanzhou motion | 9.43 | 8.10 | 16.42 | 818 | 683 | 19.77 | |
| Side wall 5 | El-Centro motion | 11.70 | 10.57 | 10.69 | 1234 | 1132 | 9.01 |
| Lanzhou motion | 10.02 | 8.83 | 13.48 | 566 | 517 | 9.48 | |
| Side wall 6 | El-Centro motion | 3.76 | 3.16 | 18.99 | 126 | 109 | 15.60 |
| Lanzhou motion | 3.89 | 3.31 | 17.52 | 99 | 87 | 13.79 | |
Table 13.
Layer drift (mm) and drift angle (rad) under El-Centro motion.
| Section | M1 | M2 | M3 | M4 | M5 | |
|---|---|---|---|---|---|---|
| Floor 3 | layer drift in the X-direction | 1.76 | 2.25 | 2.42 | 3.06 | 2.97 |
| layer drift angle in the X-direction | 1/2898 | 1/2267 | 1/2107 | 1/1667 | 1/1717 | |
| layer drift in the Y-direction | 4.03 | 2.88 | 3.82 | 4.01 | 3.91 | |
| layer drift angle in the Y-direction | 1/1266 | 1/1770 | 1/1335 | 1/1271 | 1/1304 | |
| Floor 2 | layer drift in the X-direction | 1.65 | 2.10 | 2.23 | 2.69 | 1.81 |
| layer drift angle in the X-direction | 1/2909 | 1/2286 | 1/2152 | 1/1784 | 1/2652 | |
| layer drift in the Y-direction | 3.81 | 2.74 | 3.60 | 3.76 | 3.62 | |
| layer drift angle in the Y-direction | 1/1260 | 1/1752 | 1/1333 | 1/1277 | 1/1326 | |
| Floor 1 | layer drift in the X-direction | 1.79 | 2.25 | 2.36 | 5.93 | 2.83 |
| layer drift angle in the X-direction | 1/2682 | 1/2133 | 1/2034 | 1/809 | 1/1696 | |
| layer drift in the Y-direction | 3.83 | 2.74 | 3.59 | 3.76 | 3.73 | |
| layer drift angle in the Y-direction | 1/1253 | 1/1752 | 1/1337 | 1/1277 | 1/1287 | |
Table 14.
Shear forces of internal side wall 3 in different buried depths.
| Top of Floor 3 | Bottom of Floor 3 | Top of Floor 2 | Bottom of Floor 2 | Top of Floor 1 | Bottom of Floor 1 | ||
|---|---|---|---|---|---|---|---|
| M1 | Static ((105 N/m) | 3.53 | 4.20 | 5.59 | 8.20 | 11.18 | 16.88 |
| Dynamic (105 N/m) | 4.57 | 5.46 | 7.29 | 10.58 | 14.41 | 21.56 | |
| Amplification (%) | 29.51 | 30.02 | 30.43 | 28.94 | 28.85 | 27.71 | |
| M2 | Static (105 N/m) | 6.19 | 6.42 | 7.72 | 10.42 | 13.61 | 20.15 |
| Dynamic (105 N/m) | 7.74 | 8.12 | 9.77 | 13.18 | 17.16 | 25.41 | |
| Amplification (%) | 24.88 | 26.46 | 26.56 | 26.48 | 26.11 | 26.10 | |
| M3 | Static (105 N/m) | 8.74 | 9.03 | 9.94 | 12.70 | 16.06 | 23.43 |
| Dynamic (105 N/m) | 11.06 | 11.26 | 12.61 | 16.17 | 20.40 | 29.78 | |
| Amplification (%) | 26.62 | 24.68 | 26.86 | 27.36 | 26.98 | 27.09 | |
| M4 | Static (105 N/m) | 11.39 | 12.46 | 12.49 | 15.40 | 18.98 | 28.43 |
| Dynamic (105 N/m) | 14.24 | 15.00 | 15.74 | 19.68 | 24.29 | 35.85 | |
| Amplification (%) | 25.06 | 20.35 | 25.96 | 27.77 | 27.99 | 26.11 | |
| M5 | Static (105 N/m) | 13.54 | 14.96 | 14.53 | 17.41 | 21.09 | 30.13 |
| Dynamic (105 N/m) | 17.22 | 18.50 | 18.56 | 22.37 | 26.91 | 38.52 | |
| Amplification (%) | 27.18 | 23.69 | 27.70 | 28.46 | 27.61 | 27.85 |
© 2017 by the authors. Licensee MDPI, Basel, Switzerland. This article is an open access article distributed under the terms and conditions of the Creative Commons Attribution (CC BY) license (http://creativecommons.org/licenses/by/4.0/).
Share and Cite
MDPI and ACS Style
Wen, B.; Zhang, L.; Niu, D.; Zhang, M. Soil–Structure–Equipment Interaction and Influence Factors in an Underground Electrical Substation under Seismic Loads. Appl. Sci. 2017, 7, 1044. https://doi.org/10.3390/app7101044
AMA Style
Wen B, Zhang L, Niu D, Zhang M. Soil–Structure–Equipment Interaction and Influence Factors in an Underground Electrical Substation under Seismic Loads. Applied Sciences. 2017; 7(10):1044. https://doi.org/10.3390/app7101044
Chicago/Turabian StyleWen, Bo, Lu Zhang, Ditao Niu, and Muhua Zhang. 2017. "Soil–Structure–Equipment Interaction and Influence Factors in an Underground Electrical Substation under Seismic Loads" Applied Sciences 7, no. 10: 1044. https://doi.org/10.3390/app7101044
Note that from the first issue of 2016, this journal uses article numbers instead of page numbers. See further details here.