1. Introduction
Due to advances in wireless communication technologies, traditional wired data transmissions have been gradually replaced by wireless transmissions. The technologies have been extensively applied to all categories of mobile devices, such as smartphones, tablets, and wearable devices, to better facilitate people’s daily lives [
1]. In recent years, vehicles on the move can also enjoy the convenience of wireless communication technologies by assisting each other in message exchange and form an interconnecting network, namely Vehicular Ad Hoc Networks (VANETs) [
2]. In a VANET, each vehicle is capable of communicating with nearby vehicles and accessing information provided by the network. With the appropriate application systems, drivers can receive warning messages when approaching an accident site to ensure driving safety. Moreover, real-time traffic information can also be used to avoid traffic jams. Many other applications of VANETs have been developed [
3]. In addition, VANETs have been regarded as one of the major technologies to support most future Intelligent Transportation System (ITS) [
4].
Communications in VANETs can be classified into two categories [
5,
6]: Vehicle-to-Infrastructure (V2I) and Vehicle-to-Vehicle (V2V) (
Figure 1). In V2I communication, vehicles make connections with infrastructures located at roadsides, namely roadside units (RSUs), to connect to the Internet. The fixed infrastructures act as gateways in data transmission. To provide a large service range, low transmission latency, and high throughput, cellular network (CN) technologies, such as LTE and WAVE, are usually adopted in V2I. Infrastructure deployment costs are the main drawback of V2I. On the other hand, V2V allows vehicles to form a self-organized network without any centralized system and fixed infrastructures. Due to the relative maturity of CN and the lower deployment cost of V2V, this has become a major trend of researching VANETs. Although V2V communications in VANETs are sometimes considered as a subclass of the Mobile Ad Hoc Networks (MANETs), there are many differences between those two network paradigms. First, mobile nodes in VANETs (vehicles) usually move at a higher speed, which results in a highly dynamic topology. Second, the nodes in VANETs are moving on pre-defined roads, rather than the random mobility assumption in MANETs. Besides, VANET nodes are usually assumed to have less limitation on battery and computing power. Those differences cause different network behaviors and characteristics, which make the solutions designed for MANETs not directly applicable to VANETs, e.g., routing protocols.
Routing is a fundamental network function in both MANETs and VANETs. Its object is to relay packets from a source node to a destination node in a multi-hop manner. The early MANETs studies [
7,
8] focused on the topology-based routing protocols which either proactively or relatively updated information used in routing decisions. When applying the topology-based protocols in VANETs, it has been shown as a high overhead and a low throughput due to the rapid topology change [
9]. Numerous studies [
10,
11,
12,
13] have proposed geographic routing protocols, known as position-based routing protocols, for VANETs routing. Each vehicle is assumed to be equipped with a positioning device, i.e., GPS (Global Positioning System), to obtain its own geographical location. Periodical beacon messages are broadcasted in a neighborhood to announce vehicles’ identities, locations, speeds, and relevant driving information. Rather than finding an entire delivery path, geographic routing selects the most appropriate next-hop relay node, e.g., the neighbor closest to the destination, and forwards the packets to it.
Many geographic routing protocols [
11,
12,
14] in an urban environment utilize traffic information, i.e., the real-time vehicular densities of roads, and those with higher traffic flow are preferred so as to avoid disconnectivity along the forwarding path as well as high carry delay. Recently, several creative real-time traffic collection systems based on vehicles have been proposed. In studies [
15,
16], accelerometers in mobile phones of drivers were utilized for motion detection and traffic sensing. In [
17], a larger-scale information collection system aimed to reduce the collection, fusion, and dissemination time was proposed. However, most of the existing routing protocols do not describe how to gather real-time traffic. They assume this information is either already available or can be obtained by querying an existing traffic center. Query delay and the infrastructure construction cost are ignored in those works, but some [
18,
19] do notice this issue. An Infrastructure-Free Traffic Information System (IFTIS) is proposed in [
18]. In an IFTIS, a road segment is divided into fixed-size cells, and the group leader of each cell is responsible to calculate the number of vehicles in the cell. The total number of road vehicles is then accumulated by the group leader of the last cell on the road. In [
19], a probe message is used to estimate the connectivity of vehicles nearby road segments. A probe message is initiated by a node near an intersection and forwarded in the road segment. If the probe can reach the next intersection, a return message is sent to the original sender, which indicates that this road is traversable. Otherwise, the probe is dropped and the road is disconnected. This information is then used in route selection, which has been shown to improve the network throughput and delivery ratio. However, the aforementioned can accrue an extra message exchange cost and delay. Furthermore, only the traffic density in a small region can be cognizant. A wide-ranging and up-to-date traffic information is still omitted, which may lead to a wrong routing decision.
In this paper, we propose a Comprehensive Real-Time Traffic Map, namely a CRT Map, to collect the wide-ranging real-time traffic information, based on which we then design a geographic routing protocol, called the CRT Map Based Routing (CBR). In the design of a CRT Map, the concept of Crowdsensing [
20] is adopted. Vehicles share local views of traffic on individual roads and assist each other in constructing an overview of the whole road network. When driving on each road, a vehicle calculates how many cars it meets and then constructs a local traffic map. Then, local maps of different vehicles are exchanged at intersections and merge into their own maps. Consequently, each vehicle gradually has a much larger view of the entire network. In addition, to prevent out-of-date information, we take the effect of time decay into account when merging traffic maps. A CRT Map is then used in the proposed CBR. It extracts traffic information from a CRT Map and considers the connectivity of consecutive roads to select a reliable path in the routing decision. Compared with existing researches, the proposed solution has no extra delay, since a local CRT Map is maintained. Beacons are utilized in vehicle calculations, and, thus, map exchanges are the only extra cost. Exchange frequency is controllable in our design, which reflects a trade-off between accuracy and overhead. Simulation results show that a CBR can lower the end-to-end delay and increase the packet delivery ratio with a low overhead.
The rest of this paper is organized as follows. In
Section 2, the geographic routing protocols in VANETs are surveyed.
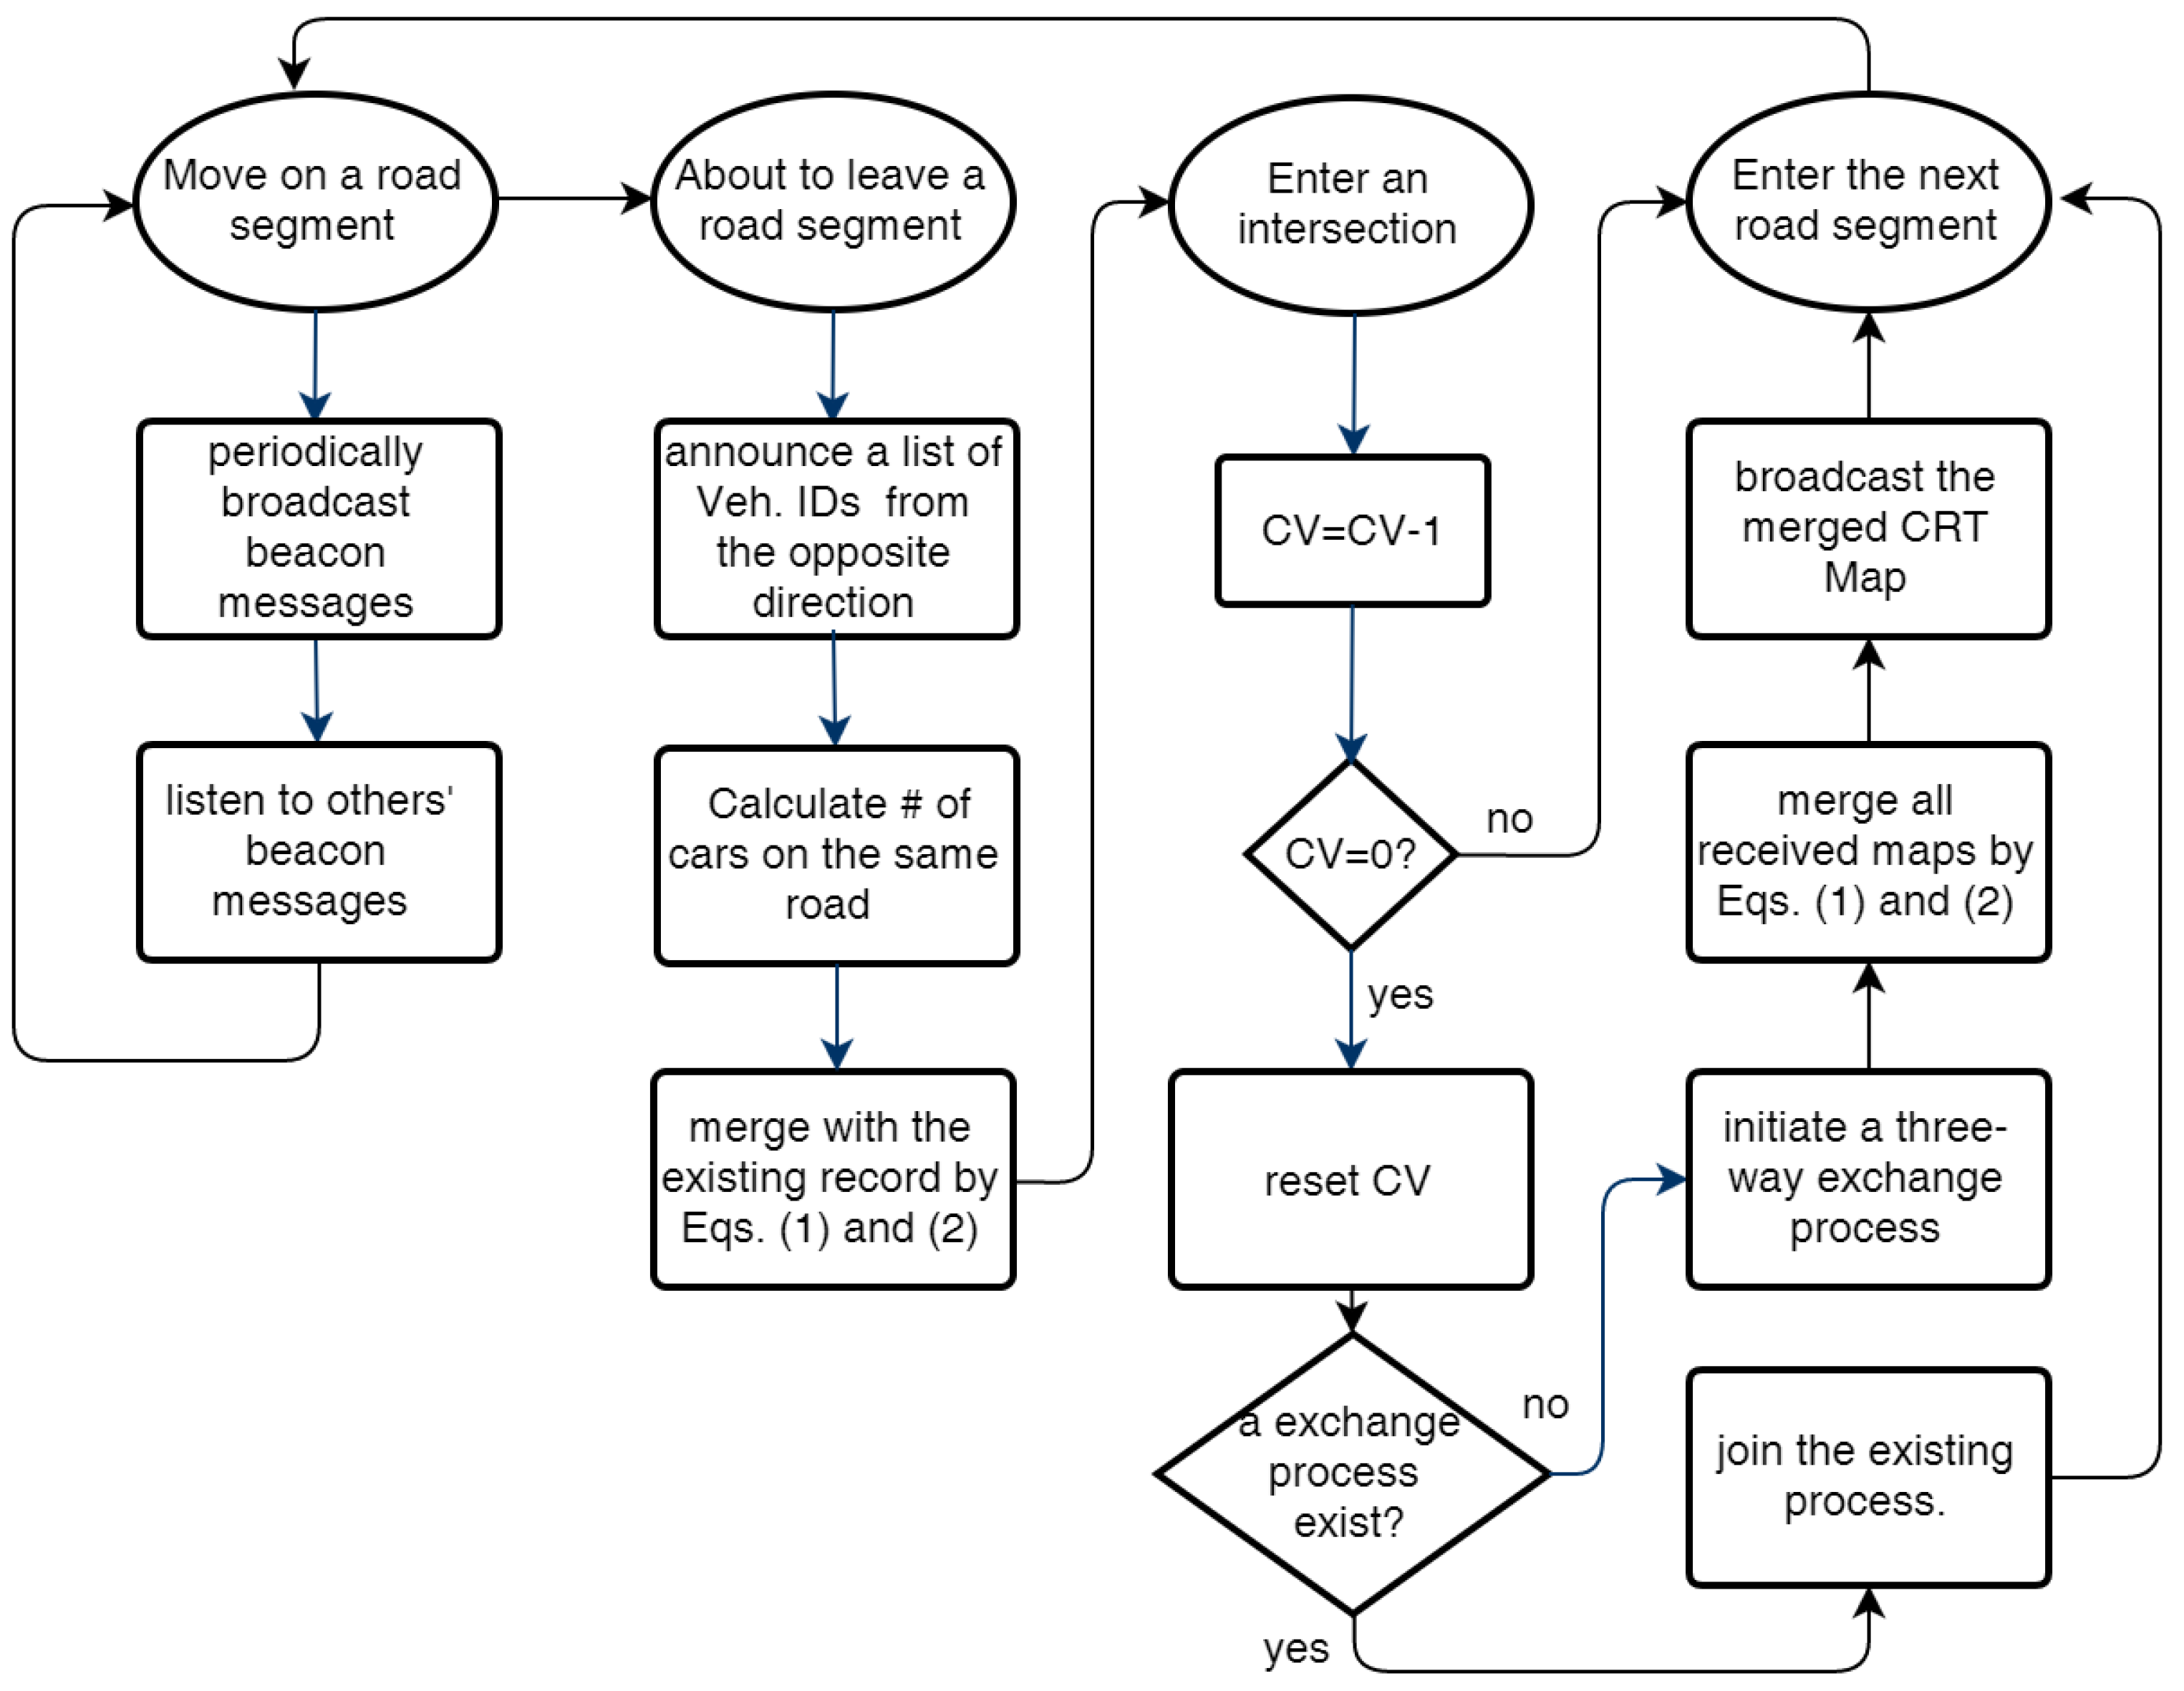
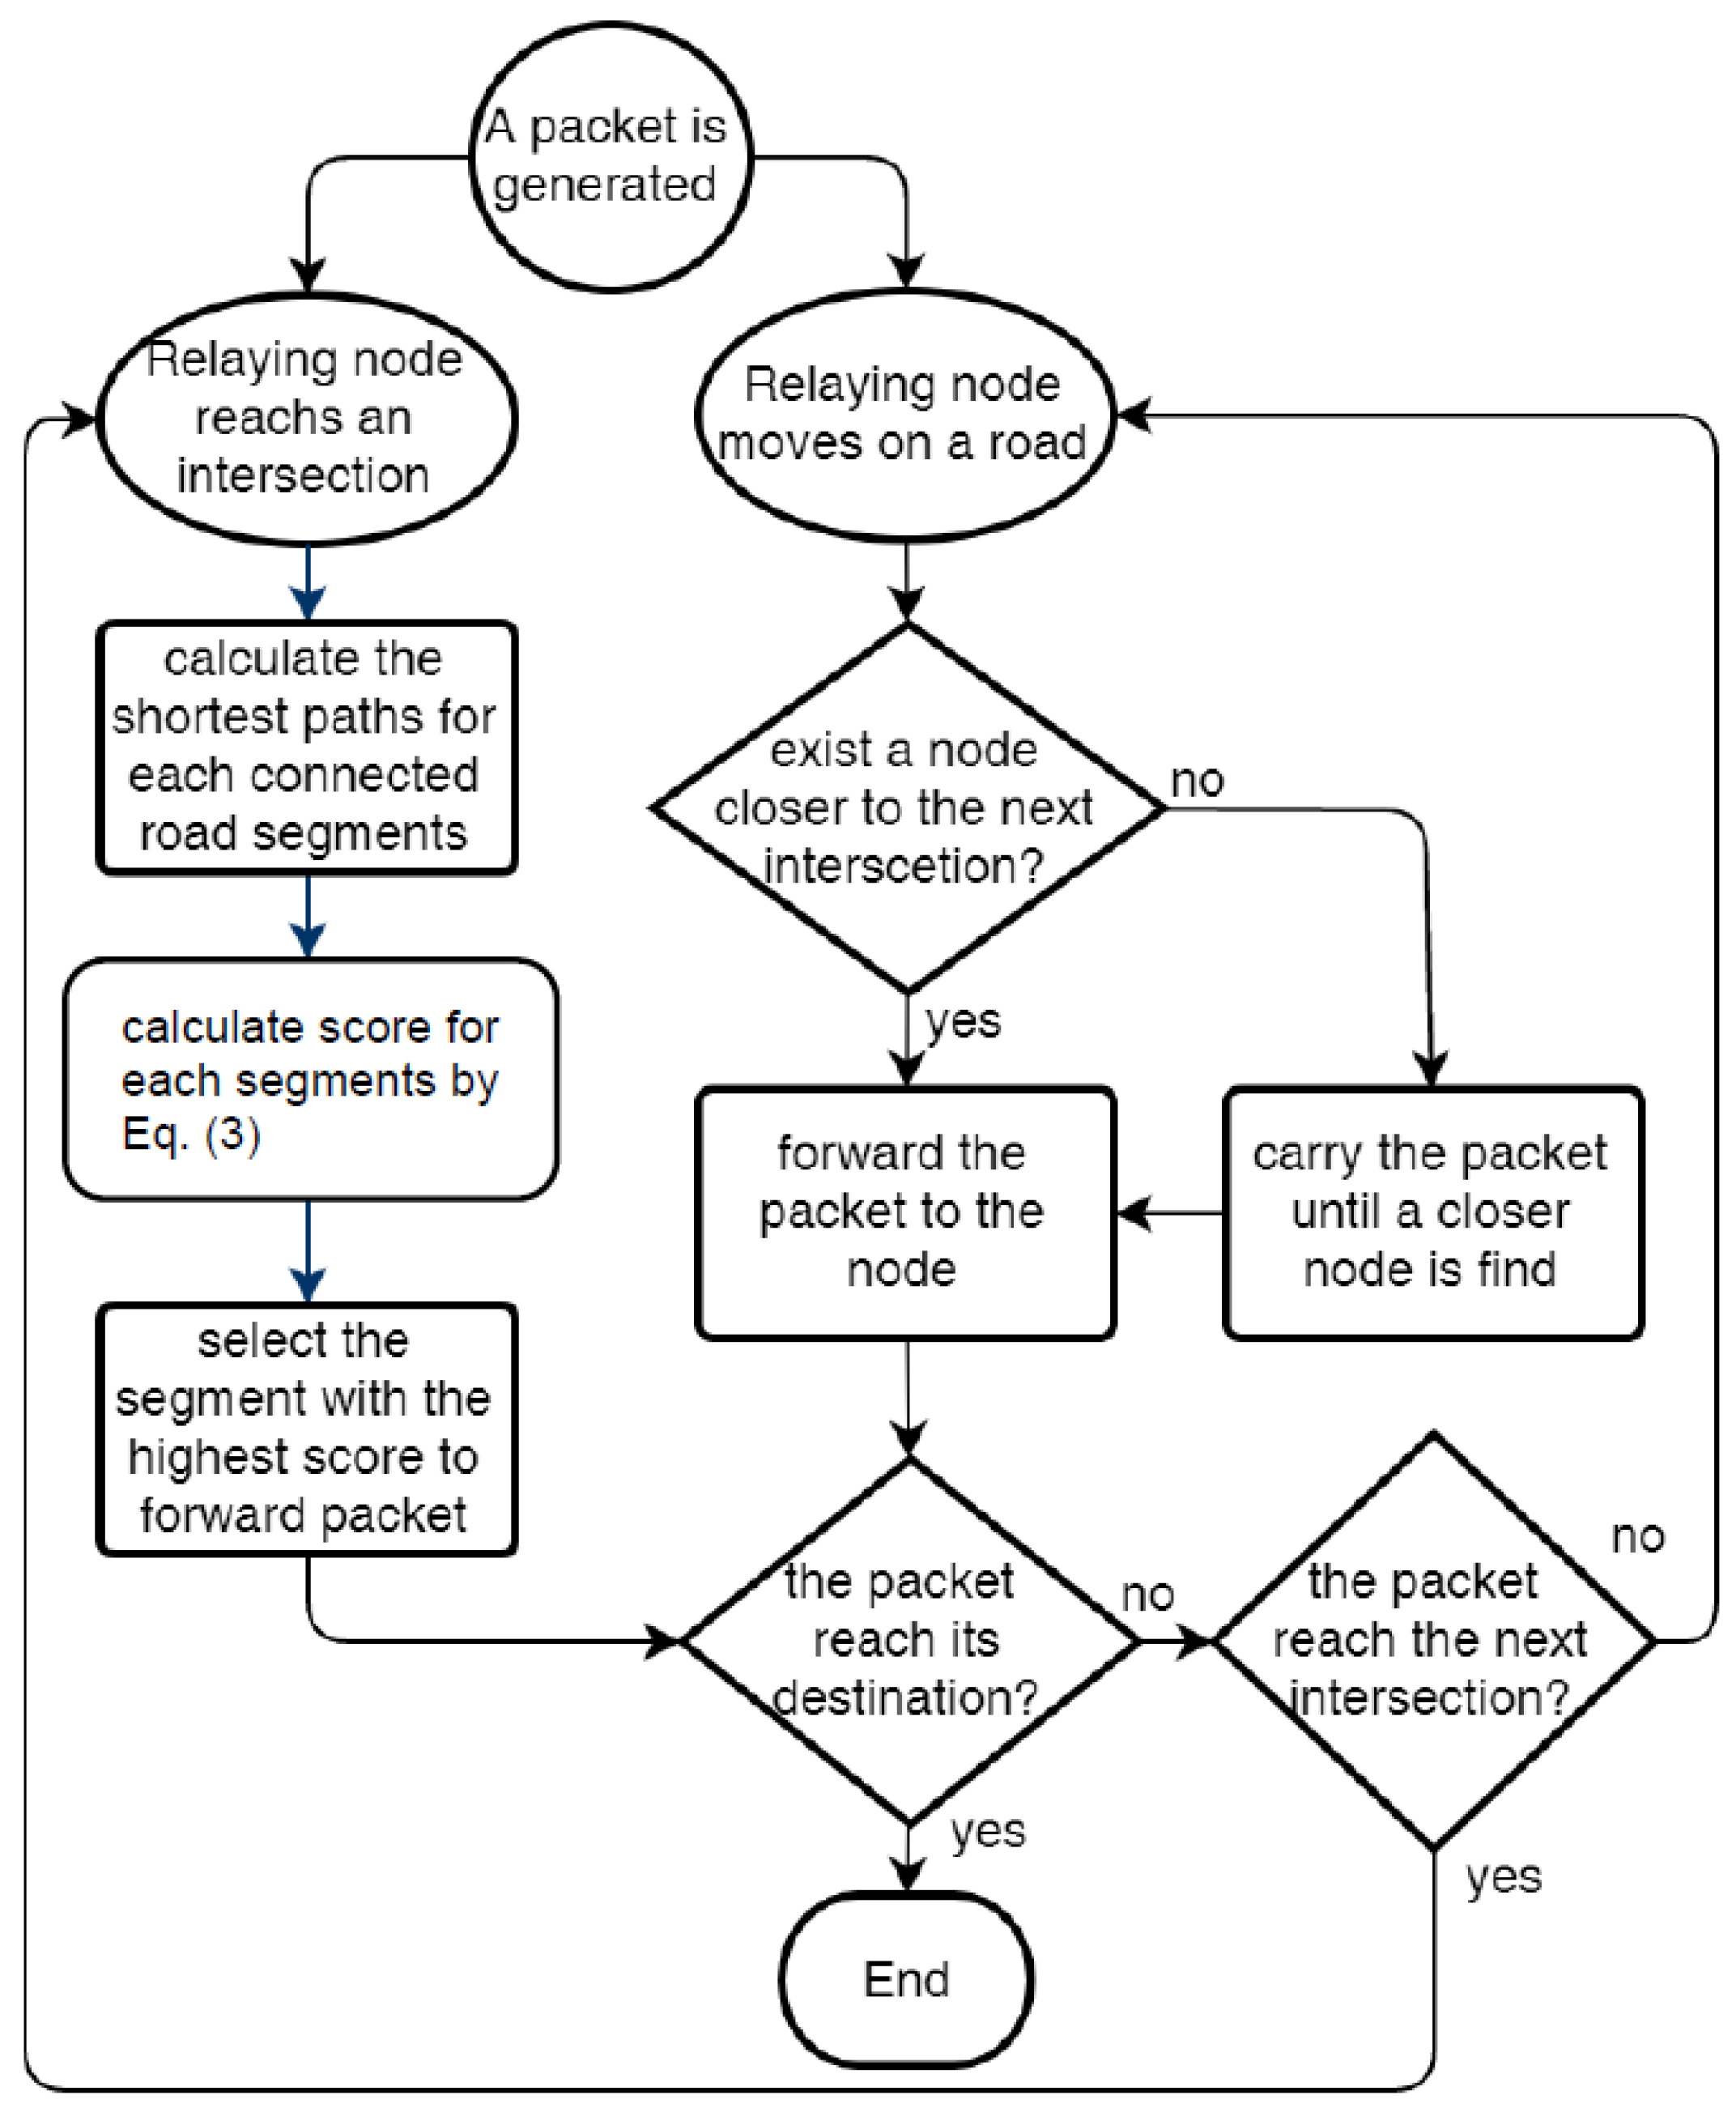
Section 3 describes the system model, including the environment, assumptions, and the basic framework of the CRT Map. The information exchange mechanism of the CRT Map and the detail design of a CBR are presented in
Section 4. In
Section 5, we demonstrate the efficiency of the proposed schemes through simulation studies.
Section 6 discusses future works and concludes this paper.
2. Related Work
Vehicular ad hoc networks have a typical problem of intermittent connectivity due to the rapidly changing topology. Many studies have proposed different solutions to deal with this problem. In this section, we survey several significant geographic routing protocols in VANETs and then discuss their pros and cons, as listed in
Table 1.
In [
10], the Greedy Perimeter Stateless Routing (GPSR) proposes an early concept of geographic routing based on the positions of the mobile nodes. Each node obtains its geographic position from a GPS receiver, and is aware of its neighbors’ positions through periodical beacon messages. The GPSR are divided into two phases: greedy forwarding and perimeter forwarding. In greedy forwarding, an intermediate node selects the neighbor closest to the destination as a next-hop relay node and forwards the data packets to it. This process is repeated until the destination is reached. If there is no closer neighbor than itself, greedy forwarding fails, which is defined as a local maximum problem. Then, perimeter forwarding is triggered as a recovery strategy. The right hand rule is used to find a relay node. Greedy forwarding takes place again if a closer node to the destination is found. The GPSR suffers from a long delivery path in perimeter forwarding and thus encounters a high end-to-end delay. Greedy Perimeter Coordinator Routing (GPCR) [
11] adopts the same idea of geographic forwarding and proposes to always forward data packets at junctions. A static road map is used by the GPCR to support the idea and offer data packets a better chance to reach their destination faster. A carry and forward strategy is adopted as the recovery strategy. Once a vehicle cannot find a better relay vehicle, it will carry the data pack until it encounters a better one. However, carry delay is much longer than transmission delay. Road (and/or junction) selections in routing decisions thereby become a critical issue.
The improved Greedy Traffic Aware Routing protocol (GyTAR) [
21] is an intersection-based geographic routing protocol, which works well in a city environment. It proposed a dynamic junction selection mechanism to support greedy forwarding and to select a more reliable route. GyTAR utilizes IFTIS [
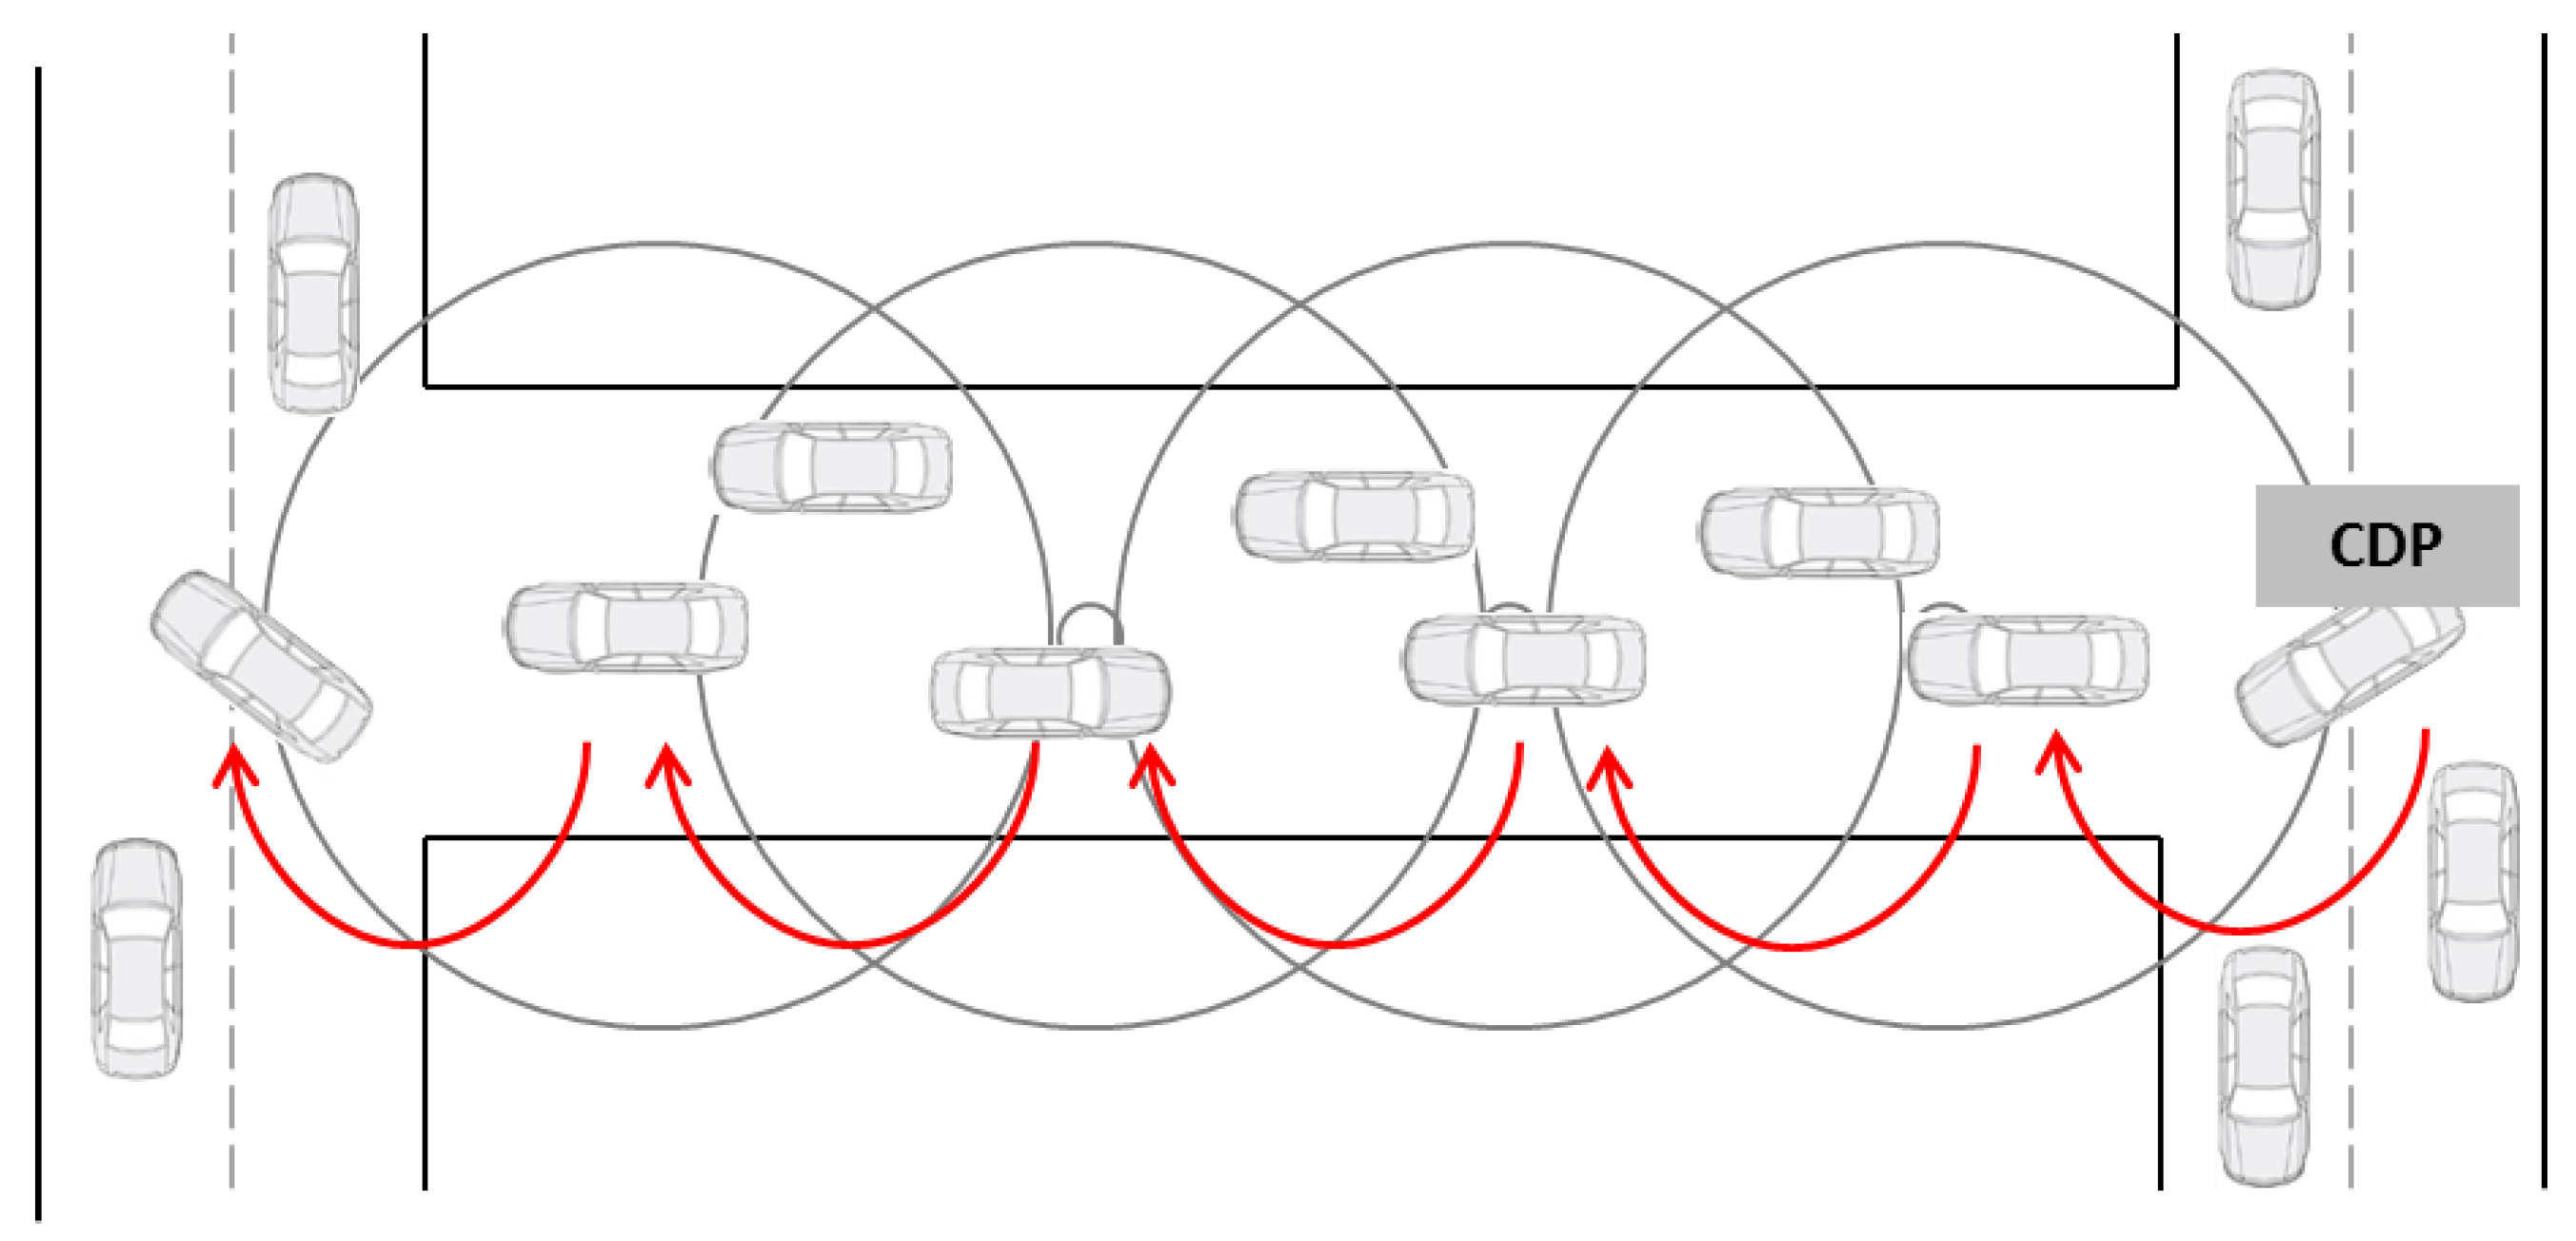
18] to estimate the traffic density between two junctions. Vehicles at an intersection forward broadcast a Cell Density Packet (CDP) to collect real-time vehicular density, as shown in
Figure 2. In IFTIS, a road segment is divided into fixed-size cells based on the vehicle’s communication range. A cell leader is responsible to calculate the number of vehicles in the cell. A CDP is forwarded to each cell leader to collect the traffic density of the cells. Based on this information, GyTAR can decide which junction has the higher traffic density and the shorter distance to the destination. In GyTAR, the direction of the traffic flow is omitted in the next junction selection.
Improved Greedy Traffic Aware Routing (E-GyTAR) [
22], Traffic Flow-Oriented Routing (TFOR) [
23], Intersection-based Connectivity Aware Routing (iCAR) [
24], Adaptive Routing Protocol based on QoS and vehicular Density (ARP-QD) [
25], and Adaptive QoS based Routing for VANETs (AQRV) [
26] are based on the same idea of dynamic junction selection as GyTAR. E-GyTAR and TFOR further consider the flow directions of the roads. Selecting a junction with a high density, but in the opposite direction to the destination, might still incur a high delay. In E-GyTAR, data packets are forwarded on the road with a high traffic flow towards the destination. Alternatively, TFOR considers both the directional and the undirectional flow of traffic density. If traffic flow is in the opposite direction but the density is high enough, the junction can still be selected as a candidate. In iCAR, roads with the highest vehicular density are not necessarily be selected as forwarding paths, in order to avoid a high transmission delay due to a high data volume. The next-junction selection is based on the real-time traffic density, the delay information, and the estimated connectivity lifetime of roads. A distributed scheme, namely Road Segment Evaluation (RSE), is proposed to evaluate the suitability of road segments. On the other side, ARP-QD considers QoS requirements of different applications. It balances the path efficiency and path stability by selecting a forwarding path based on hop count and link duration. In AQRV, QoS constraints, in terms of connectivity probability, packet delivery ratio, and delay, should be satisfied in the intersection selections. This problem is modeled as a multi-objective optimization problem and solved by ant colony optimization. When selecting the next intersection, possible intersections are explored by forward ants, and then the routing decision is made based on the corresponding backward ants. However, the above approaches only consider the next junction. If the following road segments do not have sufficient vehicular density to support data forwarding, high latency still cannot be avoided.
Reliable Inter-Vehicular Routing (RIVER) [
19] is a geographic routing protocol with a monitoring mechanism to evaluate the reliability of roads. The main monitoring mechanism proposed in this paper includes two parts: active monitoring and passive monitoring. In active traffic monitoring, a probe message is sent along a specific road segment by a vehicle near the edge of the road. If the probe message can reach another edge, a responsive message will return to the source vehicle, which indicates this road has sufficient traffic density. This knowledge is then used in route selection. Another passive traffic monitoring is proposed for knowledge sharing to reduce the overhead. Piggybacks on routing messages, probes, and beacons are suggested. Although vehicles could obtain the wide-ranging knowledge of roads with passive monitoring, knowledge of some roads may still be omitted or outdated.
Hybrid Traffic-Aware Routing (HTAR) [
27] proposed a collaboratively real-time traffic information collection and dissemination mechanism. In HTAR, a vehicle at each junction, called a junc-tracker, is selected. A junc-tracker is responsible to periodically collect traffic information of surrounding road segments, calculate their weights based on traffic information, and disseminate the weights to adjacent junc-trackers and vehicles. Road weights are then used in the junction selection. Junction-based Traffic-Aware Routing (JTAR) [
28] is based on HTAR and improves the routing path reactively. In HTAR, a complete delivery path is planned. Contrarily, in JTAR, the junc-tracker dynamically recalculates weights at junctions based on the last updated information and packets can then be detoured in the middle of a delivery. However, HTAR and JTAR share the same drawback. Disseminations of traffic information between junc-trackers may cause a large amount of message exchanges.
Below, we discuss issues of existing geographic routing protocols in VANETs, as packets need to be forwarded on a reliable and robust path. Routing protocols prefer to choose a road with a high traffic density. If a packet is transmitted on a road with a sparse density, it is possible not to encounter any appropriate neighbor to forward the packet. The packet will be carried by a vehicle, which results in a serious carry delay. As a result, most existing studies propose to take into account both the traffic density and the distance to the destination in the next junction/road selection. However, most protocols only consider the next road segment. Conditions of the consequent roads are ignored. A road with a high density is not always connected to the destination or other high traffic roads. Examples are shown in
Figure 3. In
Figure 3a, a packet may be moving away from the receiver, because the routing protocol chooses the road with the highest traffic density but does not consider if the selected road is connected to the destination or not. This situation is similar to the local maximum problem, but at the junction level. Another situation in
Figure 3b shows a road with the highest traffic density does not always connect to another road with a high density. As a result, the second best choice, the down direction, is in fact the best choice. On the contrary, in some works, such as HTAR, a complete delivery path is planned. However, the planned path cannot adapt to the highly dynamic traffic, especially in a long delivery path. Therefore, the proposed solution is still based on a dynamic junction selection. When selecting the next road segment, we consider not only the road, but also its following roads.
3. System Model
3.1. Environment and Assumption
In this section, we describe the environment and assumptions made in this work. There are
n vehicles in the network and each one has a unique Veh. ID, i.e., a vehicle set
. Moreover, there are
x road segments in the network and each one has a unique Road ID, i.e., a road set
. Load length and the number of lanes of a road
are denoted as
and
, respectively. We make the following assumptions in this paper. Firstly, there are no roadside units (RSUs) in the network. Hence, V2V communications are the only data dissemination mechanism. Secondly, a multifunctional on-board unit (OBU) with IEEE 802.11p functionality is equipped by each vehicle. The OBU also has a GPS receiver and a digital map which allows a vehicle to be continually aware of its own geographic position and surrounding street organization. Thirdly, a source vehicle that initiates a data packet is assumed to be aware of the destination vehicle’s position. The location management issue is out of the scope of this paper and can be supported by Location Services [
29]. Finally, periodical beacon messages broadcasted by vehicles comprise of their current driving information, including Veh. ID, position, direction, and Road ID.
3.2. CRT Map Framework
In this section, we describe the basic format and operations of the proposed CRT Map. Each vehicle maintains a local map, denoted as . Hence there are n maps, , in the network, each of which represents a different view of the traffic information of each vehicle. Since there are x road segments, each comprises x records, denoted as , , which is a real-time traffic record of each road segment . Each record has two fields, i.e., , where is the timestamp of when this record is made or updated, and is the traffic density of , i.e., . When vehicles are moving on roads, they overhear other vehicles’ beacons and calculate how many cars on each road. Together with the load length and lane number, extracted from the digital map, traffic density of each road can be derived.
Next, we describe how to merge two traffic density records. Initially, historical traffic statistics are loaded as the default traffic density of roads. Thus, the initial traffic information is different to the real-time traffic density. There are two possible timings for a record
to be updated. One is when
receives another vehicle’s map in which contains a record with regard to
, and the other is when vehicle
actually drives through road
. Here we describe the details of the first case. The latter case can be similarly completed. Since traffic is continuously changing over time, we should take the time decay effect into account. The value of a record should be inversely proportional to its grade of freshness, i.e., the elapsed time since the last update. Let
denote the present time and then define
as a freshness of
. The weight of
,
is defined as
where
is a threshold used to set a basic weight value. The purpose is to prevent any record from being omitted and make each record count. When merging
and
for the same road
, different weights are set according to their freshness. Then, the new traffic density, denoted as
, can be derived by
Then, and are updated to . In the case where actually drives through , we can simply treat the new observation of traffic density of as . To merge multiple records in the meantime is straightforward. The denominator in Equation (2) becomes the summation of all weights, and the numerator is the summation of all densities after weighting. Finally, we define each record as a reliability which will be used in the routing decision. Here we also take the time decay effect into consideration. A record that has not been updated for a long time has less reliability. The reliability of is defined as .
5. Simulation
In this section, performance of the proposed schemes, CRT Map and CBR, is evaluated through simulation studies. We first compare the proposed CBR with two existing routing protocols, GyTAR [
18] and RIVER [
16]. End-to-end delay, packet delivery ratio, routing overhead, and average hop count are evaluated. In end-to-end delay and average hop count, only successfully delivered packets are calculated. In addition, if a packet is carried by a vehicle, the hop count is not increased until the packet is forwarded. In packet delivery ratio, a Time To Live (TTL) is set for each packet. If a packet cannot be delivered to its destination in time, it is dropped. In routing overhead, all necessary control packets, including beacon, traffic collection messages, and information exchange messages, are taken into account. Then, we study the performance of the proposed CRT Map under different parameter settings. We measure the average deviation of the number of vehicles per road segment between the real world and the CRT Map.
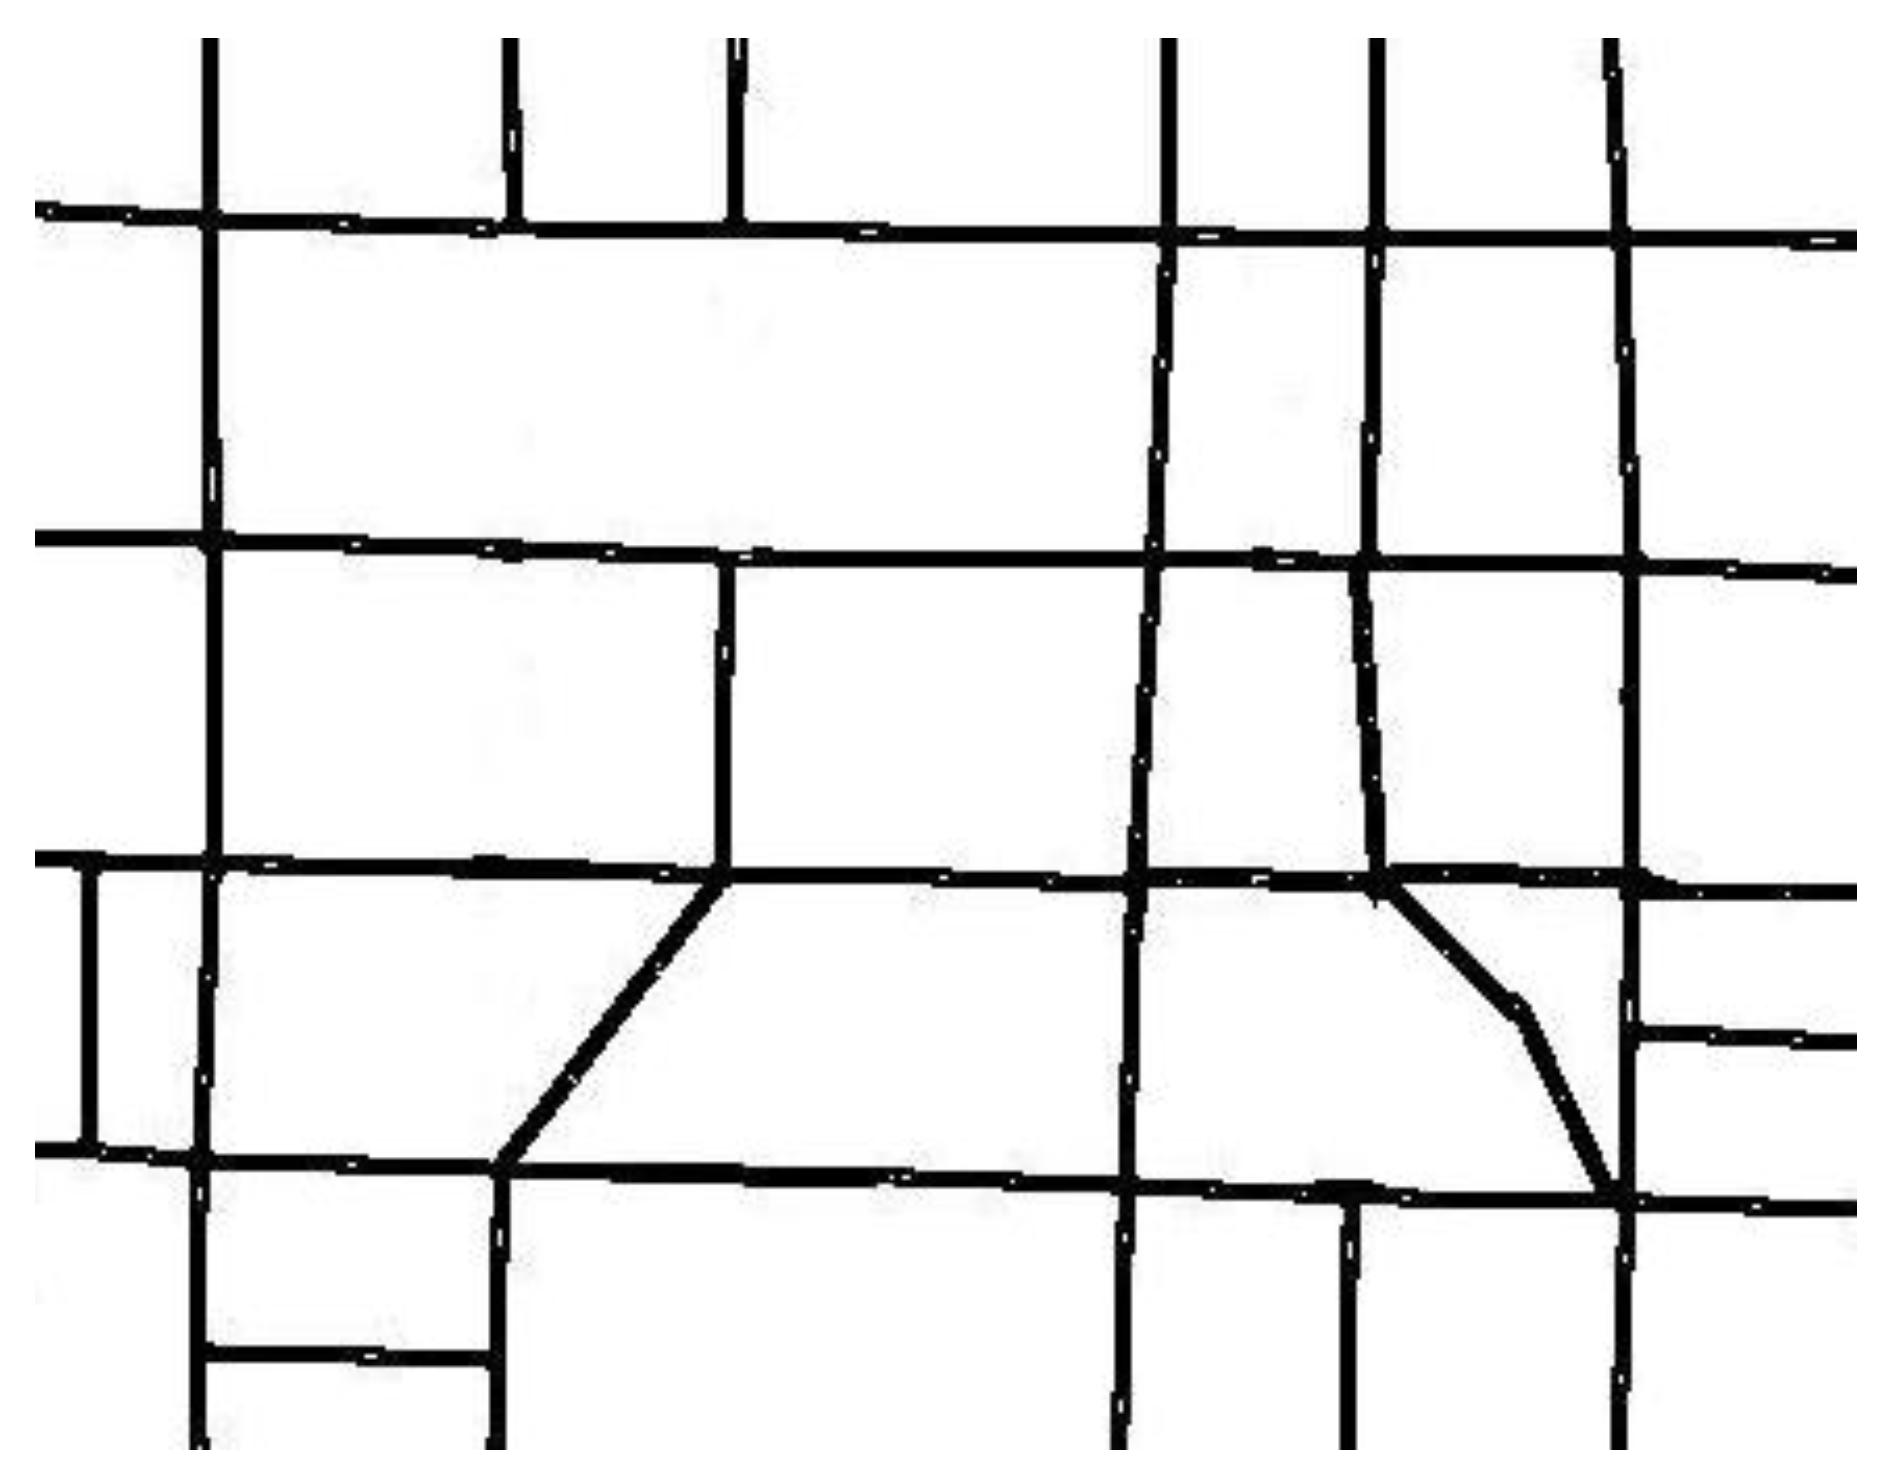
A real road map of 3000 m × 3000 m urban scenario, extracted from Taichung City, Taiwan, is adopted in the simulation, as shown in
Figure 6. There are 100 to 300 vehicles randomly deployed in the network. SUMO [
30] is used to generate mobility model of vehicles. The average moving speed is between 30 and 80 km/h. The transmission range of each vehicle is 250 m with a channel capacity of 2 Mbps. The data packet size is 512 bytes with randomly chosen sources and destinations. Each simulation is run for 150 s and each result is an average of 100 simulations. Furthermore, the confidence intervals with a 95% confidence level are included. The counter CV used to control the exchange frequency of the CRT Map is first set as 1 to evaluate the routing performance, and then varied between 1 and 5 to study its effects.
5.1. CBR Performance
5.1.1. End-to-End Delay
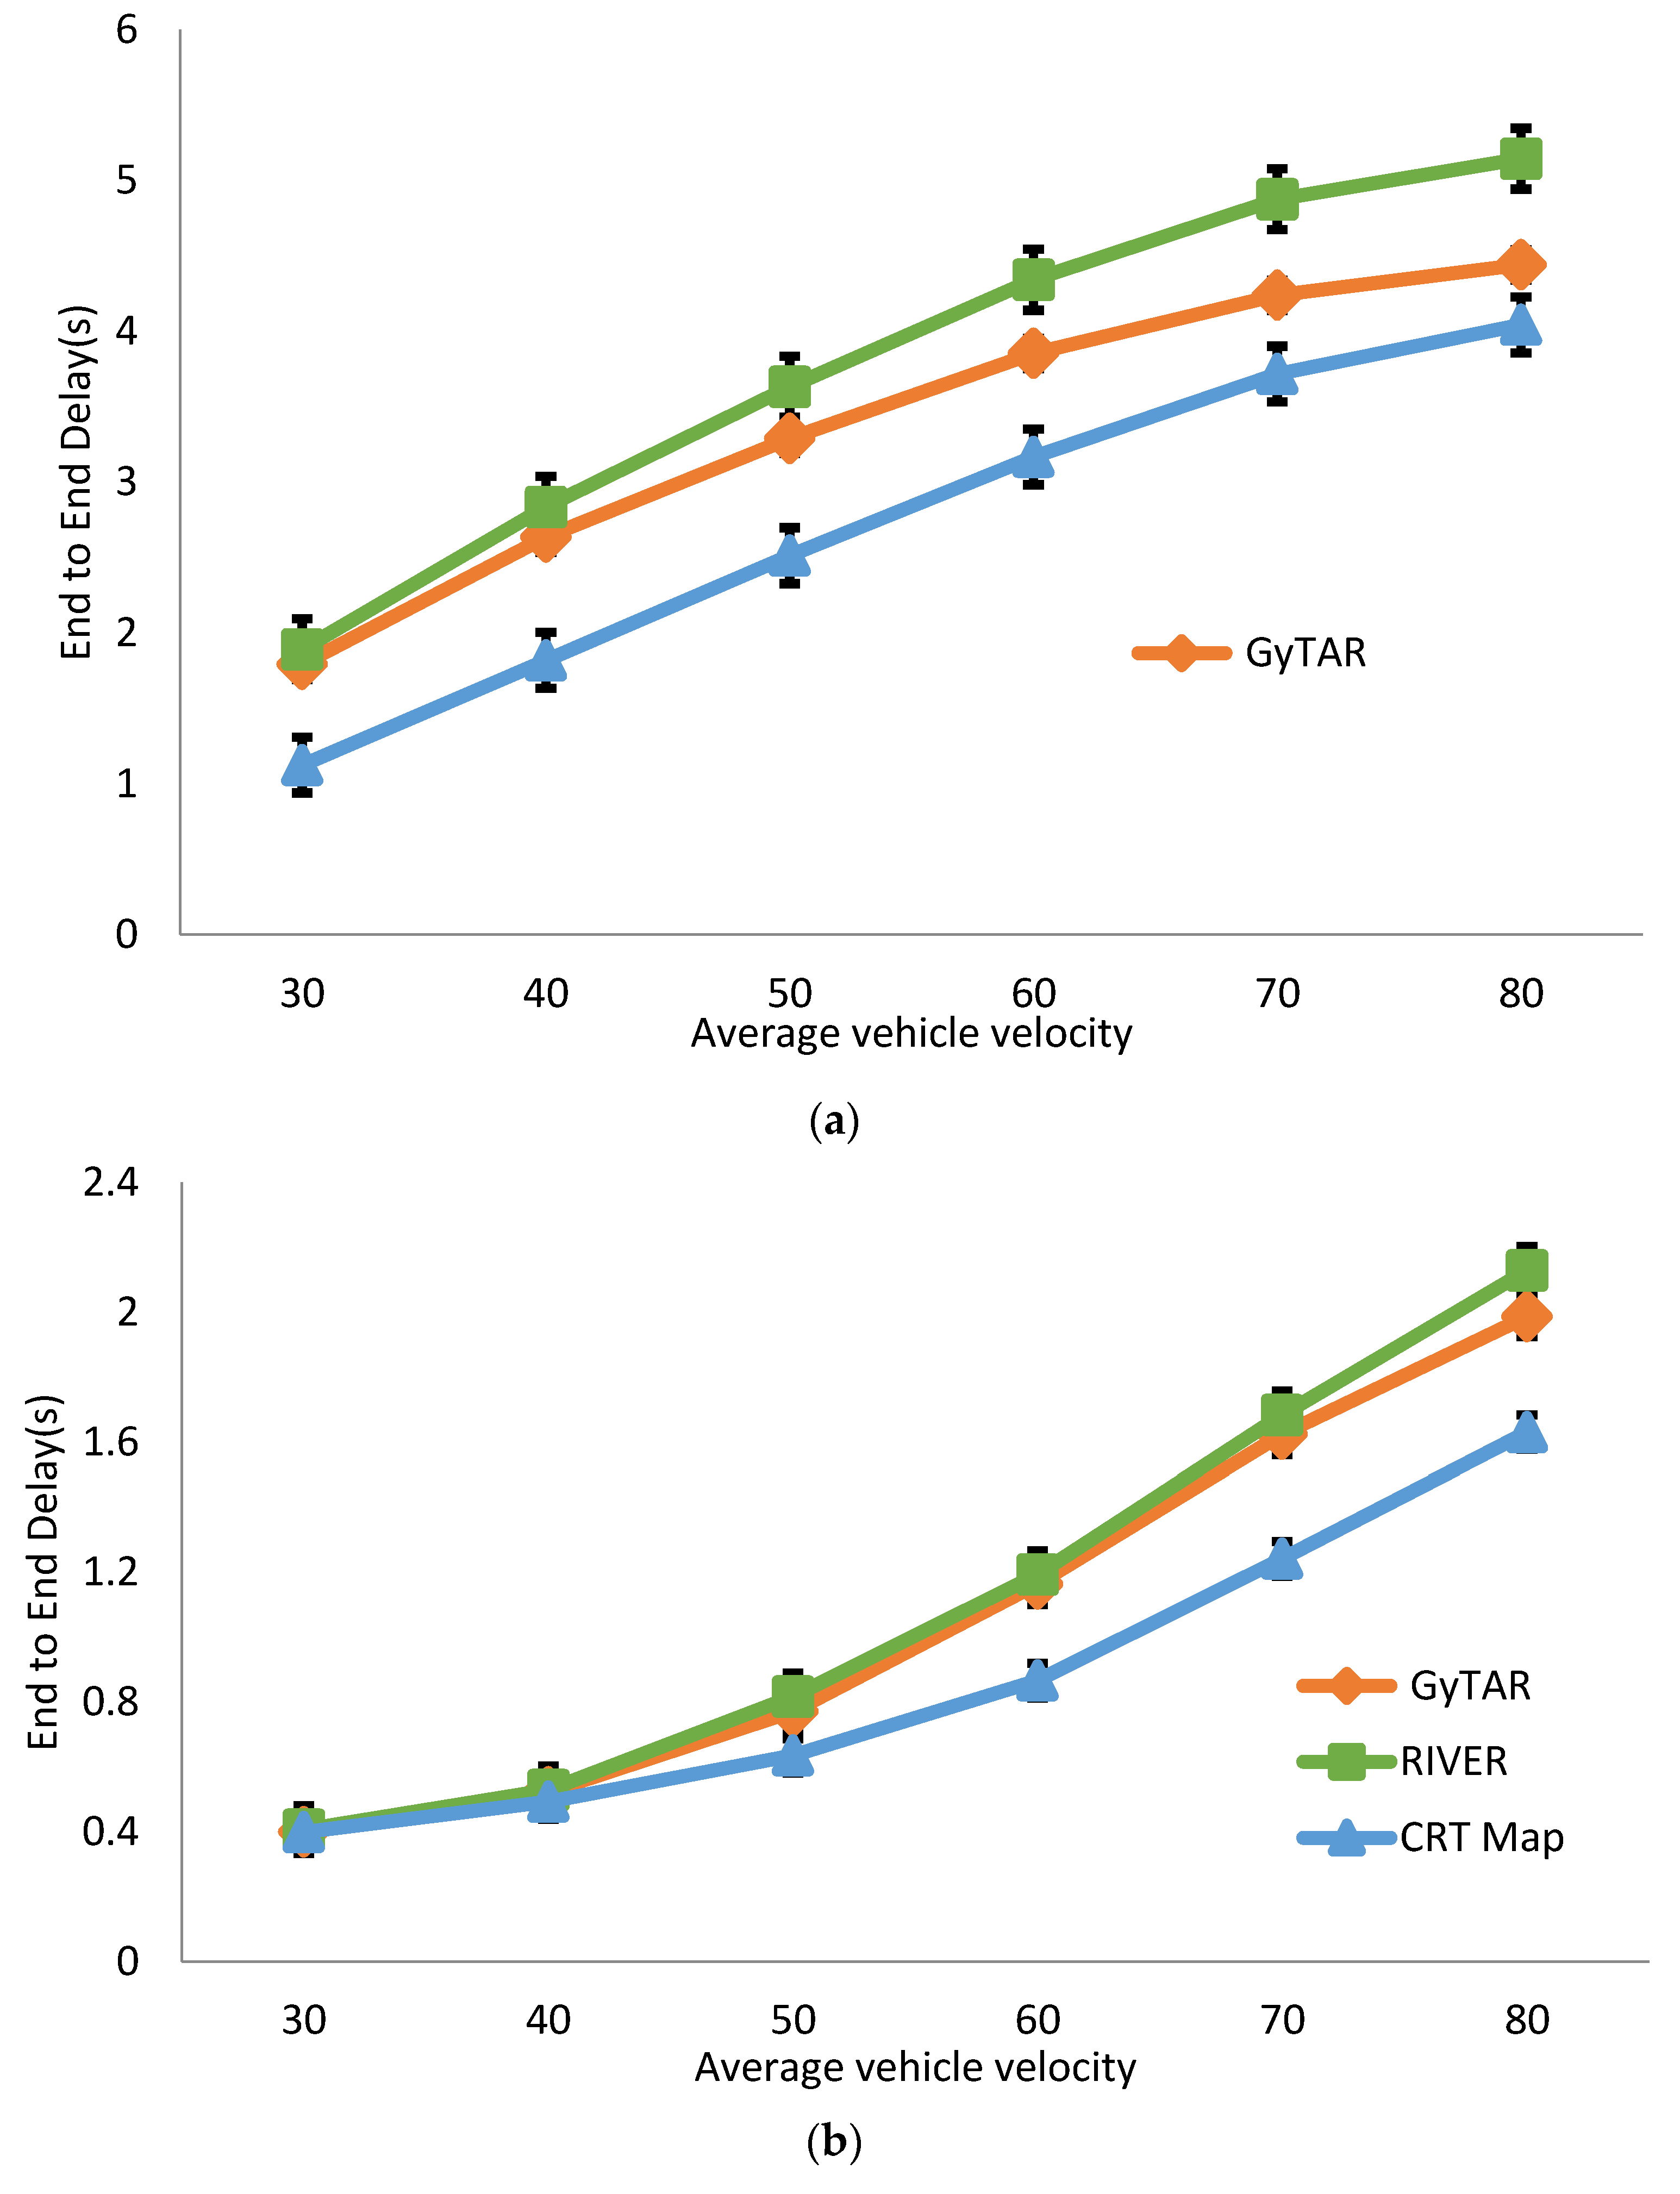
We first study the end-to-end delay at different moving speeds.
Figure 7a shows the results of a low vehicular density environment with 100 vehicles, and
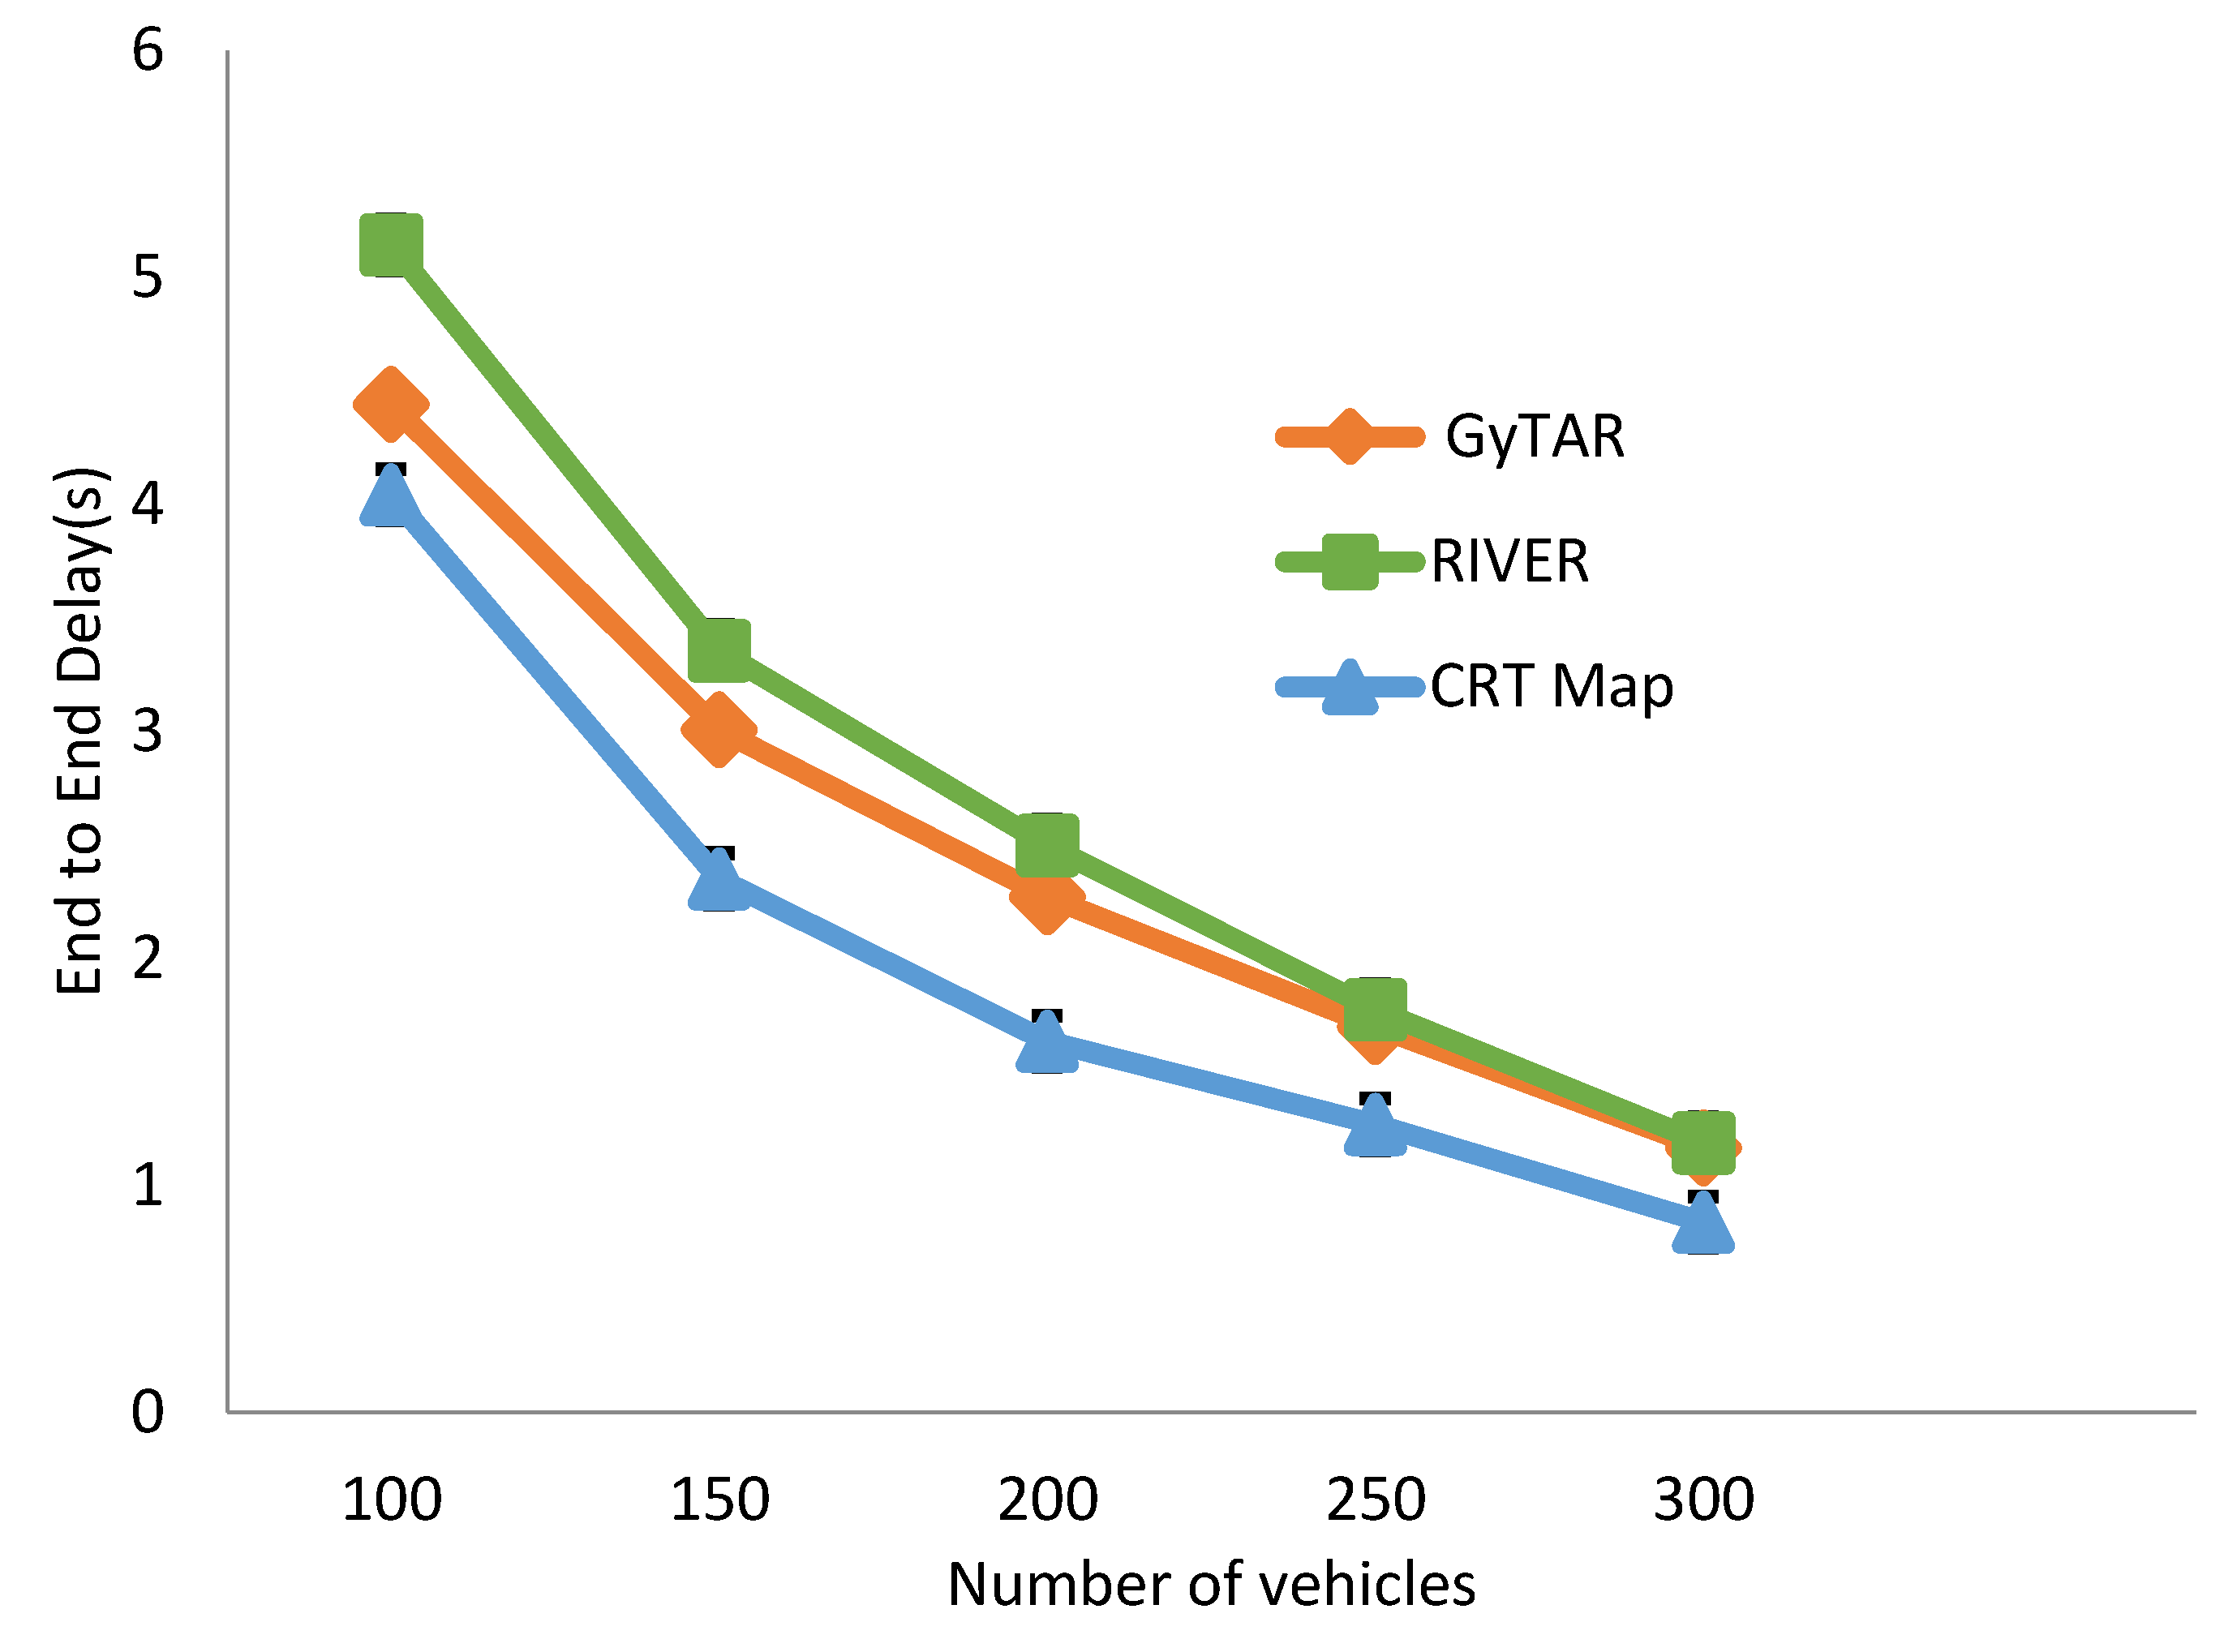
Figure 7b shows a high density environment with 300 vehicles. As the moving speed increases, the network becomes more dynamic and thus the end-to-end delay is increased. It can be seen that the proposed CRB has a lower delay than other protocols at all relevant speeds. In a low density environment, road segments are likely to be disconnected. The CBR considers consecutive road segments instead of only the subsequent one. With the CRT Map, vehicles have wider-ranging traffic information to choose the more reliable delivery paths. In a high density environment, the network is more connected. GyTAR and RIVER have almost the same delay but the CBR can still outperform them. Similar results can be found in
Figure 8, where we evaluate end-to-end delay with different vehicular densities at an average moving speed of 80 km/h. A high speed is chosen to create a high dynamic environment, which can highlight reliability of different routing schemes. Higher vehicular density can lower the delay since packets have less probabilities of being carried than forwarded. The proposed CBR can outperform in all cases.
5.1.2. Packet Delivery Ratio
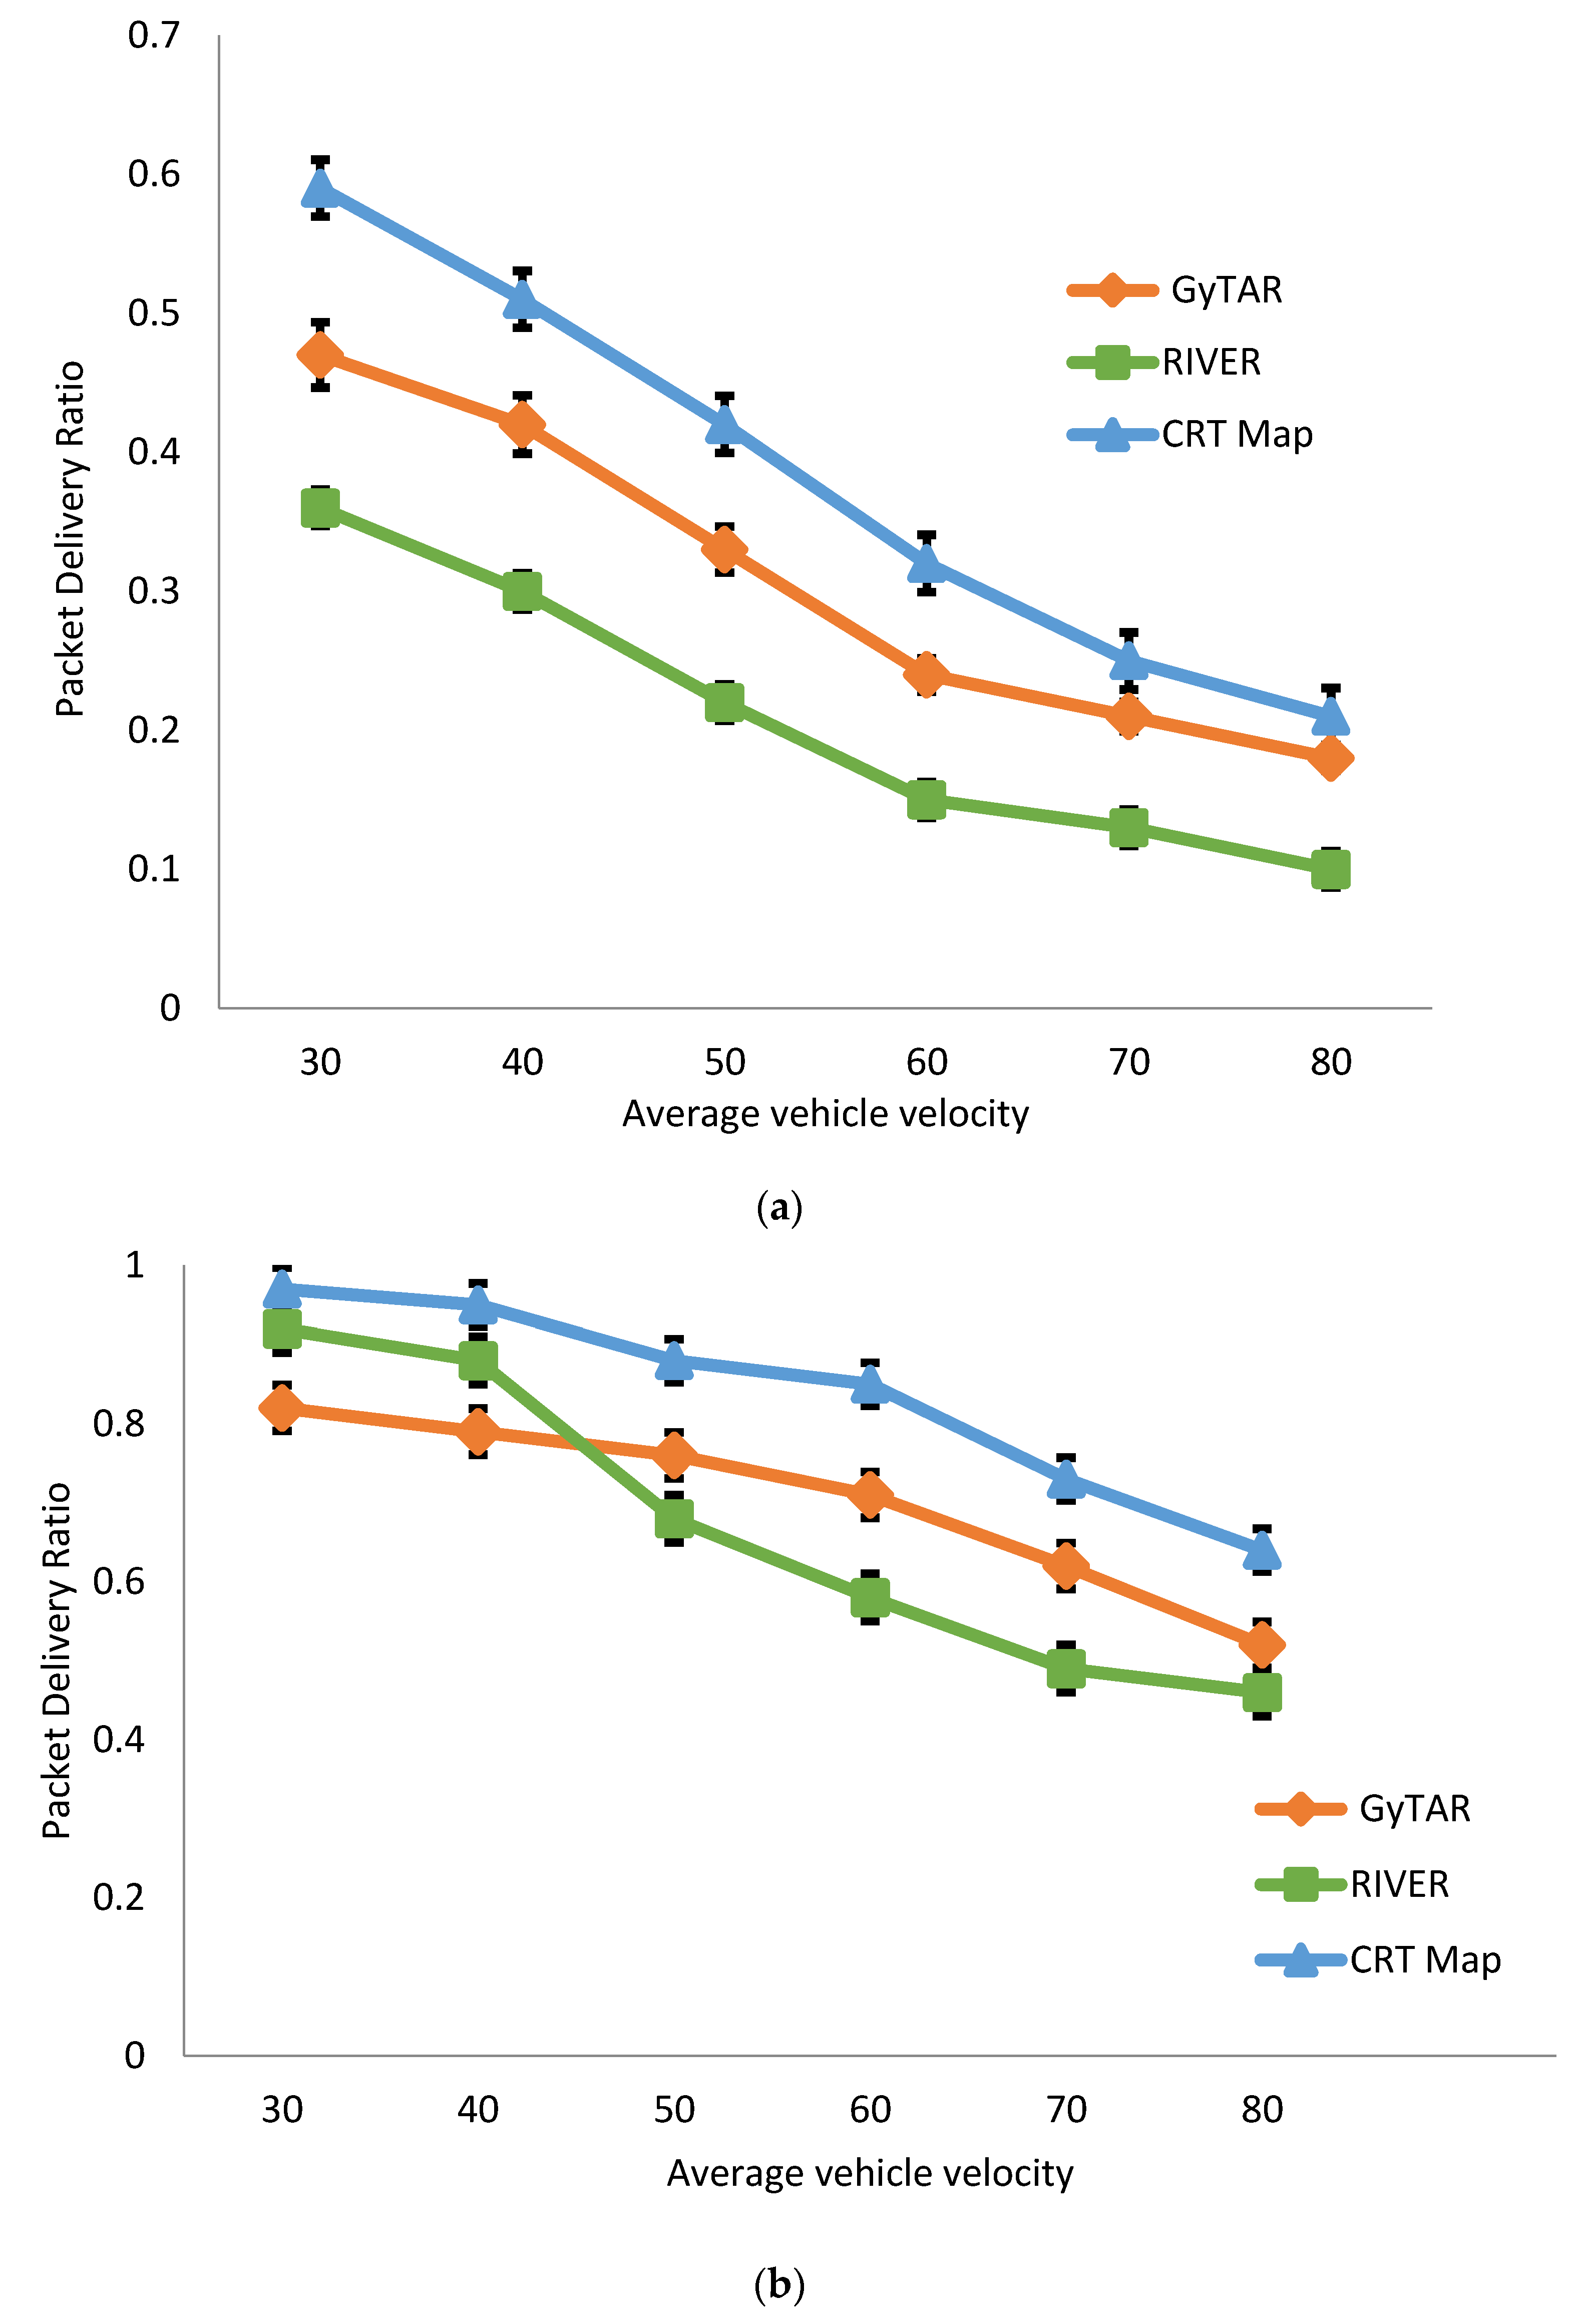
Next, we study the packet delivery ratio by varying the vehicular moving speeds. As shown in
Figure 9, the CBR has a higher success rate for delivering packets to destinations at different speeds. In a high speed environment, network topology is rapidly changed making the delivery ratio decrease, especially for RIVER. In
Figure 9b, RIVER has a higher performance than GyTAR when the moving speed is lower. Nonetheless, secondhand information used in RIVER becomes much more unreliable as the moving speed rises. Eventually, GyTAR overtakes RIVER in a highly dynamic environment. The CBR also suffers from the rapidly changed topology in a high moving speed. As the vehicular moving speeds are increased, the speed of the CRT Map update may not catch up with the speed of the network change (This effect will be further discussed later). As a result, the success rate of CBR becomes lower. However, the CBR considers consecutive road segments and recalculates weights at intersections based on the last updated information making the proposed CBR outperform the other two schemes. The packet delivery ratio with all the vehicular densities at an average moving speed of 80 km/h is shown in
Figure 10. High vehicular density can increase the success rate since the network becomes more connected. The proposed CBR can outperform in all cases.
5.1.3. Average Hop Count
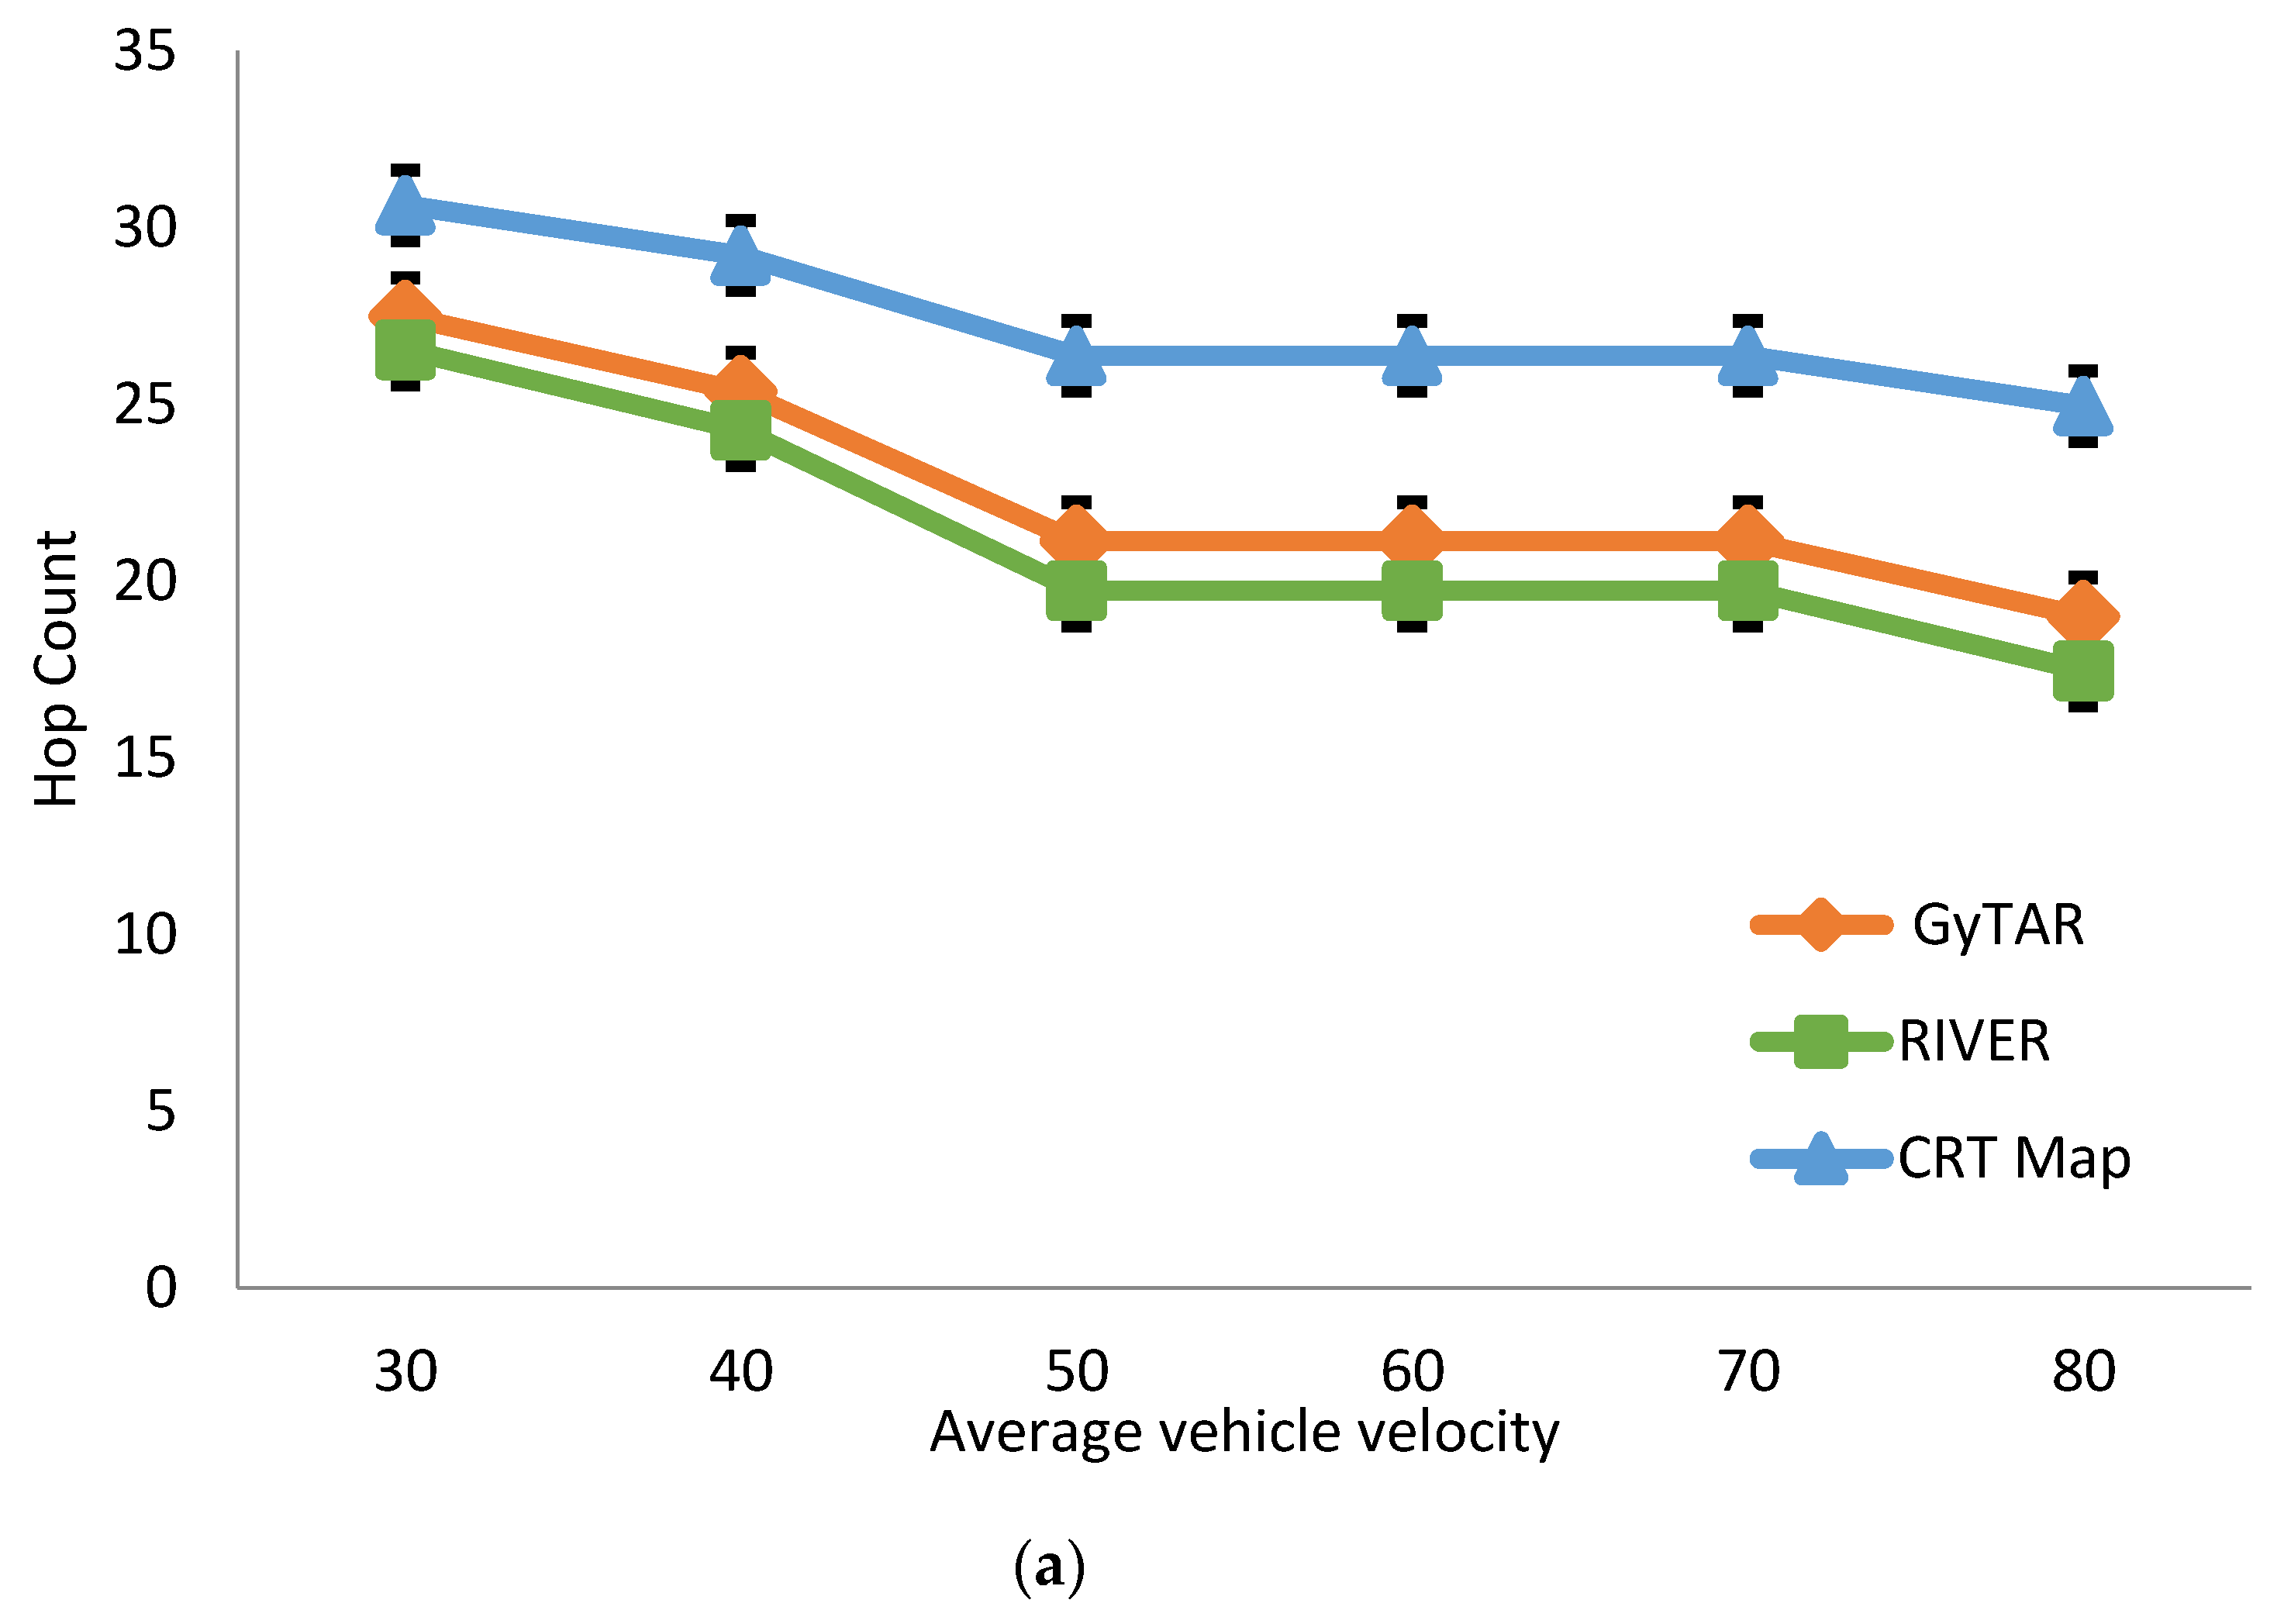
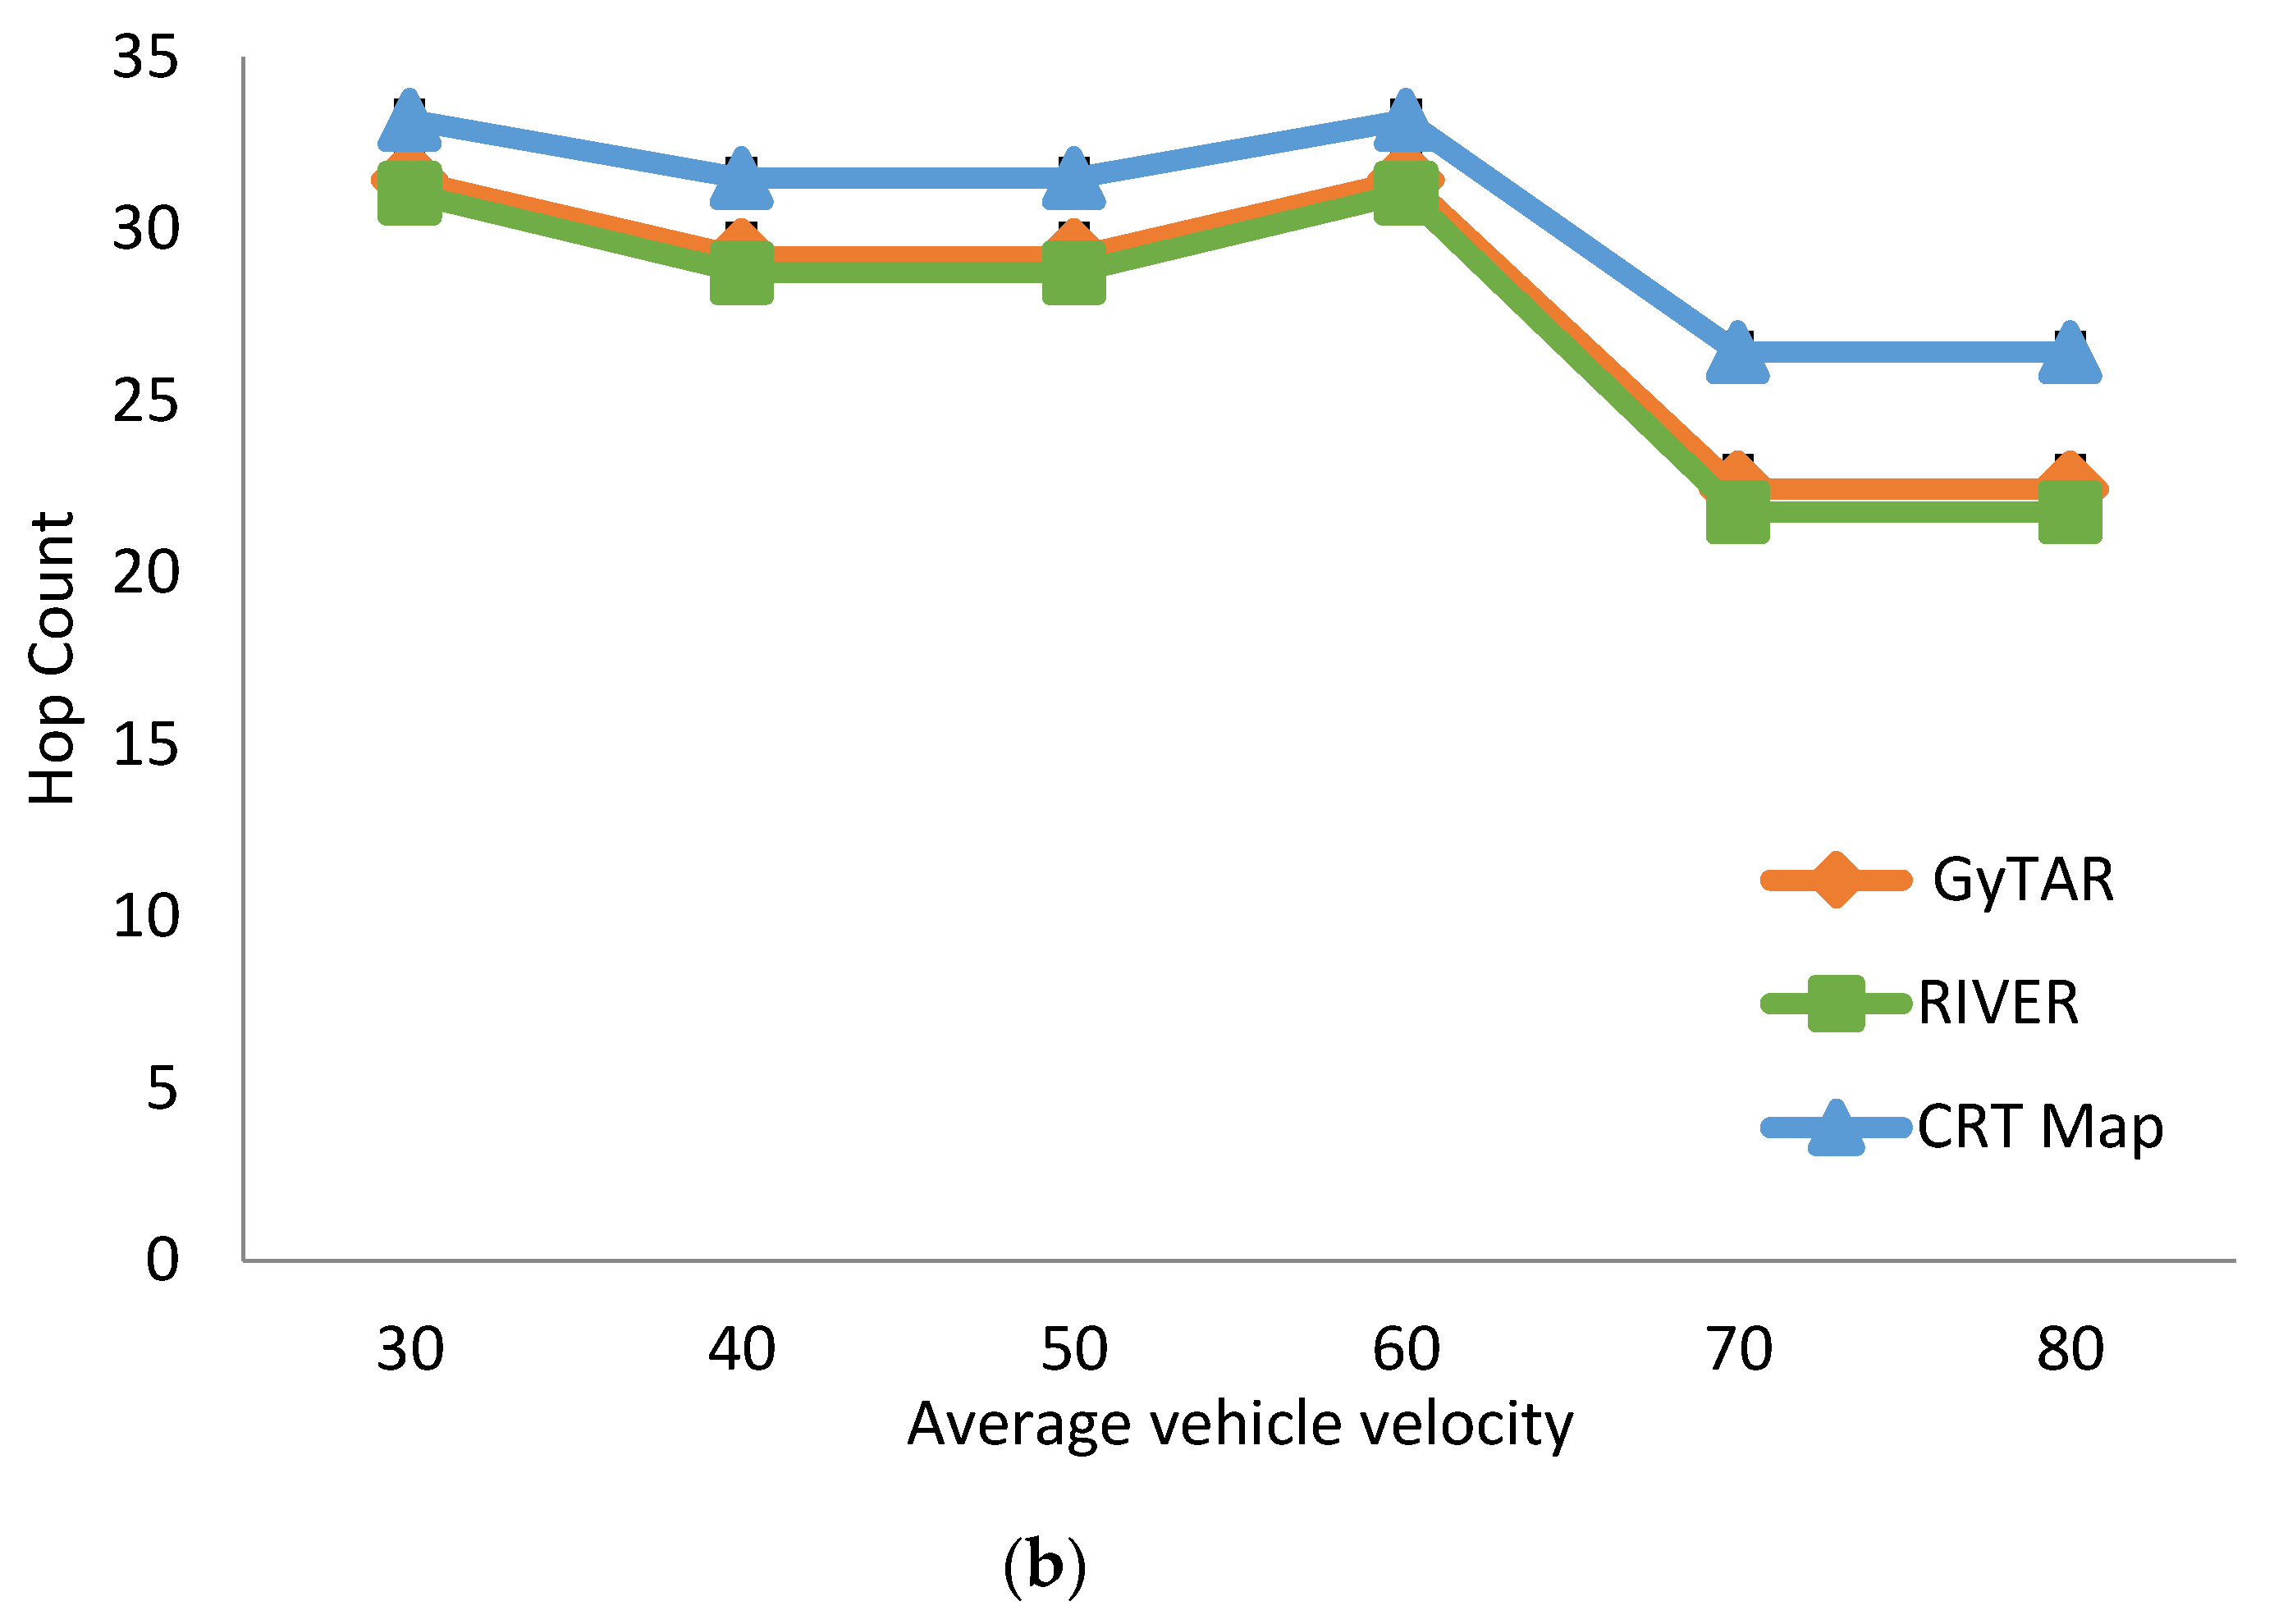
Average hop count is studied by varying the vehicular moving speeds. As shown in
Figure 11, when the moving speed is increased, the hop count becomes lower because the rapidly changed topology makes packets have more chances to be carried. The average hop count of the proposed CBR is higher than the other two schemes. It is because the delivery paths selected by CBR have higher traffic density, and thus increases the forwarded chances. It is worth to compare results in
Figure 11 with results discussed above. Although the high moving speeds increase the delivery speeds of carried packets, the network becomes disconnected more frequently. Packets prefer to be forwarded rather than carried since the speed of vehicle moving is not competitive to the speed of packet forwarding. Therefore, the higher hop count of the CBR results a lower end-to-end delay and a higher success rate.
5.1.4. Overhead
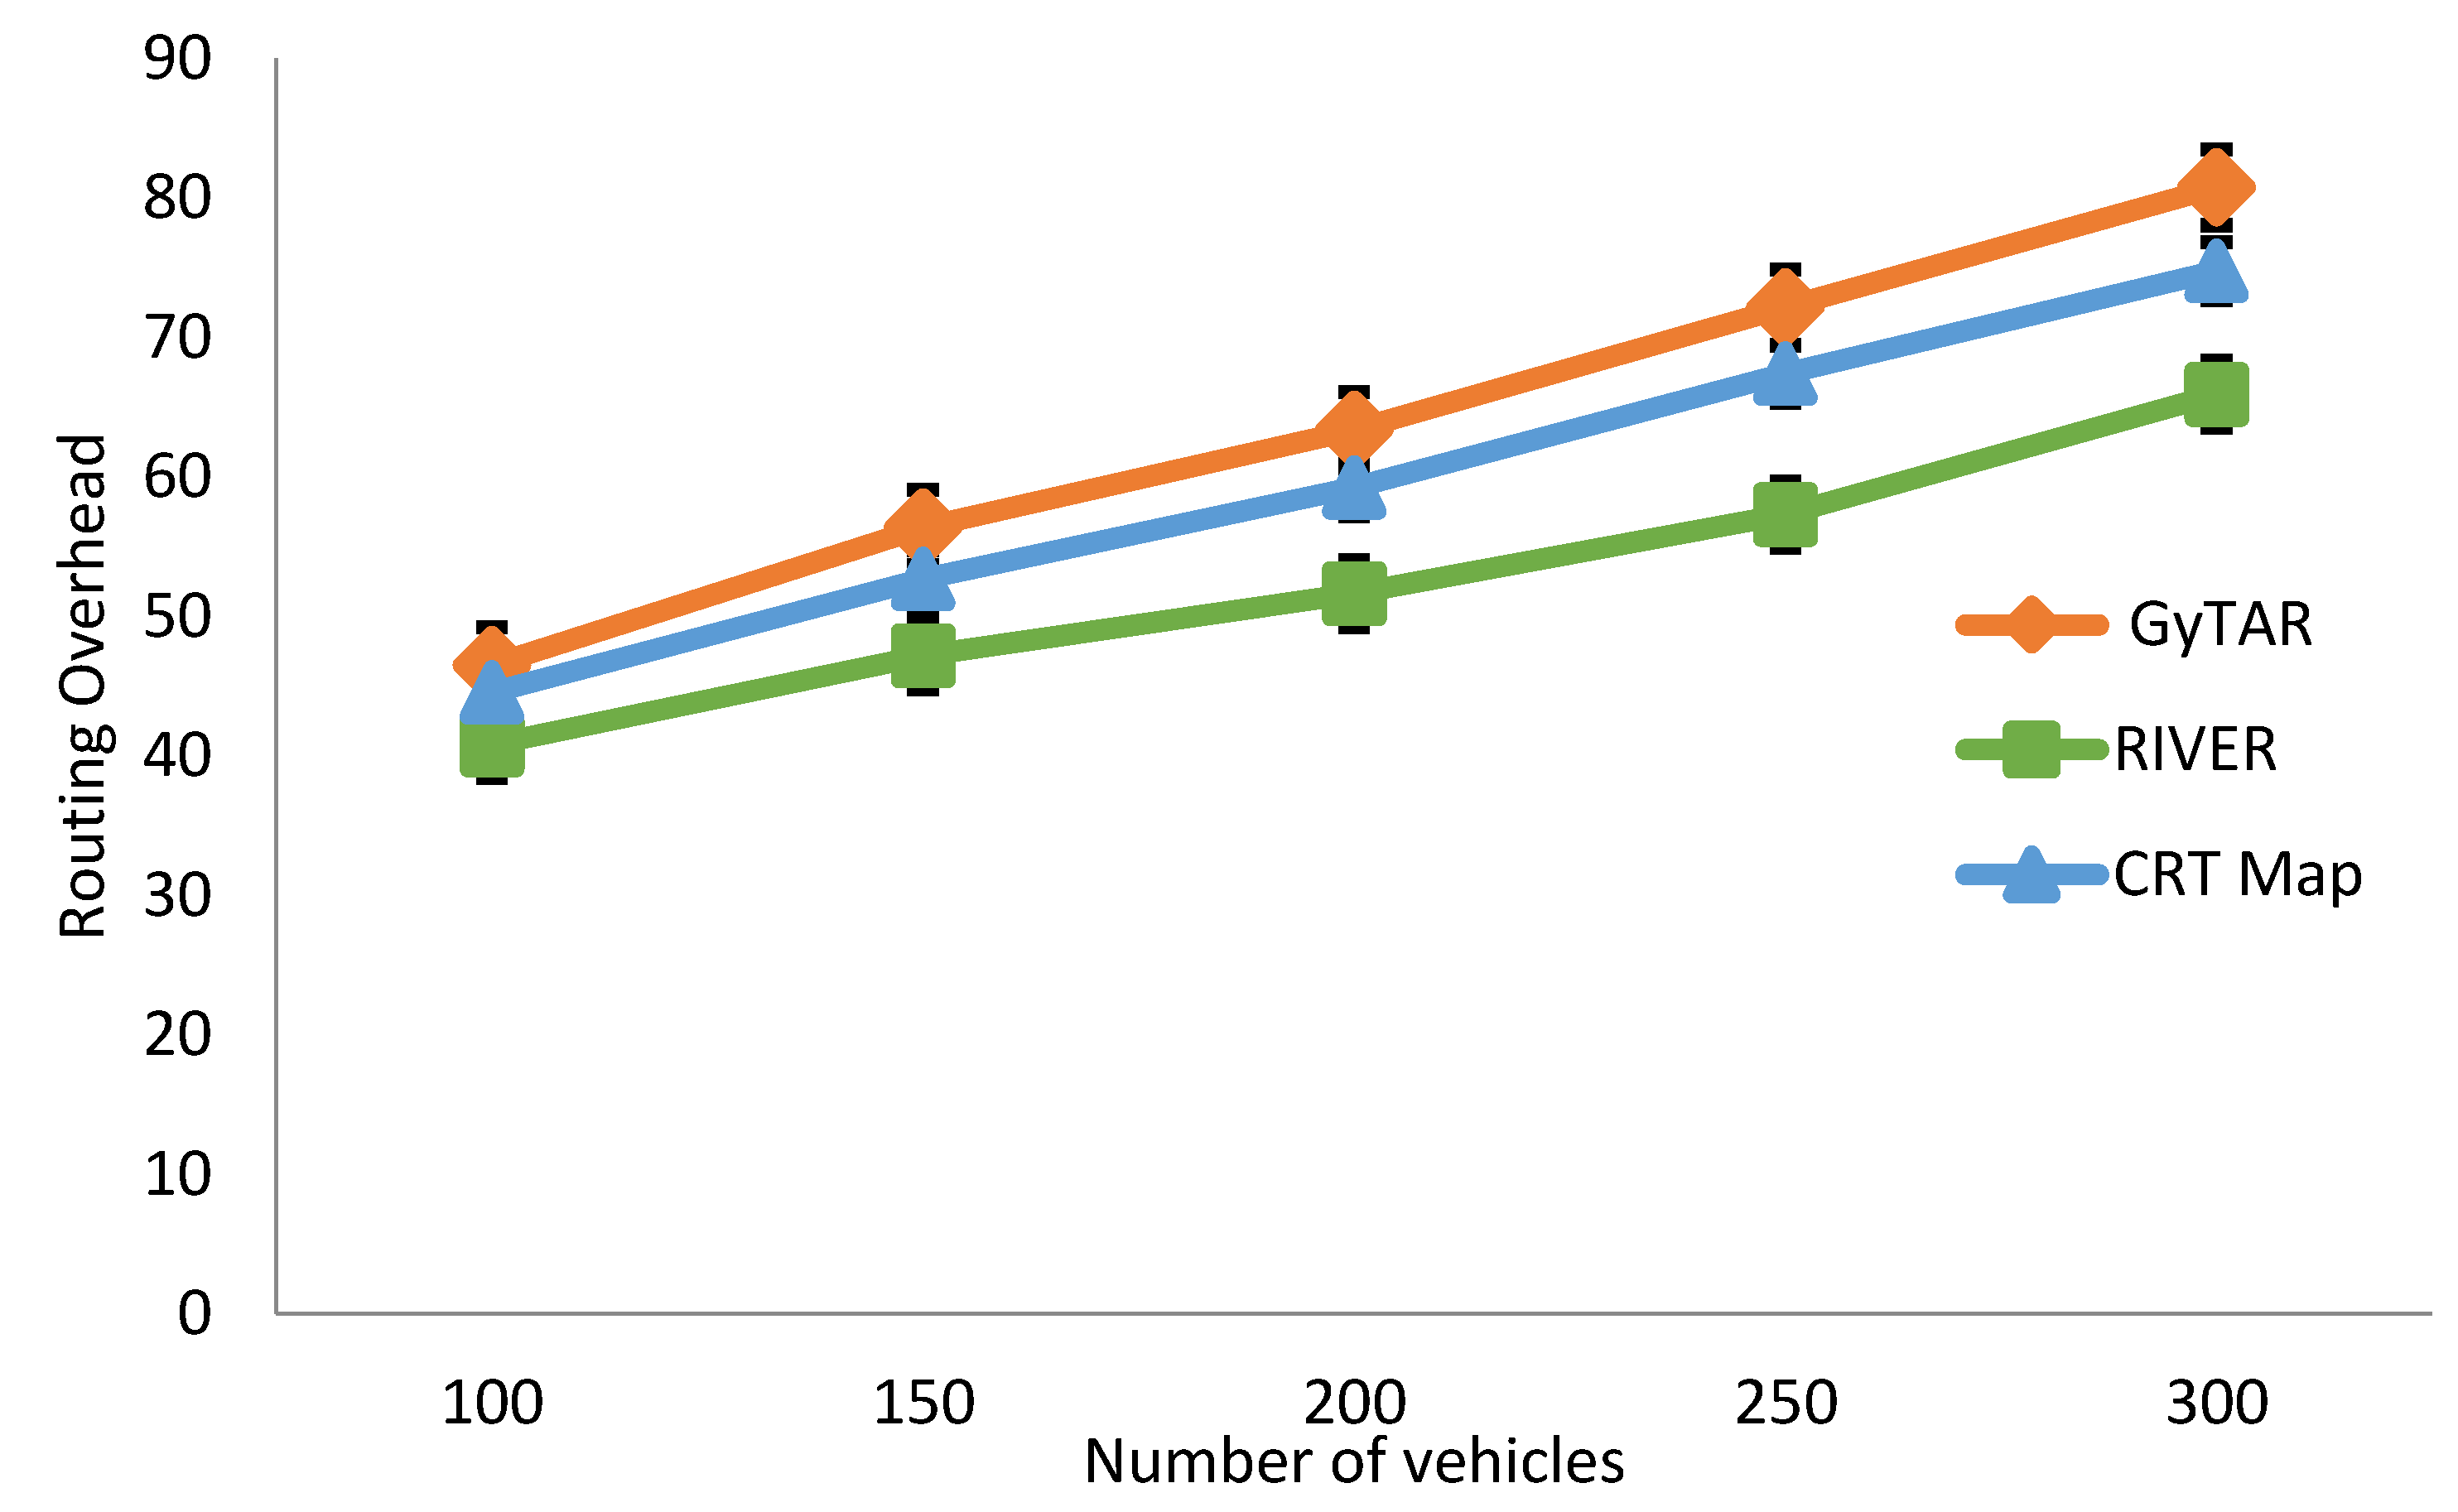
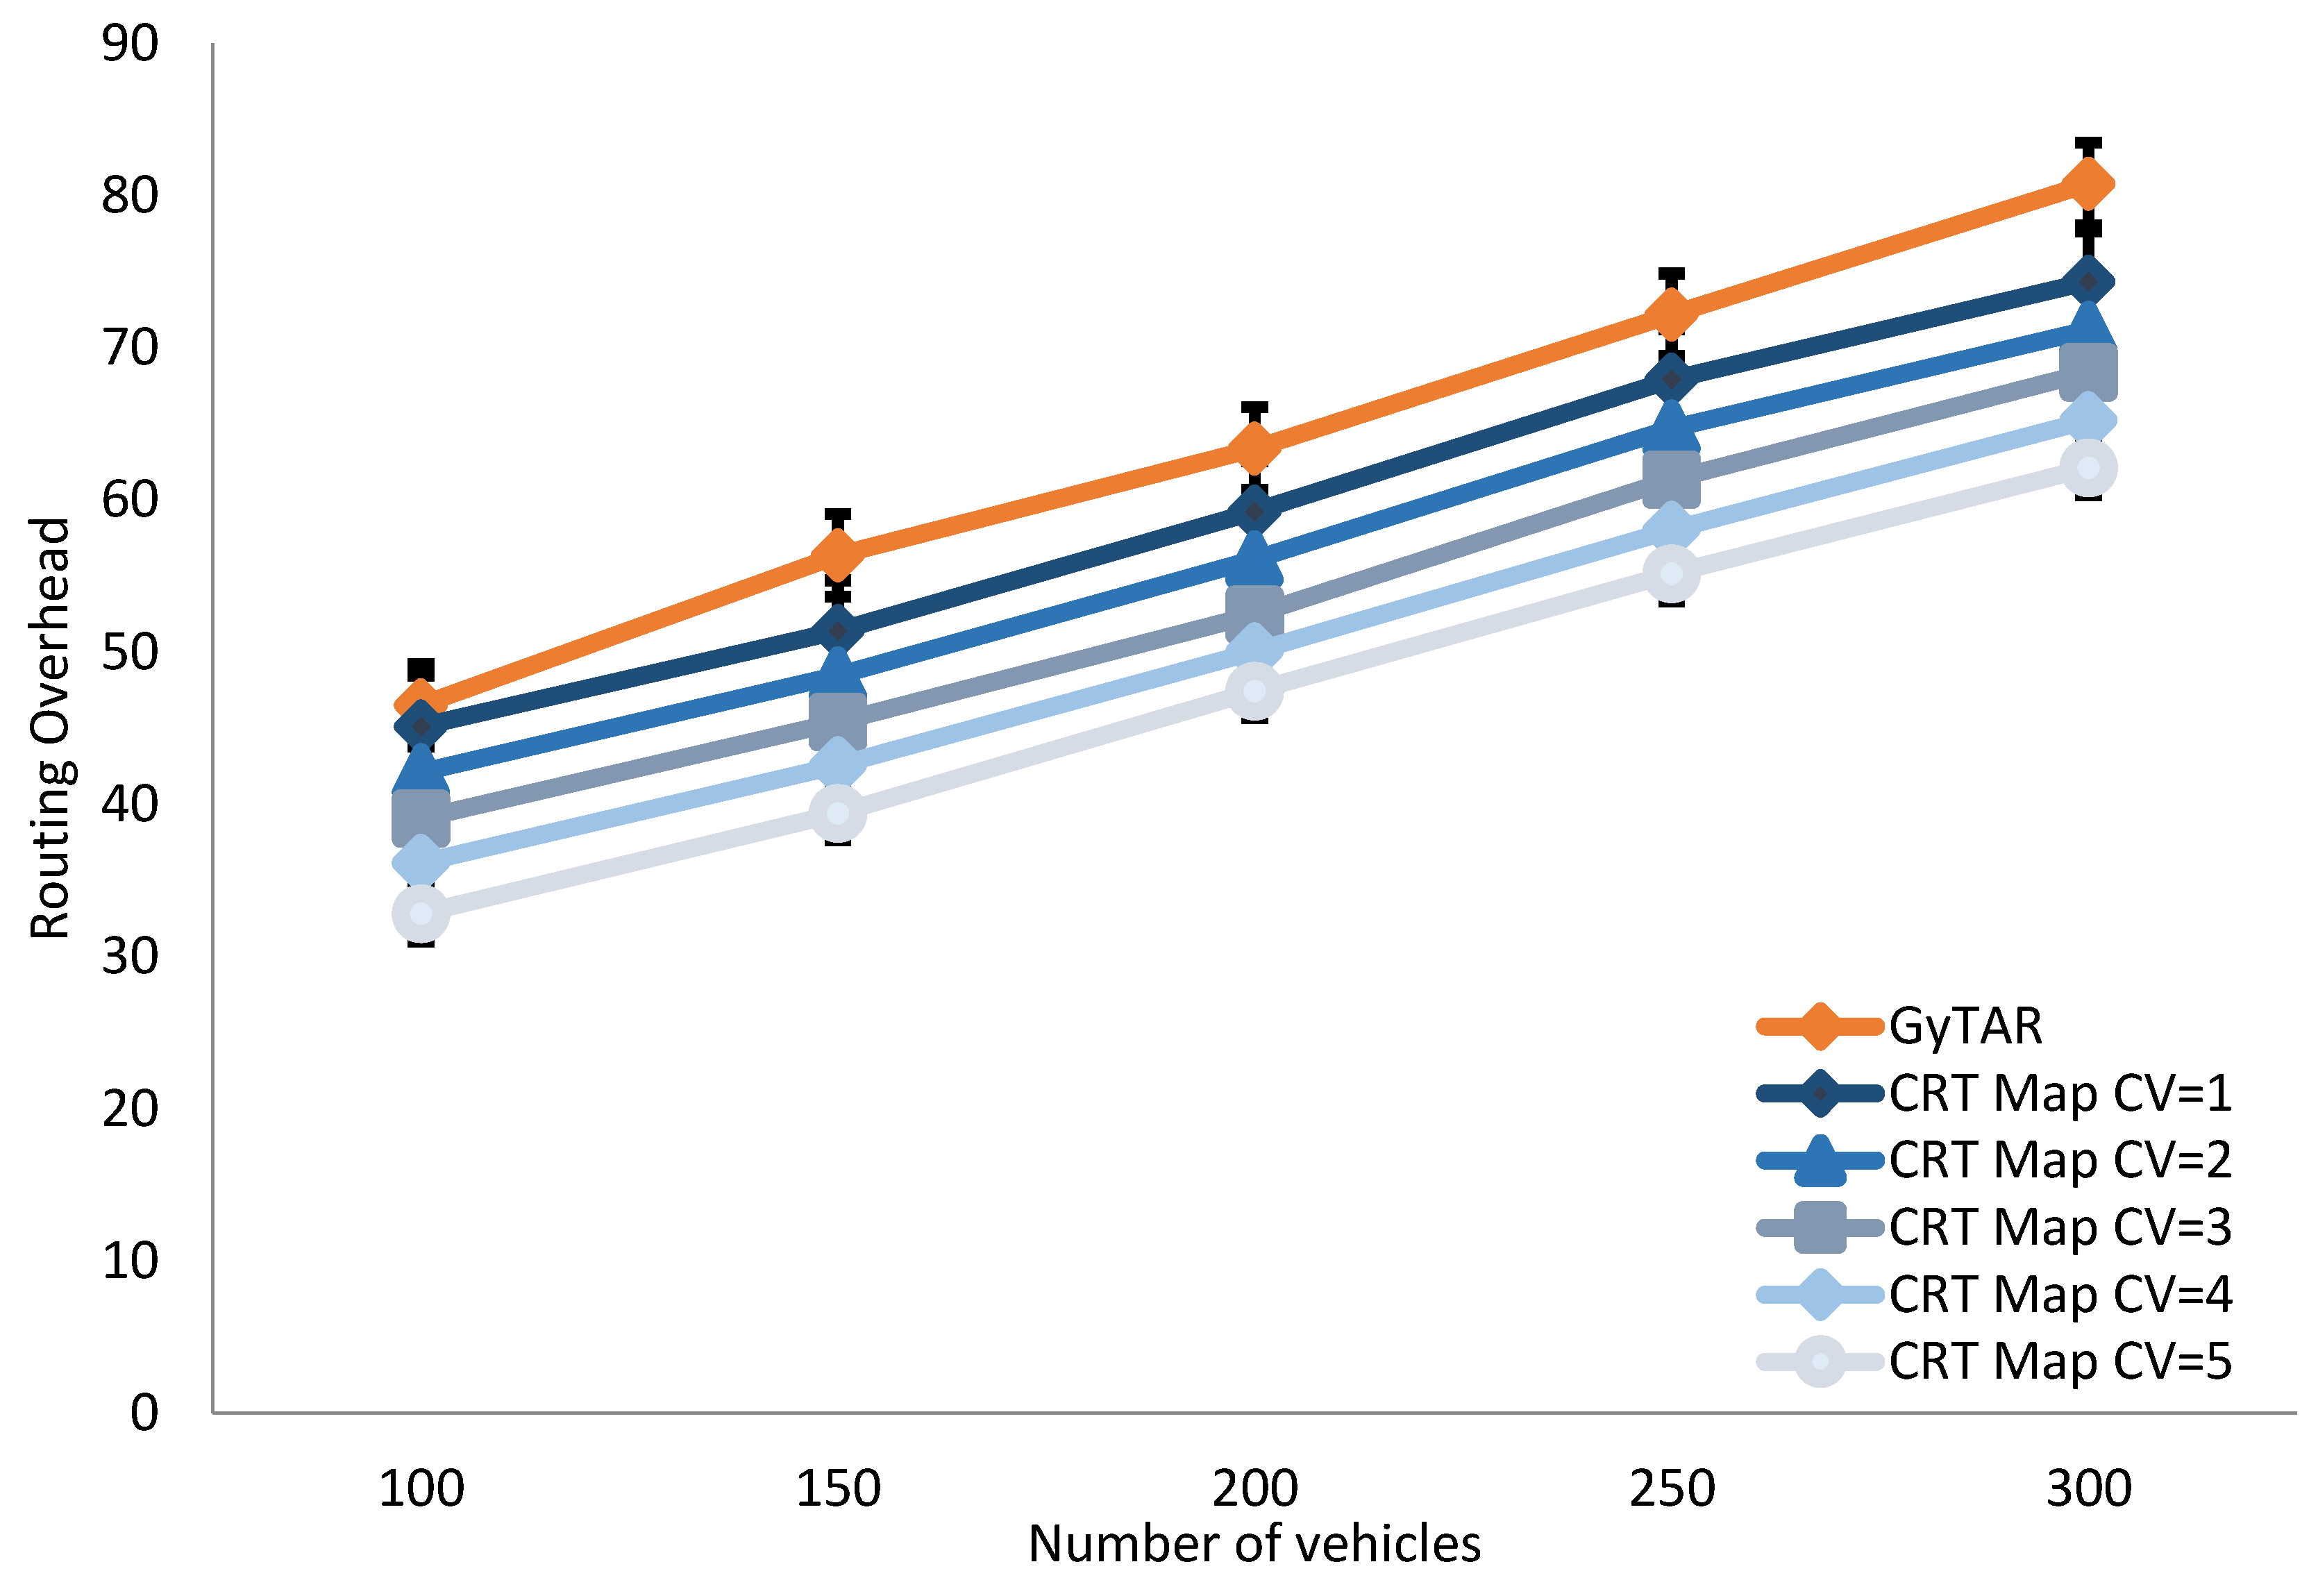
In
Figure 12, we compare the overheads of three routing protocols by varying the vehicular density from 100 to 300 vehicles. It is easy to image that the overhead increases as the networks density increases since more vehicles are involved. In GyTAR, control packets including beacon messages and CDP packets are taken into account. The CDP packets for collecting traffic density on each road are the major cost. RIVER has the least overhead, since a piggyback is used to disseminate traffic information. Hence, only the beacons are considered. In the proposed CBR, we have beacon messages and data messages in the map exchange process. The result shows that the overhead of the CBR is higher than RIVER but lower than GyTAR. Considering the end-to-end delay and delivery ratio of the CBR discussed above, the extra cost should be acceptable. Although RIVER has the least overhead, its performance is worse than the proposed CBR, especially in a high-speed environment.
5.1.5. Tradeoff between Efficiency and Overhead
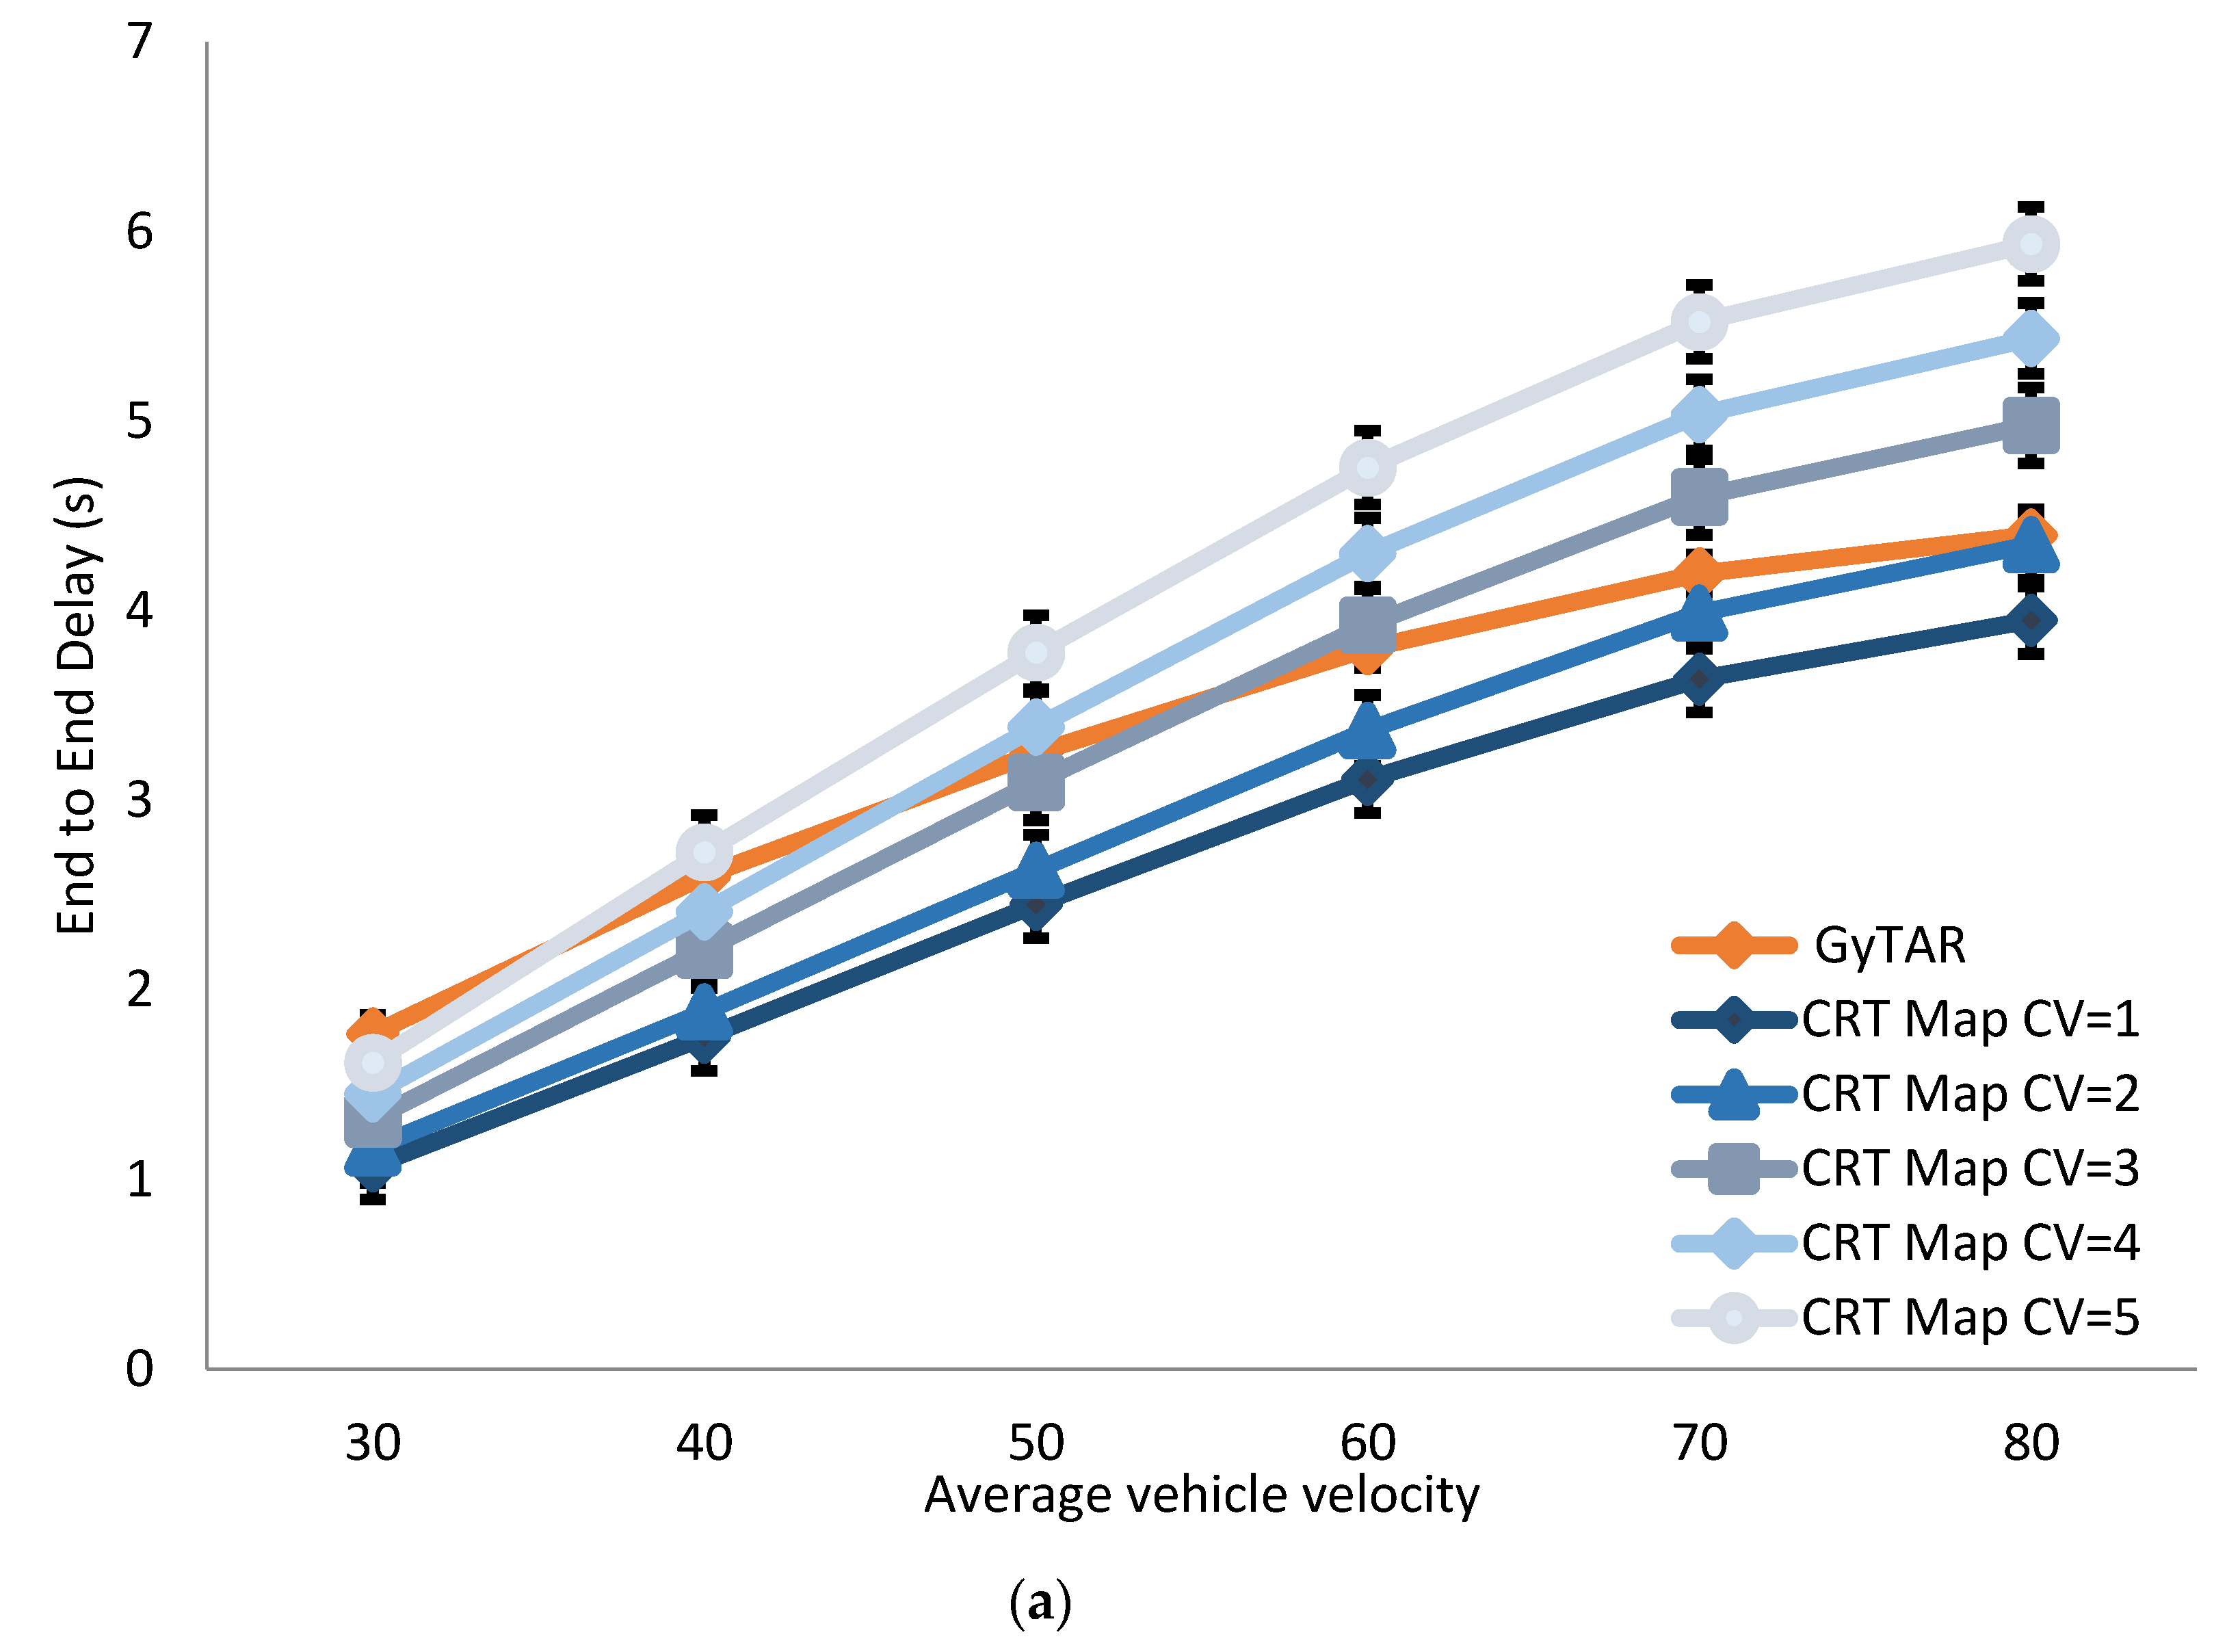
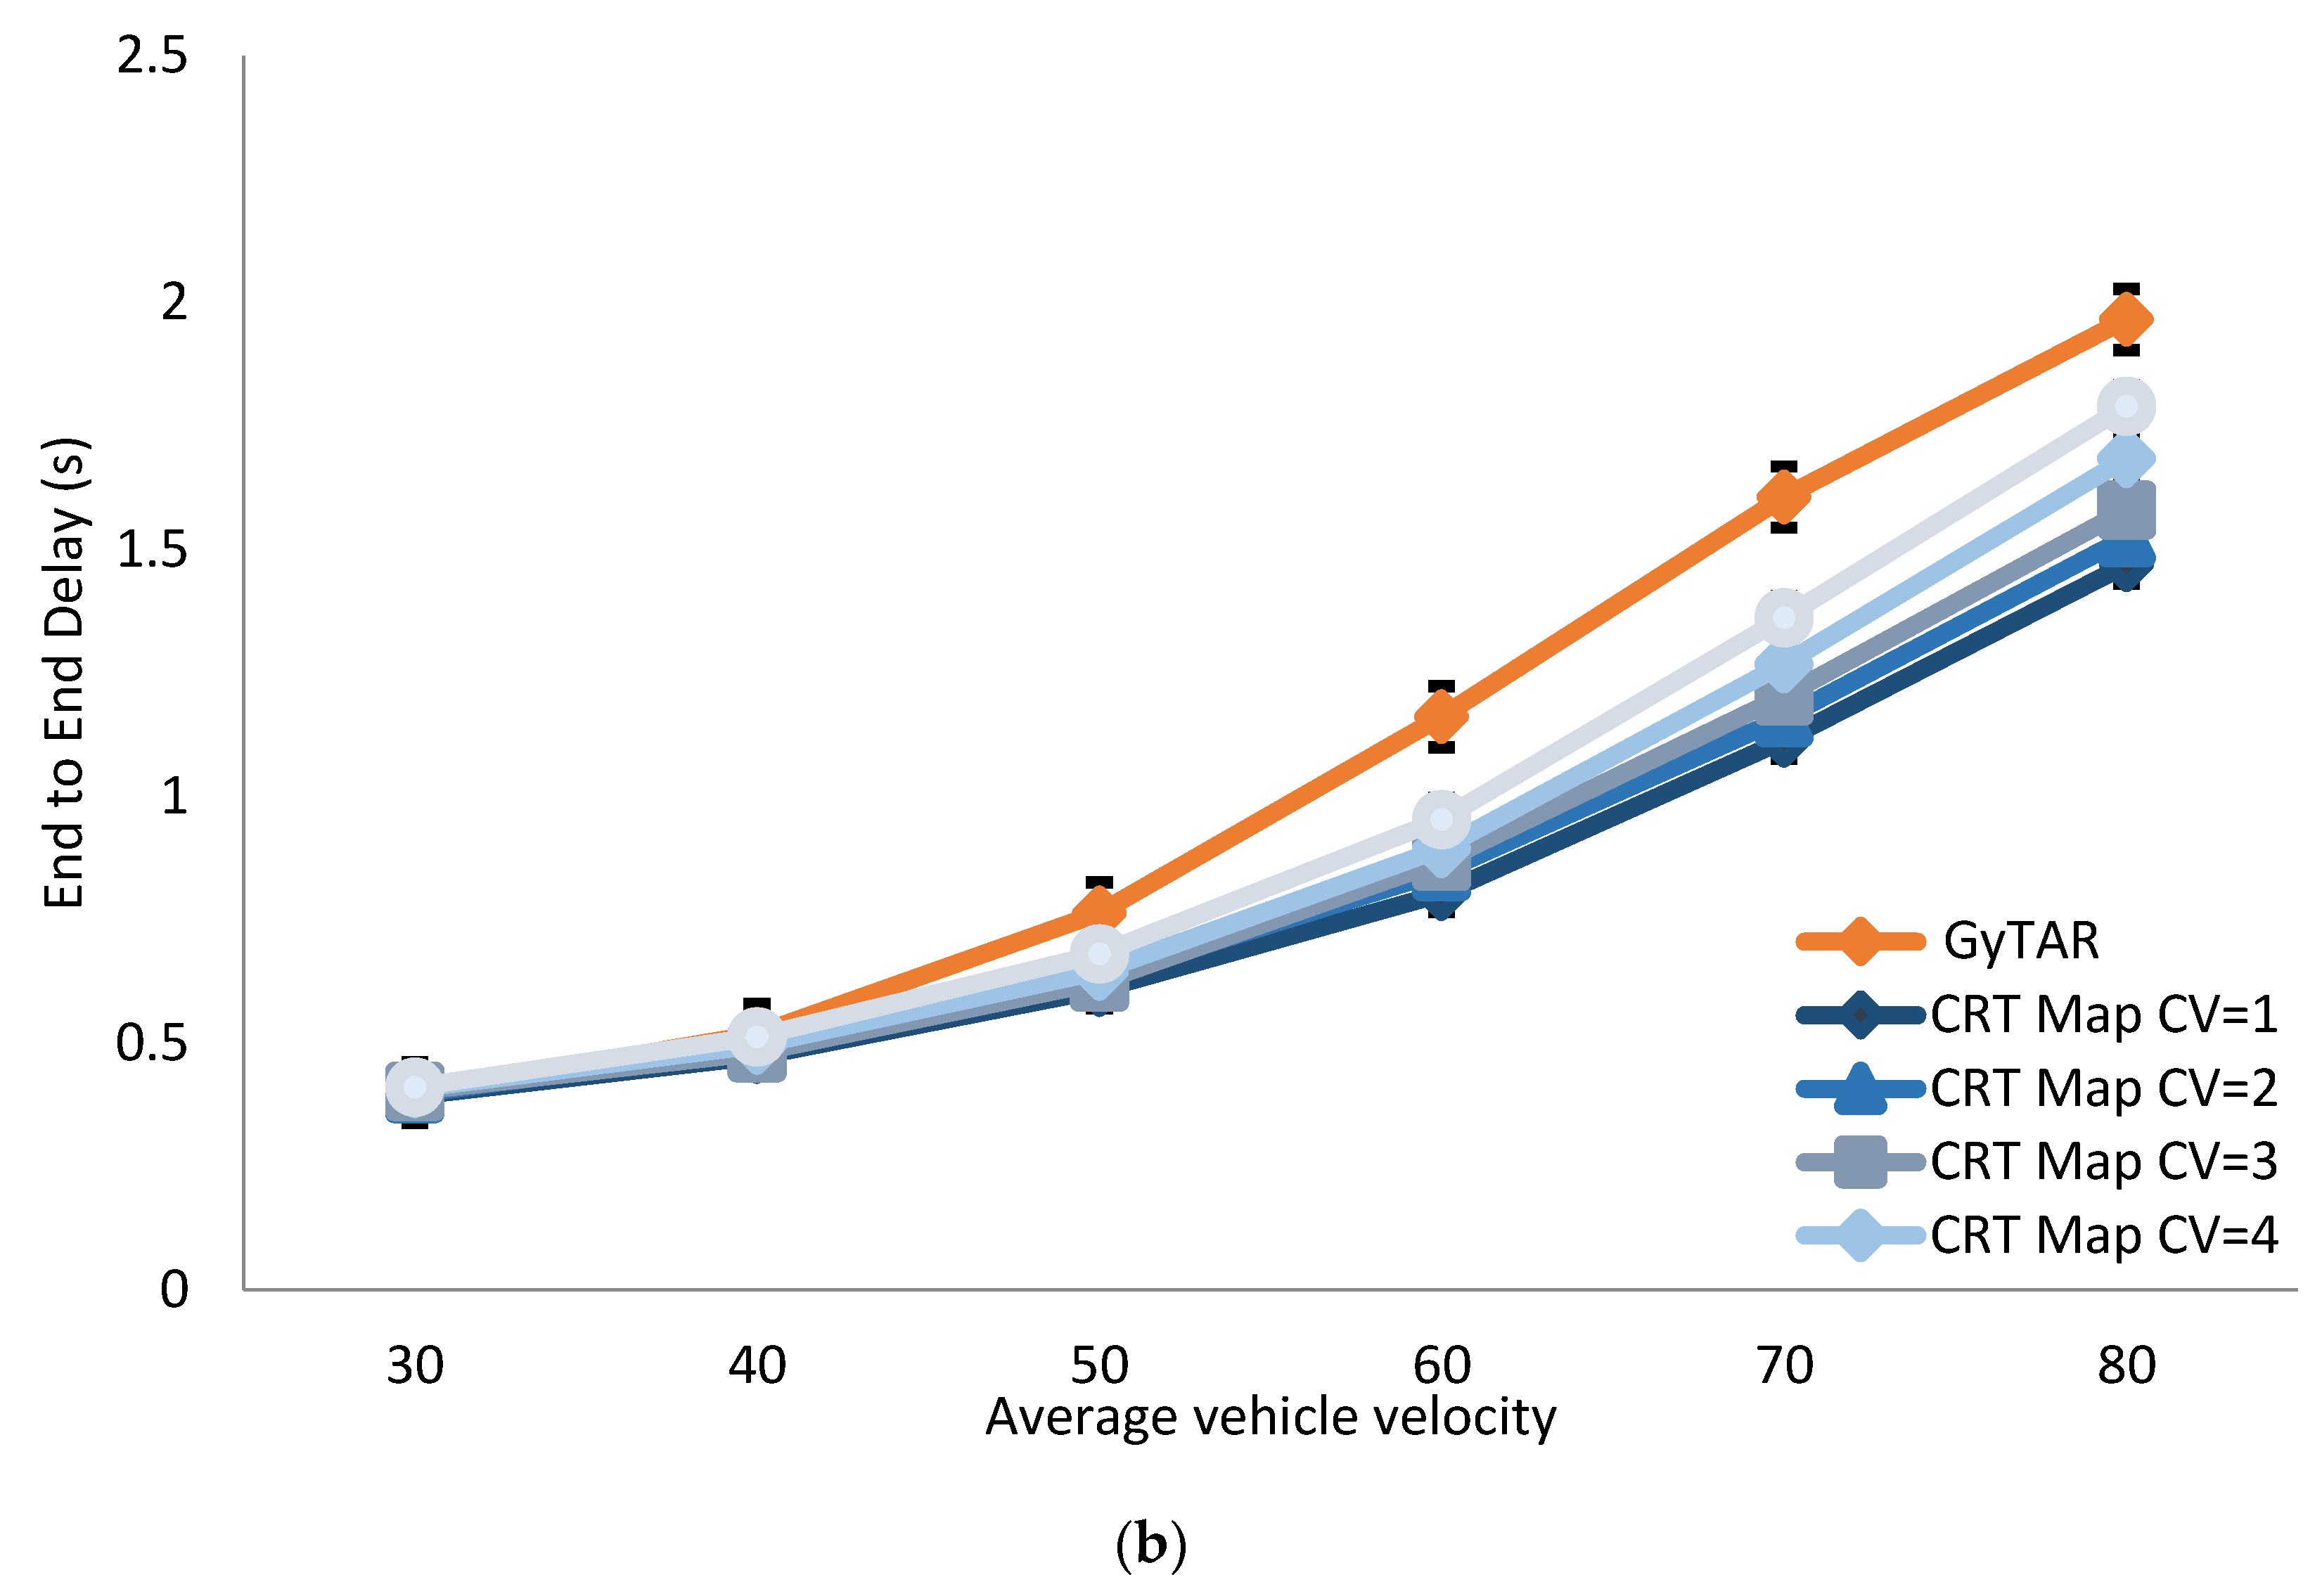
In the above simulations, CV is set to 1 for fast information distribution. The results show that CBR can outperform the other two protocols. In
Figure 13, we vary the CV value from 1 to 5 and compare the end-to-end delay with the second best protocol, GyTAR. As shown in
Figure 13a, in a low density and high speed environment, the network topology is sparse and rapidly changing. CV needs to be set to a small value to speed up the information distribution. Otherwise, the performance of the CBR may be inferior to GyTAR. As the network is dense enough, the message exchange frequency can be lower. Although the topology is still highly dynamic at high speed, but the high vehicular density can cover the effect. The CBR can outperform GyTAR in all CV setting, as shown in
Figure 13b. In
Figure 14, we compare the overhead with different CV settings. It is easy to image that the routing overhead decreases as the frequency of exchange decreases. In addition, the overhead of the CBR in all settings is lower than GyTAR. We can conclude that, a small CV value needs to be used only in a low density environment. In other cases, vehicles can exchange traffic information less frequently to reduce the overhead.
5.2. CRT Map Performance
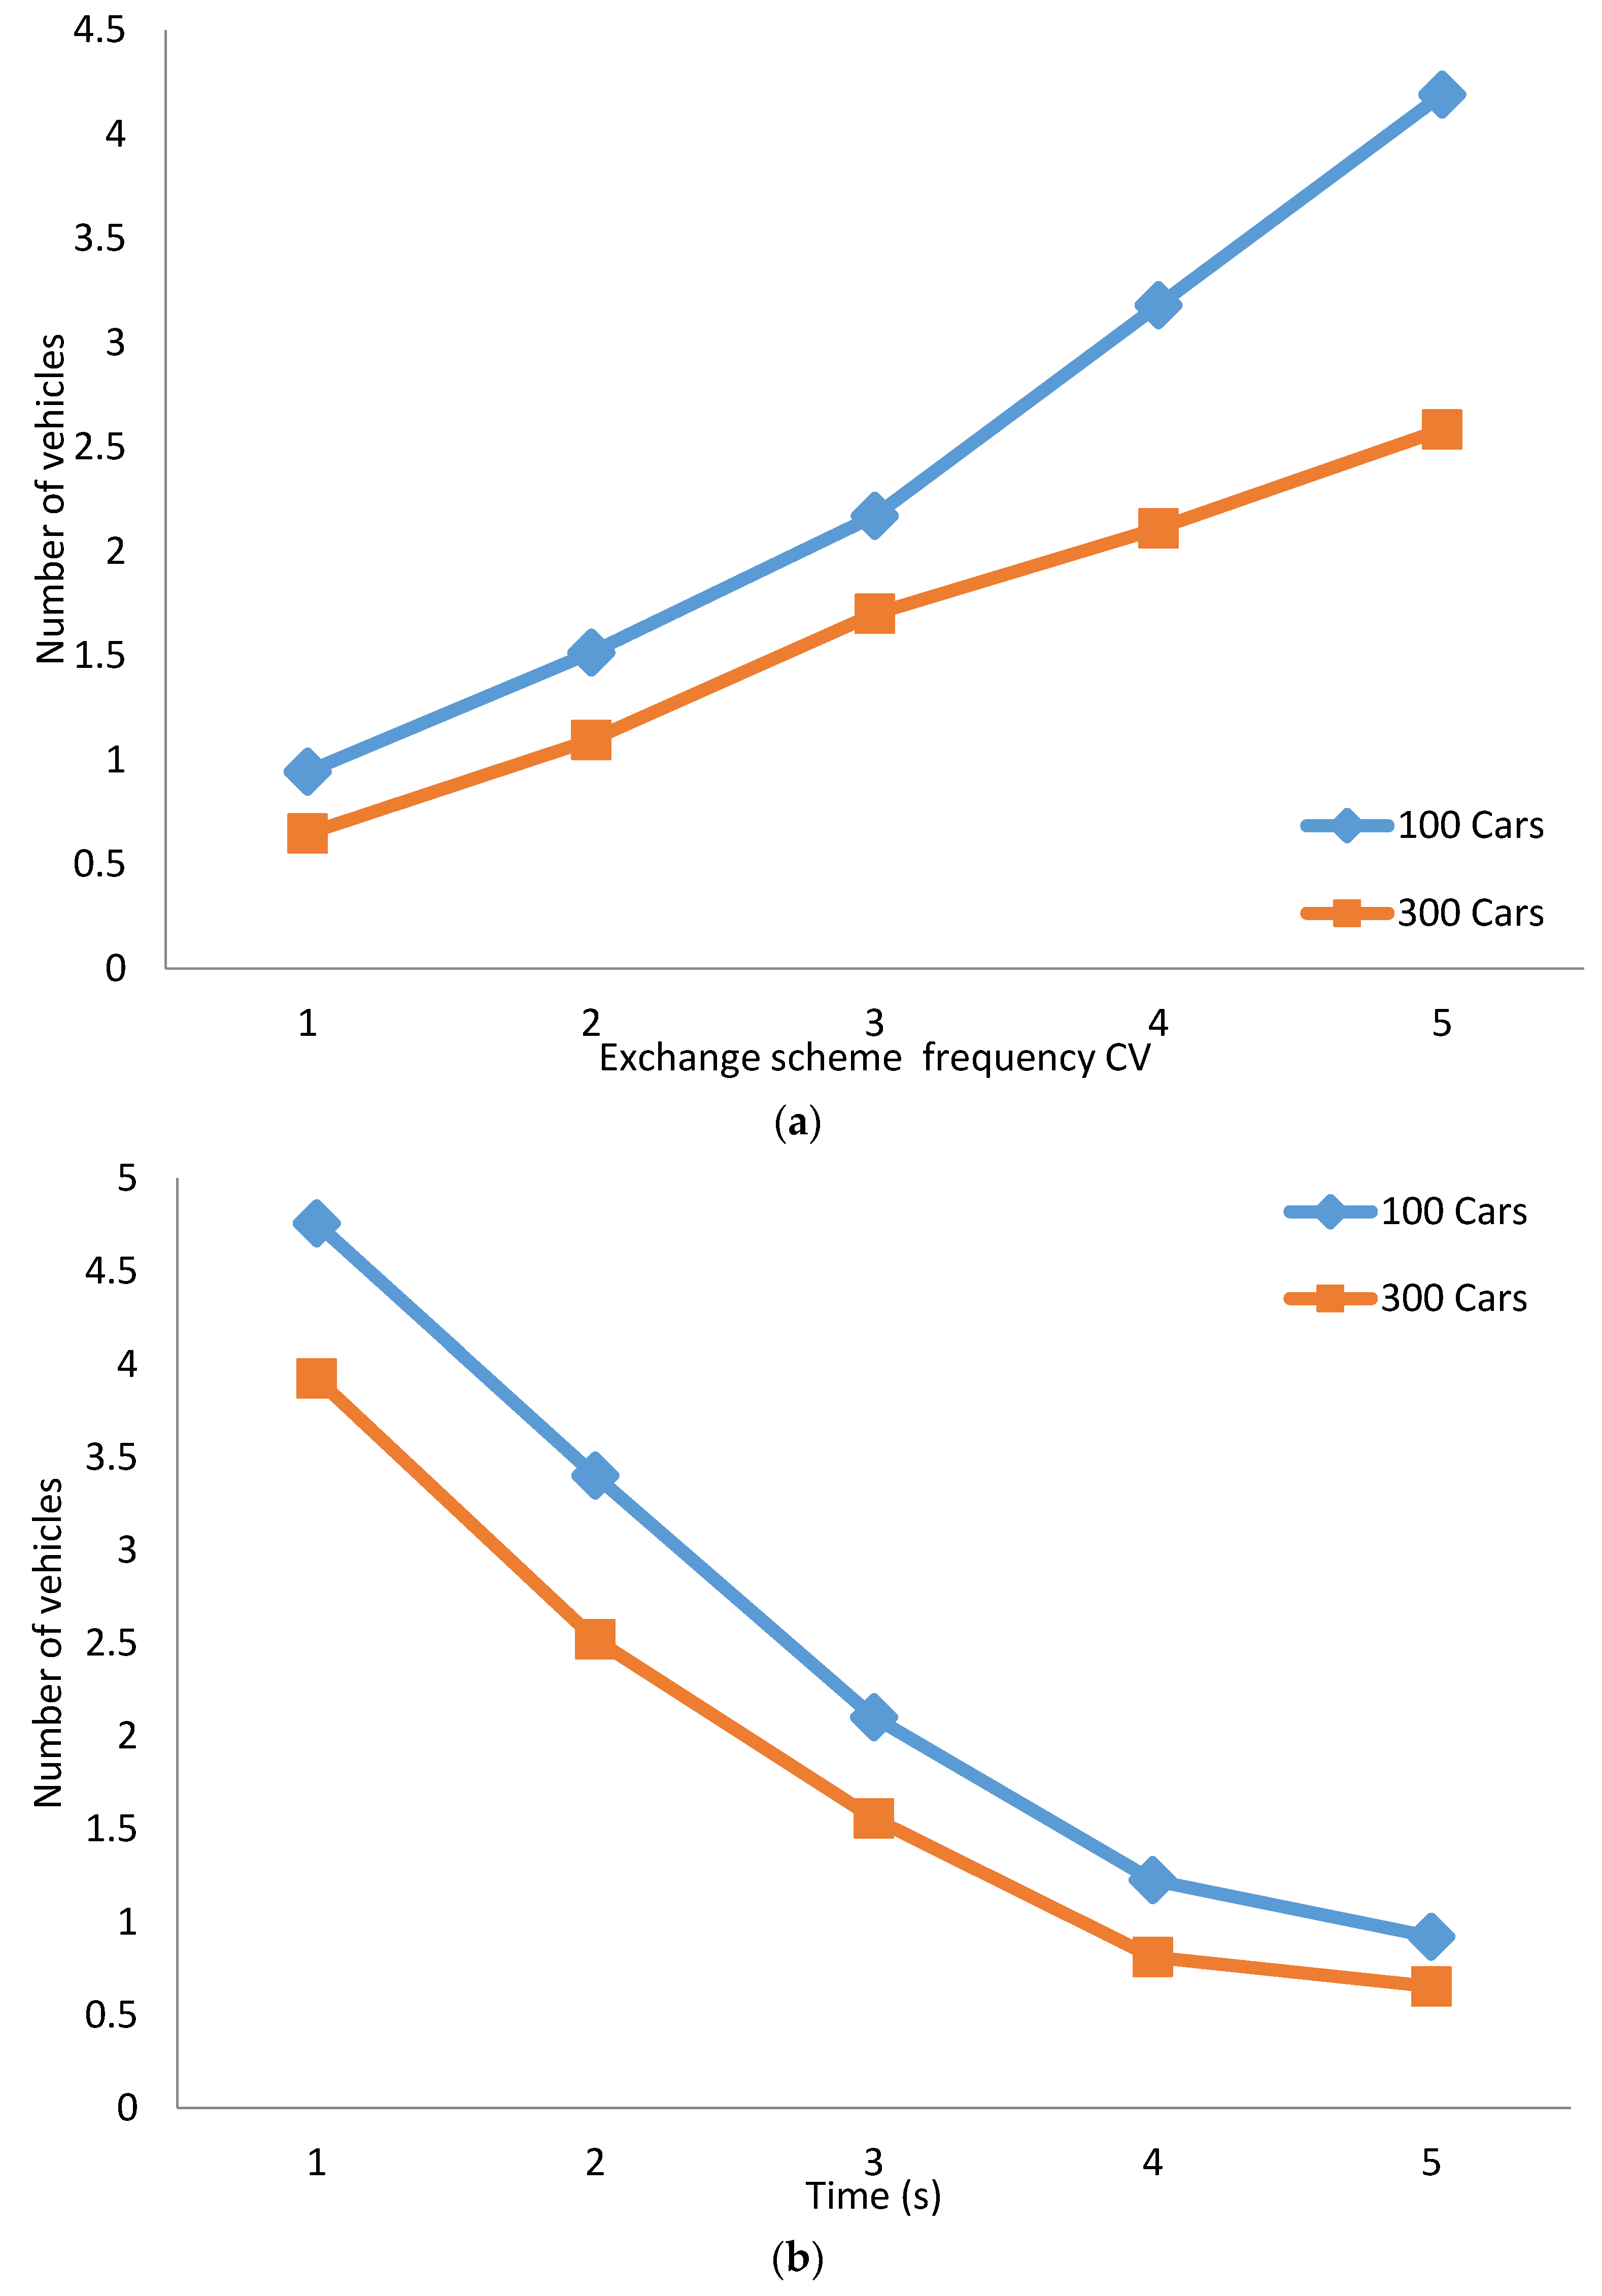
In this section, the performance of the proposed CRT Map is studied. First, we intend to comprehend the difference between the traffic densities in the real world and in the CRT Map. By varying the CV, we can measure the average deviation of the number of vehicles per road between the real world and the CRT Map in low and high vehicular density networks. The results are shown in
Figure 15a. It is obvious that the deviation increases as the CV increases, especially for a low density network. A small CV means a lower exchange frequency. As a result, the speed of information update does not catch up with the speed of the network change. However, almost all the deviations are lower than 4, which indicates that the proposed CRT Map is a good approximation of the real world. Next, we study the convergence time of the CRT Map. CV is set to 1 and the results are shown in
Figure 15b. The deviation decreases to 1 and reaches a balance in about three minutes after the network begins, which indicates that the CRT Map can converge at a fast rate. Besides, the deviation in a high density environment decreases more rapidly than a low density environment since vehicles have more chances to acquire road information from encountered vehicles.
6. Conclusions and Future Works
A novel mechanism to collect and share real-time traffic information, namely a CRT Map, was proposed in this paper. Vehicles cooperate with each other to gather and share their local traffic map thereby constructing an overview of the whole network. Based on the CRT Map, we proposed a geographic routing, called CBR, which considers the traffic density of consecutive road segments in routing decisions. Simulation results show the proposed solution has a better performance than GyTAR and RIVER, in terms of end-to-end delay and packet delivery ratio, with a low overhead.
In this paper, the CRT Map is utilized to support routing in VANETs. However, real-time traffic information is valuable in many applications, such as intelligent traffic management, self-driving cars, emergency dissemination, and so on. We are working on applying a CRT Map to relieve traffic congestion by traffic light control and coordination. Conversely, the CRT Map is designed for general purposes in this paper. Moreover, if it is dedicated to a routing purpose, some aspects can be further optimized. For example, information exchange can be performed on demand, instead of periodically. We are working on improving the message exchange process to reduce the routing overhead. Further results will be reported in our forthcoming papers.

