Article

A Nondestructive Real-Time Detection Method of Total Viable Count in Pork by Hyperspectral Imaging Technique

College of Engineering, China Agricultural University, 17 Qinghua East Road, Haidian, Beijing 100083, China
*
Author to whom correspondence should be addressed.
Appl. Sci. 2017, 7(3), 213; https://doi.org/10.3390/app7030213
Submission received: 10 November 2016 / Revised: 10 February 2017 / Accepted: 14 February 2017 / Published: 23 February 2017
(This article belongs to the Special Issue Applications of Hyperspectral Imaging for Food and Agriculture)

Abstract

:
A nondestructive method was developed for assessing total viable count (TVC) in pork during refrigerated storage by using hyperspectral imaging technique in this study. The hyperspectral images in the visible/near-infrared (VIS/NIR) region of 400–1100 nm were acquired for fifty pork samples, and their VIS/NIR diffuse reflectance spectra were extracted from the images. The reference values of TVC in pork samples were determined by classical microbiological plating method. Both partial least square regression (PLSR) model and support vector machine regression model (SVR) of TVC were built for comparative analysis to achieve better results. Different transformation methods and filtering methods were applied to improve the models. The results show that both the optimized PLSR model and SVR model can predict the TVC very well, while the SVR model based on second derivation was better, which achieved with RP (correlation coefficient of prediction set) = 0.94 and SEP (standard error of prediction set) = 0.4570 log CFU/g in the prediction set. An image processing algorithm was then developed to transfer the prediction model to every pixel of the image of the entire sample; the visualizing map of TVC would be displayed in real-time during the detection process due to the simplicity of the model. The results demonstrated that hyperspectral imaging is a potential reliable approach for non-destructive and real-time prediction of TVC in pork.

Graphical Abstract

1. Introduction

As one of the most important animal foods on the dining table, pork is rich in protein, fat, carbohydrate, calcium, iron, phosphorus, and other ingredients. China is the world’s largest producer and consumer of pork, accounting for about half of the world’s total output. The total viable bacteria count (TVC) is a key indicator to reflect the quality and safety of pork, and meat which TVC exceeds the standard value (6 log CFU/g in China) [1] would greatly endanger consumers’ healthy. TVC can be not only used to predict the shelf life or to judge whether the meat is rotten or not, but also regard as a means of evaluating the processing environment and the degree of contamination of the pork.
The typical detection method of TVC is plate count method (ISO, 2003) [2], which is also the national standard method of China, but it is too time-consuming and destructive, with tedious steps and delayed result. Some improved rapid methods for industrial online monitoring are in great request for modern control of the quality and safety of meat. The dry sheet culture method is a widely-used method in recent years with the advantages of simplicity, practicality, and low-cost with strong operation, but still needs a long time to obtain the results [3]. Bio-electrochemistry is a method of determining the production or consumption of a microorganism by an electrode, thereby providing a signal for analysis [4]. Although this method can greatly reduce the time consumption, which is still much longer and sensitive to temperature. Some biological methods, such as polymerase chain reaction (PCR) and enzyme linked immunosorbent assay (ELISA) have also been developed and applied for microbial identification and determination [5,6]. Although the results are relatively accurate and reliable, they are also accompanied with strong technicality and high cost.
As a new technology that has developed swiftly, near-infrared (NIR) spectroscopy technology has been used widely in the quality and safety detection of various types of agricultural products. Because it has the advantages of being rapid, nondestructive, and inexpensive, NIR spectroscopy has also been applied to detect safety and quality parameters of pork meat by many researchers from all over the world. However, NIR cannot reflect the detailed information of the pork samples, and only gives the average results of the quality parameters. Hyperspectral technology is newly developed from the 1980s, which combines optics, electronics, information processing, and computer science and technology. The advantage of hyperspectral technology lies in its ability to obtain spatial information and spectral information of the object simultaneously. In recent years, the spatially scattering feasibility of hyperspectral imaging for total viable count (TVC) has been investigated [7,8,9,10,11,12,13,14]. Peng et al (2011) [8] applied hyperspectral scattering imaging for the determination of TVC of beef, and a very good result with R2 = 0.95 and SEP(standard error of prediction set) = 0.30 log CFU/g was obtained by the established partial least square regression (PLSR) model based on three combinations of scattering parameters (i.e., a, b, and a × b). Huang, Zhao, Chen, and Zhang [10] applied a hyperspectral imaging system working in the 430–960 nm region combined with a back-propagation artificial neural network (BP-ANN) model for TVC evaluation in pork meat, obtaining good results with R2P of 0.83 and SEP of 0.24 log CFU/g. However, there are some problems with the stability and efficiency of real-time detection. Barbin, ElMasry, Sun, Allen, and Morsy [11] adopted NIR (900–1700 nm) reflectance hyperspectral imaging combined with PLS algorithm to evaluate the TVC degree of chilled pork meat. The PLS model developed with the full NIR spectra gave the result of R2P of 0.93 and SEP of 0.70 log CFU/g, which was better than with selected wavelengths. However, the cost of the detection device is higher than the former.
Despite the encouraging findings above, a higher precision and simpler model based on a detection device with low cost should be encouraged. A method for nondestructive, rapid, and real-time detection of total viable count in pork by hyperspectral imaging technique was developed in this study. The hyperspectral reflectance spectra in the range of 400 nm to 1100 nm were collected to build the TVC prediction model for 50 pieces of chilled pork samples. Then, the visual display map of TVC was realized by transferring the prediction model to every pixel of the image to predict TVC in all spots of the sample.

2. Materials and Methods

2.1. Preparation of Pork Samples

Pork tenderloin samples were purchased from a local supermarket (Merry Mart, Beijing, China) and immediately transported to the lab. The pork meat was then sliced into 50 pieces of 80 × 50 × 25 mm3 (length × width × thickness) chops on a sterilized chopping board and placed in PVC (polyvinyl chloride) boxes separately. The samples were then stored in a refrigerator at 4 °C and covered by plastic film. The whole experimental period lasted 15 days, and two to four randomly-selected samples were taken out from the refrigerator on each sampling day for hyperspectral imaging and microbiological analysis. Sample analysis of the first day was conducted immediately before storage.

2.2. Hyperspectral Acquisition

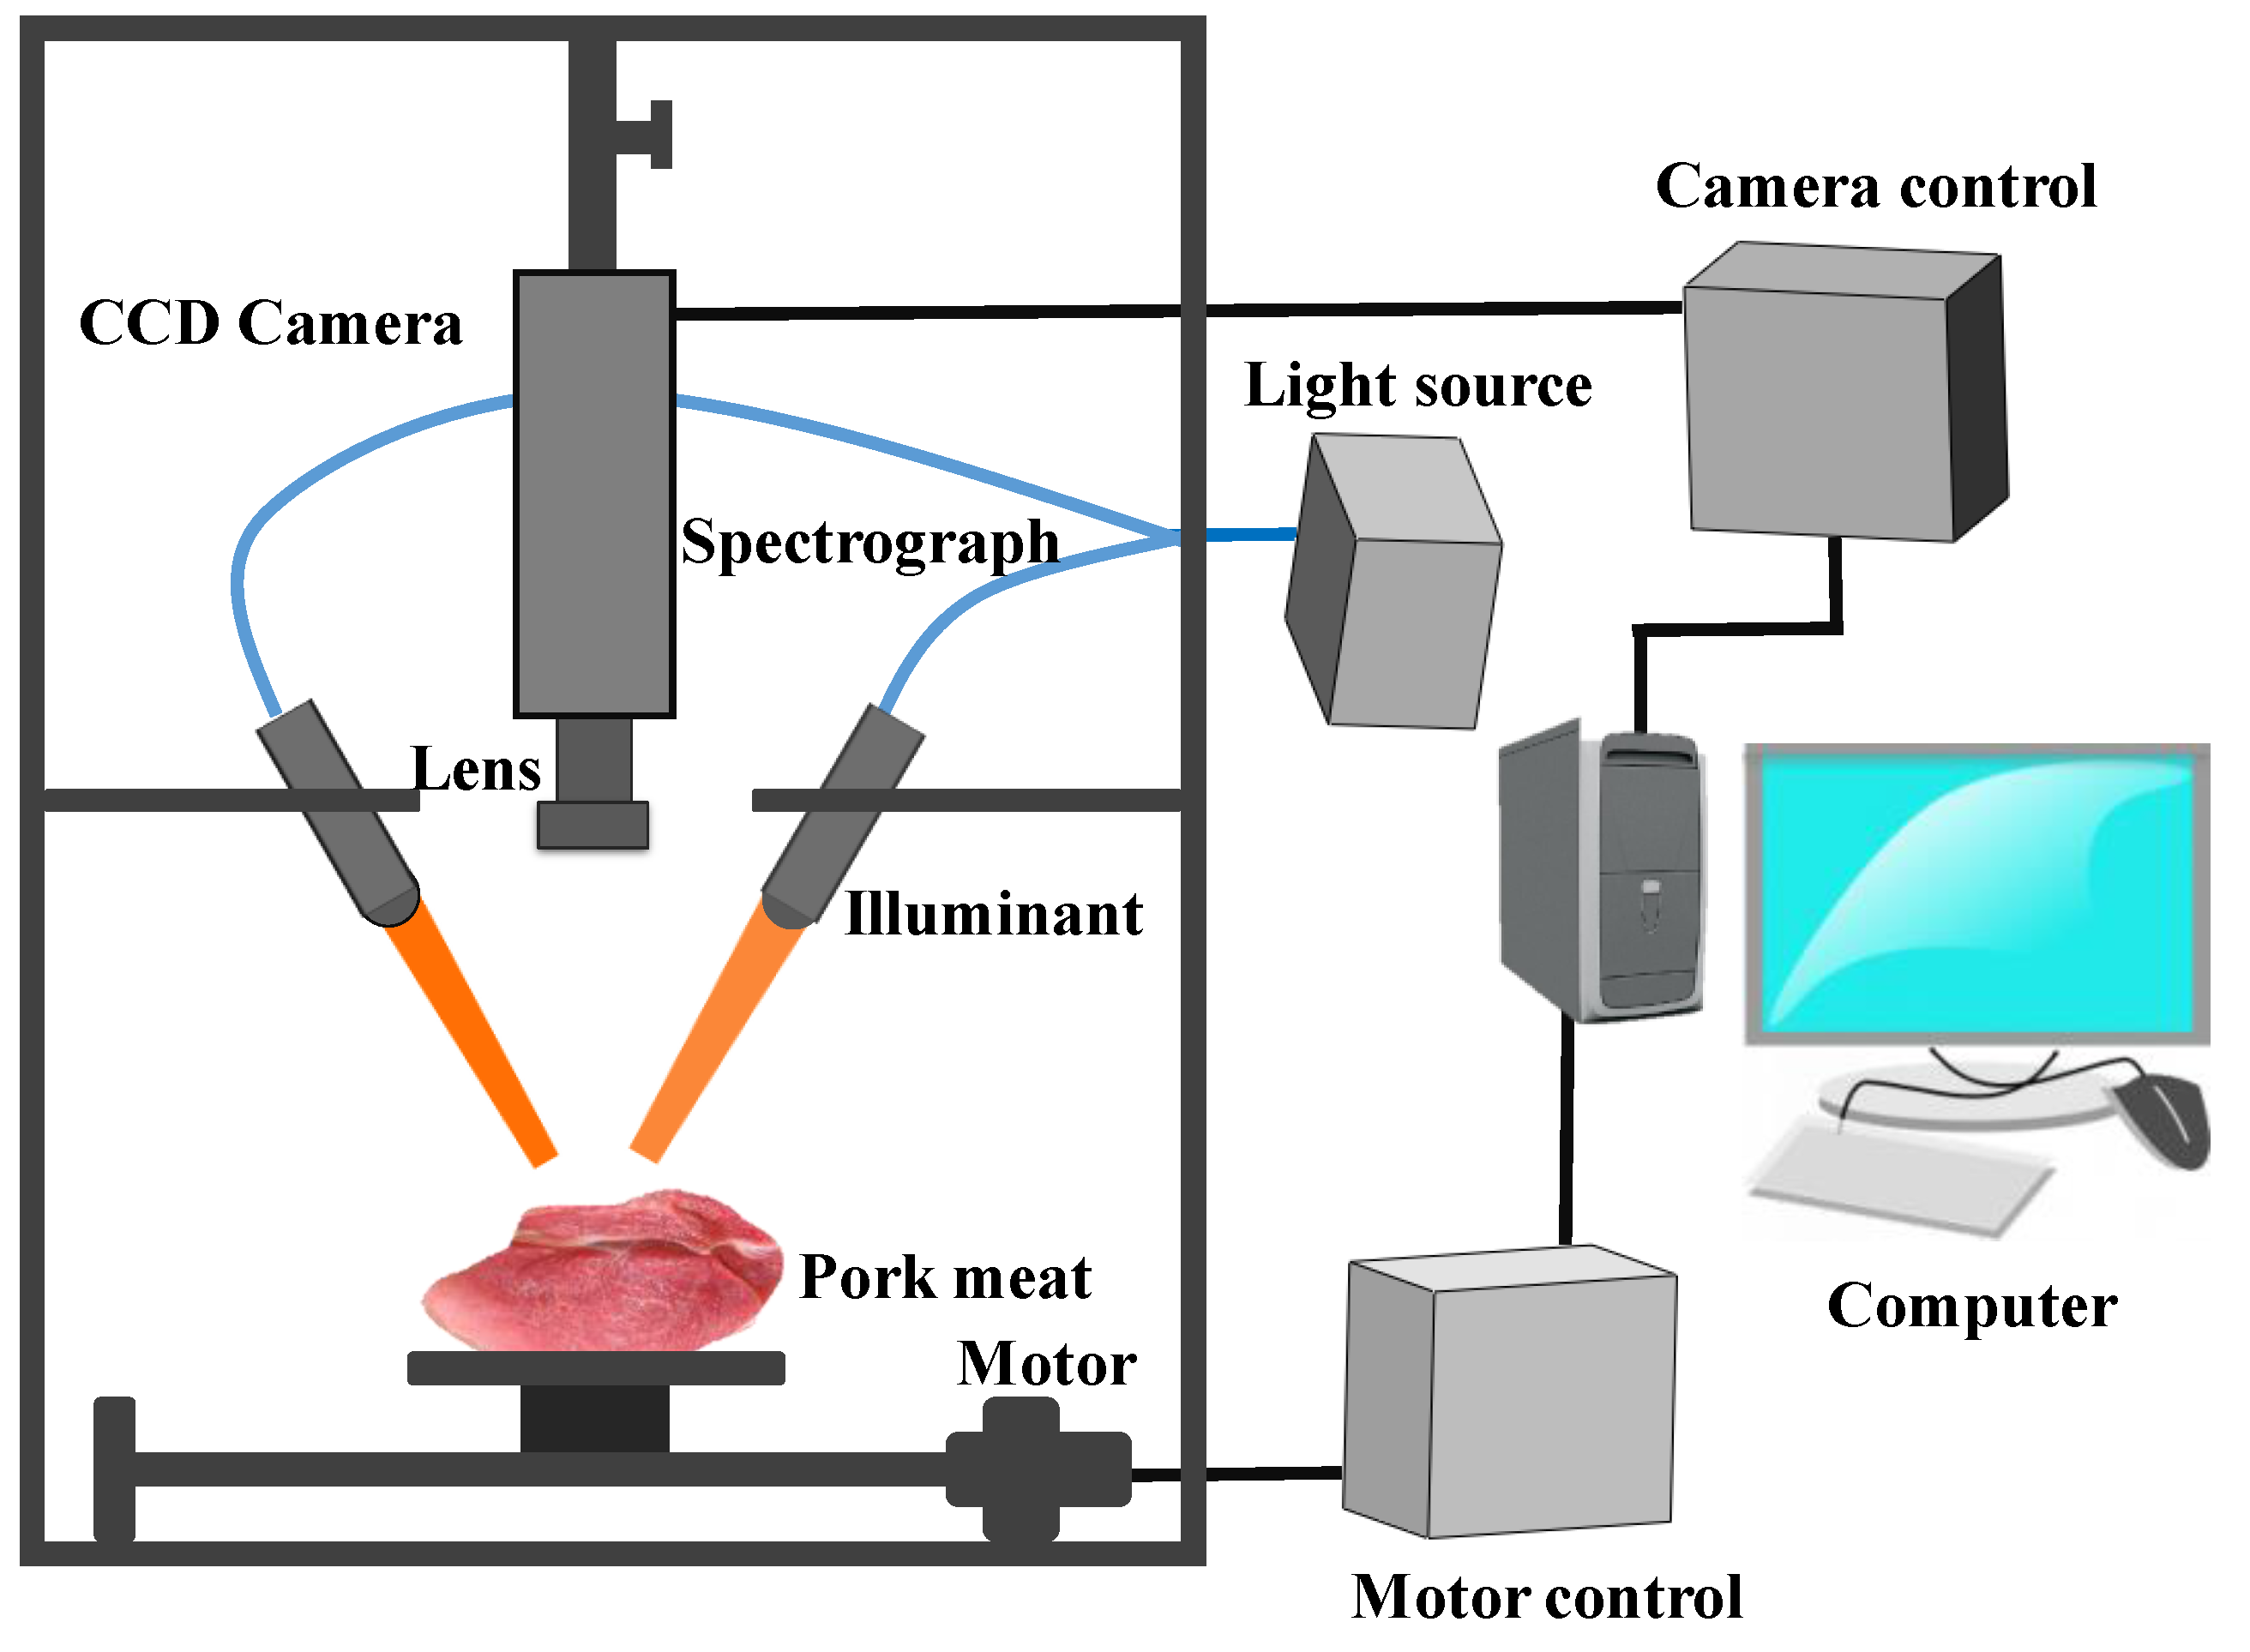
A visible/near-infrared (VIS/NIR) hyperspectral imaging system (Figure 1) in the spectral range of 400–1100 nm was used in this study. A line illumination source with fiber bundle structure was equipped for better imaging. The hyperspectral imaging system was mainly composed of a high-performance back-illuminated 12-bit charge coupled device (CCD, charge coupled device) camera (Sensicam QE, PCO AG, Kelheim, Germany), an imaging spectrograph (ImSpector V10E, Spectral Imaging Ltd., Oulu, Finland), an illumination unit (Oriel Instruments, Stratford, CT, USA) equipped with a quartz tungsten halogen lamp and optical fiber, a laser displacement sensor (CD33-120N-422, OPTEX, Rancho Dominguez, CA, USA), a computer supported with a data acquisition and control software (Camera Control Kit V2.19, PCO AG, Kelheim, Germany), Microsoft Visual Studio 2010 (Microsoft Corporation, Redmond, WA, USA) and OpenCV 2.4.10 (Willow Garage, Inc., Palo Alto, CA, USA), and a translation stage (horizontal and vertical) operated by stepper motor (AH-STA03300, NEWLABS CO, LTD, Beijing, China). The optical fiber was used to transform the light and form a line of light on the surface of the sample. The whole system was maintained in a dark sealed container to avoid the effects of external light. The resolution of the system was 2.8 nm spectrally and 150 μm spatially. The image generated by this system was of 1376 × 1040 (spatial × spectral) pixels originally, and 2 × 2 binning was performed on the final images of 688 × 520 to improve the signal-to-noise ratio of the images.
Then, pork meat samples were tiled on the black board at room temperature for 30 min. With the system described above, the samples were placed on the translation stage, and the vertical height of the camera from the sample was adjusted according to the preset height. Then, each sample was scanned line by line with 80 ms exposure time according the total length of the pork meat sample to build a hypercube. The scan speed of the system was about 50 mm/s, considering the exposure time and data processing. A hypercube with three dimensions (x, y, λ) was achieved for every sample, which the x-dimension of the cube stands for the length of one line (688 pixels in this study), the y-dimension of the cube stands for the line number which reflects the scanning length of the sample, and the λ-dimension stands for the 520 bands in the range of 400–1100 nm. In this way, each pixel of the hyperspectral image represents a spectrum.

2.3. Measurement of TVC

The number of viable bacteria on the pork meat sample was measured immediately after hyperspectral image acquisition by using the national standard method of China (GB/T 4789.2, 2010). Meat (25 g) was cut and weighed from the middle area of the sample with a sterilized knife, and then transferred into a homogeneous cup with 225 mL phosphate buffer solution. Then, a 1:10 dilution was obtained. Serial dilutions were prepared with the 1:10 dilution and phosphate buffer solution. Two or three suitable diluents were selected for bacteria culture according to estimation of the pollution status of the sample. One milliliter of specimen was drawn into a sterile plate with a duplicate plate. At the same time, 1 mL blank phosphate buffer solution was drawn into a plate for blank control, with a duplicate plate as well. Then, 15–20 mL culture medium that was cooled to 46 °C was quickly deposited into the plate timely. All the plates were rotated to mix evenly, and were then cultured for 48 ± 2 h at 36 ± 1 °C after the medium was cooled and solidified. After cultivation, the plate with TVC count in range of 30 to 300 was counted and calculated in terms of colony-forming units (CFU) per gram.

2.4. Spectral Data Extraction and Analysis

All the spectral images were processed through the following procedures using MATLAB 8.3 and ENVI 5.1. Dark correction and white correction were carried out on the raw sample images. The dark image was acquired by covering a dark cap with very low reflectance to the lens of the CCD camera. The white reference image was acquired with a white Teflon board. Then, the corrected reflectance images were calculated by the following Equation 1:
R = I 0 - B r I r - B r ,
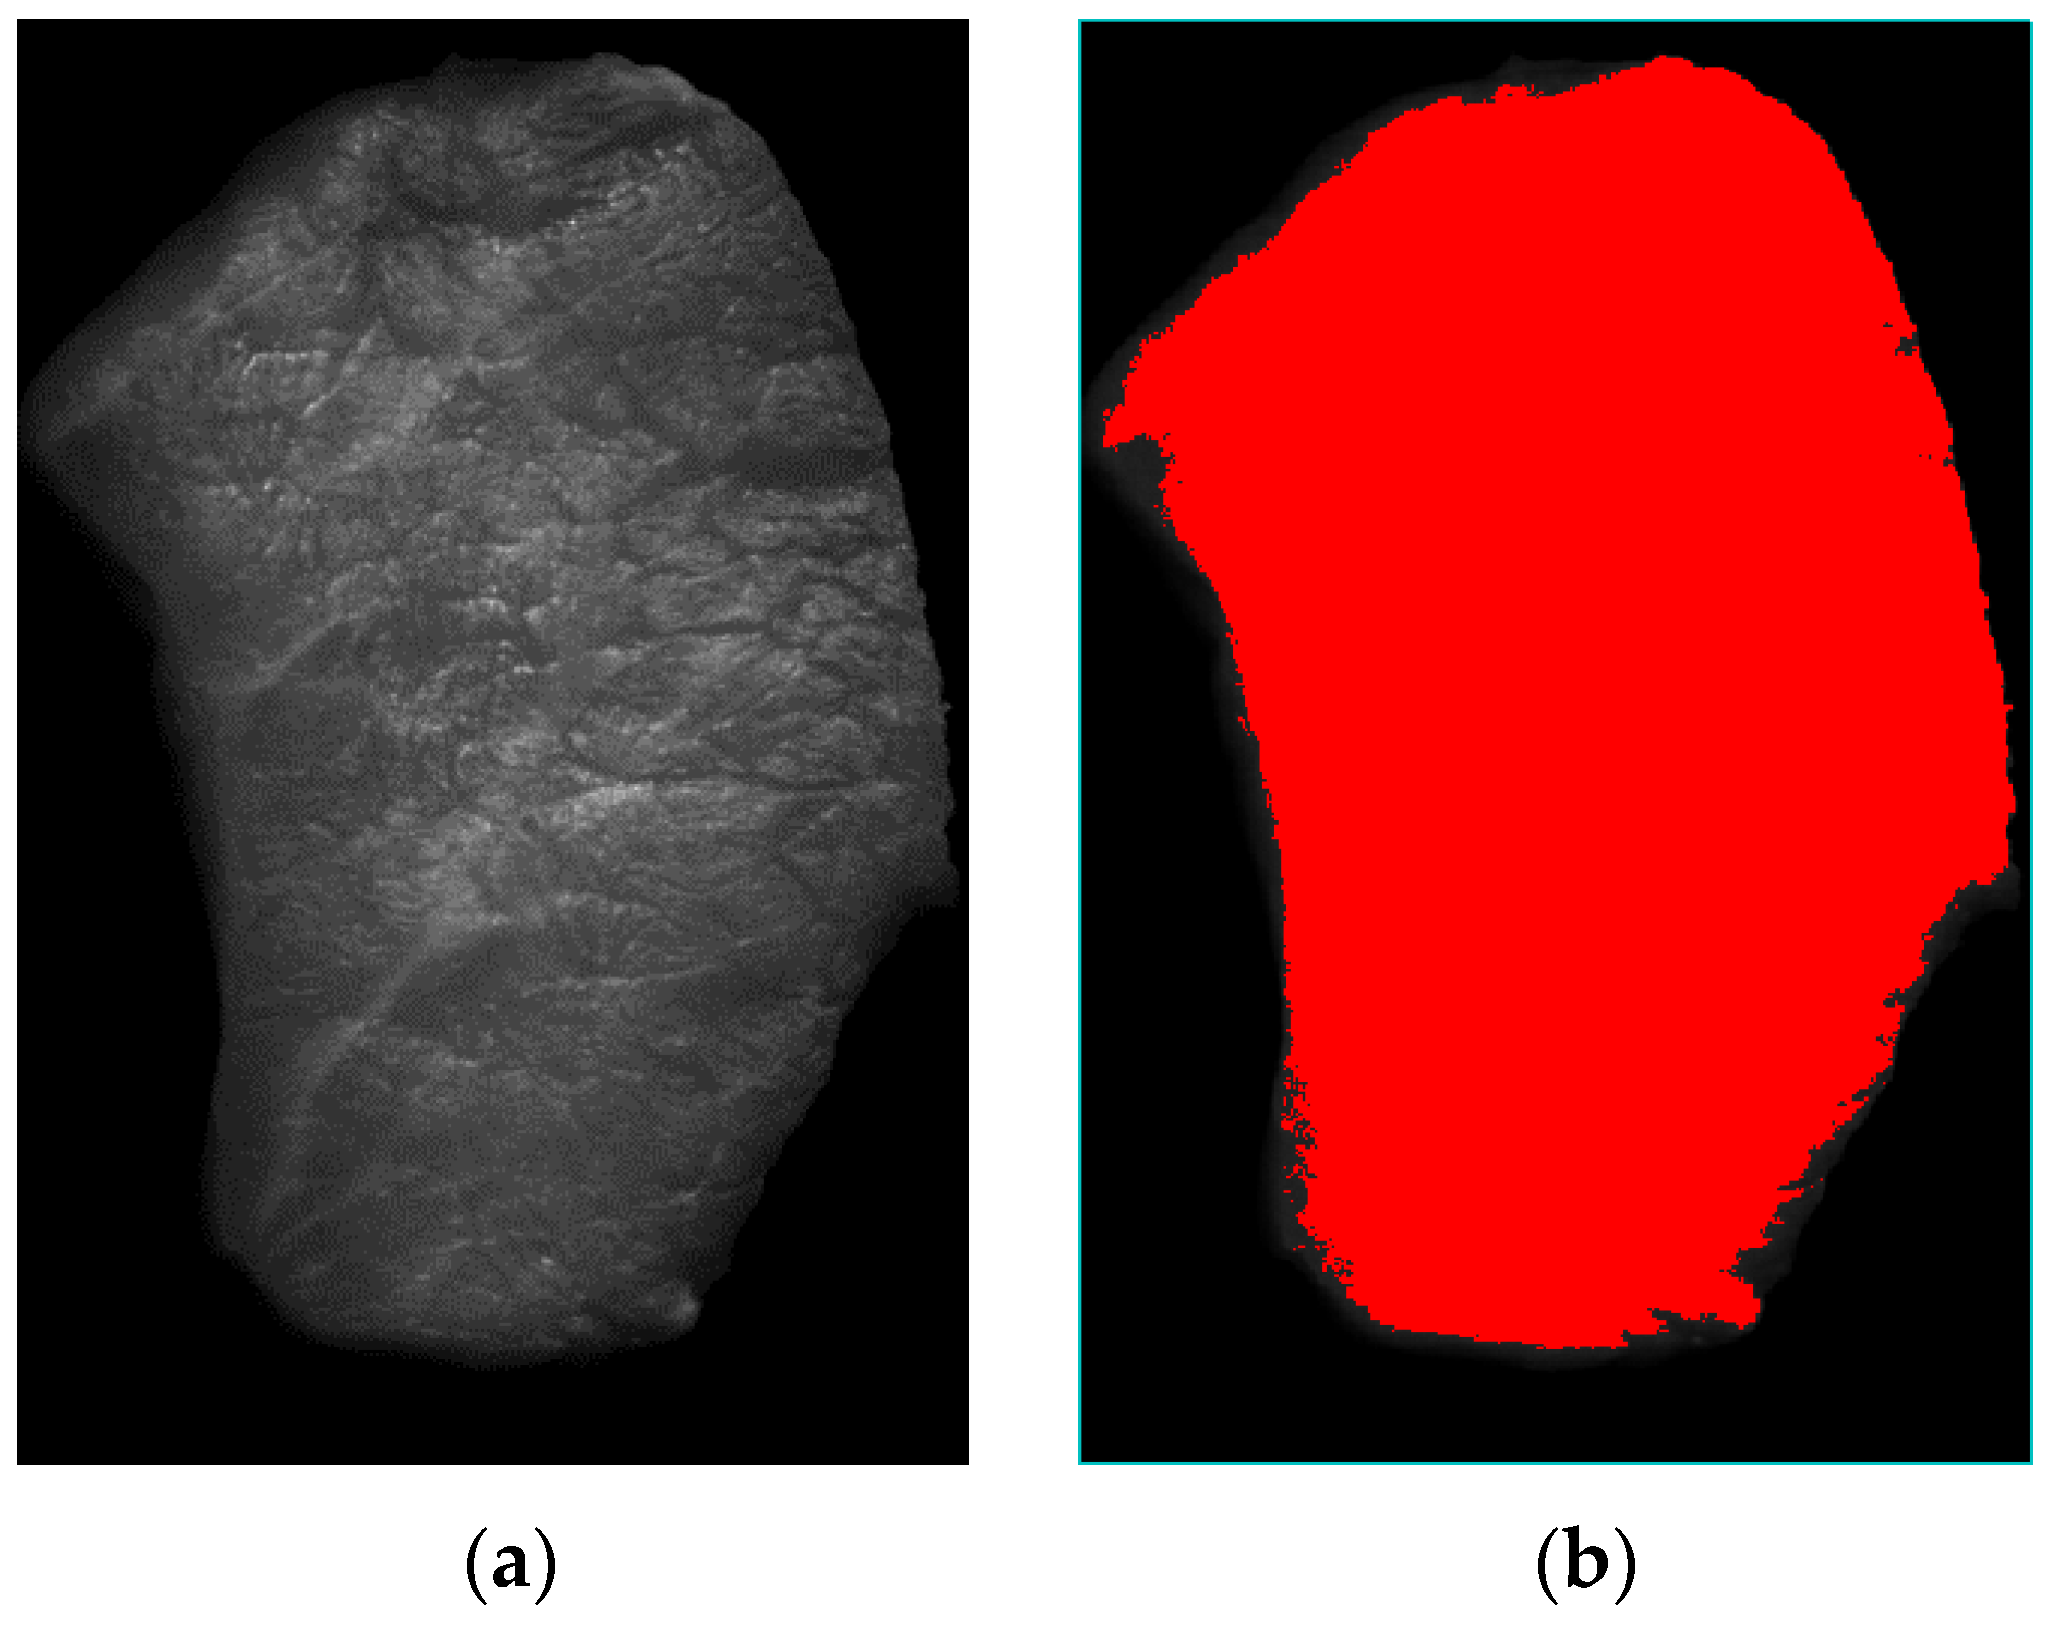
where R is the corrected reflectance image of the sample, I0 is the raw spectral image of the samples, Br is the dark reference image, and Ir is the white reference image. Then, the region of interest (ROI) and segmentation of the images were implemented at the same time to extract the spectra of the samples by setting three thresholds in the reflectance image—two of them were set for all pixels at 651 nm as 0.50 for maximum value and 0.25 for minimum value, the last one was set with the ratio value of 651 nm and 550 nm and 1.20 for minimum value. Figure 2a shows a grayscale image at band 651 nm, and the segmentation was confirmed relatively well as shown in Figure 2b, which was chosen to be the ROI at the same time. Then, the mean reflectance spectrum of the ROI was extracted to be the spectrum of the sample. The reflectance spectra of all samples were finally obtained by the above procedures.
In this study, two methods were used to establish the prediction model of total bacterial count. Support vector machine regression (SVR) [15] could make the regression problem simpler by mapping the low dimensional nonlinear problem into a high dimensional linear problem based on kernel function. At the same time, SVR can account for both the training accuracy and generalization ability by the maximum distance method based on structural risk minimization principle. The method has been widely used in many fields, such as classification, regression, and face recognition, etc. Partial least squares regression (PLSR) [16] is a linear and supervised multivariate calibration method that attempts to find fewer factors that can predict the microbial counts from the reflectance values at various wavelengths. PLSR is particularly suited when the matrix of predictors has more variables than number of samples, and when there is a high correlation among the original predictors. Therefore, these two mathematical approaches were adopted as modeling methods for comparison. The better one was used to predict the microbial contamination in pork samples and for spatial visualization of the results within the sample.
3. Results and Discussion

3.1. Results of Microbial Measurement

The total bacterial counts of the pork meat samples were measured during 15 days of storage at a temperature of 4 °C. Before modeling, all 50 samples were divided into two subsets with the following process: first, all samples were sorted in to order according to their respective TVC values; then, one sample of every four samples was selected into the prediction set. Eventually, the calibration set contained 38 samples and the prediction set contained 12 samples. The TVC statistics of all samples are shown in Table 1. It illustrates the TVC range of the pork meat with different storage time. As is shown in Table 1, the minimum TVC value and maximum TVC value were 3.00 and 9.20 log CFU/g, respectively, in the present study. This means the TVC range of the total set sample covered about 6.20 log CFU/g from min to max. The great variations would contribute to the establishment of the prediction model.

3.2. Spectra of the Fresh and Spoiled Samples

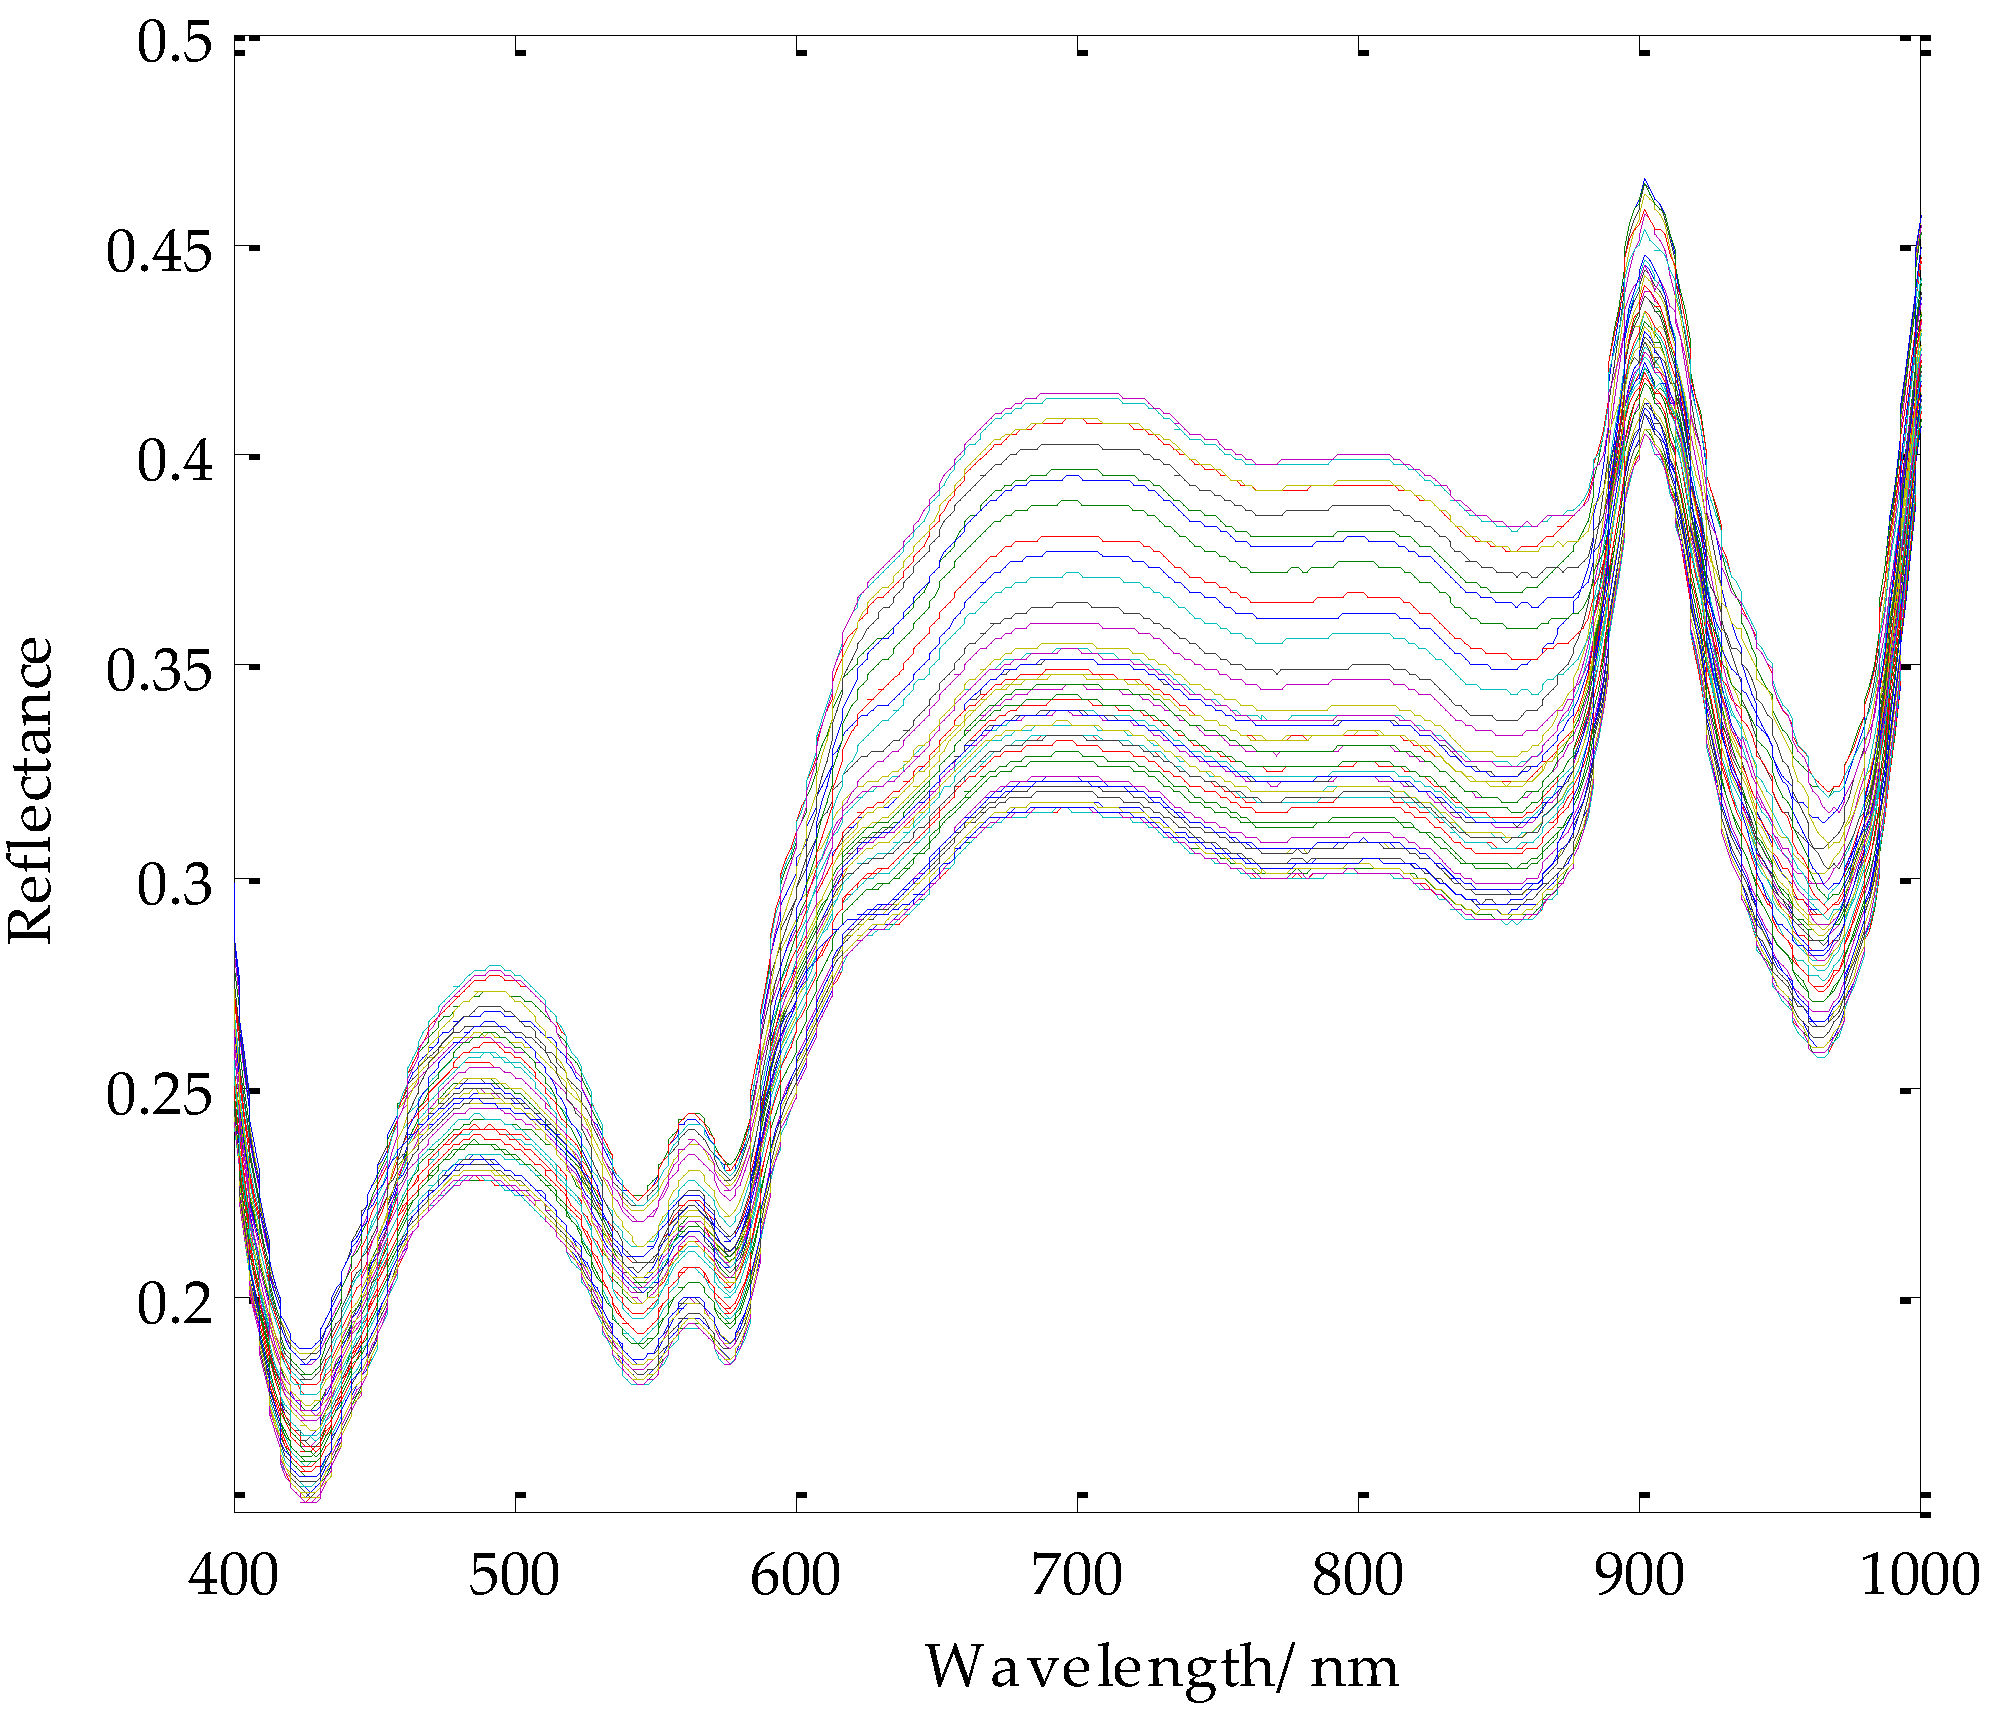
The spectra were truncated from 400 to 1000 nm in order to remove the noise and invalid information. The reflection spectra of the samples were summarized in Figure 3. As is shown in Figure 3, the spectral reflectance after 900 nm became relatively abnormal, this is due to an application of lens that could better remove noise. Moreover, the hyperspectral images of the samples were all corrected by Equation 1 , shown as follows in Figure 3.

3.3. Prediction Results of the Model

As is mentioned above, in order to obtain an accurate and efficient model for the detection of TVC in pork meat using hyperspectral image technology, two approaches including SVR and PLSR were studied systematically and comparatively. At the same time, some typical spectral preprocessing methods, such as standard normalize transformation (SNV), multiple scatter correction (MSC), first derivative (1D), second derivative (2D), haar transformation (HT), and centering transformation (CT) were all applied to improve the accuracy of the prediction model. Meanwhile, only one pre-treatment was used at one time here to reduce the calculation; the hyperspectral data volume is very large especially when acquisition is continuous. The statistical results are shown in Table 2.
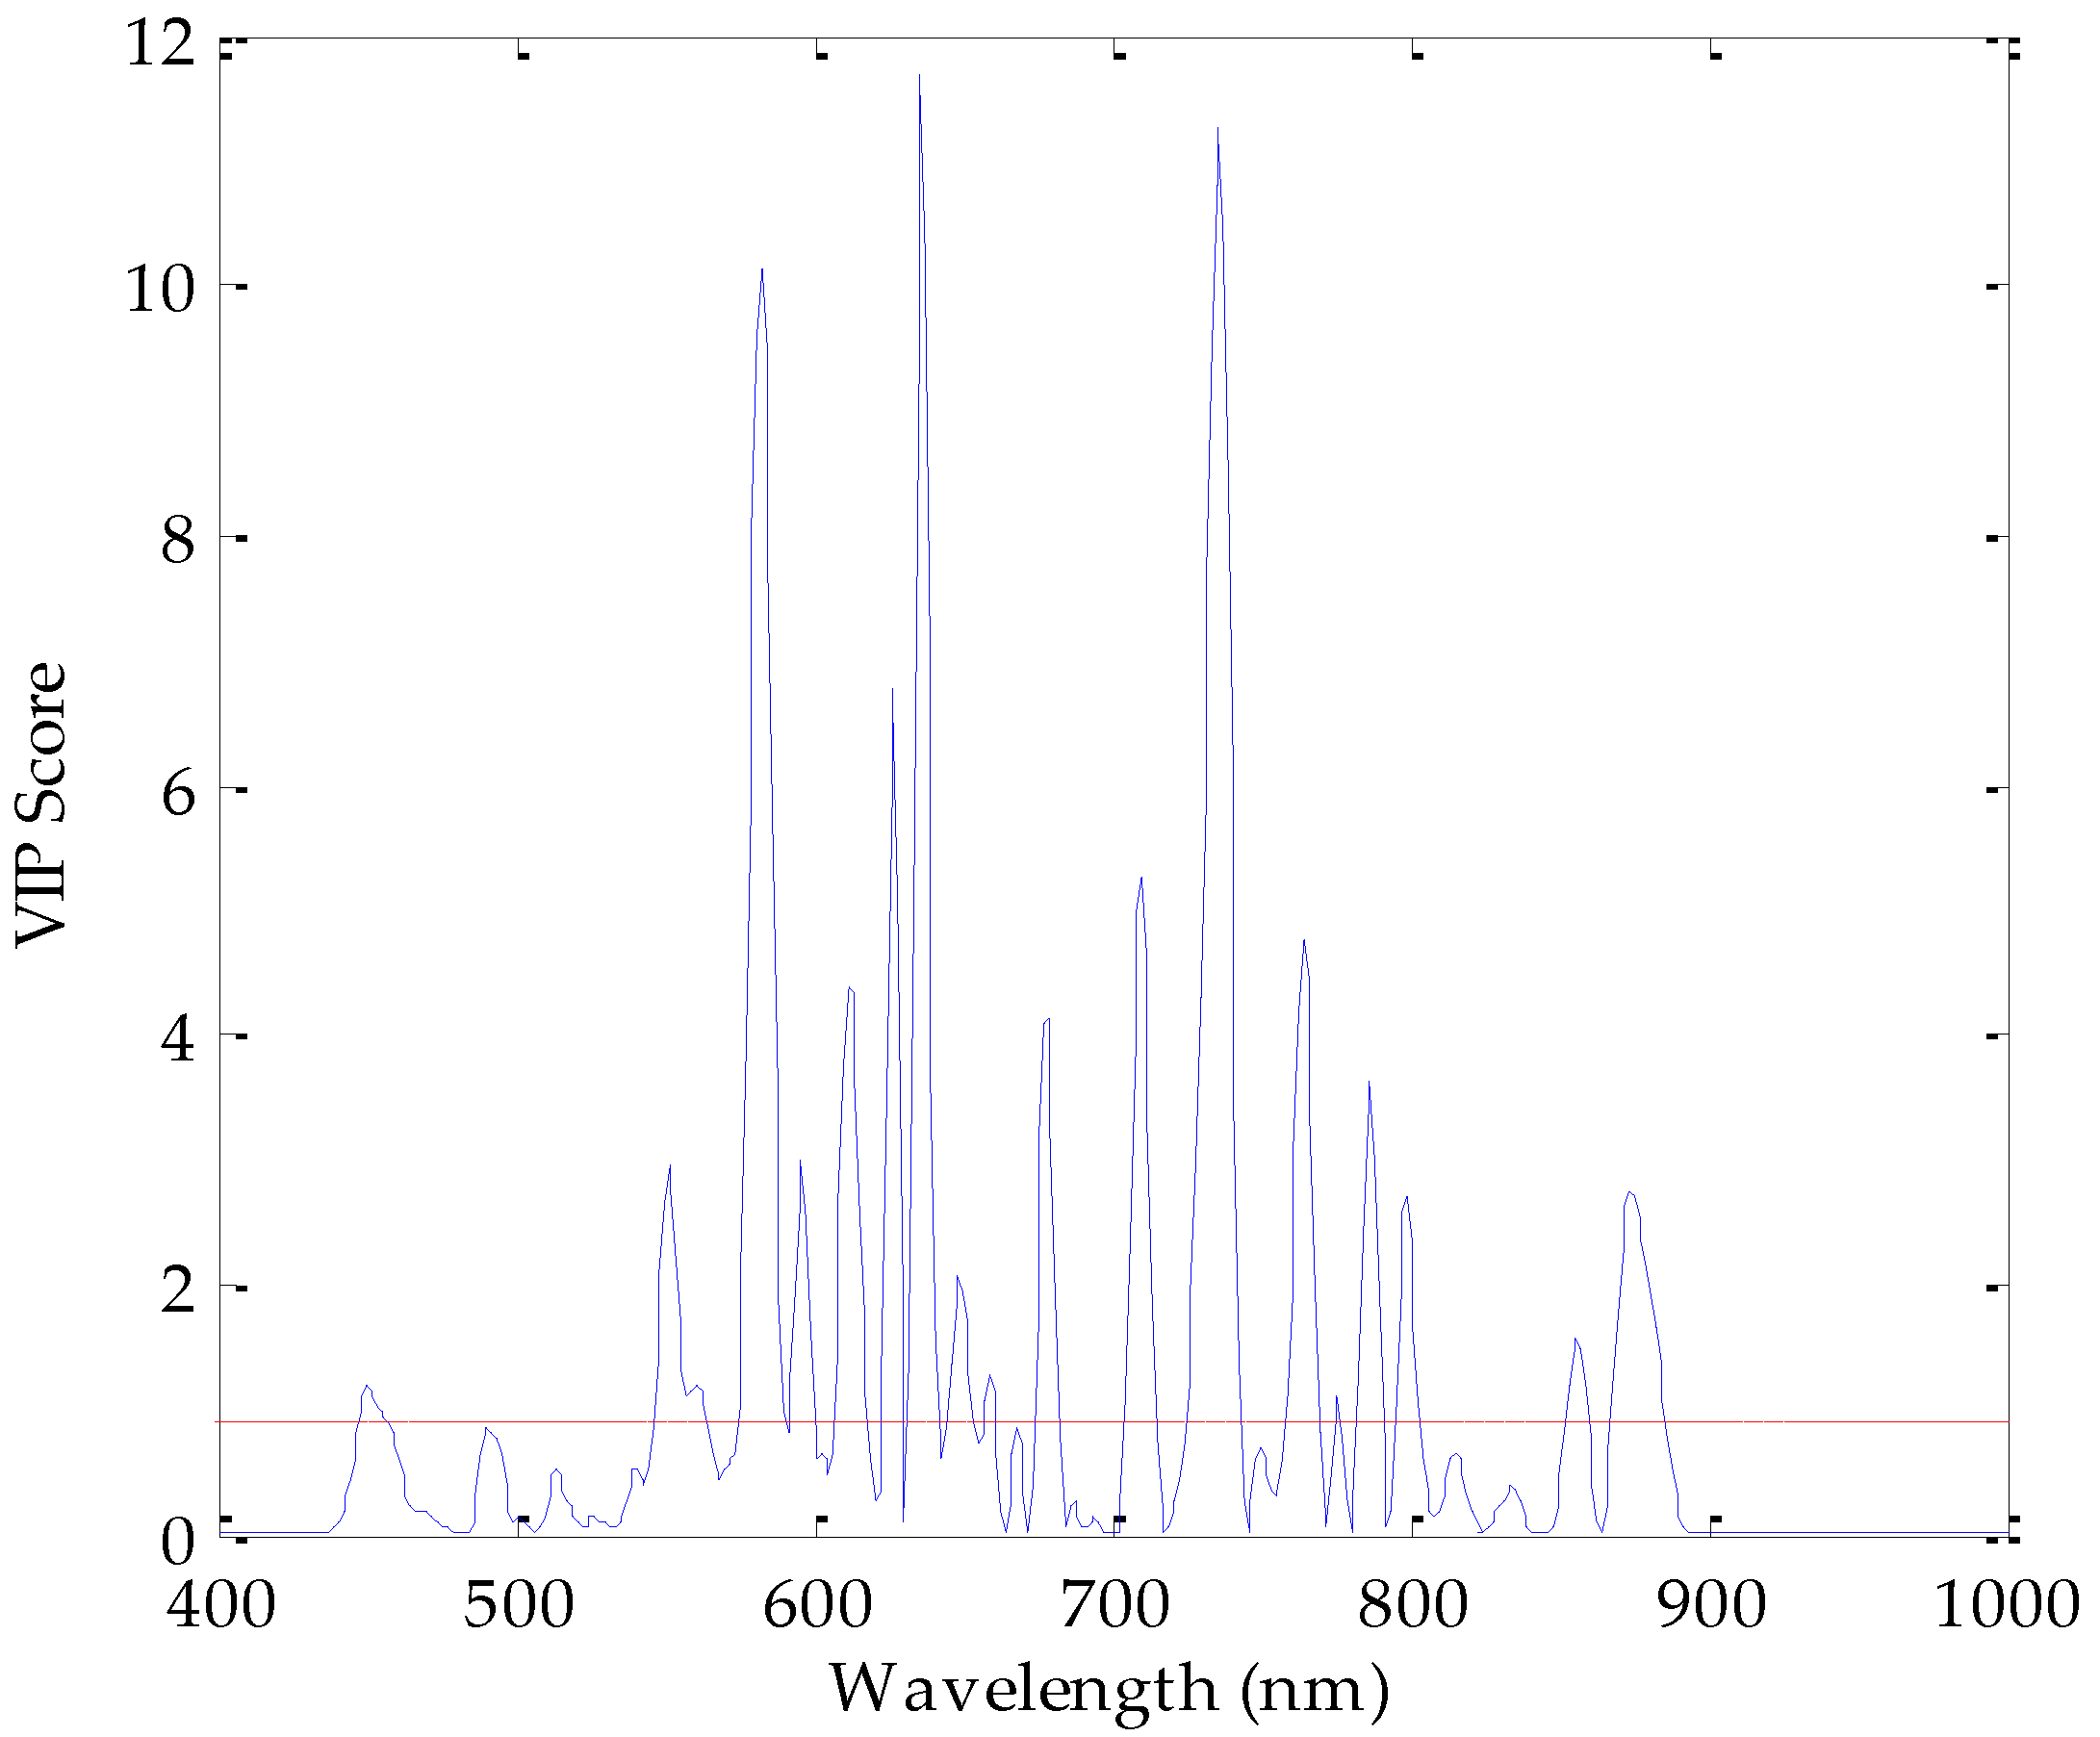
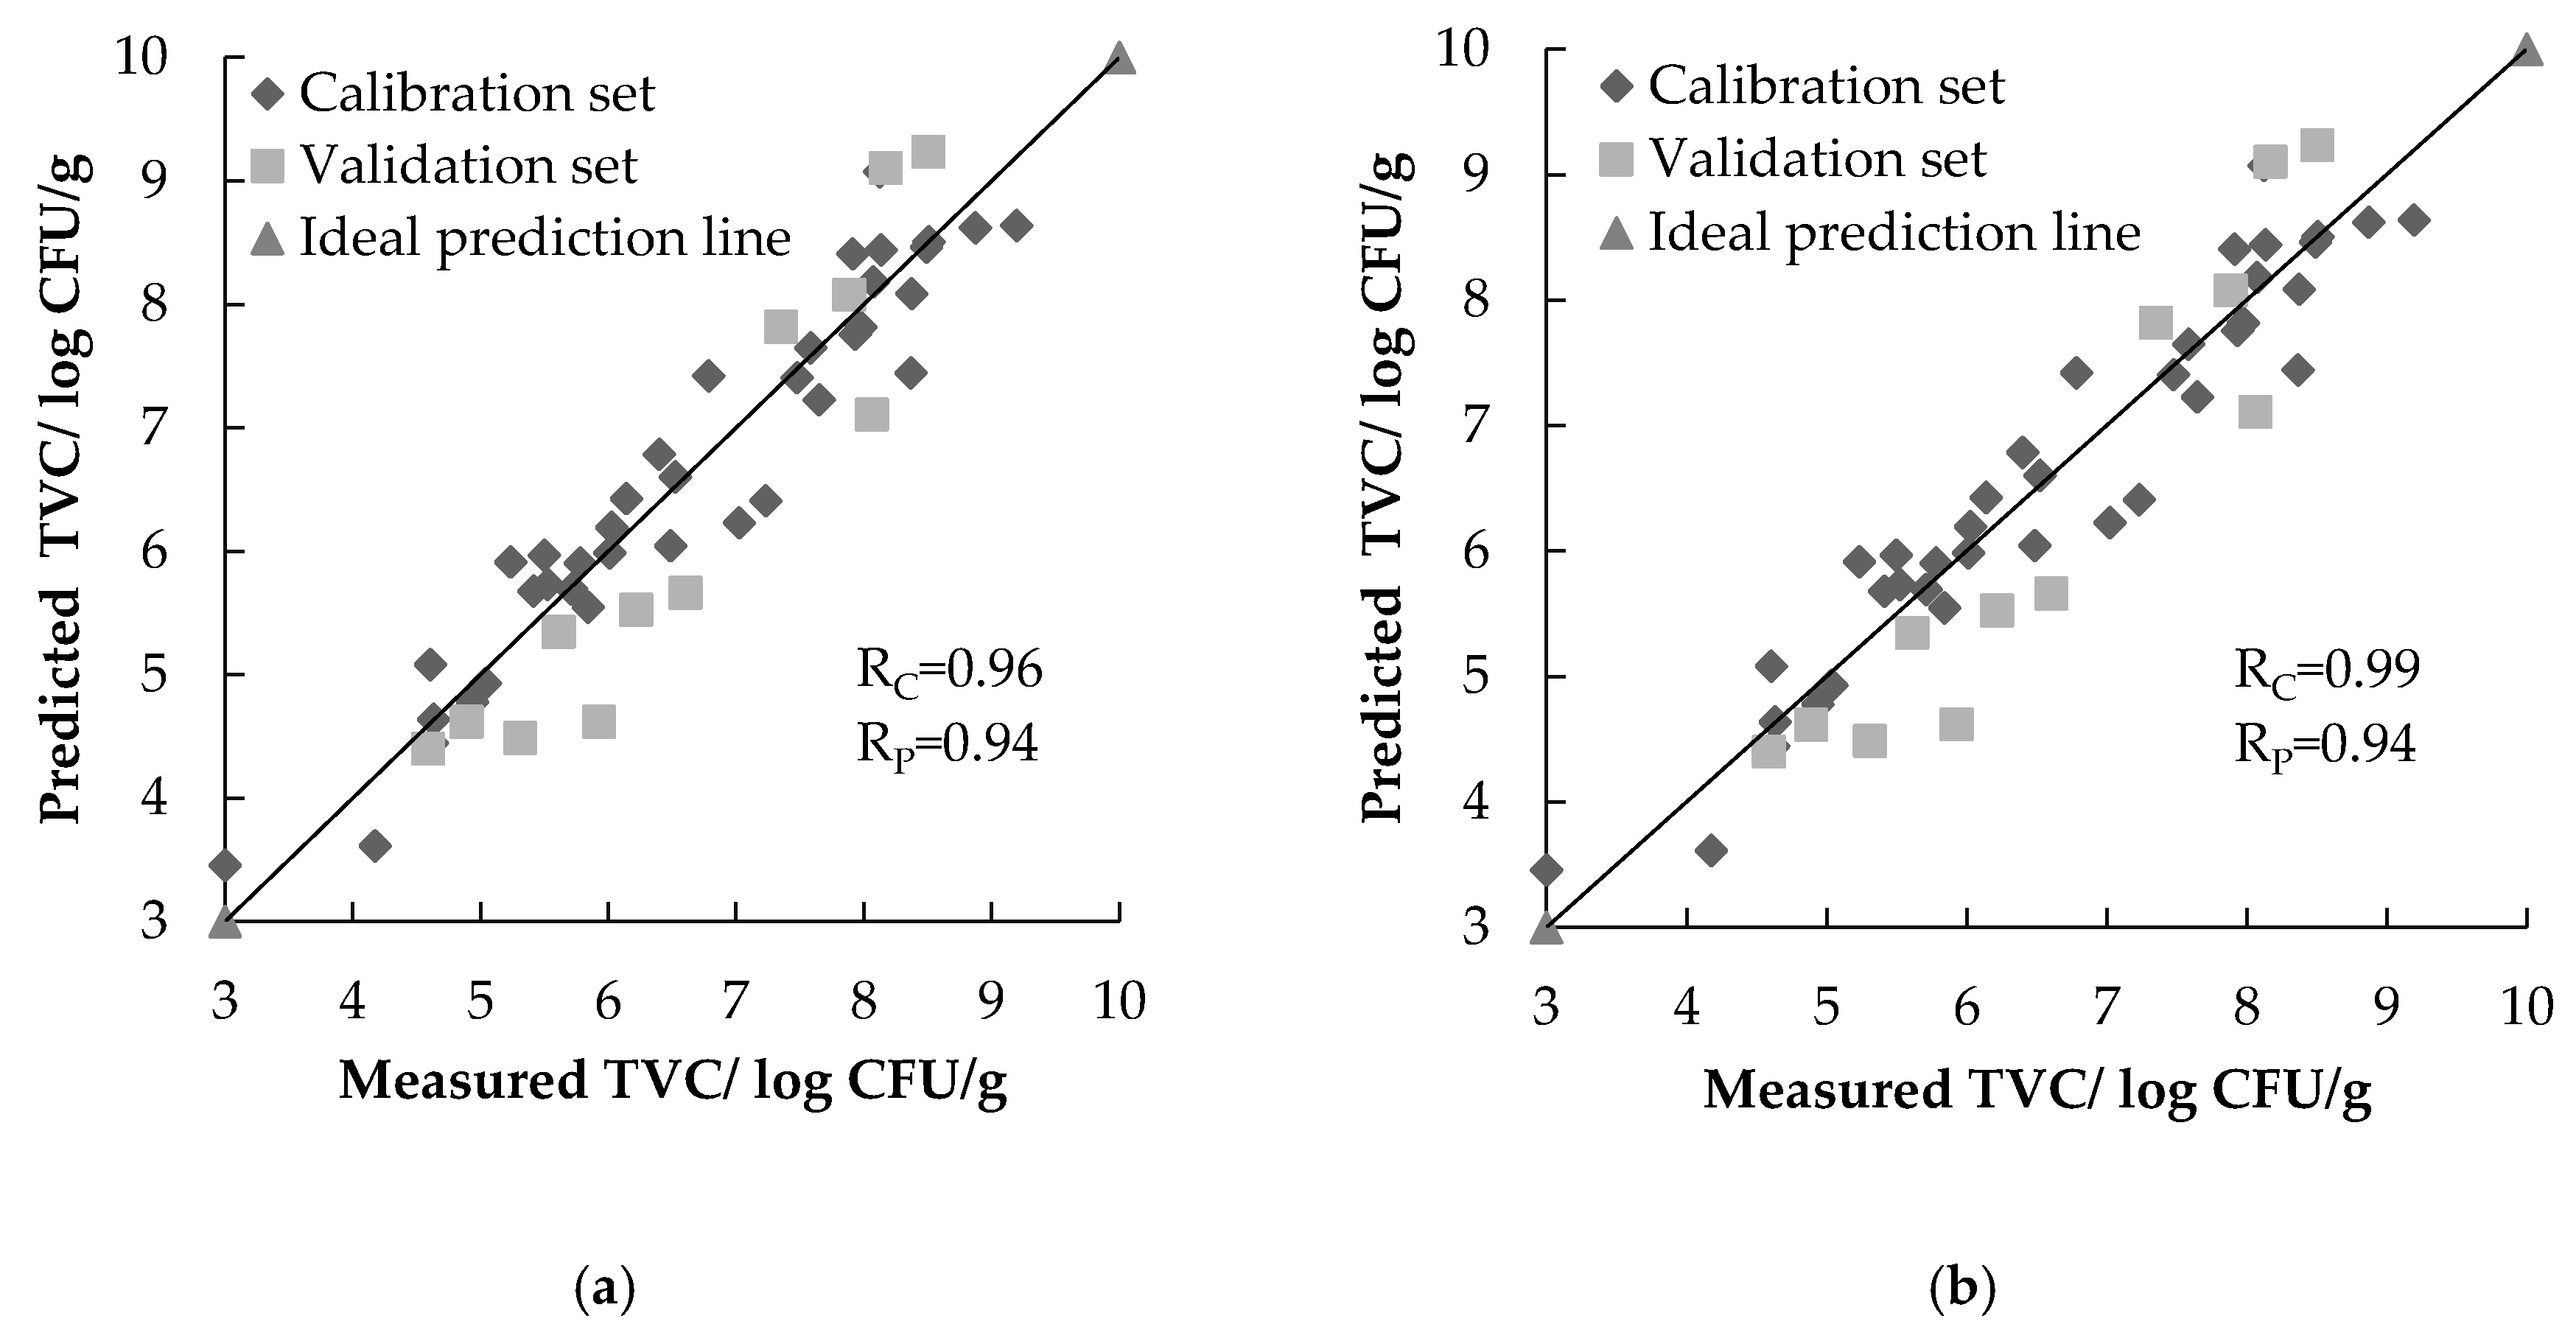
As is shown in Table 2, it was demonstrated that the PLSR model with 2D had better performance than those of the other pretreatments, with the higher correlation coefficients of 0.99 and 0.94 as well as the lower SE (standard error) of 0.4198 and 0.7374 log CFU/g for calibration set and prediction set, respectively. As is shown in Figure 4, peaks in the VIP (Variable importance projection) score plot of the optimized PLSR model provided the information about the chemical components responsible for the reproduction of bacteria. For instance, the peak near 715 nm was the fourth overtone of Aromatic Hydrocarbon C-H stretching. The wavelength near 730 nm was assigned to moisture absorption, corresponding to the O-H stretching third overtone., and the band located at approximately 760 nm was related to the fourth overtone of C-H stretching. Figure 5a is a scatter plot that shows a correlation between reference measurement and the best PLSR model predicted in the calibration and prediction sets. The best SVR model with 2D achieved the highest correlation coefficients of 0.99 and 0.94 as well as the lowest SE of 0.0004 and 0.4570 for calibration set and prediction set, respectively. Figure 5b is a scatter plot that shows a correlation between reference measurement and best SVR model predicted in the calibration and prediction sets. According to the comparison of the PLSR model and the SVR model, the SVR model with 2D pretreatment was selected as the final prediction model of TVC in pork meat with hyperspectral image technology.

3.4. Visualization of TVC in Pork Meat

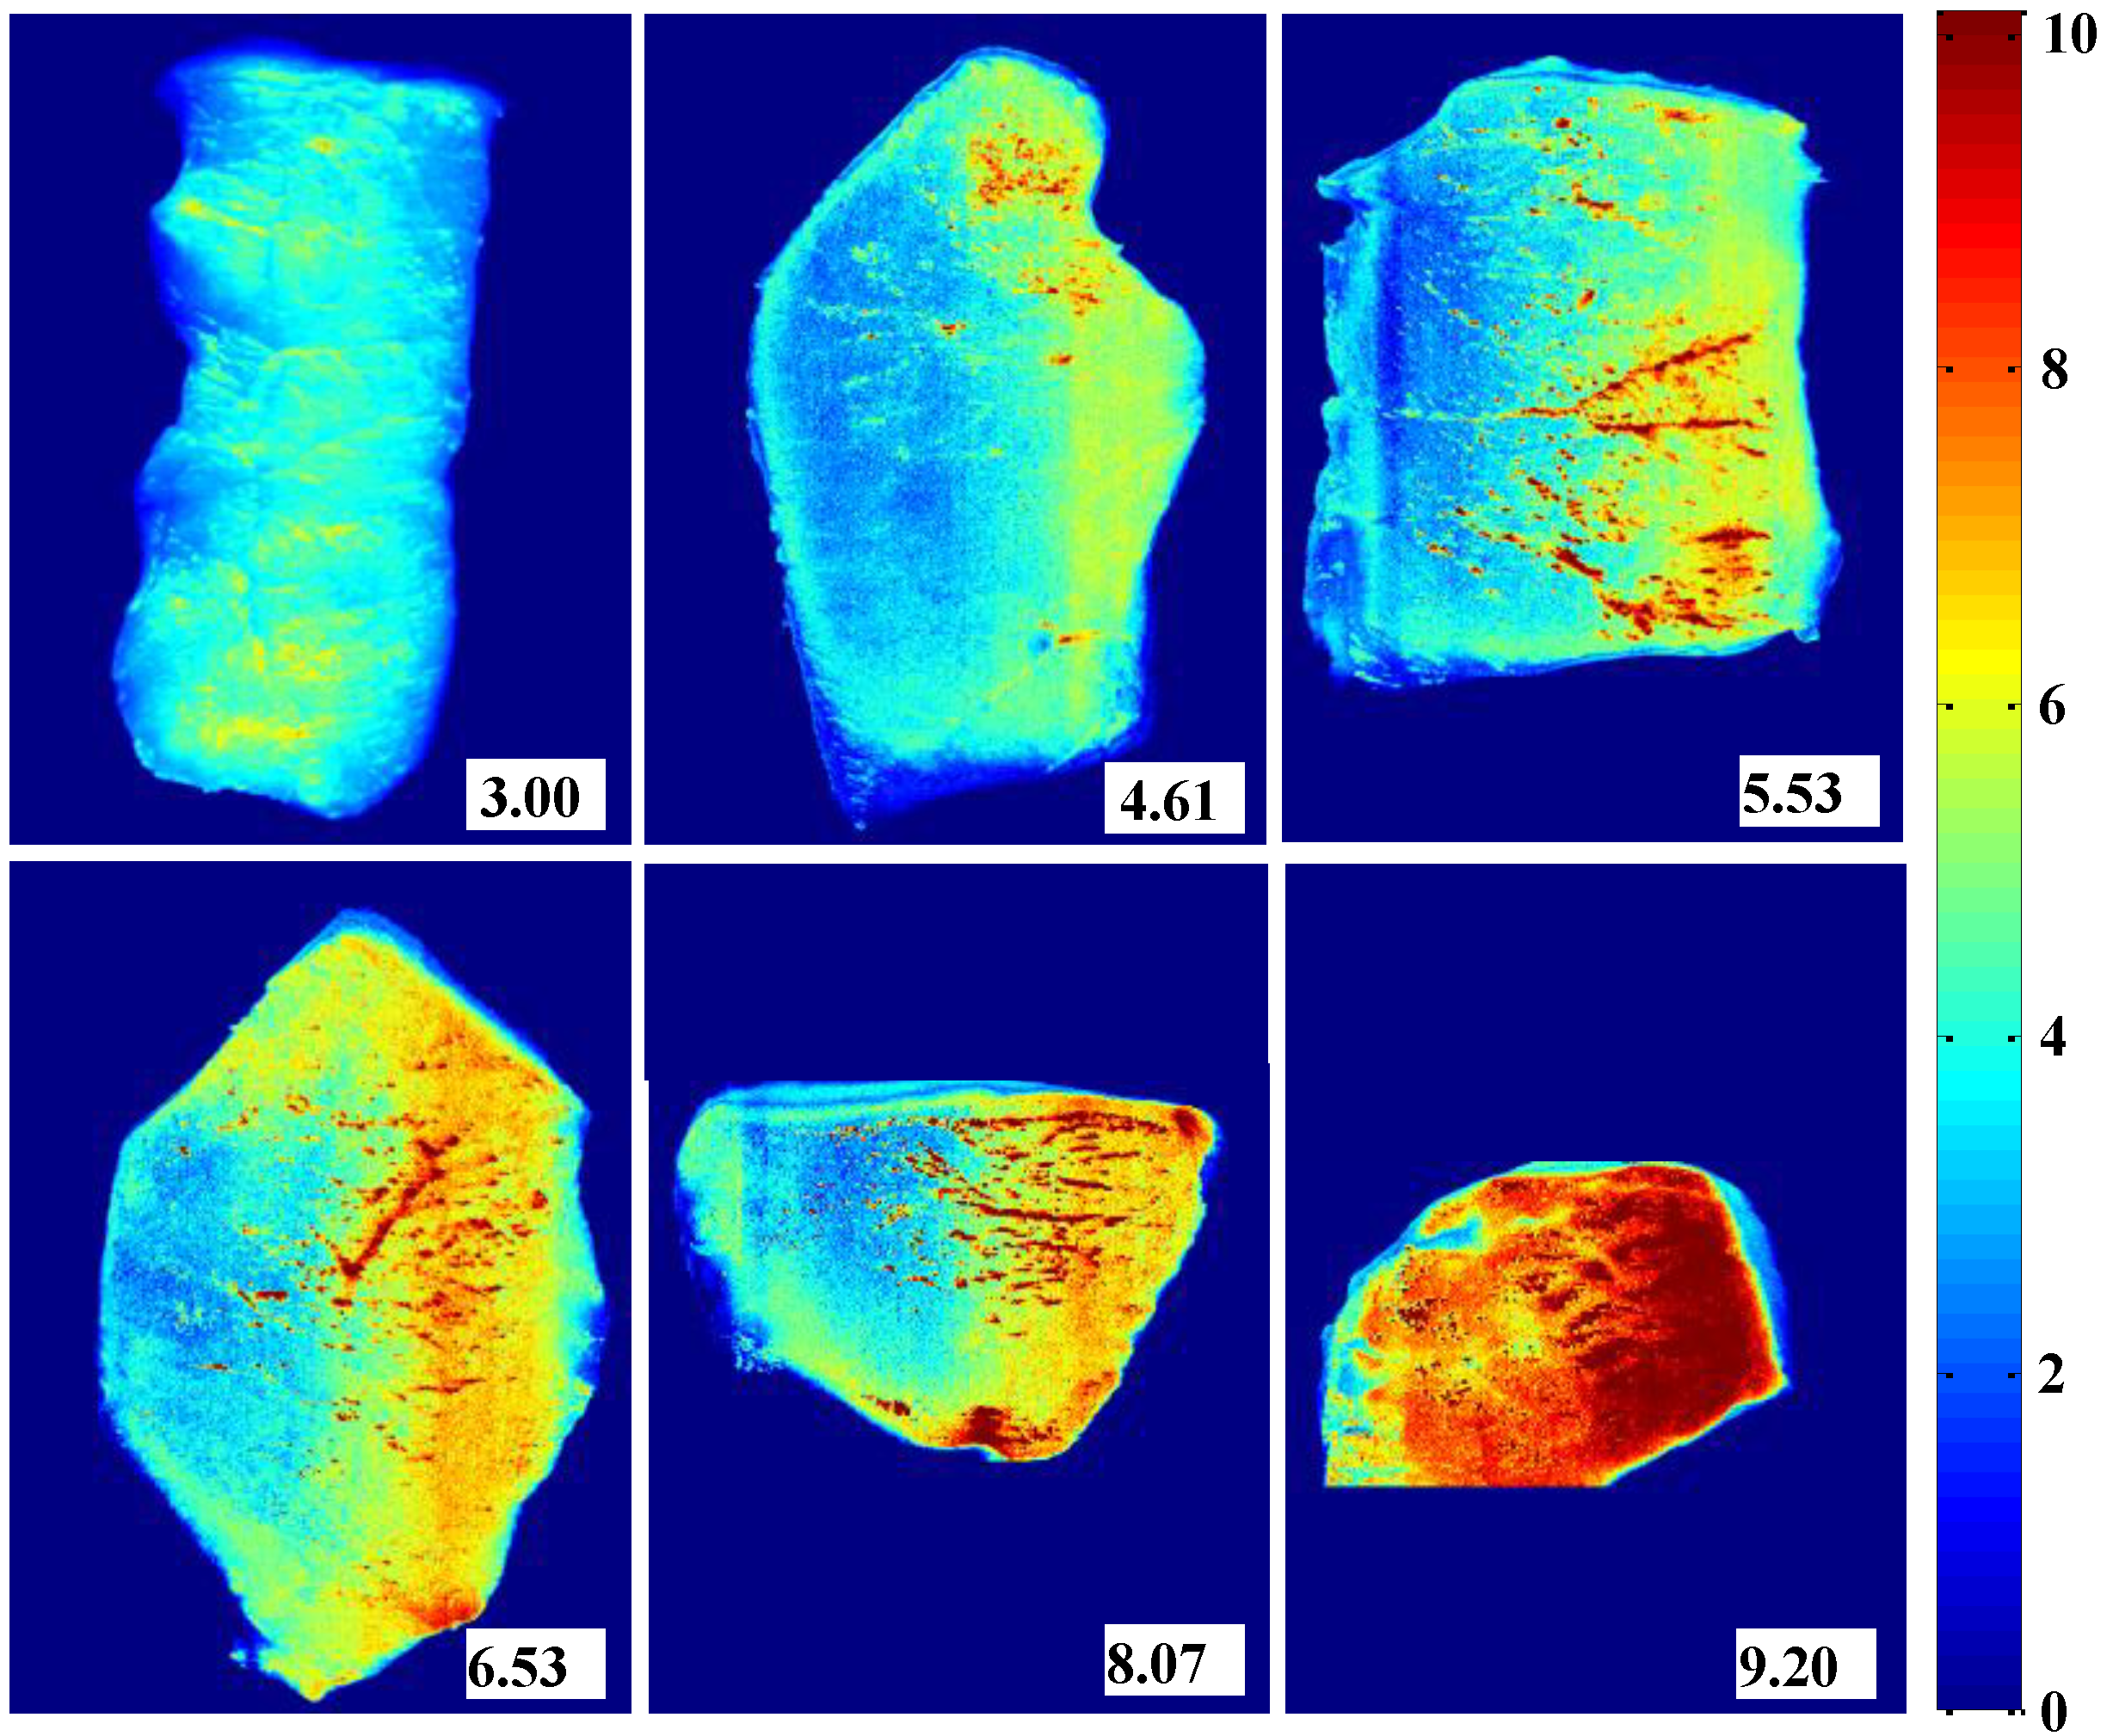
Visualization of the TVC in pork meat was achieved by transferring the optimal SVR model to every pixel of the sample image. There is no need to build the hypercube every time in the real-time detection by applying the optimal model to image that acquired in every scan line, which obtaining 688 prediction value of 688 pixel. Figure 6 shows the results of plugging the final PLSR model to the hyperspectral images of pork meat samples from different storage times. The spatial distribution of viable bacteria in pork meat can be observed clearly through the visualization map. As is shown in Figure 6, the change from deep blue to deep red represents the change of TVC from 0 to 10 log CFU/g. However, in the present study, the effective prediction range of total bacterial count is from 3 to 9.20, which is determined by the TVC range of the sample belonging to the established model. Therefore, the visualization map of TVC can be obtained in real-time due to the real-time data processing.

4. Conclusions

In this study, a novel and concise method was developed for nondestructive and real-time detection of TVC in pork meat. Visible/near-infrared hyperspectral imaging in range 400–1000 nm was applied to build the prediction model of the TVC in pork meat. PLSR and SVR with various pretreatment methods were used to build the prediction model. The best model was obtained by the SVR with second derivation, with the highest correlation coefficients of 0.99 and 0.94 for calibration set and prediction set, respectively. Thus, the SVR model was selected to be the final model for efficient detection and visualization. The distribution map of TVC in pork meat was performed by applying the final model to the hyperspectral image with assessed samples. Real-time detection of TVC in pork meat is realized by programming all the data process and applying the concise model in real time. The study demonstrates that the visible/near-infrared hyperspectral imaging can be applied in the nondestructive real-time detection TVC in pork meat due to the good regression models between the TVC and the spectral data. Further work on the detection of other meat parameters could be achieved using the same method developed in this work.

Acknowledgments

The authors gratefully acknowledge National Key Research and Development Program (Project No. 2016YFD0401205), China, for providing funding support for this research.

Author Contributions

Xiaochun Zheng and Yankun Peng conceived and designed the experiments; Xiaochun Zheng performed the experiments; Xiaochun Zheng and Wenxiu Wang analyzed the data; Xiaochun Zheng wrote the paper.

Conflicts of Interest

The authors declare no conflict of interest.

References

  1. GB/T 4789.2 Microbiological Examination of Food Hygiene-Detection of Aerobic Bacterial Count; China National Standard (2010); Standards Press of China: Beijing, China, 2012.
  2. Microbiology of Food and Animal Feeding Stuffs. In Horizontal Method for the Enumeration of Microorganisms. Colony Count Technique at 30 °C; EN ISO 4833; ISO: Geneva, Switzerland, 2003.
  3. Morita, H.; Ushiyama, M.; Aoyama, S.; Iwasaki, M. Sensitivity and specificity of the sanita-kun aerobic count: Internal validation and independent laboratory study. J AOAC Intern. 2003, 86, 355–366. [Google Scholar]
  4. Firstenberg-Eden, R. Rapid estimation of the number of microorganisms in raw meat by impedance measurements. Food Technol. 1983, 37, 64–70. [Google Scholar]
  5. García, S.; Heredia, N. Clostridium perfringens: A dynamic food borne pathogen. Food Bioprocess Technol. 2011, 4, 624–630. [Google Scholar] [CrossRef]
  6. Severgnini, M.; Cremonesi, P.; Consolandi, C.; De Bellis, G.; Castiglioni, B. Advances in DNA microarray technology for the detection of food borne pathogens. Food Bioprocess Technol. 2011, 4, 936–953. [Google Scholar] [CrossRef]
  7. Tao, F.F.; Wang, W.; Li, Y.Y.; Peng, Y.K.; Wu, J.H.; Shan, J.J.; Zhang, L.L. A rapid nondestructive measurement method for assessing the total plate count on chilled pork surface. Spectrosc. Spect. Anal. 2010, 30, 3405–3409. [Google Scholar]
  8. Peng, Y.K.; Zhang, J.; Wang, W.; Li, Y.Y.; Wu, J.H.; Huang, H.; Gao, X.; Jiang, W. Potential prediction of the microbial spoilage of beef using spatially resolved hyperspectral scattering profiles. J. Food Eng. 2011, 102, 163–169. [Google Scholar] [CrossRef]
  9. Tao, F.; Peng, Y. A nondestructive method for prediction of total viable count in pork meat by hyperspectral scattering imaging. Food Bioprocess Technol. 2014, 8, 17–30. [Google Scholar] [CrossRef]
  10. Huang, L.; Zhao, J.; Chen, Q.; Zhang, Y. Rapid detection of total viable count (TVC) in pork meat by hyperspectral imaging. Food Res. Int. 2013, 54, 821–828. [Google Scholar] [CrossRef]
  11. Barbin, D.F.; ElMasry, G.; Sun, D.W.; Allen, P.; Morsy, N. Non-destructive assessment of microbial contamination in porcine meat using NIR hyperspectral imaging. Innovative Food Sci. Emerg. Technol. 2013, 17, 180–191. [Google Scholar] [CrossRef]
  12. Feng, Y.Z.; Sun, D.W. Determination of total viable count (TVC) in chicken breast fillets by near-infrared hyperspectral imaging and spectroscopic transforms. Talanta 2013, 105, 244–249. [Google Scholar] [CrossRef] [PubMed]
  13. Wang, W.; Peng, Y.; Huang, H.; Wu, J. Application of hyper-spectral imaging technique for the detection of total viable bacteria count in pork. Sens. Lett. 2011, 9, 1024–1030. [Google Scholar] [CrossRef]
  14. Wang, W.; Peng, Y.; Zhang, X. Study on modeling method of total viable count of fresh pork meat based on hyperspectral imaging system. Spectrosc. Spect. Anal. 2010, 30, 411–415. [Google Scholar]
  15. Vapnik, V.; Golowich, S.; Smola, A. Support Vector Method for Function Approximation, Regression Estimation, and Signal Processing. Adv. Neural Inf. Process. Syst. 1996, 9, 281–287. [Google Scholar]
  16. Boulet, J.-C.; Bertrand, D.; Mazerolles, G.; Sabatier, R.; Roger, J.-M. A family of regression methods derived from standard PLSR. Chemom. Intell. Lab. Syst. 2013, 120, 116–125. [Google Scholar] [CrossRef]
Figure 1. Visible/near-infrared (Vis/NIR) hyperspectral imaging system. CCD: charge-coupled device.
Applsci 07 00213 g001
Figure 2. Grayscale image at 651nm and segmentation of ROI of meat sample: (a) Grayscale image at band 651 nm; (b) Segmentation of ROI. ROI: region of interest.
Applsci 07 00213 g002
Figure 3. Raw spectra of all the pork meat samples from the first day to the fifteenth day; the spectra are the averaged value of the ROI.
Applsci 07 00213 g003
Figure 4. VIP score values calculated from partial least square regression (PLSR) model based on 2D. The solid horizontal line was set by the threshold value 1. VIP: Variable importance projection.
Applsci 07 00213 g004
Figure 5. Results of optimum PLSR model and SVR model between the predicted total viable bacteria count (TVC) value and the reference measurement values: (a) Result of the best PLSR model; (b) Result of the best SVR model. SVR: support vector machine regression.
Applsci 07 00213 g005
Figure 6. Visualizing maps of TVC in different samples at different levels of contamination with different TVC values of 3.00, 4.61, 5.53, 5.53, 8.07, 9.20 log CFU/g respectively from top to bottom and left to right.
Applsci 07 00213 g006
Table 1. Results of total viable count (TVC) in pork samples that include calibration set and prediction set by reference method.
Data SetSample Number (log CFU/g)Minimum (log CFU/g)Maximum (log CFU/g)Range (log CFU/g)Mean (log CFU/g)
Total set503.009.206.206.61
Calibration set383.009.206.206.61
Prediction set124.598.513.926.60
Table 2. Results of prediction models (partial least squares regression (PLSR) model and support vector machine regression (SVR) model) with different pre-treatments. SNV: standard normalize transformation; MSC: multiple scatter correction; 1D: first derivative; 2D: second derivative; HT: haar transformation; CT: centering transformation; SEC: standard error of calibration set; SEP: standard error of prediction set.
ModelsPre-treatmentCalibration SetPrediction Set
RCSECRPSEP
PLSRRaw spectra0.950.46280.920.9520
SNV0.960.42210.900.9807
MSC0.960.42340.900.9803
1D0.950.48760.940.8187
2D0.960.41980.940.7374
HT0.950.46280.920.9520
CT0.970.40550.910.8709
SVRRaw spectra0.870.77410.720.9419
SNV0.980.29290.940.6297
MSC0.990.26670.940.5903
1D0.990.08810.950.5264
2D0.990.00040.940.4570
HT0.840.83550.631.0397
CT0.870.77410.720.9419