1. Introduction
The major characteristics of an axial flow fan are high efficiency, low noise, and large flow rate. As a result, usually, axial-flow fans are installed for the purpose of heat dissipation in large-sized equipment to meet the needs of a spacious working environment and the wide-spread airstream. Nowadays, an axial flow fan is used extensively in the lower-resistance system for the purpose of ventilation, and its large flow rate has additional benefits, causing convection in the spacious environment. Because more heat transformation is necessary in a large area, the characteristic of convection in a large area is the reason why families always utilize an axial-flow fan (stand fan) in the living area.
To improve the axial-flow fan’s performance, previous experimental investigations [
1] have identified several important factors, such as the blade profile, blade setting angle, and tip clearance. In 1992, Venter and Kroger [
2] conducted an extensive experiment to evaluate the effect of tip clearance on the performance of the axial-flow fan. Their conclusion indicates that the tip clearance effects are dependent on the rotor type and its size, as well as the blade shape and number. Hence, it was well demonstrated that the performance characteristics can be improved by choosing the appropriate blade parameters and reducing tip clearance.
In 2002, a small centrifugal fan was successfully generated for the thermal management of laptop computers by utilizing an integrated scheme, which consists of fan design, mockup manufacture, experimental verification, and numerical simulation. A good agreement between numerical simulation and test results successfully indicates great potential to reduce the expensive experimental work by using CFD (computational fluid dynamics) tools [
3]. Recently, Lin and Tsai [
4,
5,
6] utilized an inverse cascade method to design the performances of centrifugal and axial flow fans. In this study, CFD simulations and experimental measurements are utilized to perform flow visualization, torque calculation, efficiency estimation, and noise analysis.
In 2014, Lin and Hsieh [
7] used the CFD software Fluent to create the model of a fan and carry out a numerical simulation and flow field visualization. The results showed that the unique inhale-return phenomenon happens for an inappropriate housing. Several key parameters, such as fan guard, housing ring, inlet-to-outlet area ratio, and blockage height, are evaluated to find out the criterion necessary to avoid the inhale-return flow. Consequently, the study finds that the fan guard changes the airflow to a wider distribution with a lower velocity.
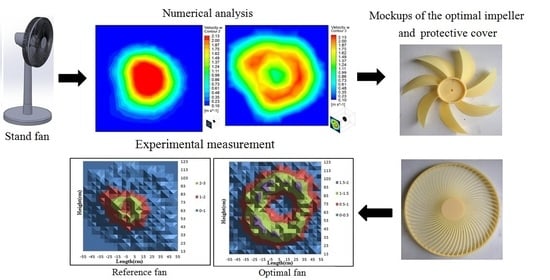
Consequently, through a literature survey about fan design, it is clear that the reliable CFD tool and key design parameters on the axial-flow fan are well established and identified. However, this dependable approach has not been applied on the stand fan, which is an essential appliance in every family. This implies that the stand fan should be investigated and analyzed in a systematical manner to improve its aerodynamic performance and flow characteristics to meet the ventilation demand. Therefore, this study chooses a commonly used 14” stand fan to demonstrate this comprehensive investigation. At first, the design parameters of the rotor and protective cover of the stand fan are systematically examined via a numerical tool to identify the corresponding influence on fan performance. With the aid of a comprehensive parametric study, the optimal fan design is obtained. Furthermore, a mockup of the optimal fan design is fabricated via the CNC technology to test the fan performance. Later, the numerically calculated flow rate and energy efficiency are validated by comparing them with the experimental measurements. Thus, this research intends to establish a reliable and systematic scheme to design the stand fan. Also, the corresponding performance influences caused by those important parameters will be analyzed to serve as the design reference for the stand fan.
2. Numerical Analysis
This study utilized commercial software Fluent [
8], to numerically calculate the flow field for both the impellers and the protective cover of the stand fan. Its calculation is based on SIMPLE (Semi-Implicit Method for Pressure-Linked Equation) proposed by Patankar and Spalding [
9]. The entire flow field of the fan can be simulated by this method to provide the velocity and pressure fields as a basis for further analysis. Also, the finite volume method for the computational zone is adopted to discretize the partial differential equation using a second-order upwind scheme and a
k-ε turbulence model for the three-dimensional incompressible Reynolds-averaged Navier–Stokes equation.
2.1. The Standard k-ε Model
To simplify the complexity of numerical simulation, the incompressible, constant viscosity, and Newtonian fluid are assumed, in order to ignore the minor factors that slightly affected the simulation result. Also, turbulent flows are characterized by fluctuating velocity fields, and cause many eddies due to this fluctuation. With the implementation of turbulence treatment, the incompressible Navier–Stokes equations in adiabatic condition can be expressed as:
where Reynolds stress is modelled by employing the Boussinesq hypothesis [
10]. Furthermore, the turbulent viscosity μ
t is computed as a function of turbulence kinetic energy (
k) and dissipation rate (ε):
where
Gk and
Gb are the turbulent kinetic energies generated by the mean velocity gradients and buoyancy, respectively.
SK and
Sε are the user-defined source terms,
YM represents the contribution of the fluctuating dilatation in the compressible turbulence to the overall dissipation rate, and
Cμ,
C1ε,
C2ε,
C3ε, σ
k, and σ
ε are the model constants [
11].
2.2. Grid System
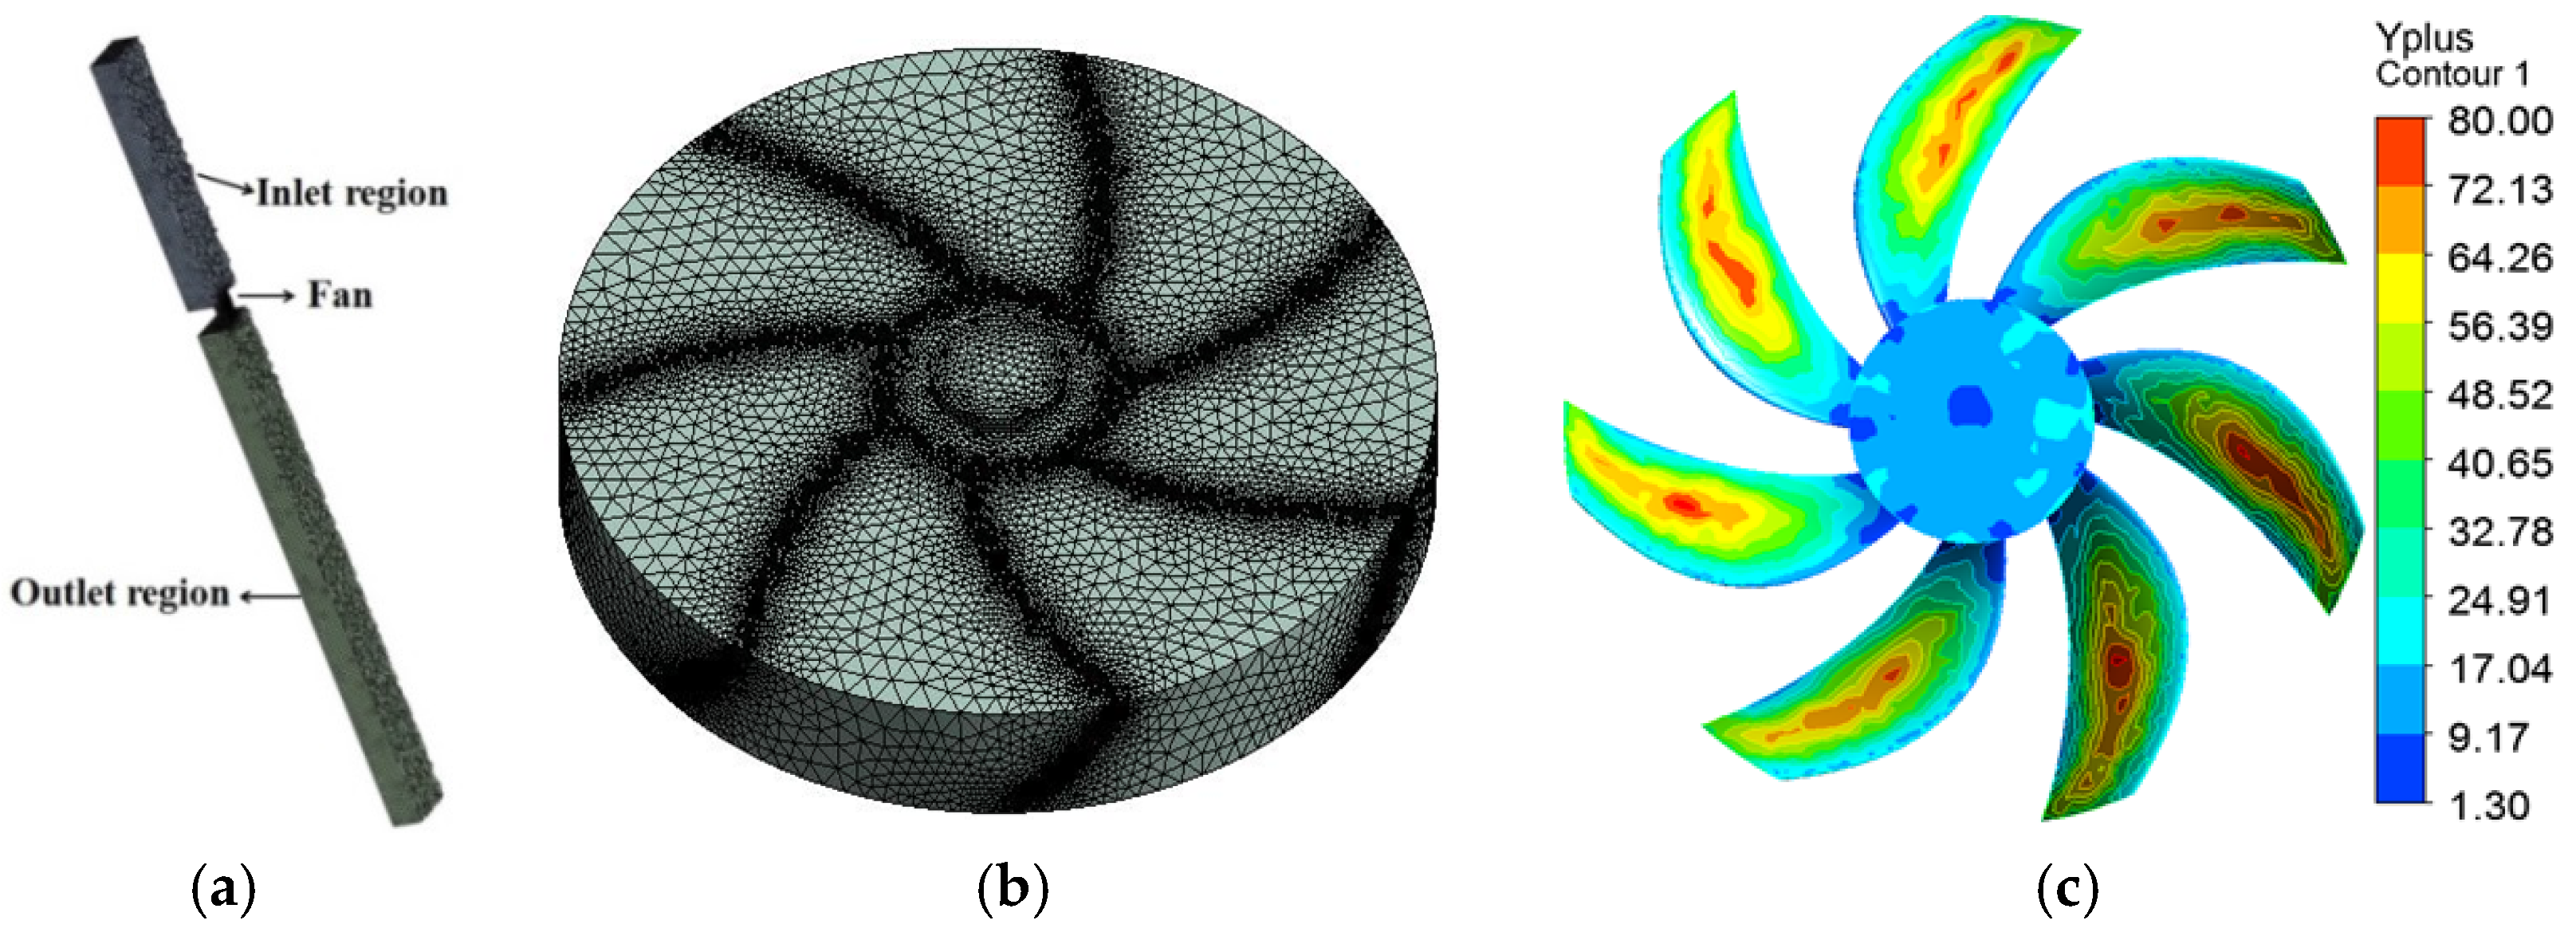
This study utilizes an unstructured grid system, which is divided into inlet, rotor, and outlet regions as plotted in
Figure 1a. The inlet and outlet regions simulate the external spaces, which must be large enough to avoid the boundary effect and ensure the validity of the simulation outcome. At first, the incoming airstream enters the fan inlet to flow into the rotating rotor. It follows that energy transfer to the fluid via contact with the blade surface occurs inside the blade passages. Clearly, due to the abrupt energy increase, the physical phenomenon becomes very complex after the incoming flow moves into the fan rotor. Therefore, as shown in
Figure 1b, most of the grid points are placed in this rotor region to obtain the detailed information of the flow field.
Moreover, it is essential and instructive to check the grid quality around the rotor surface to ensure the appropriate numerical model via the usual wall
Yplus (
y+) in the CFD community [
8].
Yplus is the dimensionless distance from the wall and is based on the distance from the wall to the first node and the wall shear stress. It is a non-dimensional number similar to local Reynolds number, determining whether the influences in the wall-adjacent cells are laminar or turbulent, hence indicating the part of the turbulent boundary layer that they resolve.
In previous references [
12,
13], the range of 30 <
y+ < 300 is suggested for a fully turbulent portion, which is similar to the flow pattern associated with the fan rotor. Thus, for the stand fan,
Figure 1c illustrates the distribution of wall
y+ over the fan rotor, which is around 20~60 for most of the blade surfaces. In addition, to ensure the reliable CFD outcome, the enhanced wall function is utilized on the near-wall treatment in this work.
In addition, the grid dependence study is executed on the stand fan to identify the appropriate grid system.
Table 1 lists the calculated flow rate for several grid systems with different grid numbers. Apparently, the results of the 4.4 M-grid and 5.7 M-grid systems are almost identical and sufficient to yield the detailed flow characteristics associated with the stand fan. Consequently, this study utilizes the 4.4 M-grid system to perform the related CFD simulations. Also,
Figure 2 presents the velocity distribution for these grid systems. Obviously, the velocity distribution becomes stable for a grid number higher than 4.4 million. Noticeably, the calculation is reached steadily around the convergence of 10
−3 while the convergence criterion of this CFD work is set at 10
−5.
2.3. Boundary Conditions
In this work, several appropriate assumptions and boundary conditions are imposed to simulate the actual flow patterns of the stand fan. They are described as follows:
- (1)
Pressure inlet and pressure outlet boundary conditions
- (2)
- (3)
Impeller and rotary fluid
In this study, the “Moving Reference Frame (MRF)” method of Fluent software dealing with the problem of rotating machinery is used to simulate the rotary fluid of the fan's impeller. The impeller is given a fixed rotational speed (rpm), then rotates along a fixed axis and complies with the right-hand rule. The rotating wall surfaces are treated as stationary boundaries relative to the rotating frame in this model. When the equations of motion are solved in this rotating reference frame, the acceleration of the fluid is supplemented by additional terms that appear in the momentum equations.
After the above numerical methods and boundary conditions are set, the flow rate of the fan can be calculated by the CFD software to evaluate and improve the fan performance systematically.
3. Experimental Setups and Methodologies
The experiment of the stand fan can be classified into the aerodynamic performance and the acoustic noise measurements, respectively. The performance of the fan’s airflow rate is tested by following the ENERGY STAR ceiling fan testing standard [
14] and stand fan Chinese National Standard (CNS) No. 2061 [
15]. In addition, noise measurement in the semi-anechoic chamber is carried out under Chinese National Standard (CNS) No. 8753 [
16]. Measurement equipment of the noise and performance testing are described below.
3.1. Performance Measurement of Stand Fan
According to two measurement standards of the fan, a closed region enclosing the stand fan is constructed to avoid flow disturbance from the environmental disturbances. In addition, the measuring plane is set in front of the stand fan with a distance of three times that of the impeller diameter. Therefore, the measurement points are located at 1.05 m away from the fan’s outlet. Moreover, the flow channel is designed with a square cross-section and the length of three-time-rotor-diameter to avoid the reverse flow caused by the wall. Also, this measuring plane is divided into several square annular zones, which start from the center of the monitoring plane outwards and are separated every five centimeters. That implies that the width of each square annular area is 5 cm.
In addition, the hot wire anemometer is utilized to measure the air speed at the center points of each annual area with a 30-s recording time for each test. Hence, the mean flow speed of each annular region is obtained by averaging the measurement values attained around that annual area. Furthermore, the flow rate through that area equals to the product of this average velocity and its area. Clearly, the summation of the flow rate for each annual area yields the total flow rate generated by this stand fan as long as the measuring plane is large enough to cover the air stream. Note that the minimum effective velocity measurement allowed by this hot wire anemometer is 0.1 m/s. Thus, the velocity data less than that minimum are truncated.
3.2. Noise Measurement
The sound pressure level meter AS-6224 and FFT (fast Fourier transform) dual-frequency spectrum analyzer AD-3651 from A&D Inc. (Tokyo, Japan) are used to measure noise in this work. The sound pressure measurement range is valid from 28 to 10 dB and the frequency measurement range is from 20 Hz to 12.5 kHz, respectively. Besides, the FFT dual frequency analyzer can analyze any signal variation at different time domains and frequency ranges by applying FFT to transform and store the analog and digital signals. The entire measurement procedure is set and performed based on the international standards. To ensure the reliability and accuracy of noise data, the experimental results are attained in the semi-anechoic chamber in accordance to the ISO 3745 code [
17]. Hence, the reflected sound between microphone and wall can be eliminated to less than 0.5%. Also, the background noise in the test chamber is 19 ± 2 dB during the measurement. Also, three measuring points are taken at a distance of 1 meter away from the stand fan. One of the measurement points is located at the fan inlet and the other two are placed at the fan outlet with a 45 degrees angle inclined to the center axis.
4. Design of Stand Fan and Simulation Results
This research selects a commercial 14-inch stand fan as the reference base for performance enhancement. The stand fan can be divided into the impeller and the protective cover. The aerodynamic characteristics of the fan impeller would determine the flow rate and static pressure of the outlet airstream generated by a stand fan, while the protective cover is aiming to prevent the possible damage caused by inappropriate contact with the rotating rotor. Therefore, in this study, the impeller is the first target to be designed and analyzed numerically with the aids of the design algorithm of the axial-flow fan and the commercial CFD codes Fluent. Furthermore, several modified covers are proposed according to the observation on flow field affected by the protective cover. The main concerns are focused on the enhancement on fan performance and the uniform velocity distribution of outlet flow.
4.1. Parametric Design and Flow Analysis of Impeller
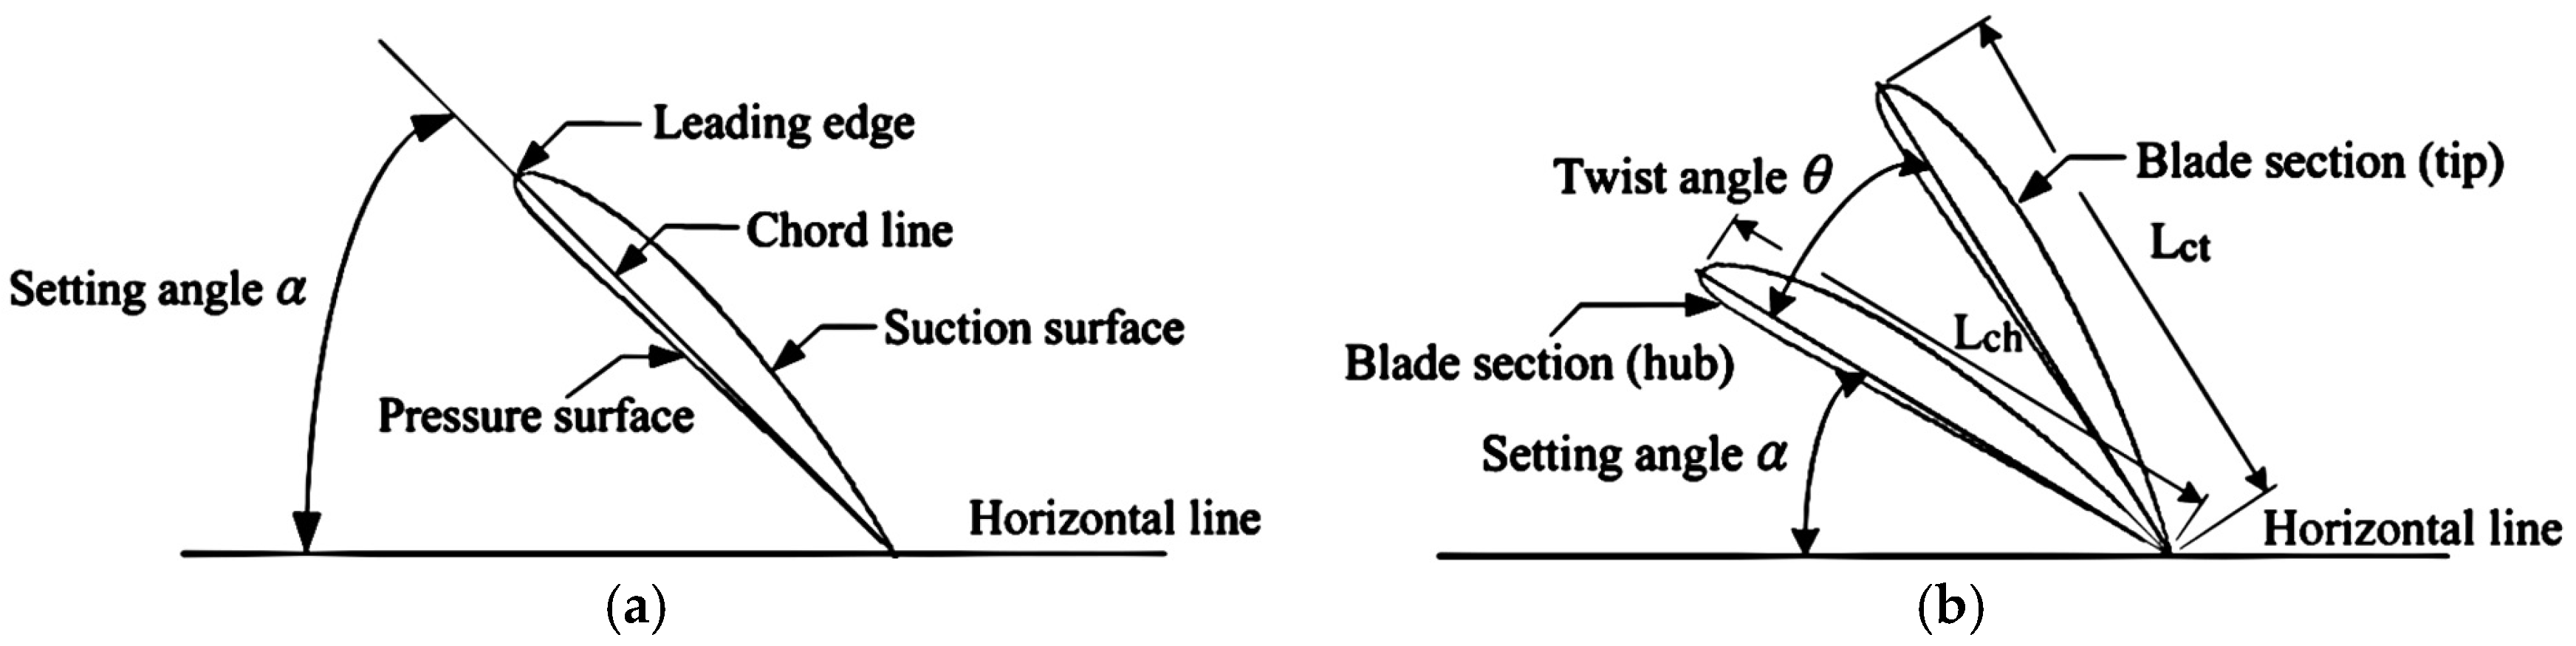
Flow fields associated with impellers generated by different parameters are simulated and compared to obtain the best set of design parameters to construct the impeller shape. Firstly, various blade setting angles are selected and numerically evaluated to find the proper value for different performance requests. As illustrated in
Figure 3, the setting angle is the blade angle on the hub formed by the horizontal line and the blade base line, which is the line connecting the leading edge and trailing edge of the airfoil. Furthermore, the twist angle is the difference between the blade angles at the inner end (hub) and the external end of the rotor blade.
The simulation results show that the impeller with the same 55° setting angle and different twist angles (see
Table 2) produce the flow rate at 2074 and 2174 CFM under the required torque of 0.238 and 0.267 N-m, respectively. Clearly, case B can deliver a higher flow rate while case A is the best design in the viewpoint of energy efficiency. Note that, as illustrated in
Figure 4, the associated flow field is appropriate for the human need and has a broad range of high-velocity distribution without severe flow disturbance near the fan outlet.
Also, by comparing the calculated results for different twist angles, it is shown that the air flow rate decreases with an increasing twist angle. For example, when twist angles are of 25° and 30°, their flow rates are reduced by 12% and 5%, respectively. As indicated in
Table 2, the 55° setting angle incorporated with two arrangements of a 20° twist angle yield a proper flow rate. Hence, the set of 55° setting angle and 20° twist angle is adopted in the subsequent discussion on the incline angle of the rotor blade, which is defined as the circumferential angle difference between the blade hub and blade tip.
The incline angle can be classified as backward and forward types with respect to the rotational direction. The simulation result reveals that the fan performance decreases by 6%~7% for a forward incline angle. Conversely, when the inclined angle is backward, the maximum flow rate increases while the torque needed also becomes larger. Among the cases studied here, the backward incline angle of 20° can yield a 2289 CFM flow rate under 0.267 N-m torque needed. Clearly, this flow rate presents a 38.8% enhancement over the original design (see
Table 3). In addition, the outlet flow field is quite uniform and symmetrical with respect to the rotating axis. Thus, this optimized impeller is considered as the base impeller to improve the protective cover in the next stage.
4.2. Integrated Analysis of Stand Fan
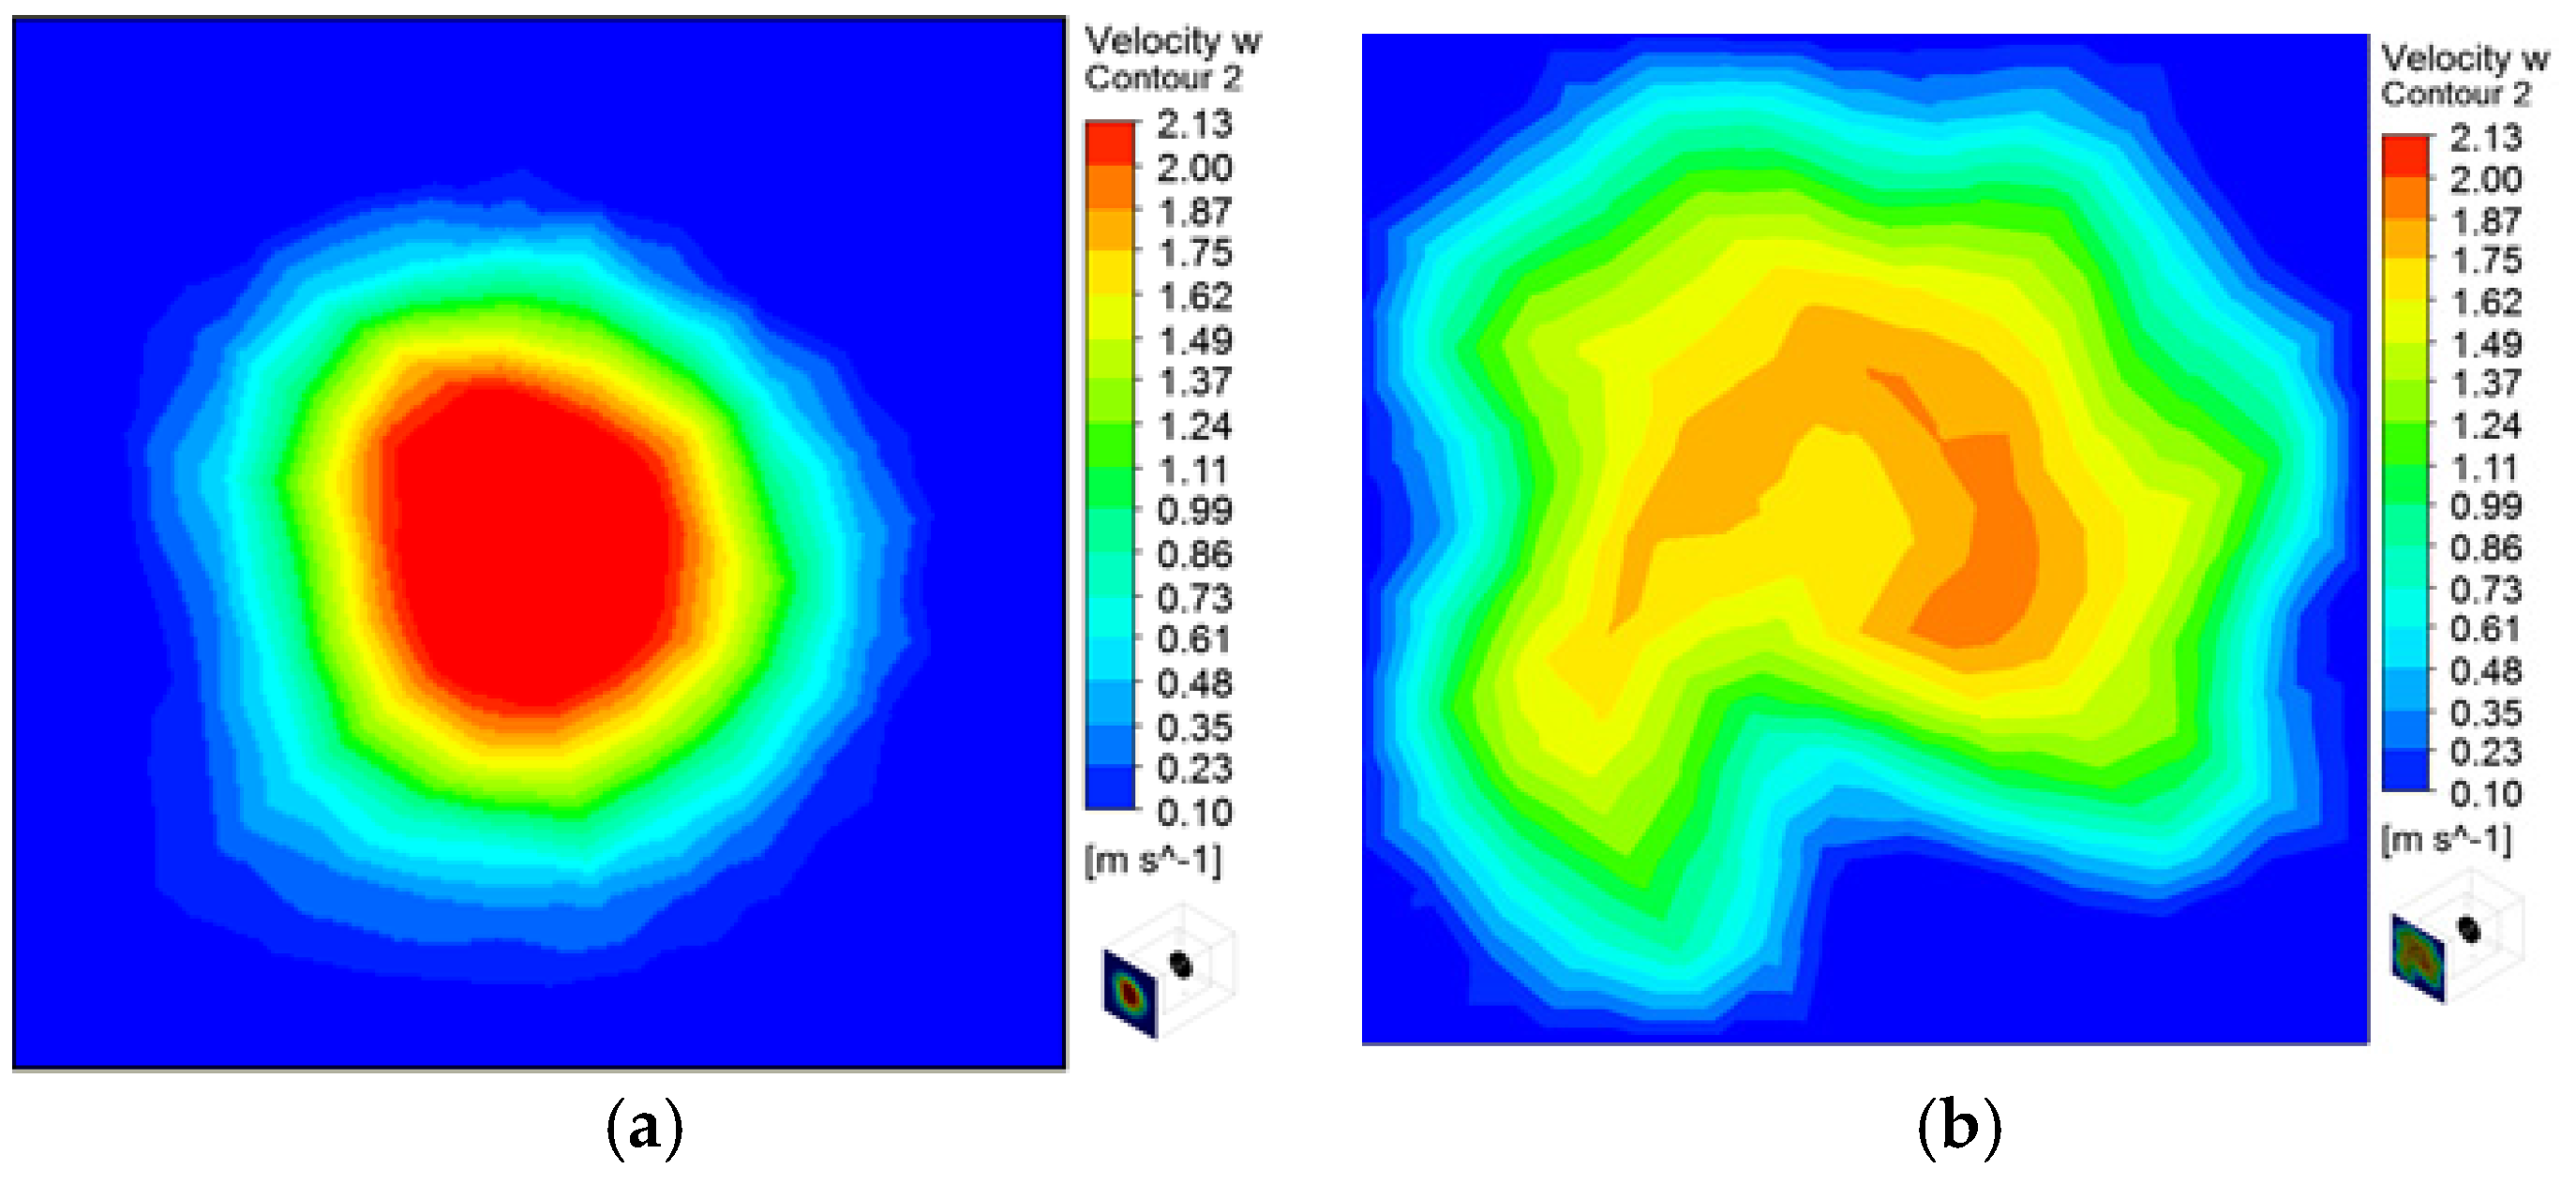
Integration of the optimal impeller and reference protective cover are denoted as the redesign fan #1. Also, the flow field and performance between the reference fan and the redesign fan #1 are simulated and analyzed carefully. The CFD outcomes show that the max flow rate of redesign fan #1 is 2037 CFM, which is equivalent to a 40% increase compared with the original reference fan (see
Table 4). Furthermore, it is observed that the outlet flow field of the redesign fan #1 has a more uniform flow pattern with a broad distribution of high-speed air as shown in
Figure 5.
Besides,
Figure 6 illustrates the reversed flow identified near the frame of the protective cover and the outlet center of the fan. These flaws can be improved after a series of design modifications on the protective cover. The numerical results indicate that the flow rate decreases with an increasing frame width. Furthermore, when the frame is moving closer to the blade tip, the flow rate is enlarging and the size of the reverse flow is becoming smaller. Therefore, for the case of the frame’s width and spacing between the frame and blade tip assigned as 20 and 10 mm, the max flow rate of this fan would enlarge to 2067 CFM (about a 2.5% increase) while little reverse flow is identified in the associated flow filed.
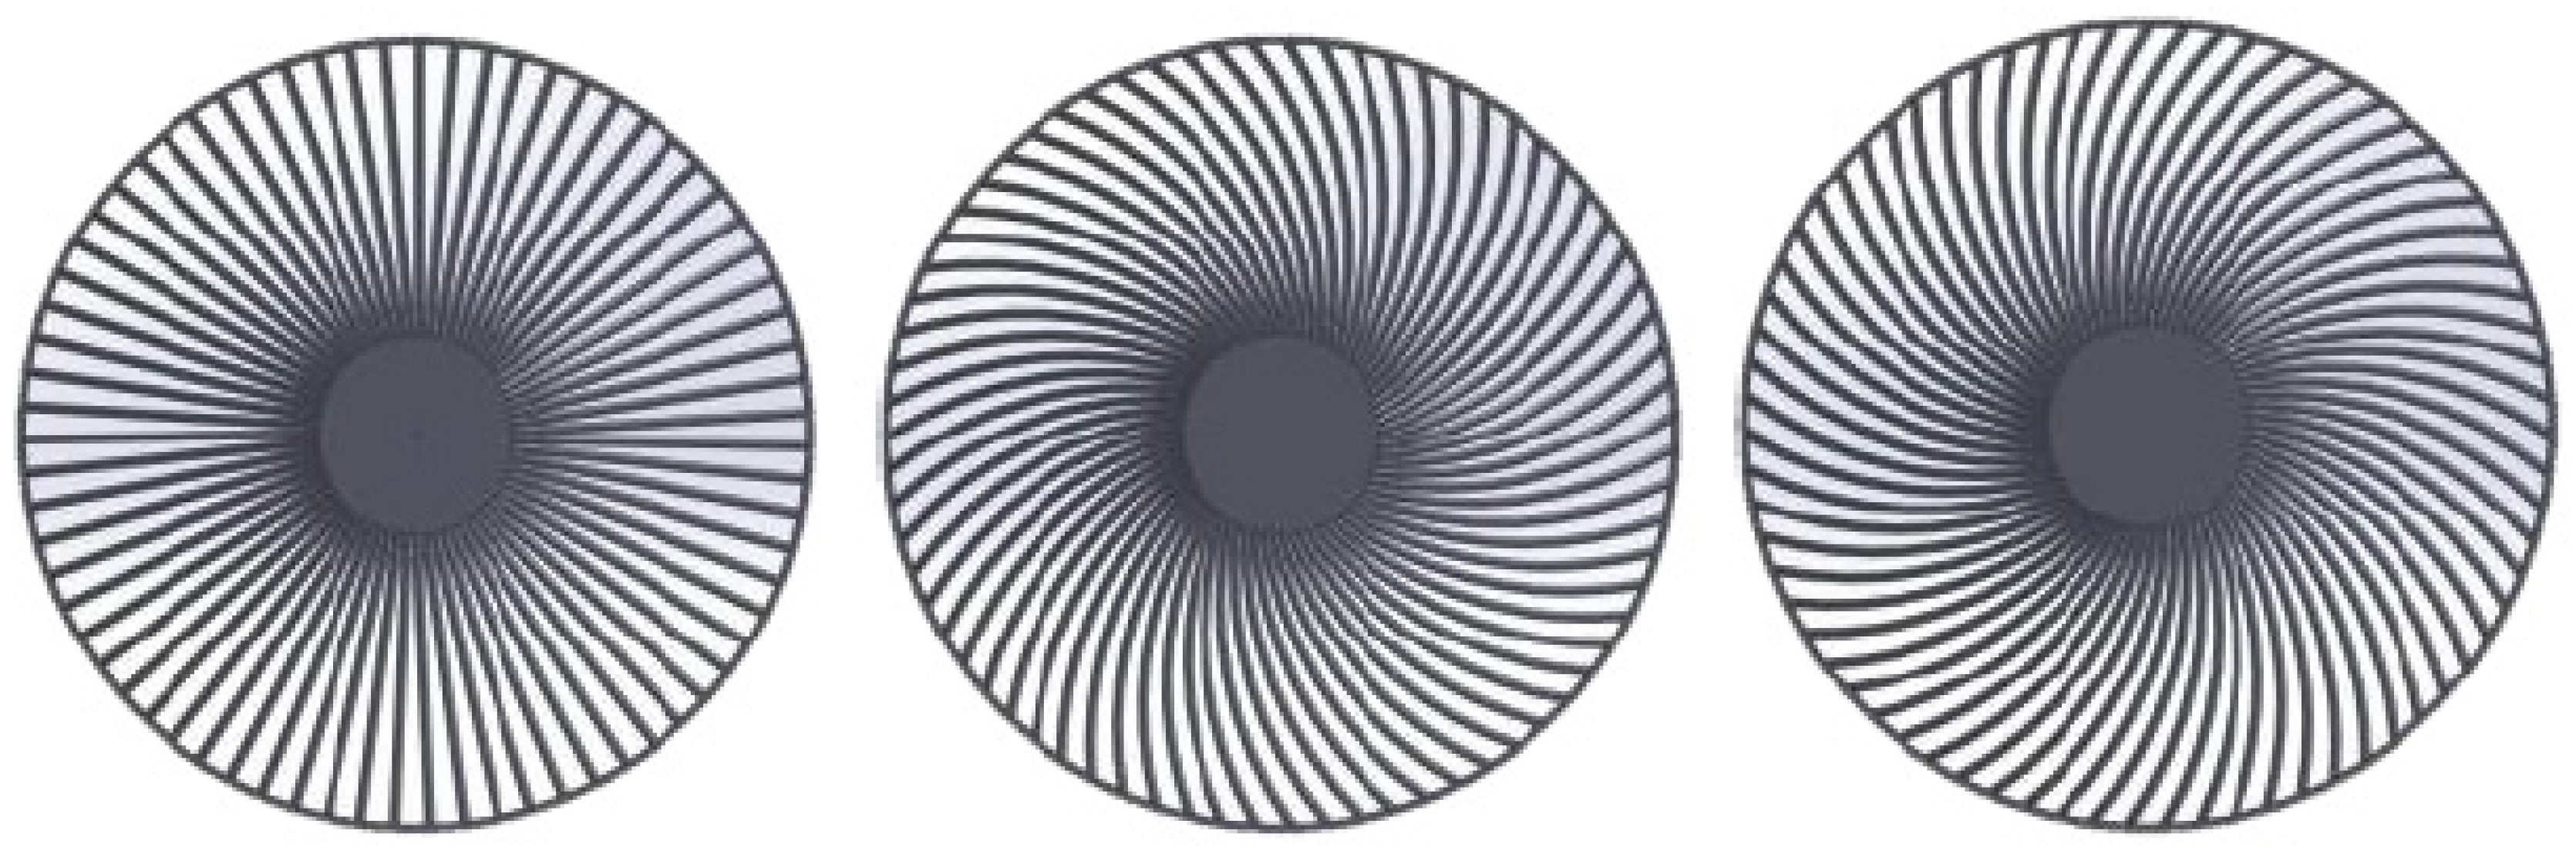
In order to improve the adverse flow field distribution in the above redesign fan and its performance, the ribs of the protective cover are considered for redesign later. The frame rib with a trapezoid cross section can be classified into three types including straight, counterclockwise and clockwise (see
Figure 7). The simulation results demonstrate that the clockwise type delivers a better flow rate at 2075 CFM (about a 2.9% rise).
Besides, an appropriate trapezoid angle of the frame grid can be helpful in guiding the air stream to flow outward in a more normal direction. The simulation results find that the trapezoid angle in the range of 30°~35° is the optimized parameter of the protective cover with 61 ribs. This optimal fan constructed by integrating the optimal impeller and the new protective cover with an appropriate set of design parameters can generate a uniformly distributed outflow (see
Figure 8) and deliver a maximum flow rate at 2126 CFM, which represents a 48% enhancement over the reference fan’s performance.
5. Experiment Measurement and Analysis
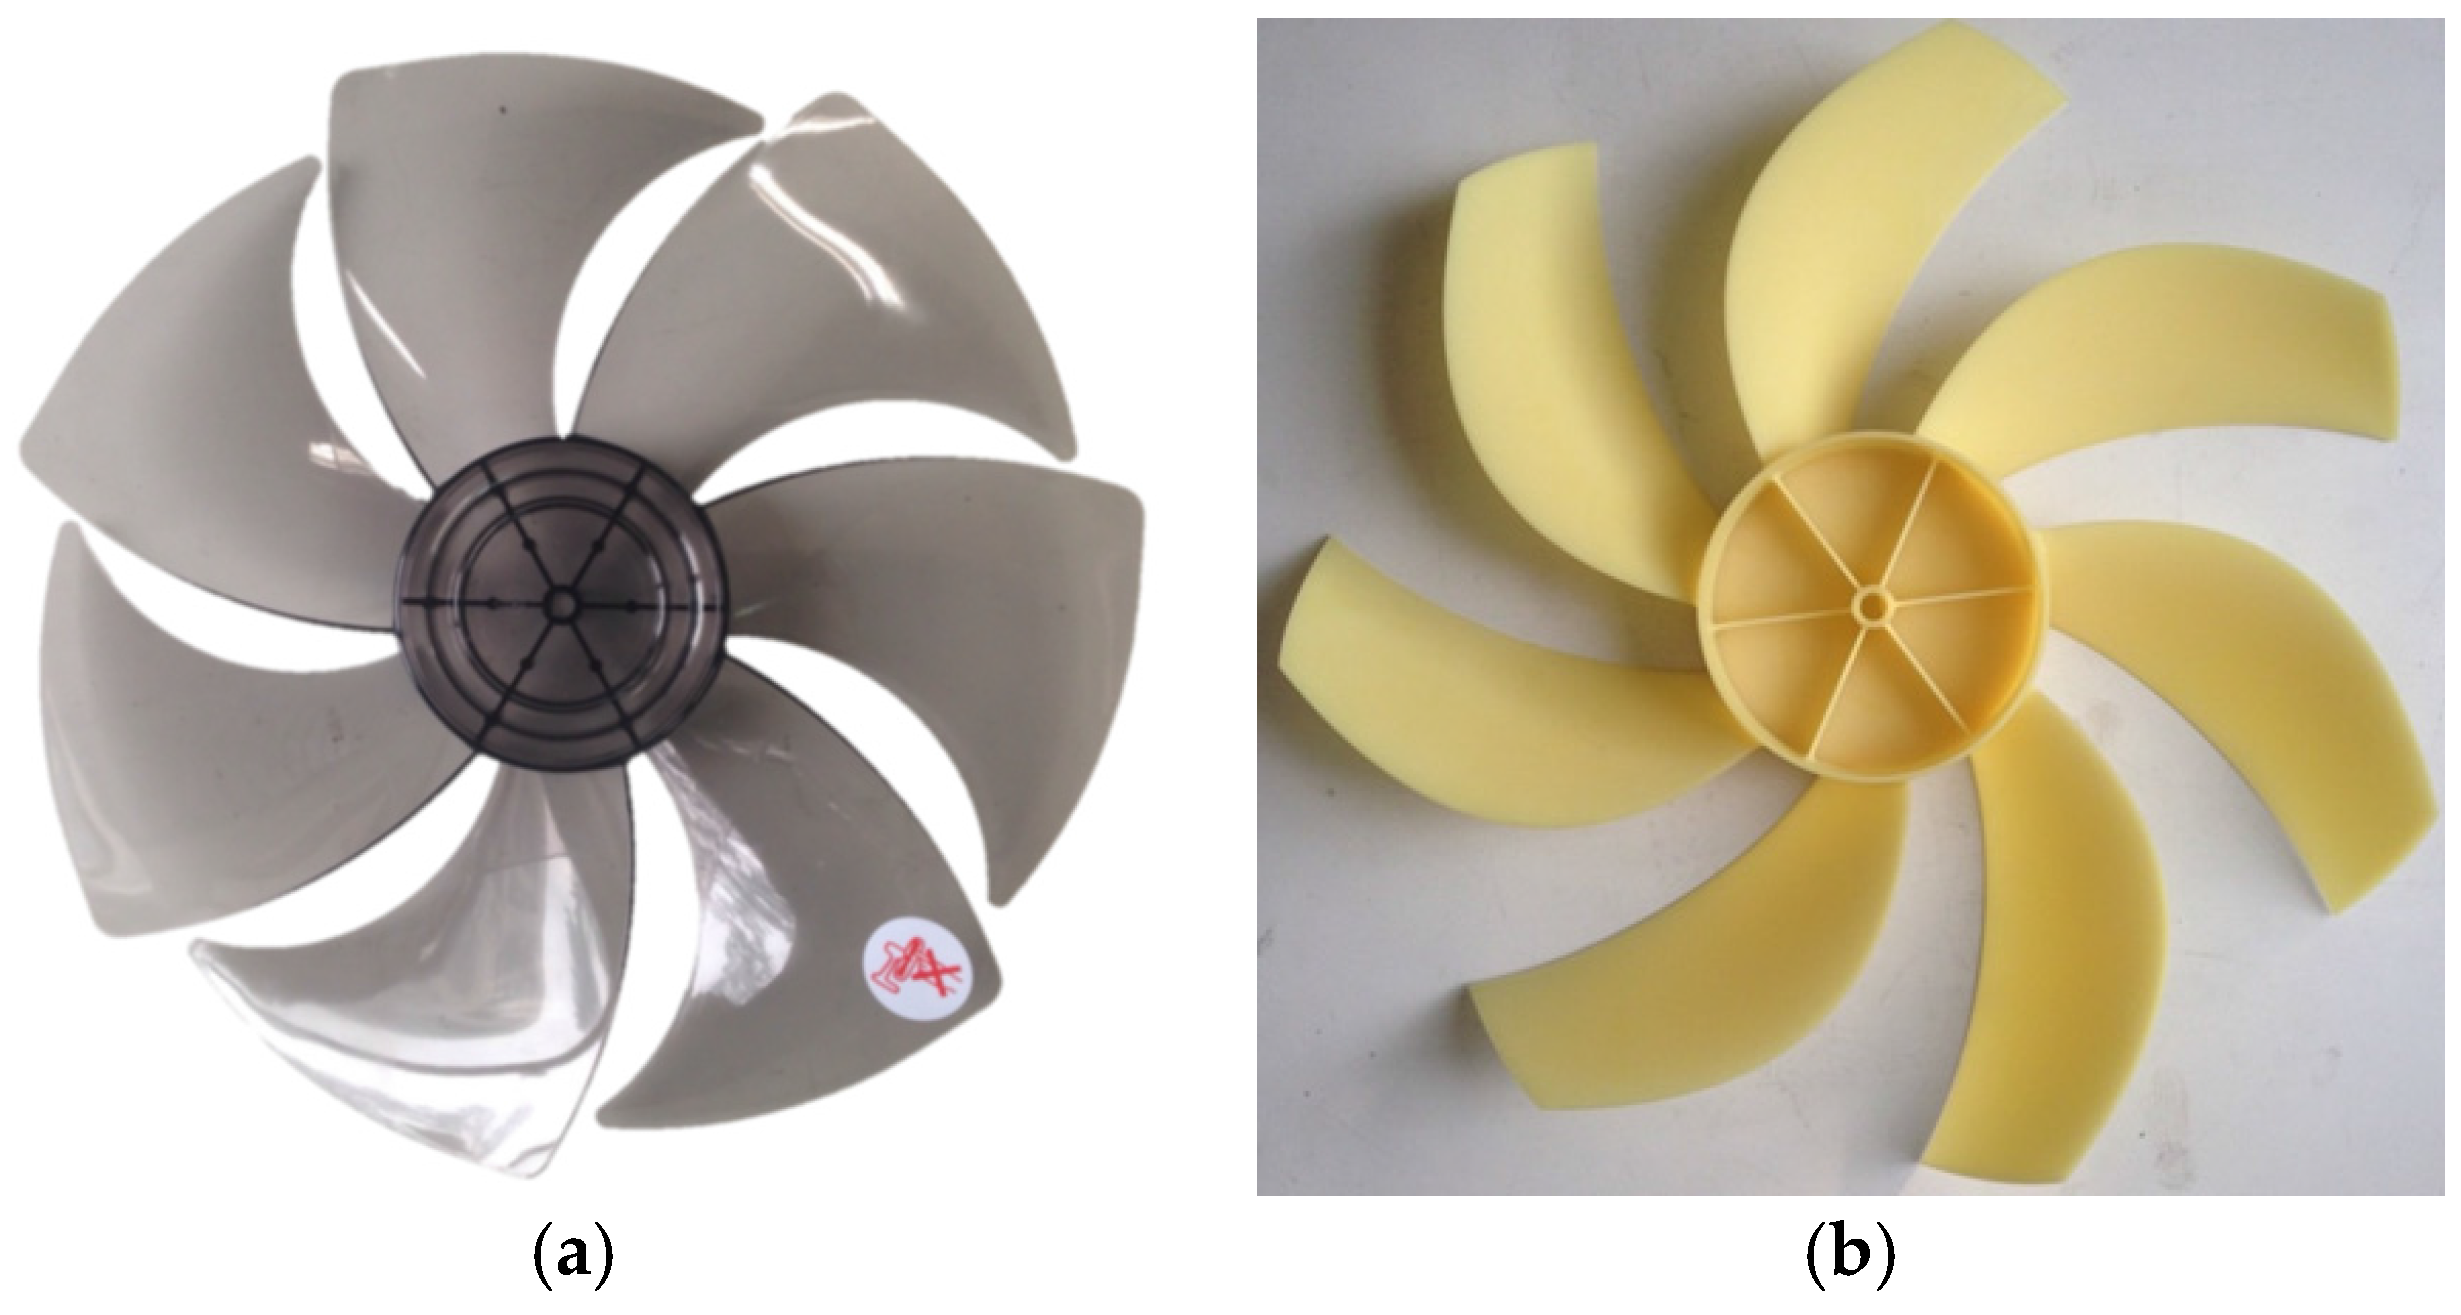
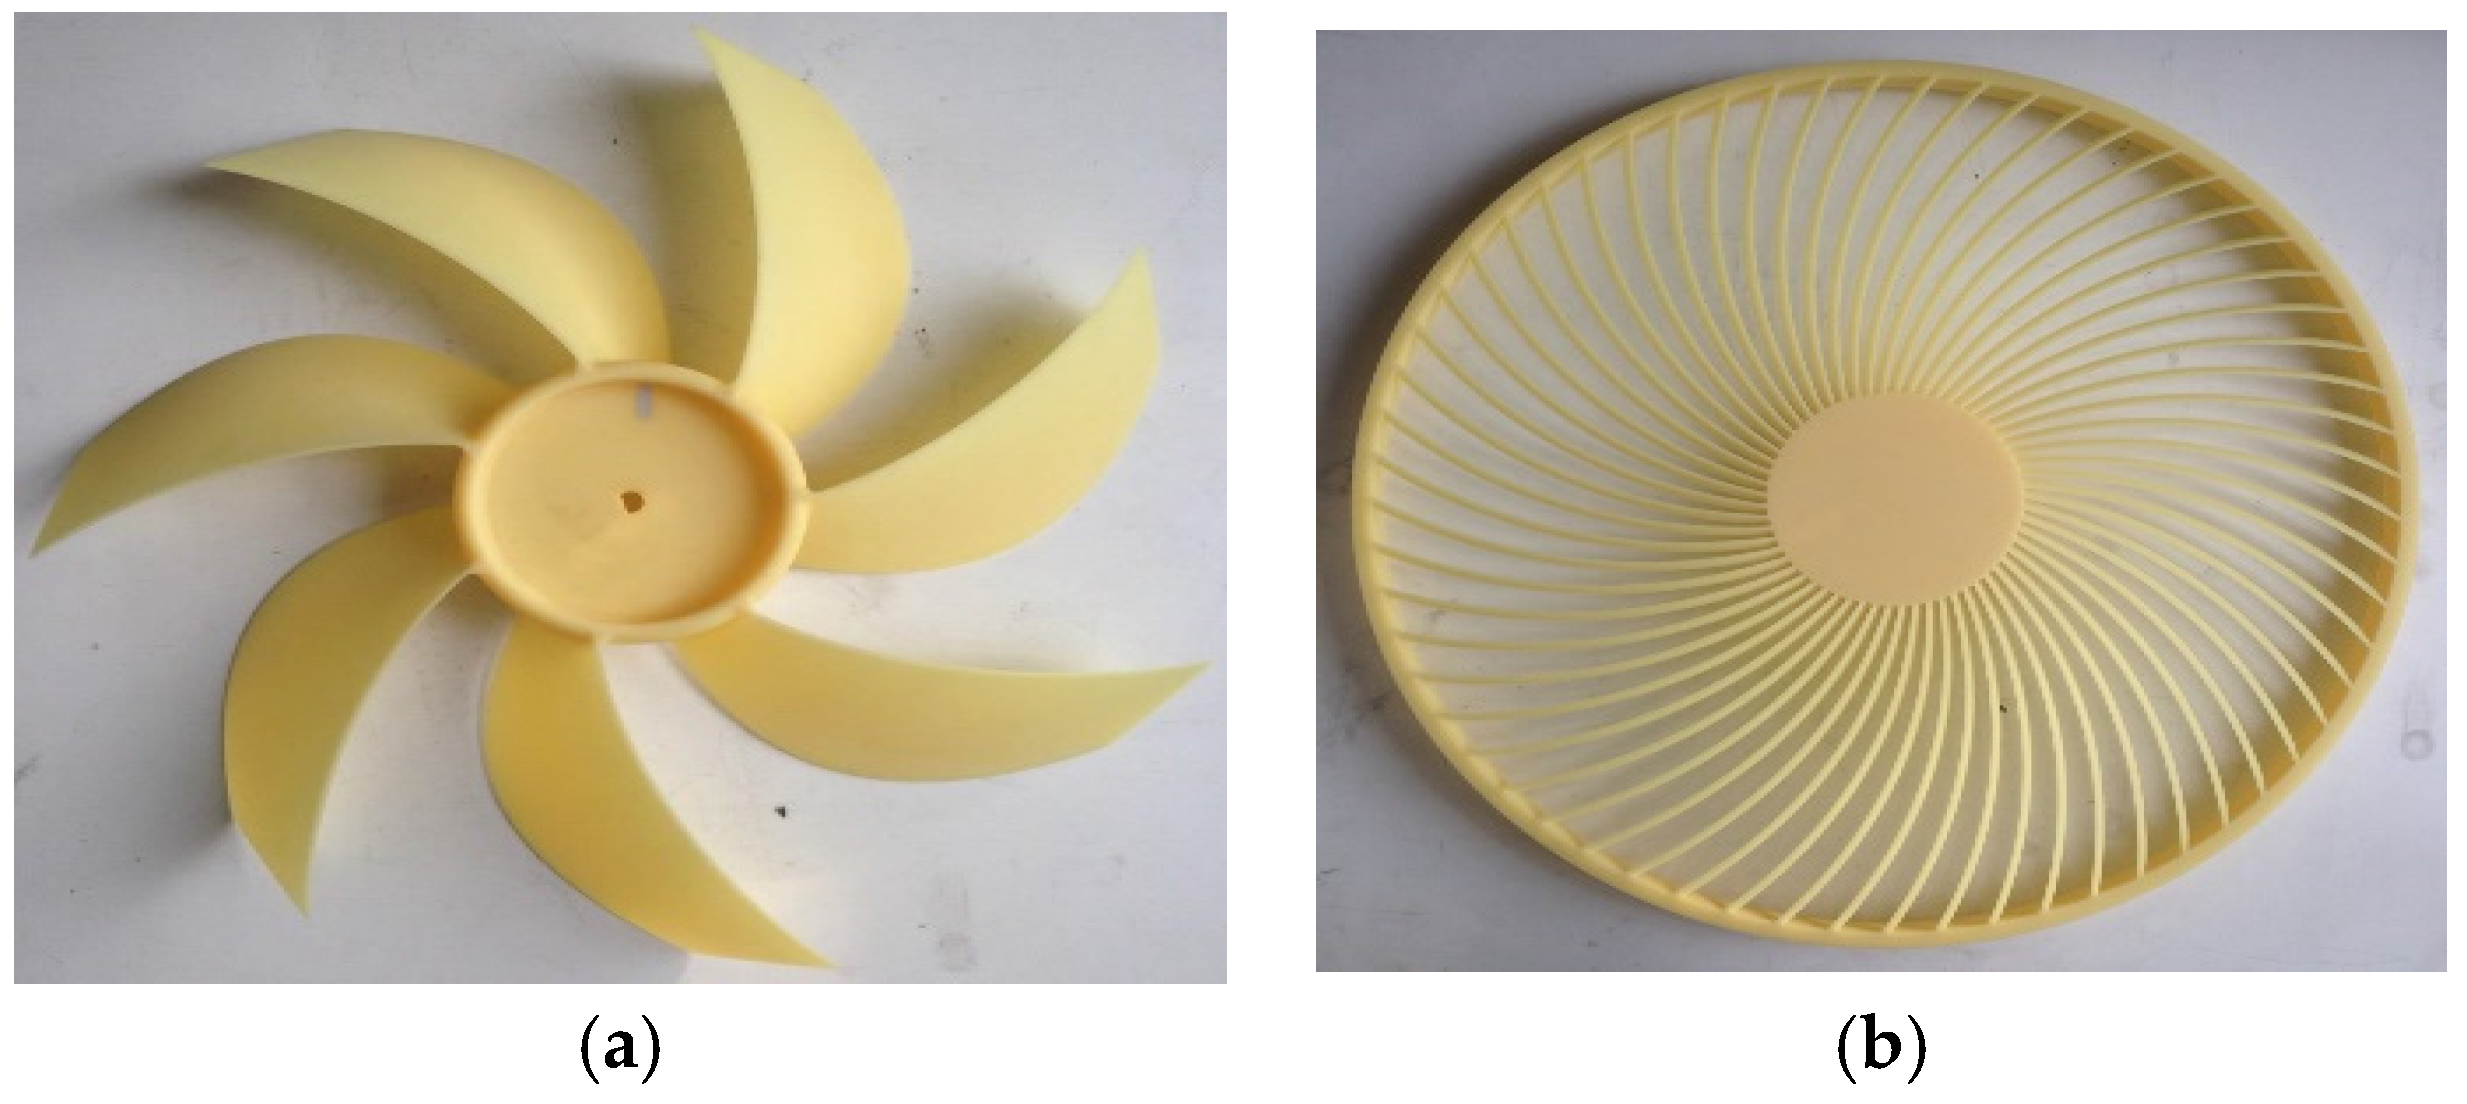
To validate the calculated fan performance, the mockups of the reference impeller, optimal impeller and protective cover (see
Figure 9 and
Figure 10) are made via CNC technology to test its performance. Thus, the reference and the modified covers and impellers are available for the experimental program. Thus, four fan sets can be assembled as the reference fan, the optimal fan, and the redesign fans #1 and #2, which are formed by the reference rotor with the modified cover. With these combinations, the influence induced by redesigning the impeller and the cover can be identified systematically. Also, the measuring items include performance and noise testing in the experimental work.
5.1. Performance Analysis and Comparison of Reference Fan and Optimal Fan
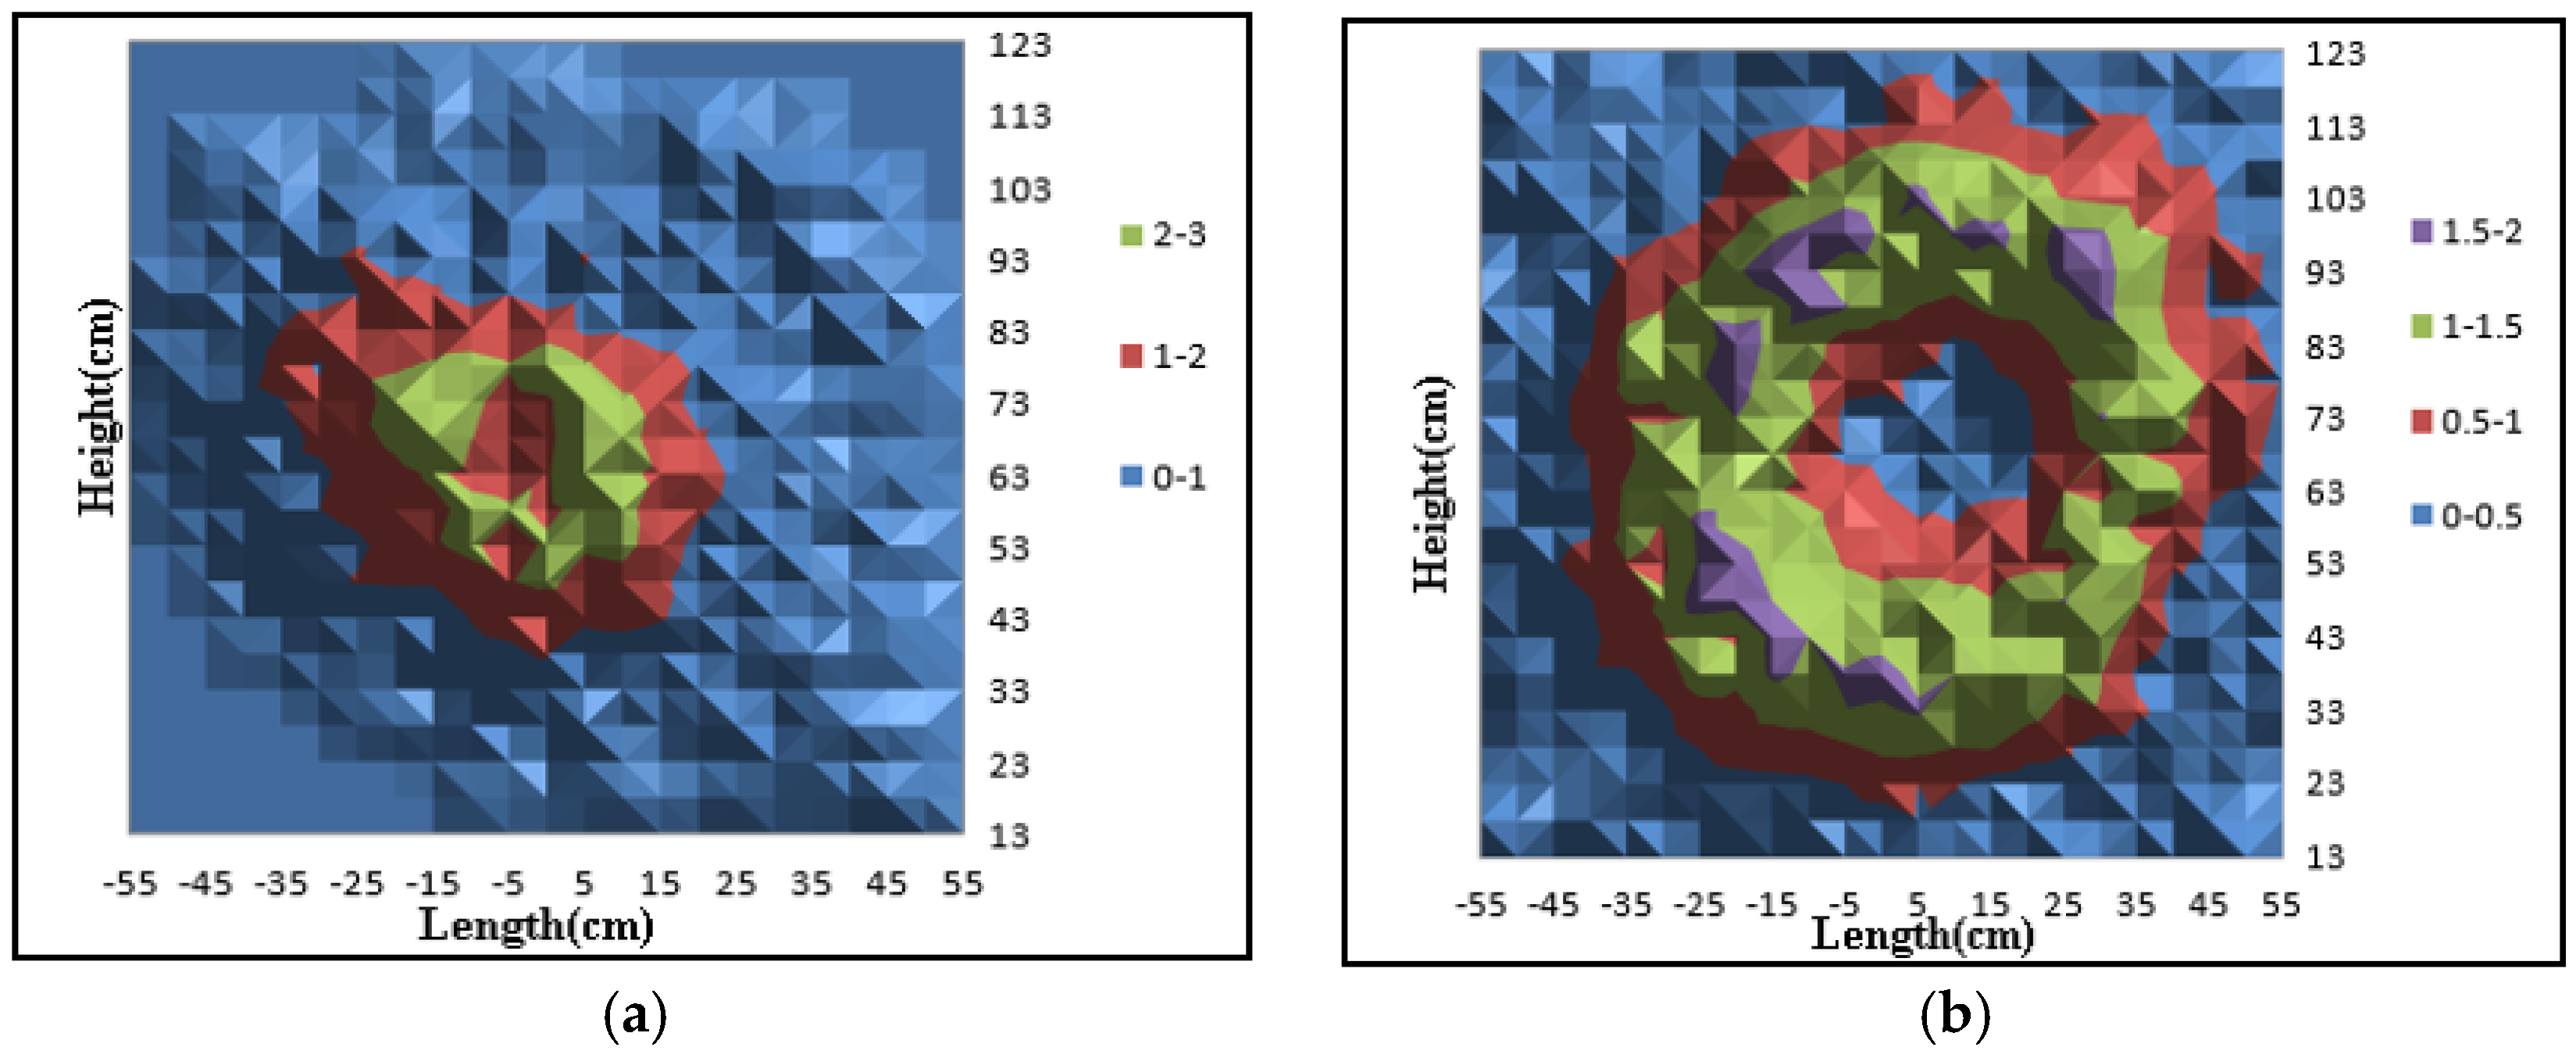
The rotating speed of the stand fan is fixed at 900 rpm during the CFD simulation. Therefore, for comparison, the test results should be measured by using fan law to match with the operating speed of 900 rpm. As explained in the last paragraph, there are four sets of experimental results obtained for comparing to each other. As a result, the test outcome shows that the max flow velocity at the monitoring surface of the reference fan is 2.83 m/s (see
Table 5). Even the enhancement in the flow rate is 48% greater than that of the reference fan, however, the max velocity of the redesign fan #1 and optimal fan are reduced to 2.15 and 2.76 m/s, respectively. Clearly, the velocity profiles generated by the optimal rotor are more flat and uniformly distributed under the constraint (higher flow rate and smaller peak velocity). In addition, the air speed drops significantly from the center of the rotor to the circumferential ring, where the velocity decreases to ignorable values of less than 0.1 m/s. This kind of velocity pattern can be observed for all the test fan sets; however, the reference fan has the fastest decline trend among the test fans in this experimental program.
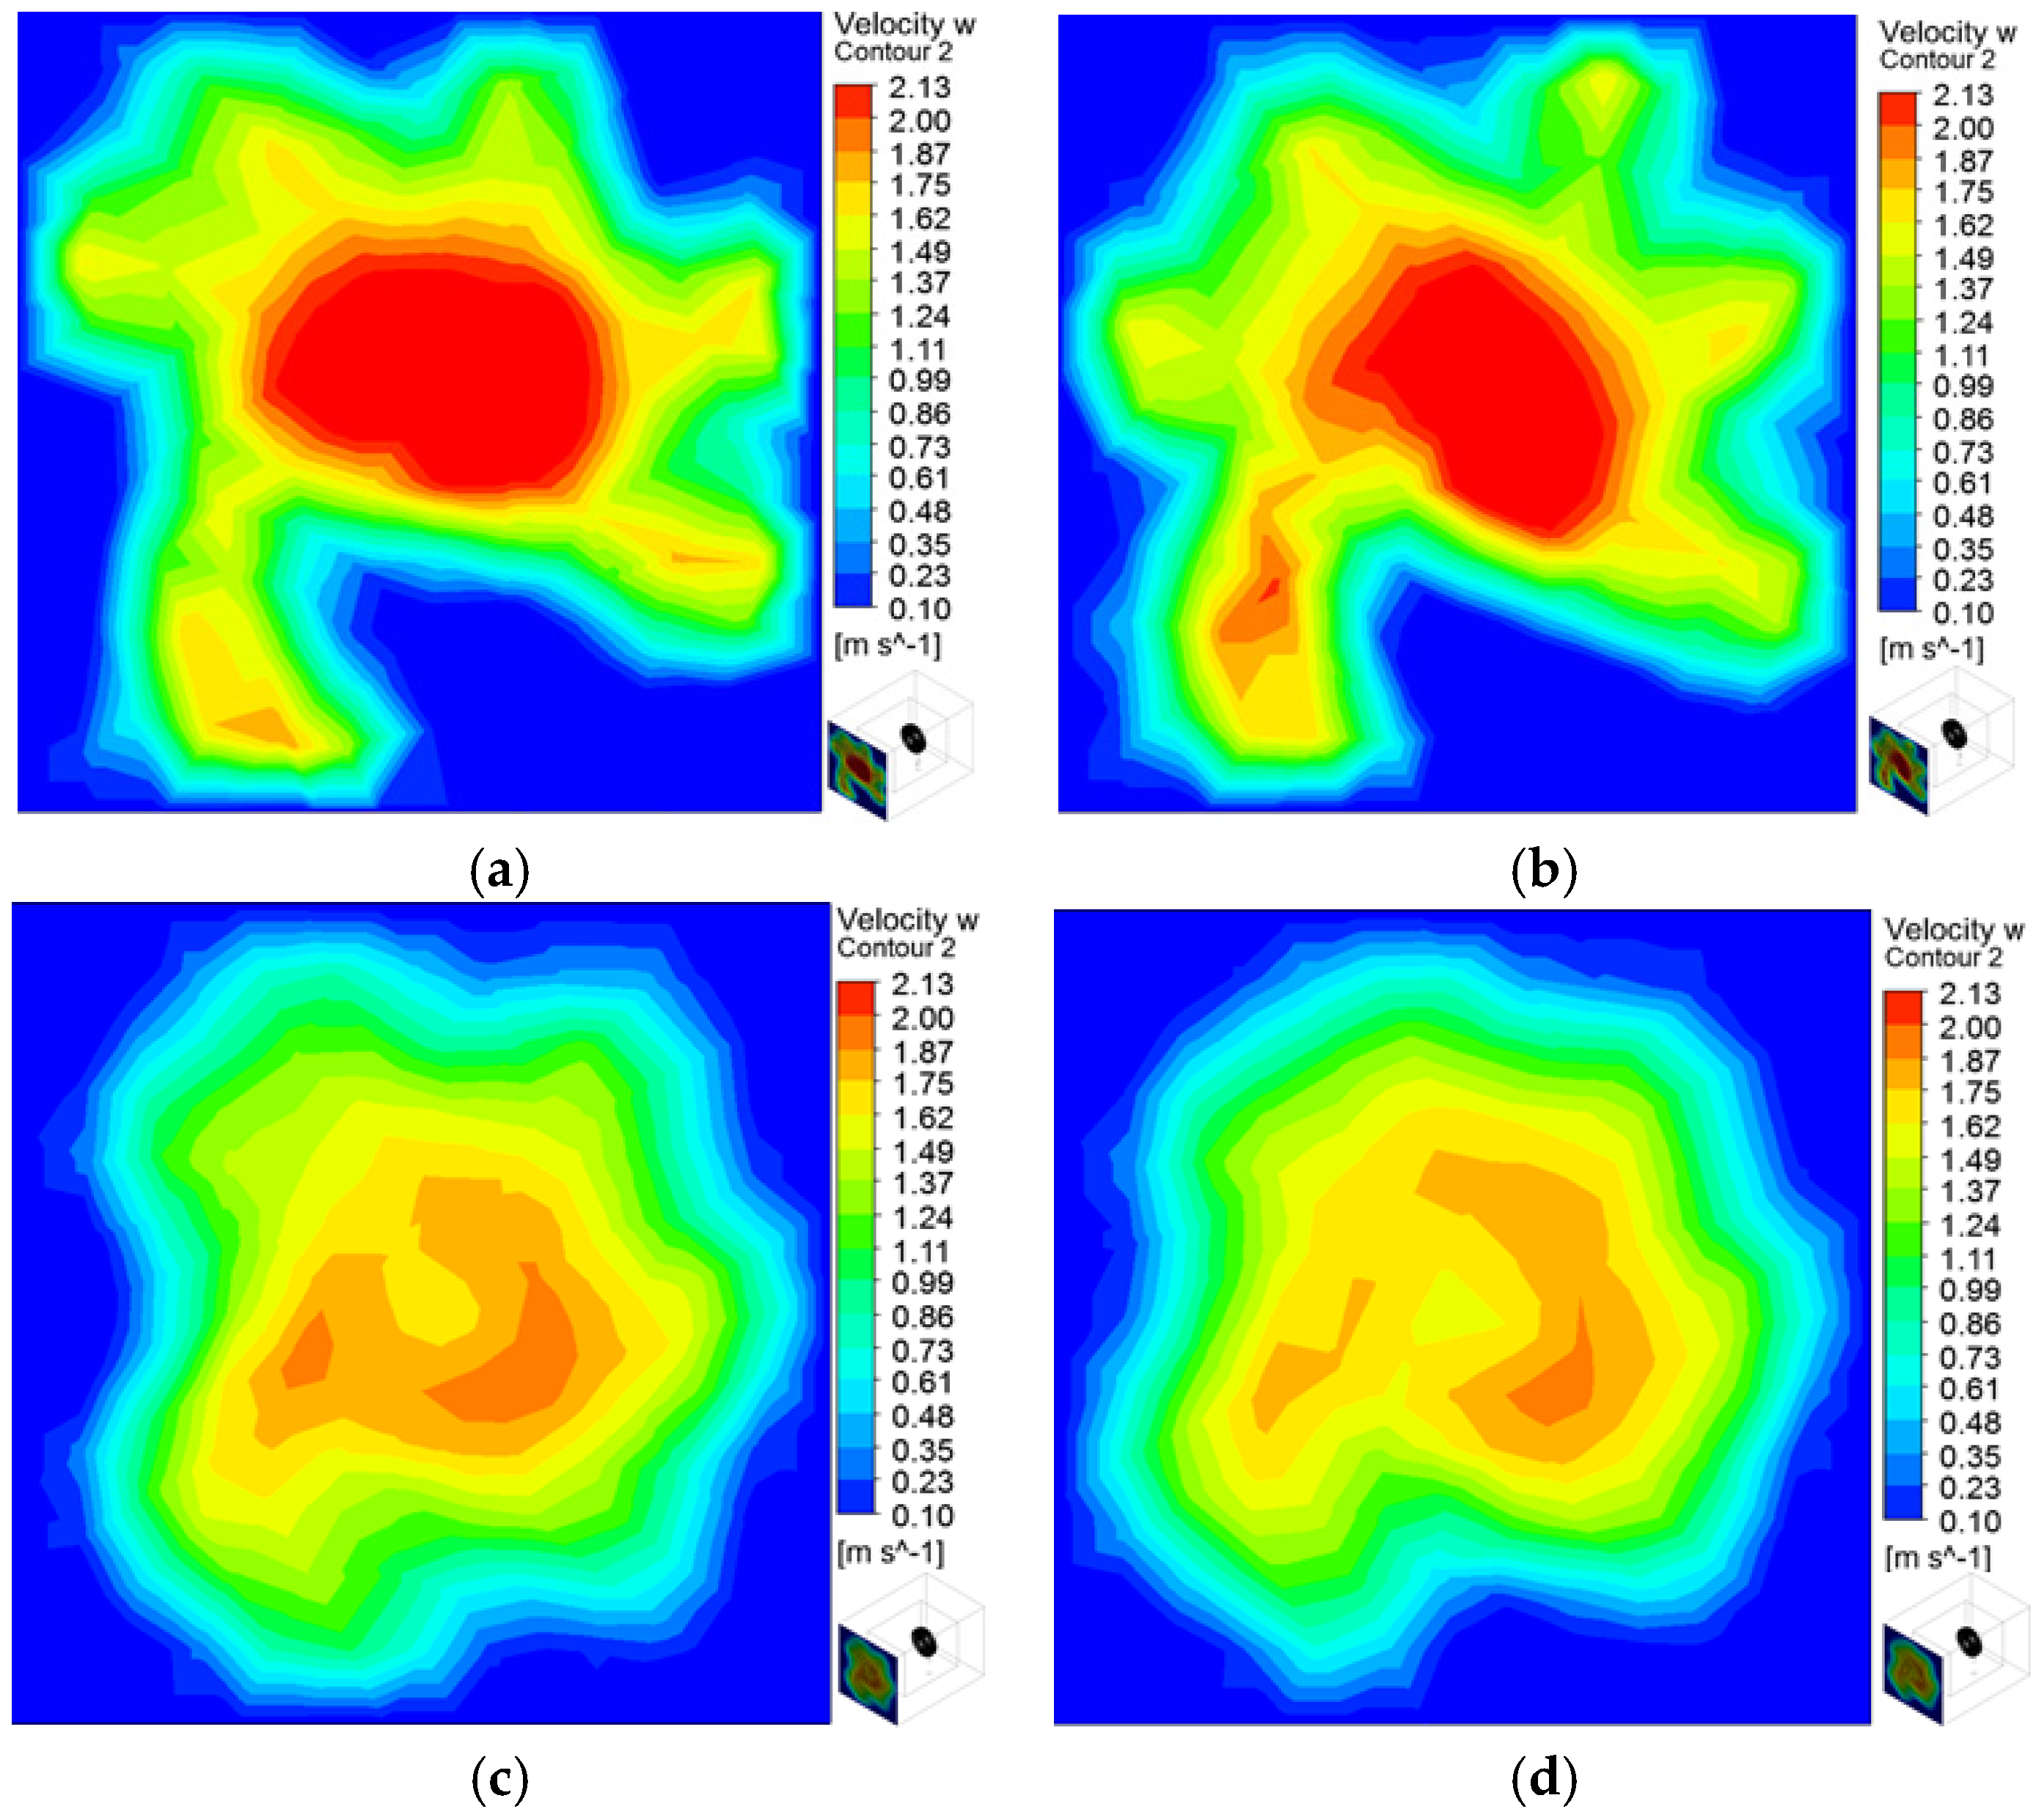
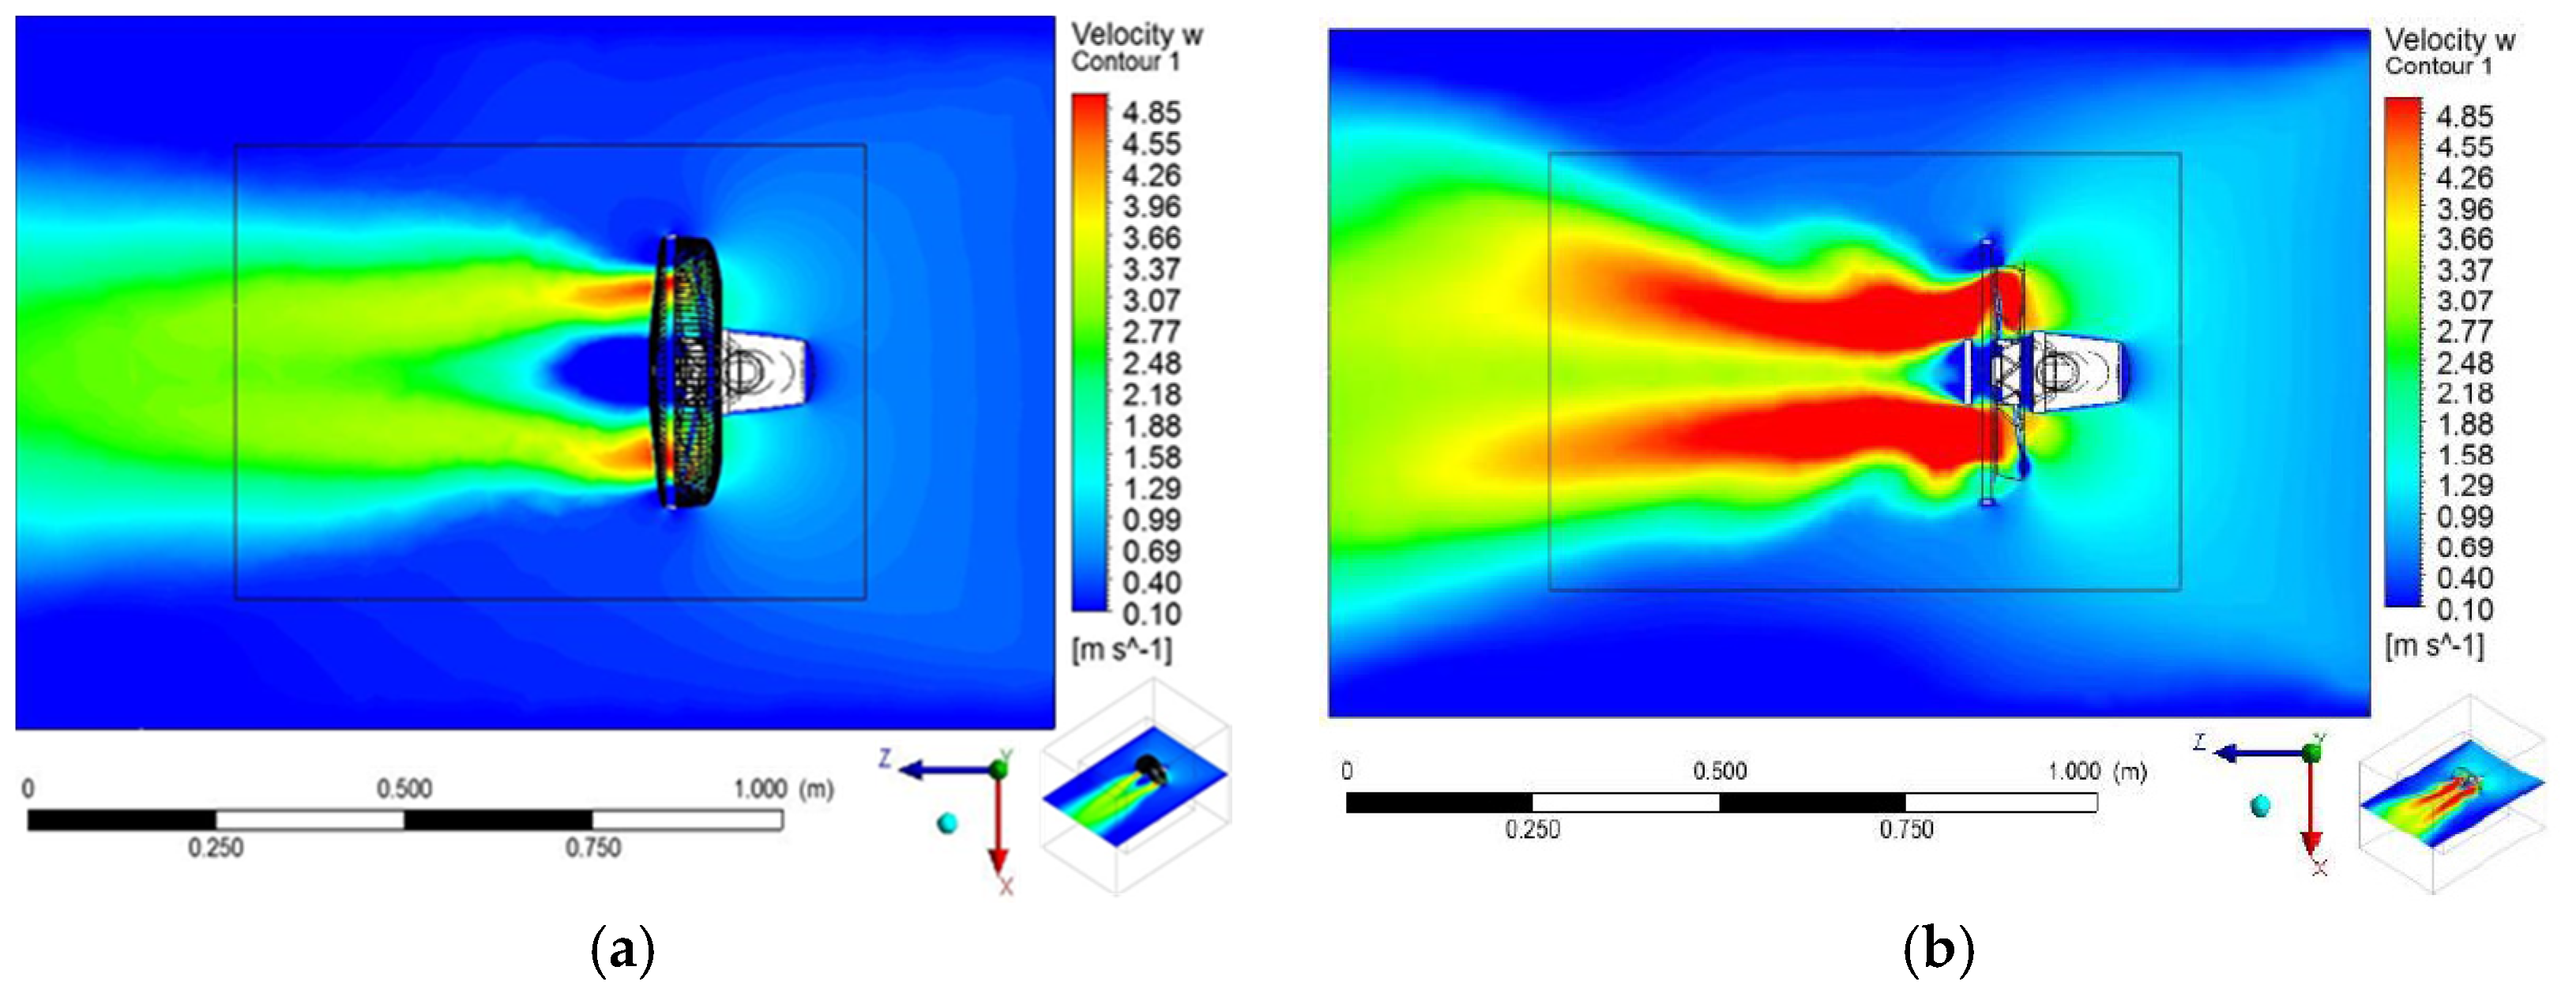
In addition, as indicated in
Figure 11, the velocity distributions generated by the optimal impeller (including the optimal fan and redesign #1 fan) are smoother, but it becomes quite fluctuated when the air stream passes through the reference protective cover. On the other hand, the flow distribution generated by the optimal fan is flat and extended to a wide region; thus, there is a small velocity (less than 1 m/s) near the outer edge of the protective cover (see
Figure 11b). Furthermore, after improving both the impeller and protective cover, the experimental flow rate of the optimal fan enlarges from 1590 up to 2455 CFM (see
Table 5), which represents a 54% increase compared with the reference fan under the same rotating speed.
Besides, the flow rate of redesign fans #2, which is constructed by integrating the reference impeller and optimal protective cover, is slightly better (2.9% enhancement) than the original reference fan although its max flow velocity is 2.53 m/s, which is a little less than the reference fan’s. It is concluded that the optimal protective cover can make the flow distribution more uniform even under a concentrated outflow by the reference impeller. The simulation deviations for all testing samples are in a range between approximately 10% and 16% (see
Table 5) while the experimental and simulation results have the same tendency overall. In addition, the distribution tendency of simulated flow velocity is consistent with the experimental result. Thus, the simulation error is still within an acceptable range and considered as having a good reliability.
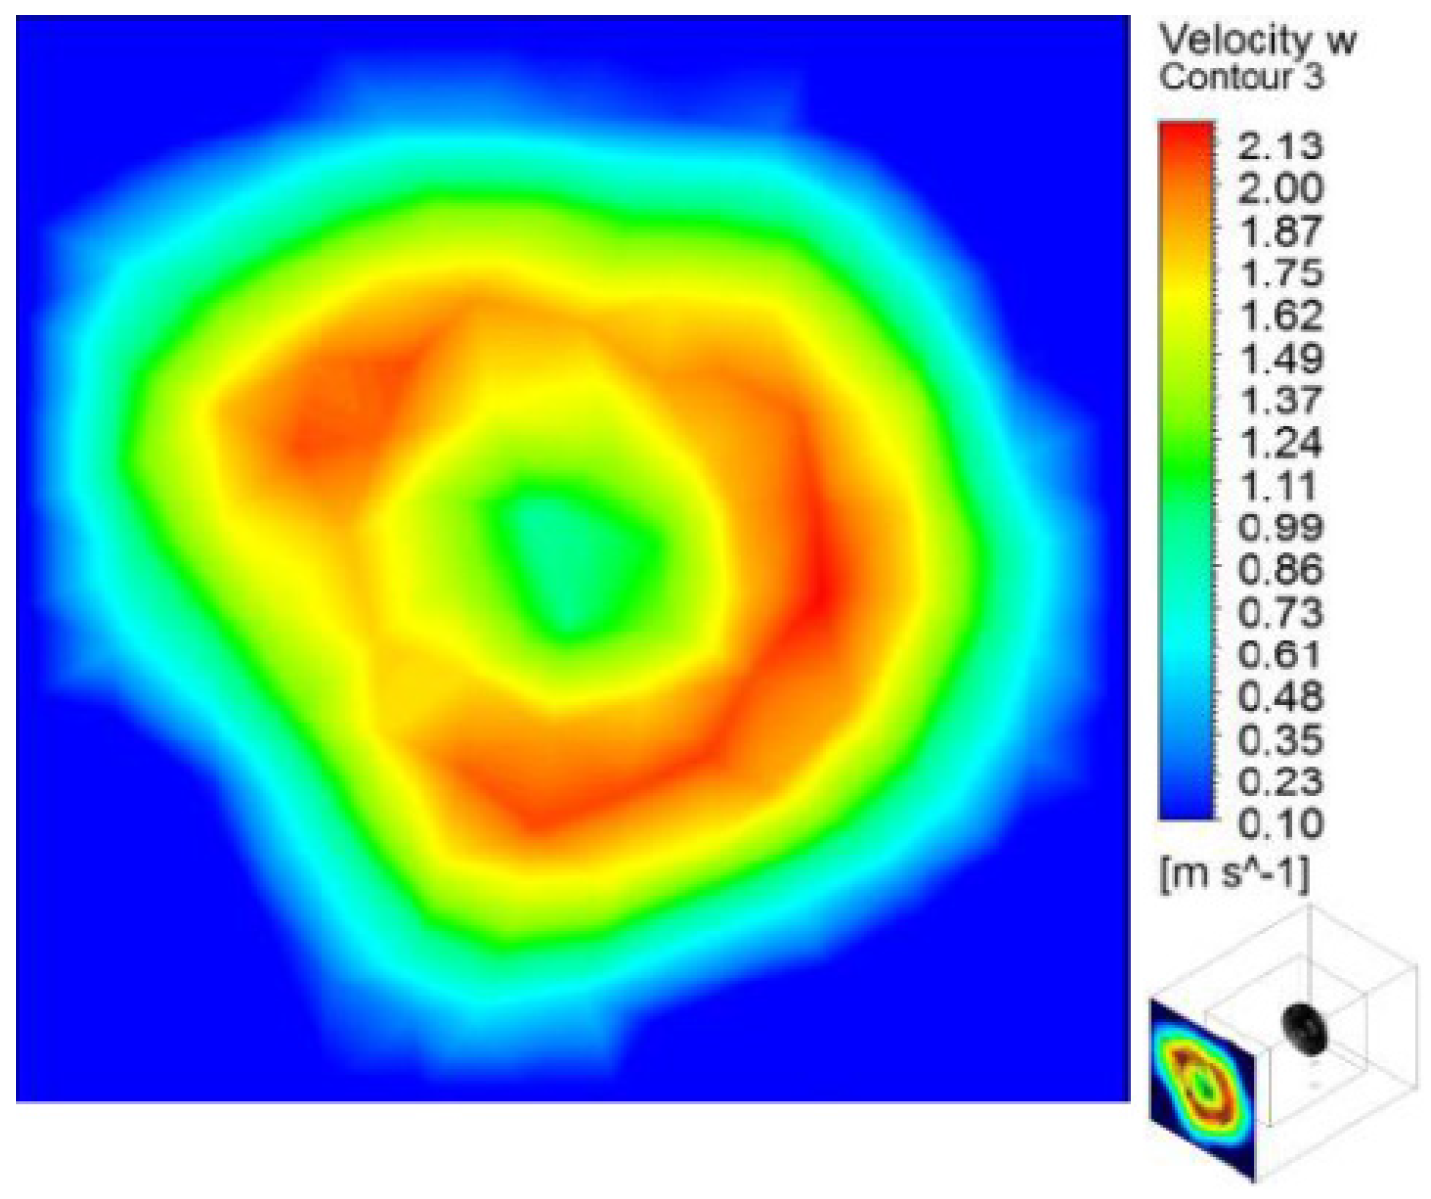
In general, for the human body, exposure to 1 m/s wind speed is considered as the more comfortable situation. After checking the velocity distribution for the optimal fan, its flow field distribution is quite uniform and symmetrically extended in all directions (see
Figure 11). Moreover, its average flow velocity is about 1 m/s with a 2.5 m/s maximum velocity. Therefore, the human body would not feel a strong impact by the air stream while the overall flow rate and effective ventilating zone have been enhanced significantly. It is worth pointing out that the optimal protective cover not only diminishes the chaos phenomenon of the flow field, but also effectively directs the airflow. Therefore, the aerodynamic performance of the optimal stand fan is significantly superior to that of the reference fan, and can meet the user’s need by adjusting the motor speed for an acoustic consideration.
5.2. Noise Measurement and Analysis
The noise experiment of the stand fan is carried out in the semi-anechoic chamber to ensure low background noise and no significant reflection noise. There are three measuring points chosen to record the fan acoustic characteristics. The measurement point #1 is located at 1 meter away from the fan inlet while the other two points are separated with respect to a 45° angle from the axial direction, and placed at 1 meter downstream of the fan outlet. The noise testing result shows that (see
Table 6) the optimal impeller can achieve higher performance, but its average noise level (50.8 dBA) is higher than that of the reference impeller (43.3 dBA) by 7.5 dBA. Apparently, 7.5 dB is a big noise increase; however, its flow rate enhancement of 54% is also a huge jump. Therefore, it is instructive to check the noise data for the optimal fan generating the same flow rate as the reference fan. With the aid of fan law, the rotating speed for the optimal fan can produce the same flow rate as the reference, i.e., 583 rpm. For convenient comparison,
Table 6 also lists the acoustic data for both fans operating at 600 rpm. Clearly, under the same flow-rate operation, the noise generation for the optimal fan is roughly 1.5 dB lower than the reference fan. Hence, the optimal fan is able to provide the users two choices, which are the same flow with a silent environment and the huge air stream with a loud noise.
6. Conclusions
This research systematically undertakes performance improvements on both the impeller and protective cover of a stand fan through the rigorous numerical simulation approach. The flow features used for evaluation include the total flow rate, the uniformity of the airstream at the outlet, noise generation, and the energy efficiency. With the aid of a comprehensive parametric study, the optimal fan design is obtained by selecting an appropriate set of design parameters regarding the impeller blades and the protective cover. Furthermore, mockups of the optimal impeller and protective cover are fabricated via the CNC technology for testing the fan performance. Later, the simulation results are utilized to compare with the experiment results to validate the accuracy and reliability of the CFD approach. The experiment results are summarized below.
First of all, based on the measurement, the optimal design fan is obviously superior to the original design by an impressive 54% enlargement on the flow rate while the maximum velocity is slightly smaller than that of the reference fan. It follows that the velocity distribution of the optimal fan is quite uniform, flat shaped, and widely extended. On the other hand, although the redesign fan #1, which is constructed by integrating the optimal impeller and reference protective cover, can increase the flow rate by 47%, the outflow velocity distribution is chaotic and not uniform. Moreover, a comparative analysis of the measurements of the redesign fans #1 and #2 apparently implies that the major influence caused by the impeller redesign is the enlargement of the flow rate, while the change or guiding of the flow direction is the key effect induced by the cover modification. In addition, the trends of the experimental and simulation results are in good agreement, and the deviations between them are found to be within an acceptable range. Besides, the flow field distribution of the CFD calculation is consistent with the experimental result; thus, the accuracy and reliability of the numerical simulation are verified here.
Consequently, this work successfully designs a superior stand fan for delivering a significantly enlarged airstream with a much more uniform and extended velocity distribution, which enables its average flow velocity to be around 1 m/s, preserving the comfortable feeling for the human being. In summary, this research establishes a reliable and systematic scheme to design the stand fan by integrating the numerical, CNC fabrication, and the experimental tools. Also, the corresponding performance influences caused by several important parameters are analyzed and summarized to serve as the design reference for the stand fan.
Acknowledgments
The authors would like to gratefully acknowledge the financial support provided by the Ministry of Science and Technology in Taiwan under the contracts of MOST 104-2221-E-011-095 and 105-2221-E-011-067.
Author Contributions
Sheam-Chyun Lin conceived and wrote the paper; Ming-Chiou Shen conducted the numerical work and provided useful suggestions for the preparation of the paper; Hao-Ru Tso and Yu-Cheng Chen performed the simulations and measurements, and revised the paper; Hung-Cheng Yen offered the mockup fabrications for performance measurements and analyzed the data.
Conflicts of Interest
The authors declare no conflict of interest.
References
- Balje, O.E. Turbomachines—A Guide to Design, Selection and Theory; John Wiley: New York, NY, USA, 1981. [Google Scholar]
- Venter, S.J.; Kroger, D.G. The effects of tip clearance on the performance of an axial flow fan. Energy Convers. Manag. 1992, 33, 89–97. [Google Scholar] [CrossRef]
- Lin, S.C.; Huang, C.L. An integrated experimental and numerical study of forward-curved centrifugal fan. Exp. Therm. Fluid Sci. 2002, 26, 421–434. [Google Scholar] [CrossRef]
- Lin, S.C.; Tsai, M.L. An integrated performance analysis for a small axial-flow fan. Proc. Inst. Mech. Eng. C 2010, 224, 1981–1994. [Google Scholar] [CrossRef]
- Lin, S.C.; Tsai, M.L. An integrated study on the design method for small axial-flow fans, based on the airfoil theory. Proc. Inst. Mech. Eng. C 2011, 225, 885–895. [Google Scholar] [CrossRef]
- Lin, S.C.; Tsai, M.L. An integrated performance analysis for a backward-inclined centrifugal fan. Comput. Fluids 2012, 56, 24–38. [Google Scholar] [CrossRef]
- Lin, S.C.; Hsieh, M.Y. An integrated numerical and experimental analysis for enhancing the performance of the hidden ceiling fan. Adv. Mech. Eng. 2014, 6, 214967. [Google Scholar] [CrossRef]
- ANSYS Fluent User’s Guide-14.5; ANSYS Inc.: Canonsburg, PA, USA, 2012.
- Patankar, S.V.; Spalding, D.B. A calculation procedure for heat mass and momentum transfer in three-dimensional parabolic flows. Int. J. Heat Mass Transf. 1972, 15, 1787–1806. [Google Scholar] [CrossRef]
- Hinze, J.O. Turbulence; McGraw-Hill: New York, NY, USA, 1975. [Google Scholar]
- Launder, B.E.; Spalding, D.B. Lectures in Mathematical Models of Turbulence; Academic Press: London, UK, 1972. [Google Scholar]
- Ariff, M.; Salim, S.M.; Cheah, S.C. Wall y+ approach for dealing with turbulent flow over a surface mounted cube: Part 1—Low Reynolds number. In Proceedings of the Seventh International Conference on CFD in the Minerals and Process Industries CSIRO, Melbourne, Australia, 30 May–1 June 2009.
- Ariff, M.; Salim, S.M.; Cheah, S.C. Wall y+ approach for dealing with turbulent flow over a surface mounted cube: Part 2—High Reynolds number. In Proceedings of the Seventh International Conference on CFD in the Minerals and Process Industries CSIRO, Melbourne, Australia, 30 May–1 June 2009.
- ENERGY STAR® Laboratory Guidance Manual: Building a Testing Facility and Performing the Solid State Test Method for ENERGY STAR Qualification of Ceiling Fans; ENERGY STAR: Atlanta, GA, USA, 2011.
- CNS 2061. Electric Fan (Stand Type); Chinese National Standard: Taipei, Taiwan, 1992. [Google Scholar]
- CNS 8753. Determination of Sound Power Level of Noises for Fan, Blower, and Compressors; Chinese National Standard: Taipei, Taiwan, 1982. [Google Scholar]
- ISO 3745. Acoustics—Determination of Sound Power Levels of Noise Sources Using Sound Pressure—Precision Methods for Anechoic and Hemi-Anechoic Rooms; ISO: London, UK, 2003. [Google Scholar]
© 2017 by the authors. Licensee MDPI, Basel, Switzerland. This article is an open access article distributed under the terms and conditions of the Creative Commons Attribution (CC BY) license ( http://creativecommons.org/licenses/by/4.0/).


