Review

Fouling in Membrane Distillation, Osmotic Distillation and Osmotic Membrane Distillation

1
Department of Applied Physics I, Faculty of Physics, University Complutense of Madrid, Avda. Complutense s/n, 28040 Madrid, Spain
2
Laboratory of Materials Engineering and Environment, Department of Chemistry, Faculty of Sciences Dhar El Mehraz, 30000 Fez, Morocco
3
Madrid Institute for Advanced Studies of Water (IMDEA Water Institute), Avda. Punto Com 2, Alcalá de Henares, 28805 Madrid, Spain
*
Author to whom correspondence should be addressed.
Appl. Sci. 2017, 7(4), 334; https://doi.org/10.3390/app7040334
Submission received: 1 February 2017 / Revised: 17 March 2017 / Accepted: 24 March 2017 / Published: 29 March 2017
(This article belongs to the Special Issue Membrane Distillation)

Abstract

:
Various membrane separation processes are being used for seawater desalination and treatment of wastewaters in order to deal with the worldwide water shortage problem. Different types of membranes of distinct morphologies, structures and physico-chemical characteristics are employed. Among the considered membrane technologies, membrane distillation (MD), osmotic distillation (OD) and osmotic membrane distillation (OMD) use porous and hydrophobic membranes for production of distilled water and/or concentration of wastewaters for recovery and recycling of valuable compounds. However, the efficiency of these technologies is hampered by fouling phenomena. This refers to the accumulation of organic/inorganic deposits including biological matter on the membrane surface and/or in the membrane pores. Fouling in MD, OD and OMD differs from that observed in electric and pressure-driven membrane processes such electrodialysis (ED), membrane capacitive deionization (MCD), reverse osmosis (RO), nanofiltration (NF), ultrafiltration (UF), microfiltration (MF), etc. Other than pore blockage, fouling in MD, OD and OMD increases the risk of membrane pores wetting and reduces therefore the quantity and quality of the produced water or the concentration efficiency of the process. This review deals with the observed fouling phenomena in MD, OD and OMD. It highlights different detected fouling types (organic fouling, inorganic fouling and biofouling), fouling characterization techniques as well as various methods of fouling reduction including pretreatment, membrane modification, membrane cleaning and antiscalants application.

1. Introduction

The lack of potable water is one of the continuous problems in many parts of the word. Seawater desalination using isothermal membrane separation processes such as reverse osmosis (RO) and nanofiltration (NF) are a convincing solution. Pressure-driven membrane processes are limited in recovery factor due to the osmotic pressure, which increases with salinity, enhancing therefore water cost and environmental perturbations when the brines are not recycled and discharged directly in the feed water source (e.g., seas and rivers).
Membrane distillation (MD), osmotic distillation (OD) and osmotic membrane distillation (OMD) processes are used not only in desalination for water production and concentration of brines but also for the treatment of wastewaters (e.g., textile, radioactive, pharmaceutical, metallurgical, petrochemical, etc.) and concentration of heat-sensitive solutions such as fruit juices, liquid foods, natural colors and biological fluids since these processes operate at moderate temperatures and under atmospheric pressure.
MD is a thermally-driven separation process, in which only vapor molecules are transported through a microporous hydrophobic membrane. The MD driving force is the transmembrane vapor pressure difference [1,2,3]. Various MD configurations have been considered to apply this driving force. In direct contact membrane distillation (DCMD) both the hot feed solution and the cold liquid permeate are maintained in direct contact with both sides of the membrane. This is the widely employed MD variant because of its simple design [1]. In this case volatile molecules evaporate at the hot liquid/vapor interface, cross the membrane pores in vapor phase and condense in the cold liquid/vapor interface inside the membrane module [2]. Liquid gap MD (LGMD) is another DCMD variant in which a stagnant cold liquid, frequently distilled water, is maintained in the permeate side between the membrane and a cold surface [2]. The main disadvantage of DCMD and LGMD is the heat lost by conduction through the membrane [1]. If in LGMD the liquid is evacuated from the permeate side leaving a stagnant air gap between the membrane and the cold surface for the condensation of the volatile molecules, the configuration is termed air gap MD (AGMD) [2]. One of the advantages of this MD variant is the low heat transfer by conduction through the membrane from the feed to the permeate side [1]. However, in this case an additional resistance to mass transfer is built reducing the permeate flux. If in AGMD, a cold inert gas is circulated through the permeate side to carry out the produced vapor at the permeate membrane surface for condensation outside the membrane module in an external condenser(s), the configuration is called thermostatic sweeping gas MD (TSGMD) [2]. If the condensing surface is removed from the permeate side, the process is termed simply sweeping gas MD (SGMD). Therefore, TSGMD is a combination of AGMD and SGMD and it was proposed to reduce the increase of the gas temperature along the membrane module length [1]. Another way to establish the necessary driving force in MD is by means of a vacuum pump connected to the permeate side of the membrane module. This configuration is called vacuum MD (VMD) [2]. In this case the applied vacuum pressure must be lower than the saturation pressure of the volatile molecules to be separated from the feed solution and the condensation takes place outside the membrane module. It is necessary to point out that MD was applied principally in desalination for the production of high purity water. Other fields of applications have also been considered at laboratory scale such as the treatment of textile wastewater, olive mill wastewater, humic acid (HA) and radioactive aqueous solutions, etc. [2].
Contrary to DCMD, osmotic distillation (OD) is an isothermal technology used to remove water from aqueous solutions [4] (i.e., concentration of wastewaters and recovery of valuable components) [5] using a porous and hydrophobic membrane that separates the feed solution to be treated and an osmotic solution (i.e., a draw solution having high osmotic pressure and low water chemical potential) [6]. Generally NaCl, CaCl2, MgCl2, MgSO4, K2HPO4 KH2PO4 and some organic liquids like glycerol or polyglycols were considered to prepared the osmotic solution [7]. One of the advantages of the OD process is the less energy required compared to MD [8]. It was generally applied for concentrating liquid foods, such as milk, fruit and vegetable juices [5].
OMD is a combination of DCMD and OD being the driving force both the transmembrane temperature and concentration or which is the same water chemical potential. It is a non-isothermal process in which the membrane is brought into contact with the hot feed aqueous solution to be treated and a cold osmotic solution [9]. OMD is also able to concentrate liquid foods (i.e., fruit and vegetable juices), sucrose aqueous solutions [10].
The three separation processes MD, OD and OMD require the use of porous and hydrophobic membranes and, like other membrane technologies, they also suffer from different fouling phenomena that reduce not only the permeability and separation performance of the membrane but its lifetime as a consequence. The foulants (e.g., natural organic matter, NOM [11]; inorganic and biological solutes or microbial contaminants) contribute to the permeate flux decline, modify the membrane surface properties and change the product water quality. Analysis of fouling process and identification of foulants by means of characterization techniques are important to determine suitable treatment methods for fouling control. It is worth noting that very few studies have been published so far on fouling mechanisms in MD, OD and OMD and investigations on the kinetics behind fouling phenomena and fouling mitigation remain very scarce [12,13]. Two review papers have been published on fouling and scaling in MD but not on OD and OMD [14,15]. Moreover, when fouling is studied, the considered characterization techniques focused only on the average physico-chemical properties of the surface deposits but not on the underlying deposit layers [12].
One of the causes of porous and hydrophobic membrane fouling is pore blockage due to the deposit of foulant(s) such as organics, inorganic or minerals, colloids, microbial contaminants and particles not only on the membrane surface but also inside the membrane pores affecting the hydrophobic character of the membrane and its wettability [16,17]. Fouling in MD, OD and OMD is a complex phenomenon influenced by various parameters such as the membrane characteristics, especially the pore size and the material of the membrane surface, operation conditions and nature of feed aqueous solutions.
To control fouling phenomena, researchers have tried various strategies such as the consideration of feed pretreatment(s), increase of feed flow rate creating turbulent flow regime, application of periodic hydraulic and/or chemical cleanings, reduction of membrane surface roughness and/or change of its surface charge [16,18].
It must be mentioned that MD, OD and OMD membrane technologies suffer from temperature and/or concentration polarization, or, equivalently, vapor pressure polarization. Various strategies have been adopted in order to reduce the vapor pressure polarization (i.e., the water vapor pressure at the membrane surface become closer to that of the bulk solution) including the increase of the flow rate of both the feed and permeate solutions, turbulent promoters, etc. It must be noted that concentration and temperature polarization can also have a major influence on fouling.
This review deals with the observed fouling phenomena in MD, OD and OMD. It highlights different detected fouling types (organic fouling, inorganic fouling and biofouling), fouling characterization techniques as well as various methods of fouling reduction including pretreatment, membrane modification, membrane cleaning and antiscalants application. Updated research studies and interesting observations on fouling and pretreatments are summarized in tables for different MD configurations, OD and OMD. Not only the characterization techniques that have been used so far in MD are cited in the present review, but other useful techniques for fouling analysis and detection considered in other processes are included. These will improve the understanding of fouling in MD, OD and OMD, to prevent it properly.

2. Membrane Characteristics

The membranes used in MD, OD and OMD must be hydrophobic and porous with pore sizes ranging from some nanometers to few micrometers [2,19]. Their characteristics such as the thickness, tortuosity, pore size and porosity dictate the resistance to mass transfer in these three processes [20]. Their pore size distributions should be as narrow as possible and the maximum pore size should be small enough to prevent liquid penetration in such pores [2,19,21]. The liquid entry pressure (LEP), which is the minimum transmembrane pressure required for a liquid or a given feed solution to enter into the pore, is a significant membrane characteristic for MD, OD and OMD. LEP is high for small maximum pore sizes and more hydrophobic membranes [1]. The membrane thickness is inversely proportional to the rate of mass and heat transfer through the membrane. In the case of multi-layered membranes, the hydrophobic layer should be as thin as possible [2,19]. In order to achieve a high thermal efficiency in MD and OMD, the thermal conductivity of the membrane material should be as low as possible [19].
More details on the properties needed for a membrane to be used in MD are summarized elsewhere [15,18,19,22,23]. Eykens, et al. [23] gave a comprehensive overview of the optimal membrane properties, specifically for MD process. The wetting resistance is the key factor considered in the optimization study. The recommended optimal membrane properties were summarized as a pore diameter of 0.3 μm to balance between a high LEP (preferably >2.5 bar) and a high permeate flux, an optimal membrane thickness between 10 and 700 μm depending on the process conditions in order to take into account the compensation between mass transport and energy loss, a membrane porosity that should preferably be as high as possible (>75%) in order to improve both the mass transfer and energy efficiency, a pore tortuosity factor that should be as low as possible (1.1–1.2) and a membrane thermal conductivity that should be also as low as possible (>0.06 W·m−1·K−1) in order to reduce the heat loss due to the heat transfer by conduction through the membrane matrix. Additionally, it was stated that thinner membranes with a thickness below 60 μm exhibited low mechanical properties. As it is well known, a way to improve the mechanical properties of a membrane without scarifying its other characteristics is the design of supported membranes using baking materials with a high porosity, a low thickness and a high thermal conductivity.
In addition, the feed side of the membrane must be formed by a material of high fouling resistance properties. Different membrane surface modification techniques have been considered such as coating, interfacial polymerization, plasma treatment, etc. [2,19,24]. For instance, to avoid wetting and membrane fouling the porous hydrophobic membrane surface needs to be modified by coating a thin layer of a hydrophilic polymer [24,25,26]. This was necessary for concentration of oily feeds, because the uncoated membranes were promptly wetted even for low concentrations of oil in water solutions [25]. Recently, the effects of surface energy and its morphology on membrane surface omniphobicity (i.e., membranes resistant to wetting to both water and low surface tension liquids, e.g., oil and alcohols) have been systematically studied by means of wetting resistance evaluation using low surface tension liquids [27,28]. It was found that the negatively charged nanofibrous membrane fabricated by a blend of poly(vinylidene fluoride-co-hexafluoropropylene), PVDF-HFP, and the cationic surfactant benzyltriethylammonium, and then grafted by a negatively charged silica nanoparticles, exhibited excellent wetting resistance against low surface tension aqueous solutions and organic solvents (i.e., mineral oil, decane and ethanol). An et al. [29,30] demonstrated that the MD membranes having negative charge such as PTFE at pH values in the range 5.2–9.1 were resistant to dye adsorption. The strong negative charge and chemical structure of the membrane resulted in a low adsorption affinity to negatively charged dyes causing a flake-like (loose) dye-dye structure to form on the membrane surface rather than in the membrane pores or even repulsed from the membrane forming aggregates away from the membrane interface. In addition, the loose fouling structure that may be formed on the surface of the negatively charged membranes can be easily washed out by simple intermittent water flushing. It is to be noted that the membrane must be cleaned if any fouling is detected and therefore it should exhibit an excellent chemical resistance to acid and base components that are generally used in membrane cleaning [19].

3. Fouling in MD, OD and OMD

The performance of the membrane can be affected by the deposition of a fouling layer on the membrane surface or in the membrane pores [31]. The decline of water permeate flux is attributed to both temperature and concentration polarization effects as well as fouling phenomena [32].

3.1. Fouling in MD

Compared to fouling in other membrane separation processes such as the pressure-driven membrane processes (MF, NF, RO, etc.) fouling in MD is still relatively less studied and poorly understood [33,34,35]. In MD, fouling can be divided into three types: organic fouling, inorganic fouling and biological fouling. In general, the foulants interact with each other and/or with the membrane surface to form deposits. This results in permeate flux decline by two phenomena, a partial or total blockage of the pores, which decreases the available evaporation area; or the formation of a fouling layer on the membrane surface leading to the appearance of a new resistance to mass transfer. As a consequence, the membrane becomes more prone to wetting, especially for long term MD operations. It is worth noting that most of the published studies on fouling phenomena in MD are for DCMD configuration. Table 1 summarizes the published papers on fouling in DCMD when using different membrane materials (polytetrafluoroethylene, PTFE, polyvinylidene fluoride, PVDF, and polypropylene, PP, polymers) and membrane type (flat-sheet, hollow fiber or capillary membranes). Very few studies have been published on fouling in other MD configurations. Table 2 listed the published papers on fouling in AGMD and VMD configurations. In order to compare the effects of the foulants, membranes, MD configurations, etc. the normalized flux decline, FDn, defined in the following equation was used:
F D n ( % ) = ( 1 J f J 0 ) × 100
where J 0 and J f correspond to the initial and final permeate fluxes, respectively. As it can be seen in Table 1 and Table 2, the FDn values varied between 0% and 95%. These values are strongly dependent on the foulant nature. In general, organic foulants induced greater normalized flux decline than the inorganic foulants.

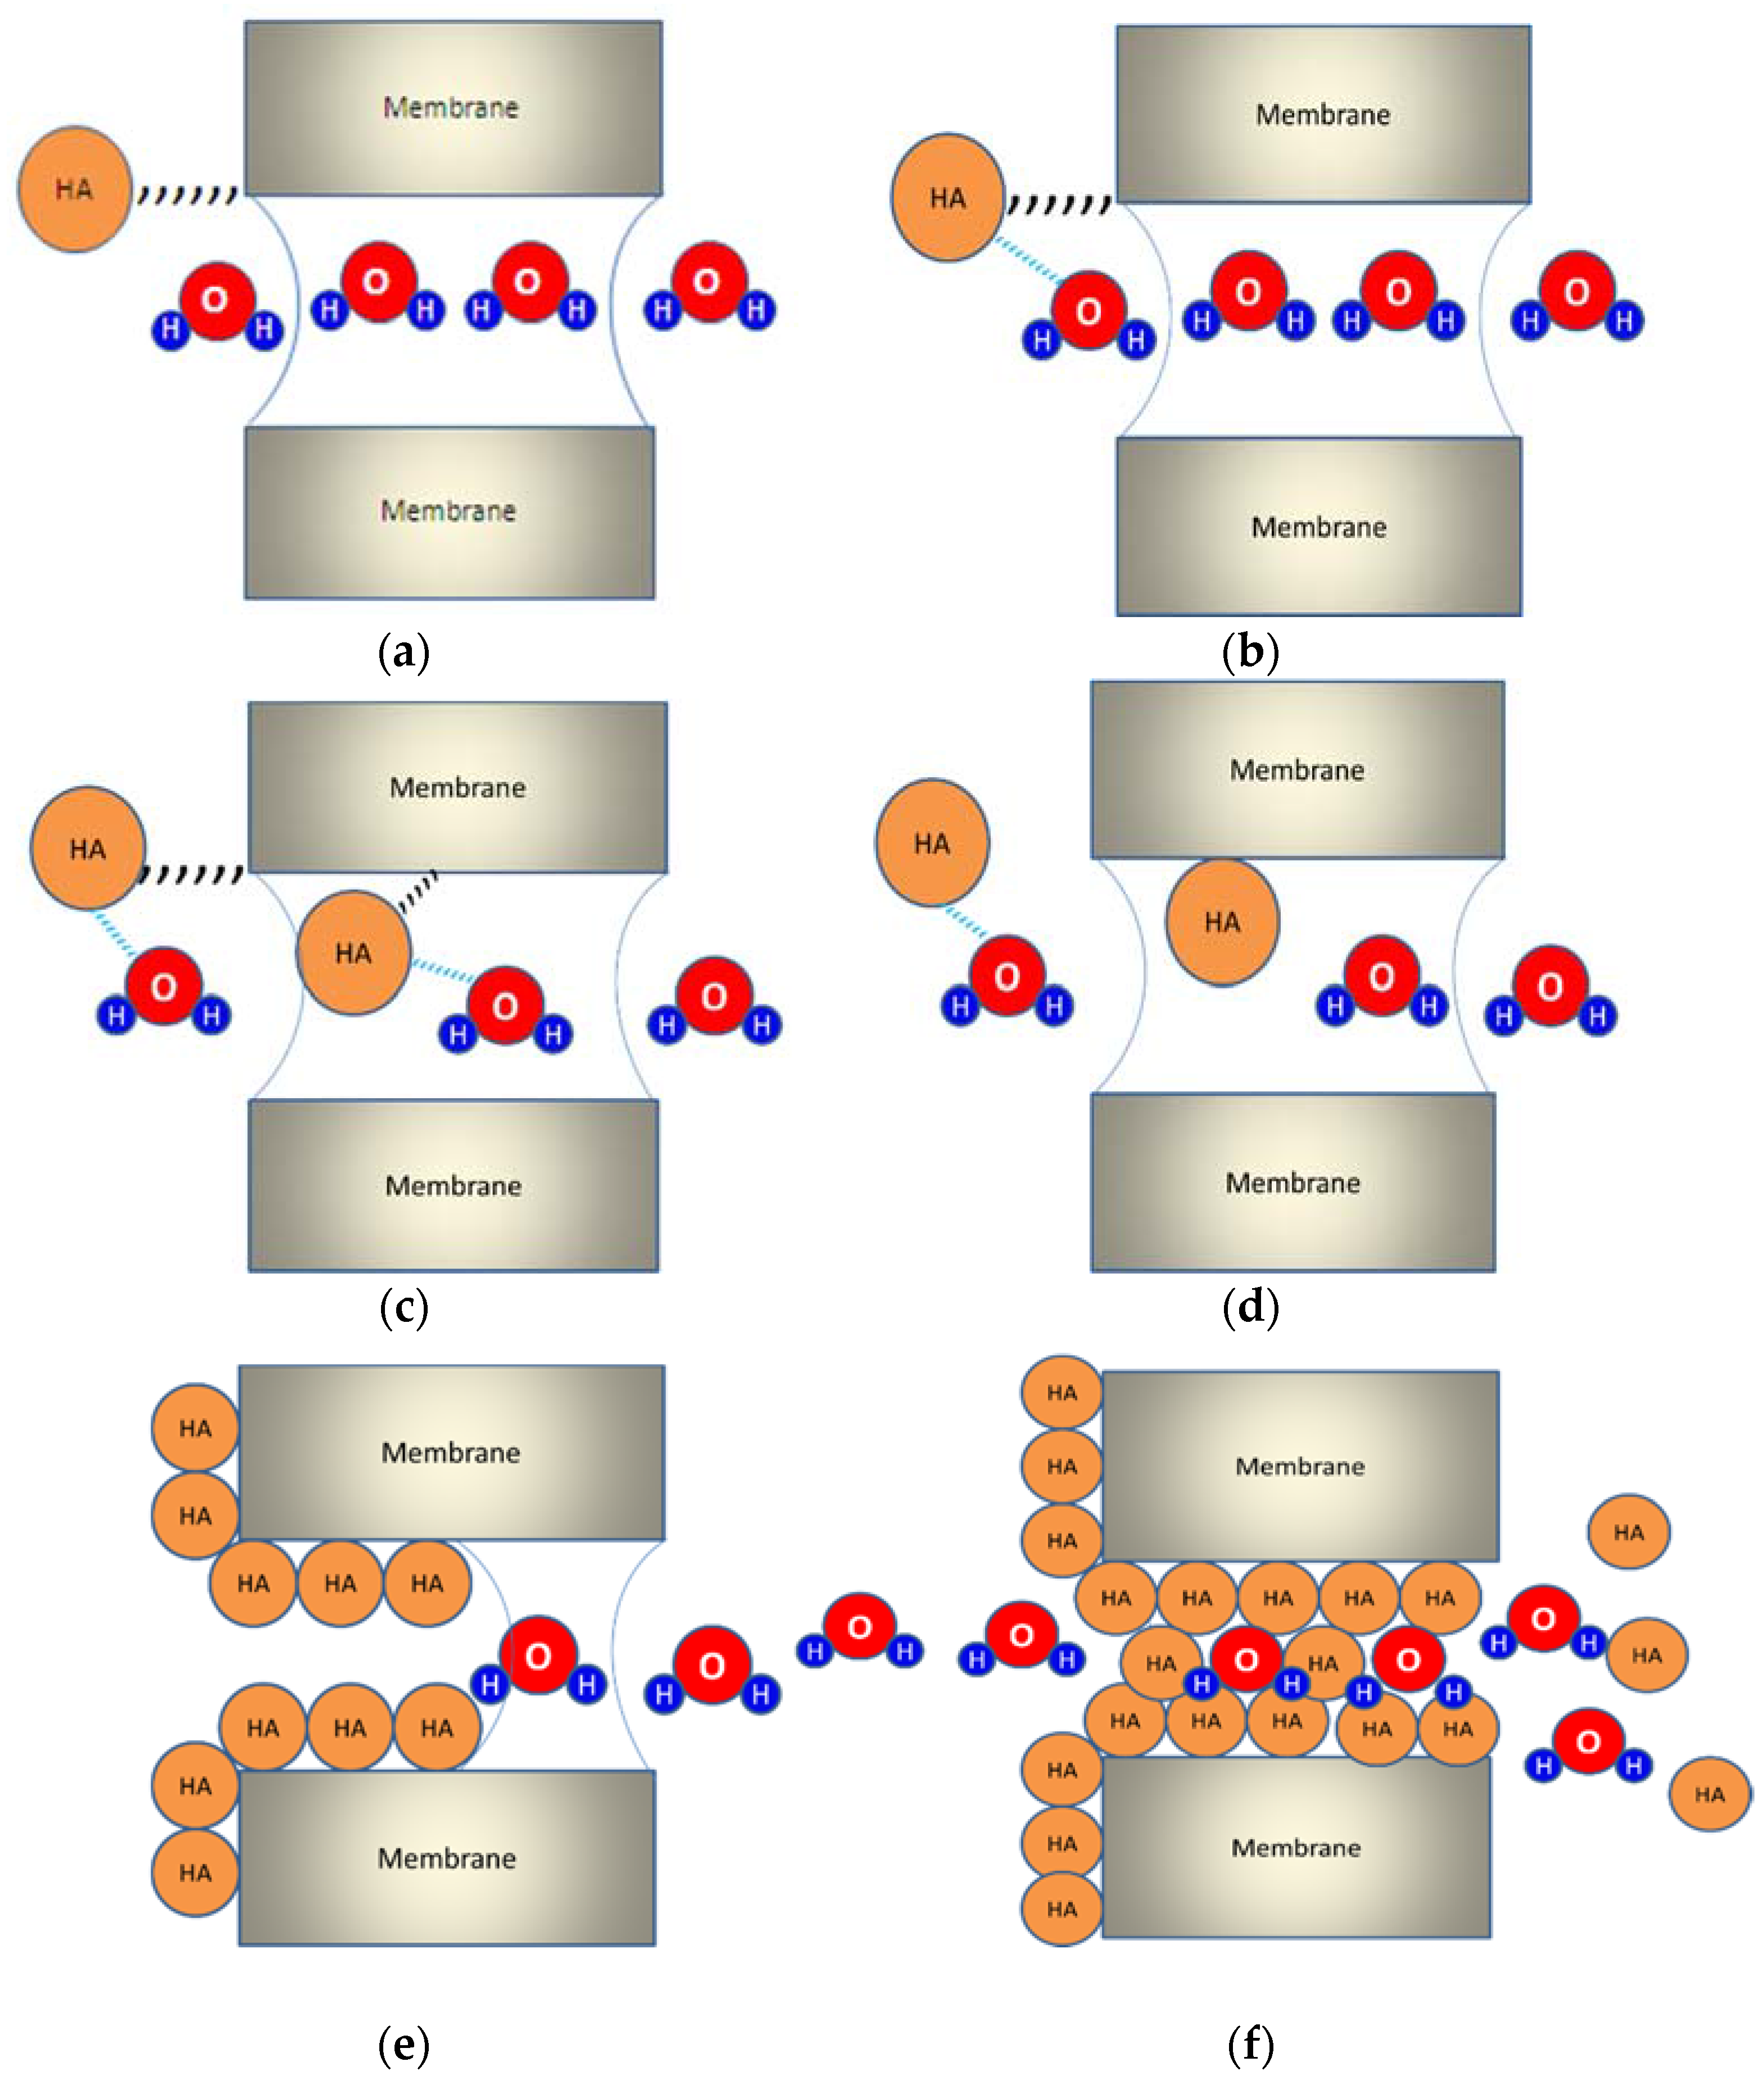
3.1.1. Organic Fouling

Organic fouling results from the deposition of natural organic matter (NOM) on the membrane surface like carboxylic acid, humic acid (HA), alginate acid (AA), proteins, polysaccharides, etc. The principal constituents of NOM are the humic substances, which are found in surface water, ground water and seawater, followed by carbohydrates (including polysaccharides), protein and a variety of acidic and low molecular weight (LMW) species [40,60,61]. This fouling is dependent on several factors including the surface characteristics of the membrane. For instance, greater hydrophobicity and lower pore size tends to increase fouling effects [31]. However, fouling also depends on the nature of the organic matter, the MD operating conditions (temperature, transmembrane pressure, flow rate) and the characteristics of the feed solution (pH, ionic strength). Figure 1 shows the adsorption–desorption mechanism for HA migration through a membrane pore. The process involves the adsorption of HA onto membrane surface, hydrogen bonding between water and HA and weakening of hydrogen bond as water vapor moves through the membrane, and re-adsorption of HA onto the membrane as well as pore wetting.
Nilson and Digiano [62] investigated the effect of NOM properties on NF membrane fouling by fractionating NOM into hydrophilic and hydrophobic components. Fouling tests revealed that the hydrophobic fraction of NOM was mostly responsible for permeate flux decline, whereas the hydrophilic fraction caused a lesser fouling. Khayet, et al. [11,31] performed DCMD treatment by HA solutions (10 to 50 mg·L−1) and the obtained results showed a permeate flux reduction less than 8% after 30 h of operation for the commercial PTFE and PVDF membranes. Other studies used HA solutions with concentrations ranging from 20 to 100 mg·L−1 and observed a very limited fouling with a permeate flux decline less than 6% [42]. The reversibility or cleaning of organic fouling was also investigated but the drawn conclusions varied because of the possible variety of organic fouling such as organic or organometallic complex (i.e., compound containing a metal atom bonded to an organic group). Naidu, et al. [40] studied organic fouling behavior in DCMD using synthetic model solutions of HA, AA and bovine serum albumin (BSA). BSA and HA showed a dominant fouling with a permeate flux decline of 50%, whereas AA showed minimal fouling due to its hydrophilic nature [40]. When comparing BSA and HA feed solutions, higher deposits were detected for BSA feed solution (i.e., 35.2% higher carbon mass); and the analysis of fouled membrane proved the penetration of organic compounds through the membrane pores when using HA feed solution [40].
It was demonstrated that the aggregation of the HA and the increase of membrane fouling is favored with the addition of multivalent cations and the increase of electrolyte (NaCl) concentration in the feed aqueous solution. Multivalent cations including Calcium (Ca2+) are known to form complexes with NOM and interact specifically with humic carboxyl functional groups reducing the humic charge and the electrostatic repulsion forces between humic macromolecules resulting in aggregates in NF or MF processes [60,63].
Some studies showed the irreversibility of organic fouling in DCMD [11,31]. However, other studies claimed the reversibility/cleaning of organic fouling, e.g., the complexes formed by calcium ion (Ca2+) and organic matter that precipitates only on membrane surface forming a thin deposit layer, which is eliminated completely by a simple cleaning with water and with 0.1 M sodium hydroxide solution [42]. It was reported that cleaning the membrane by a simple flushing with deionized water through the feed channel at a flow velocity of around 1 m·s−1 permitted the recovery of up to 98% of permeate flux [40].
Gryta [64] proved that organic fouling can be prevented if a specific pretreatment is applied. Before the MD treatment of wastewater originated from heparin production from intestinal mucous, Gryta [64] separated these materials by boiling during 30 min followed by their separation after filtration. Srisurichan, et al. [42] studied the HA fouling in MD and reported that greater fouling and severe permeate flux decline (i.e., ratio of final and initial permeate fluxes, J/Jo = 0.57) was observed after 18 h of operation in presence of high concentration of CaCl2 (≈3.775 mM) in which large amounts of HA were present in coagulate form.

3.1.2. Inorganic Fouling
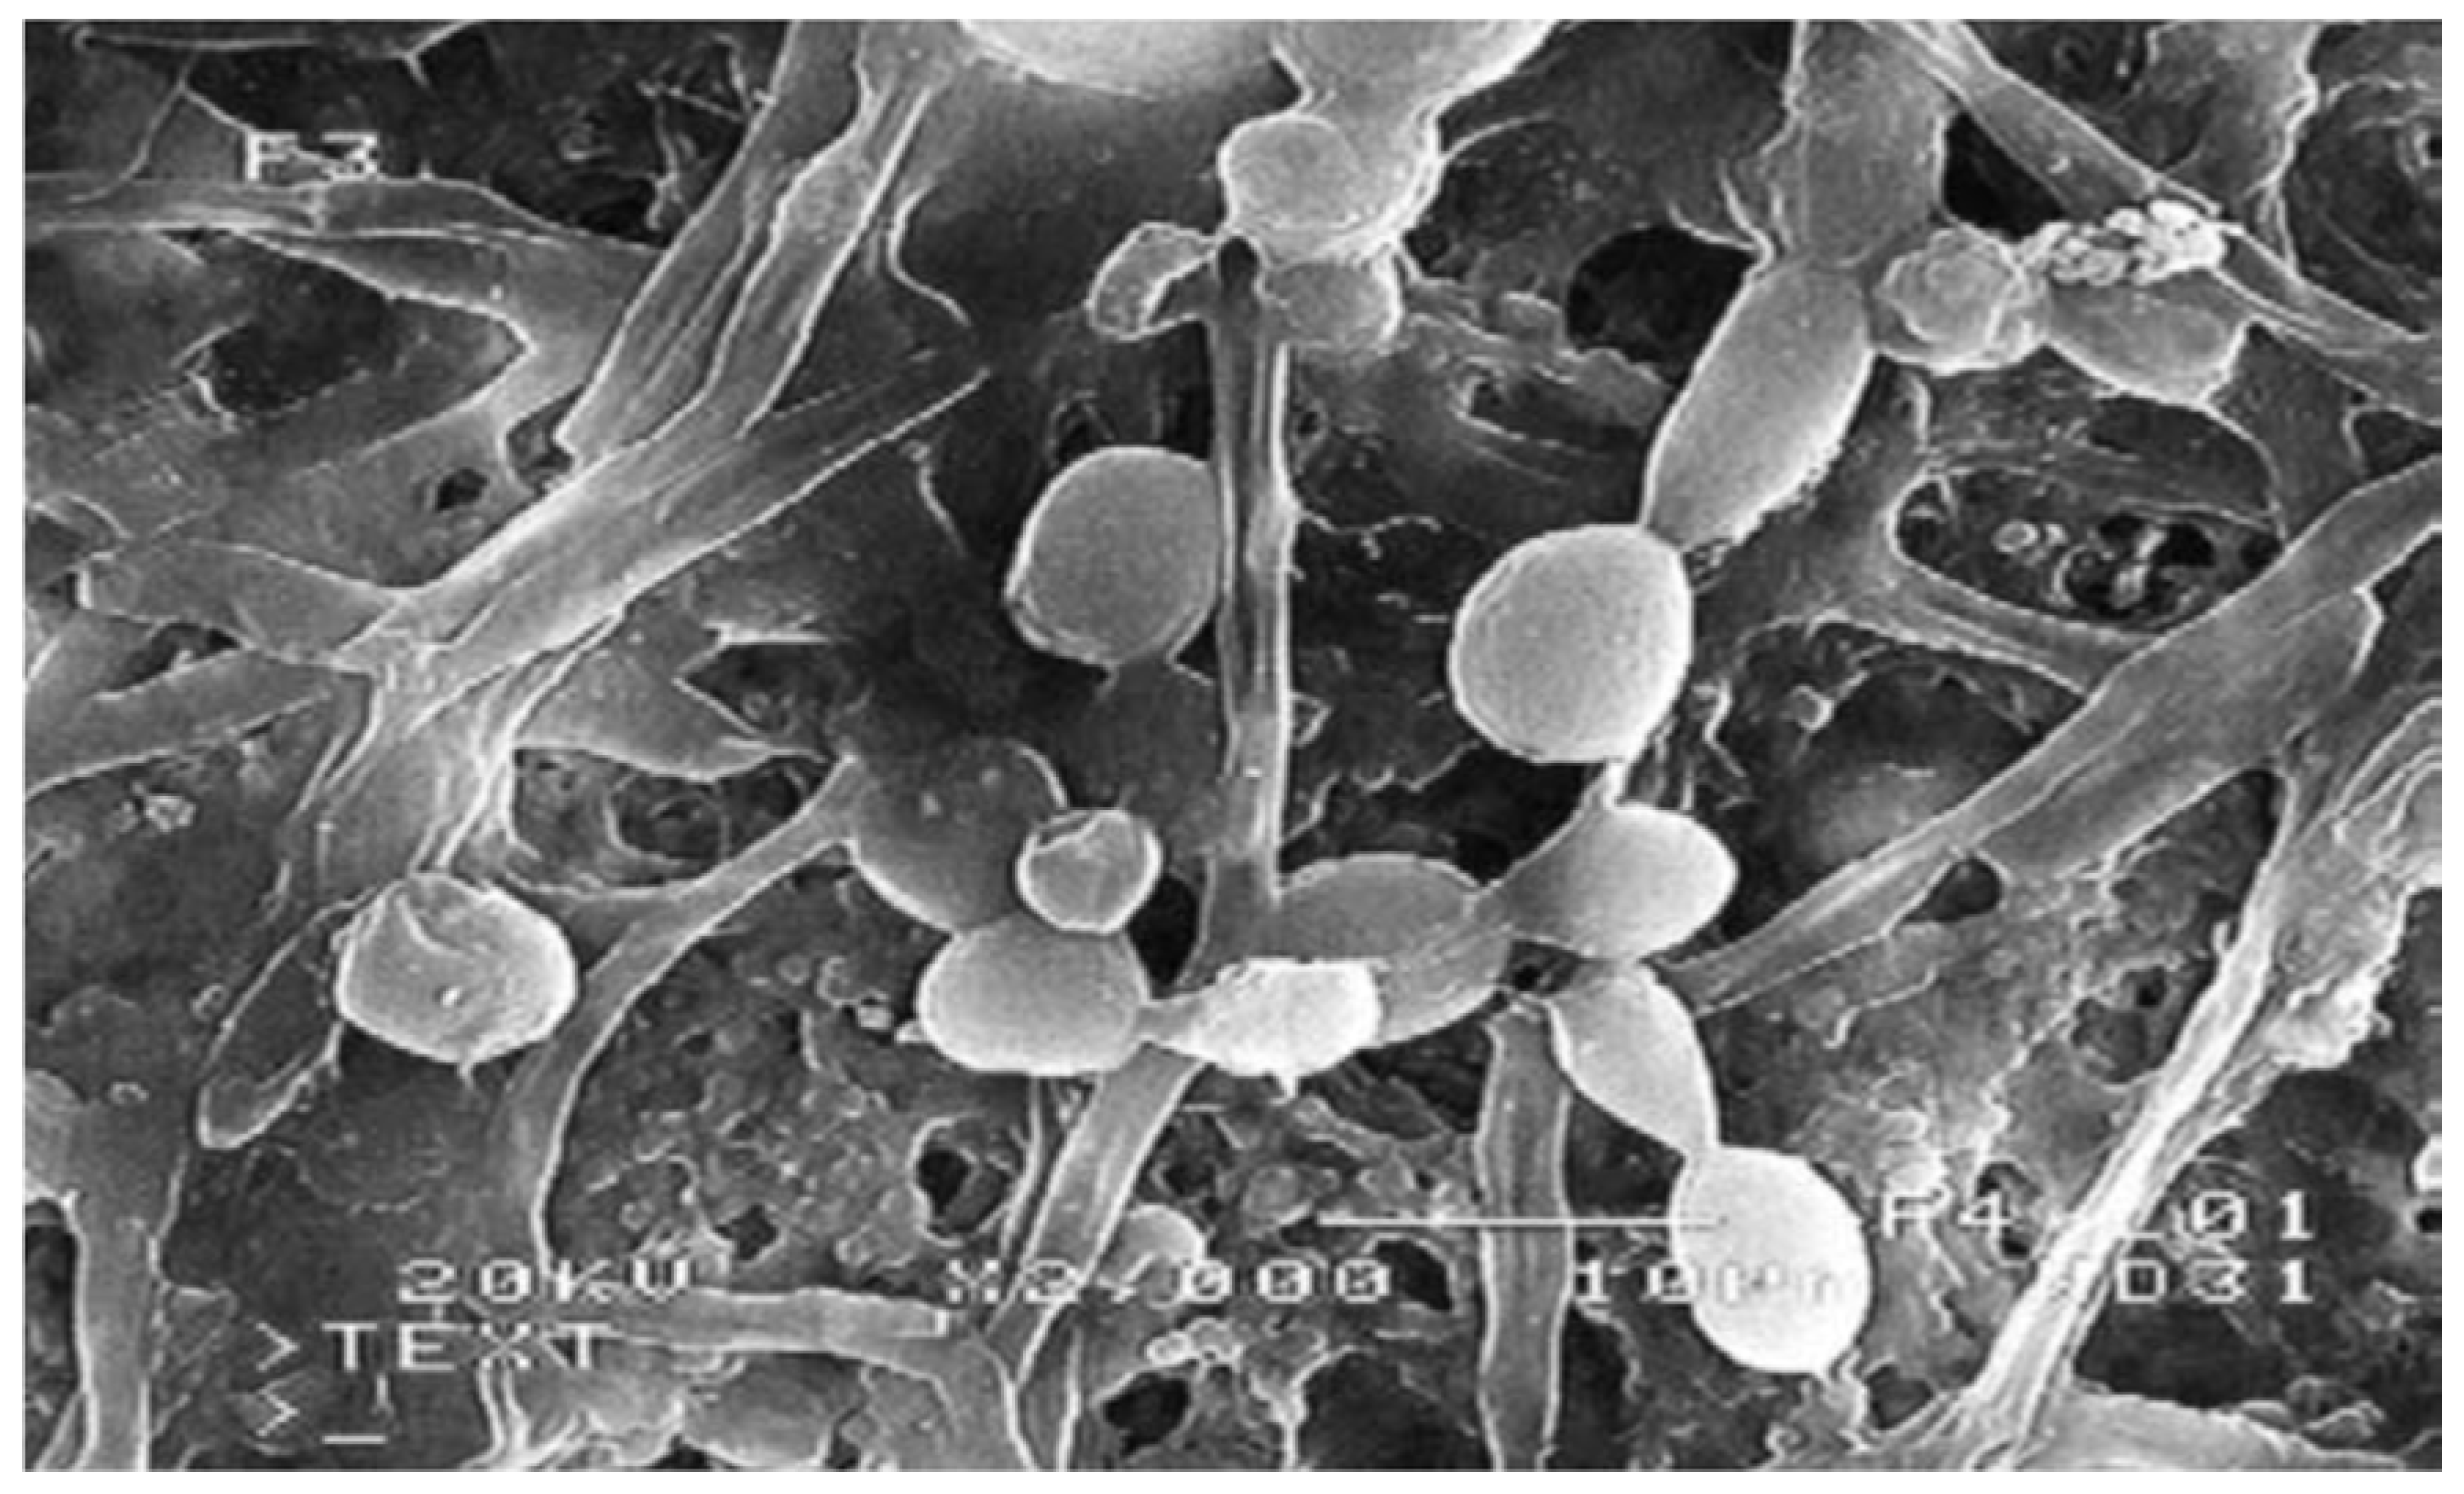
Inorganic fouling in MD is due to the precipitation and crystallization of salts present in the used aqueous feed solutions. In the case of desalination of seawater, crystallization fouling is attributed mainly to sodium chloride (NaCl), which is the predominant salt in the feed solution other than the divalent ions such as calcium or magnesium salts. It is worth noting that sodium chloride can precipitate as halite (i.e., cubic crystals of NaCl), while calcium sulfate precipitates following its hydration, in the form of anhydrite (CaSO4), hemihydrate (CaSO4·½H2O) or gypsum (CaSO4·2H2O) [65]. Calcium carbonate (CaCO3) precipitates as calcite (cubic crystals of CaCO3) and it is usually found in the form of rhombohedron, which is the most thermodynamically stable form of all other varieties such as aragonite (less stable than calcite) and vaterite (spherical crystals of CaCO3) [65].
It is to be noted that the concentration and temperature polarization may have a major influence on inorganic fouling in MD. For a salt whose solubility decreases with increasing temperature (e.g., CaCO3, CaSO4, BaSO4) the temperature polarization phenomenon induces the formation of these salt(s) crystals in the bulk feed and not on the membrane surface provided that the temperature at the membrane surface is lower. On the other hand, for salts whose solubility increases with increasing temperature (e.g., NaCl), the concentration and temperature polarization phenomena encourage the formation of crystals on the membrane surface, where the concentration is higher and temperature is lower and not in the bulk feed, where the temperature is higher and concentration is lower.
Basically, the carbonic system is derived from the dissolution of carbon dioxide and carbonate minerals in water. Thus, carbonate is a weak acid-base system, which exists in aqueous solutions as dissolved carbon dioxide CO2aq. carbonic acid (H2CO3), bicarbonate (HCO3), carbonate ions (CO32−) and complexes of these ions such as CaHCO3+,CaCO3 [65]. Dissolved carbon dioxide is hydrated in a few minutes according to the reaction (CaCO3aq + H2O CO2, H2O). The term H2CO3 refers to the composite form, which is the sum of the activities of molecularly dissolved carbon dioxide CO2aq, and the hydrated form CO2, H2O.
In MD literature, research studies on inorganic fouling have focused on the treatment of aqueous solutions containing NaCl by VMD using hollow fiber membranes [66] or by DCMD using flat sheet membranes [67]. It was detected a limited permeate flux decline of about 30% to 35% at concentrations ranging from 15 to 300 g/L. When the salts crystallize on the membrane surface, these can cover the pores and reduce the effective area available for vapor-liquid interface reducing subsequently the permeate flux. On the other hand, another negative effect is the possible partial or total wetting of the membrane pores.
He, et al. [34] did not observe any decrease of the permeate flux even for very high calcium sulfate and calcium carbonate aqueous solutions [35]. In the most unfavorable case, the decrease of the permeate flux was only 11% after 6 h of DCMD operation of a feed solution containing both calcium sulfate and calcium carbonate with the saturation index (SI) 1.21 and 49 at 75 °C, respectively. The treatment with HCl acid to reduce the pH value and limit the precipitation of carbonates was not necessary [35]. However, Gryta, et al. [68] observed a high decline of the permeate flux due to the blockage of the membrane pores when wastewater was concentrated in salts up to 48.9 g/L (mainly NaCl in presence of other salts like Mg, K and Ca) [68]. The effect of the salts crystallization on pore wetting was detected by Gryta [33,69] who found a significant wetting of pores in the presence of CaCO3 crystals when treating water containing organic matter (TDS = 409–430 mg·L−1, TOC = 6.8–8.5 mg·L−1). This phenomenon led to a decrease of the permeate flux and an increase of the salts concentration of the permeate. Moreover, the precipitation of calcium carbonate may lead to the degassing of CO2 that eventually is transported through the membrane pores to the permeate according to the following reactions: 2HCO3 H2O + CO2↑ + CO32−; CO32− + Ca2+ CaCO3↓; 2HCO3 + Ca2+ H e a t H2O + CO2↑ + CaCO3↓ [35].
When salts are precipitated, these can be removed by a simple circulation of water tangentially to the membrane [34]. He, et al. [35] cleaned the membranes by washing first with HCl (e.g., elimination of CaCO3 by reducing the pH) then with pure water (e.g., elimination of salts by dissolution) followed by membrane drying. However, the mixture of different salts can form a more compact agglomerate difficult to be detached from the membrane [35].
Tun, et al. [70] and Yun, et al. [71] showed the evolution of the permeate flux with the precipitation of a mixture of Na2SO4 and NaCl salts. The first step is the gradual decline of the permeate flux until reaching the saturation point in which the reduction of is more significant; then a new regime corresponding to low permeate flux occurs when the membrane is almost completely covered by the salts [70,71].
Guillen-Burrieza, et al. [41] investigated the effects of membrane scaling (i.e., salt deposition) on the properties of two commercial hydrophobic membranes (i.e., PTFE and PVDF) [41]. It was proved that hydrophobic PVDF and PTFE membranes were not immune to fouling by salt deposition but behaved differently against it [41]. All the used characterization techniques to detect salt deposition showed significant scaling (i.e., presence of NaCl, MgSiO3, MgCO3 and CaCO3) starting from the first week of seawater desalination. Figure 2 shows the cross sectional SEM images of the PTFE and PVDF membranes after the 4th week of seawater exposure. It was found that the thickness of the salt layer deposited on the membrane surface was about 7 µm for the PTFE membrane having a thickness of 50 µm (Figure 2a) and about 4 µm for the PVDF membrane having a thickness of 23 µm. Similarly, the PVDF membrane with 200 µm thickness showed a salt layer near 15 µm thick (Figure 2b) while the PVDF membrane having 125 µm thickness had about 10 µm thick salt layer [41]. In order to further understand the effects of salt deposition on MD parameters, the mechanical strength, pore size distribution and gas permeability of the membranes were evaluated before and after inorganic fouling. It was proved that inorganic fouling not only altered the membrane’s properties but also the MD performance (i.e., permeate flux and salt rejection) [41].
In order to prevent inorganic fouling, desalination can be carried out using a hybrid process, namely membrane crystallization, that combines both crystallization of salts and MD [70,72,73,74,75]. In this hybrid process crystallization of salts is carried out in a separate tank and the formed crystals are eliminated leading to a conversion rate very close to 100% [73].

3.1.3. Biofouling

Biofouling or biological fouling refers to the growth of bacteria or micro-organisms on the membrane surface (see Figure 3) and biological particles or colloidal species that may be trapped at both the membrane surface and/or pores forming a biofilm [69]. This type of fouling has been less studied in MD compared to other membrane processes such as MF.
It is necessary to point out that there are two types of micro-organisms: aerobic bacteria and anaerobic bacteria. For the aerobic bacteria (pseudomonas faecalis) the operating conditions such as the high temperatures applied in MD are unfavorable to its growth. However, in the case of anaerobic bacteria (Streptococcus faecalis) and fungi (Aspergillus fungi) the high temperatures applied in MD are favorable to their reproduction and growth. In addition, Streptococcus faecalis can penetrate through the membrane pores [64,76]. Therefore, pretreatment by NF and addition of hypochloric acid (pH = 5) completely prevented this type fouling, even after long-term operation (i.e., after 1400 h of operation [76]).
It is worth noting that EPS (i.e., extracellular polymeric substances) excreted by the bacteria are the major structural components of biofilms and are very difficult to remove [14,77,78]. The biofilm structure containing EPS with amphiphilic properties induces the membrane pore wetting leakage of feed solutes to the permeate side [15].
MD bioreactor (MDBR) consists of a MD module submerged in an aerobic–thermophilic bioreactor where the bacteria break down and consume the inorganic and organic solutes, thereby maintaining the functionality of the MD membrane module. However, due to the biomass, biofouling is a problem in MDBR as it is in conventional membrane bioreactors (MBRs). Goh, et al. [79] who used an MDBR with submerged flat sheet PVDF membranes for the treatment of synthetic wastewater, observed a permeate flux decline of 5.9% over 3 days of operation and 51% over 23 days. Confocal microscopy (CM) indicated a biofouling layer thickness of 2–8 mm after 7 days of operation and 20 mm after 22 days [79]. It was concluded that the thin biofouling layer did not significantly affect the resistance to heat transfer but it is resistant to mass transfer [3]. In another study, Goh, et al. [80] analyzed biofouling in cross-flow MD considering two sludges having different hydrophilicities. Compared to distilled water used as feed, it was observed a permeate flux decline for both sludges of 60% over 180 h. CM indicated a thickness of the biofouling layer after 180 h of 7.4–15.1 mm for the more hydrophilic sludge and 8.1–14.4 mm for the less hydrophilic one.

3.2. Fouling in OD

Similar to DCMD, OD operates under atmospheric pressure using porous and hydrophobic membranes but under the same temperature at both the feed and permeate aqueous solutions. Fouling investigation in OD has received less attention compared to MD as it can be drawn from the number of published papers summarized in Table 3.
As stated previously, polarization phenomena exert a major influence on fouling and scaling. According to Bui, et al. [87], who quantified the effects of the concentration and temperature polarization in OD using glucose solutions and PVDF hollow fiber membranes, found that the polarization phenomena contributed up to 18% of the permeate flux reduction. In OD, provided that both sides of the membranes are brought in contact with the feed aqueous solution to be treated and the osmotic solution in the permeate side, polarization effects are more significant than in DCMD [87]. In a similar study, Bui and Nguyen [84] used PP membranes to concentrate an apple juice solution and observed a permeate flux decline from 2.25 to 0.9 kg/m2h. This was explained by the grip of some substances (e.g., fat and wax) to the membrane surface. Cleaning using filtered water and NaOH (0.1–1%) aqueous solution in the feed side of the OD system was carried out to recover the initial permeate flux.
Durham and Nguyen [82] used Gore-tex PTFE membrane and Gelman 11104/2TPR (a cross linked acrylic fluorourethane copolymer) to concentrate tomato puree by OD and to study membrane fouling due to the adhesion of fatty components, tomato pigments, lycopene and beta carotene to the membrane surface. Tomatoes are composed of 95% water, 3–4% carbohydrate, 0.51% protein and 0.1–0.3% fat [88,89]. It was found that the permeate flux decreased from 1.25 kg/m2h when the feed solution contained 6% of Tomato to 0.7 kg/m2h when the feed contained 21.5% of tomato. The repetitive fouling and cleaning of the membrane with either water, P3 Ultrasil 56 or 1% NaOH resulted in membrane pore wetting allowing salt leakage into the feed after only 2 to 3 cleaning runs [82]. The authors claimed that Gelman 11104/2TPR membrane was more suitable than Gore-tex PTFE membrane for the concentration of tomato puree by OD [82].
El-Abbassi, et al. [81] evaluated PTFE membranes fouling in OD by comparing the measured water permeate flux before and after crude olive mill waste water (OMW) treatment. This was expressed by means of the permeate flux reduction rate (FR) defined as [81]:
F R ( % ) = ( 1 D W F a D W F b ) × 100
where DWFa and DWFb are respectively the water permeate flux after and before OD of OMW treatment under the same operating conditions.
It was found that FR depended on the membrane pore size (i.e., 2.94, 4.02 and 4.14% for the membranes TF200 (0.2 μm pore size), TF450 (0.45 μm pore size) and TF1000 (1 μm pore size), respectively). However, in all cases all the used PTFE membranes showed a high fouling resistance and FR did not exceed 5%. The decrease of the permeate flux with time was more obvious for the membrane TF1000 that exhibited the highest permeate flux (i.e., the permeate flux decreased by 15%, 13% and 26% for the membranes TF200, TF450 and TF1000, respectively; after 280 min of OMW treatment by OD) [81].
Kujawski, et al. [83] applied OD for the dehydration of red grape juice of different concentrations (5–20 °Brix) at 35 °C using three PTFE membranes with different pore sizes (0.2, 0.45 and 1.2 µm) and calcium chloride CaCl2 solution (50 wt %) as stripping solutions. The permeate fluxes of 5 °Brix red grape juice decreased from ≈8 to ≈4 kg/m2h during 550 min of operating time and the permeate fluxes of the membranes having smaller pore size (0.2 µm) were slightly higher due to less surface fouling and pore blockage. The suspended particles with a size bigger than 0.2 µm can adhere easily and block the membrane pores with 0.45 and 1.2 µm size.

3.3. Fouling in OMD

Fouling in OMD may occur following the same mechanisms mentioned previously in DCMD and OD fouling, provided that OMD is a non-isothermal process using an osmotic solution in the permeate side of a porous and hydrophobic membrane. Similar to any other membrane process, the presence of fouling in OMD may vary according to the nature of the feed solution to be treated and the characteristics of the used membrane. It is worth noting that fouling investigation in OMD has received little attention as can be concluded from the number of published papers summarized in Table 3. It was reported that fouling in OMD comprises a major obstacle for its industrial implementation and the determination of the OMD performance during long-term run is required [7].
El-Abbassi, et al. [81] used the OMD process to treat OMW with PTFE membranes of different pore sizes (TF200, TF450 and TF1000) at 40 °C feed temperature and 20 °C of 5 M CaCl2 osmotic permeate solution. To study membrane fouling, OMD experiments were carried out using distilled water as feed before and after each OMW treatment [81]. Long-term experiments of 30 h OMW processing were performed. The permeate flux showed a decrease from 3.9 to 1.3 L/m2h (i.e., a decline of 67%). However, after rinsing the fouled membrane with distilled water, a reduction of only 5.7% of the permeate flux of water was detected indicating that membrane fouling is of less importance when using OMD for the treatment of OMW by PTFE membranes [81].
In a recent study, Ruiz Salmón, et al. [86] conducted OMD-crystallization to obtain Na2CO3·10H2O as a solid product using NaCl as an osmotic solution and a feed solution containing Na2CO3. A hollow fiber PP membrane with an effective pore size of 0.04 µm and a porosity of 40% was employed. The feed temperature ranged between 20 and 40 °C while that of permeate was kept at room temperature. Different experiments were carried out varying the concentration of Na2CO3 and NaCl in the feed and permeate, respectively. A decrease of the permeate flux was detected during the first minute of each experiment, and scaling was observed in some experiments due to the accumulation of crystals on the membrane surface, coming from the feed reservoir because of the recirculation of the feed stream [86].

4. Characterization Techniques for Fouling Analysis

Fouling affects directly both the hydrophobic membrane surface and its pores reducing the MD, OD and OMD separation performances. In order to understand fouling mechanisms in these processes and mitigate therefore their effects chemical and structural characterization must be performed using different techniques. Some of them are currently used in MD, but to a lesser extent than in OD and OMD. Other techniques are not used yet in any of these processes, but are cited for the sake of recommendation provided that they have been considered in other membrane separation processes such as RO, NF and UF. The following characterization techniques include those that permit us to figure out the presence or absence of fouling, thickness of fouling layer and its effect on membrane morphological characteristics; and those that allow us to quantify different fouling components.

4.1. Visual Analysis

The fouled membrane can be initially inspected using a light microscope equipped with a digital camera focused on the feed side of the fouled membrane. This visual analysis was successfully used for flat sheet membranes in order to observe in situ particles deposition with time. With this technique it is impossible to visualize neither the thickness of the fouling layer nor the fouling composition, and only particles whose size is greater than 1 µm can be detected [15].

4.2. Microscopy Techniques

Several electronic microscopy techniques can be used to characterize the morphological structure of porous membranes (top and bottom surfaces for flat sheet membranes, internal and external surfaces of capillaries and hollow fiber membranes as well as their cross-sections). These techniques include scanning electron microscopy (SEM), transmission electron microscopy (TEM), field emission scanning electron microscopy (FESEM), atomic force microscopy (AFM), etc. By means of these techniques, various membrane parameters can be determined such as the membrane mean pore size, pore density, pore size distribution, surface porosity, roughness, fouling particles size and thickness of the fouling layer. These characteristics permit us to detect the presence or absence of foulants on the membrane surface.

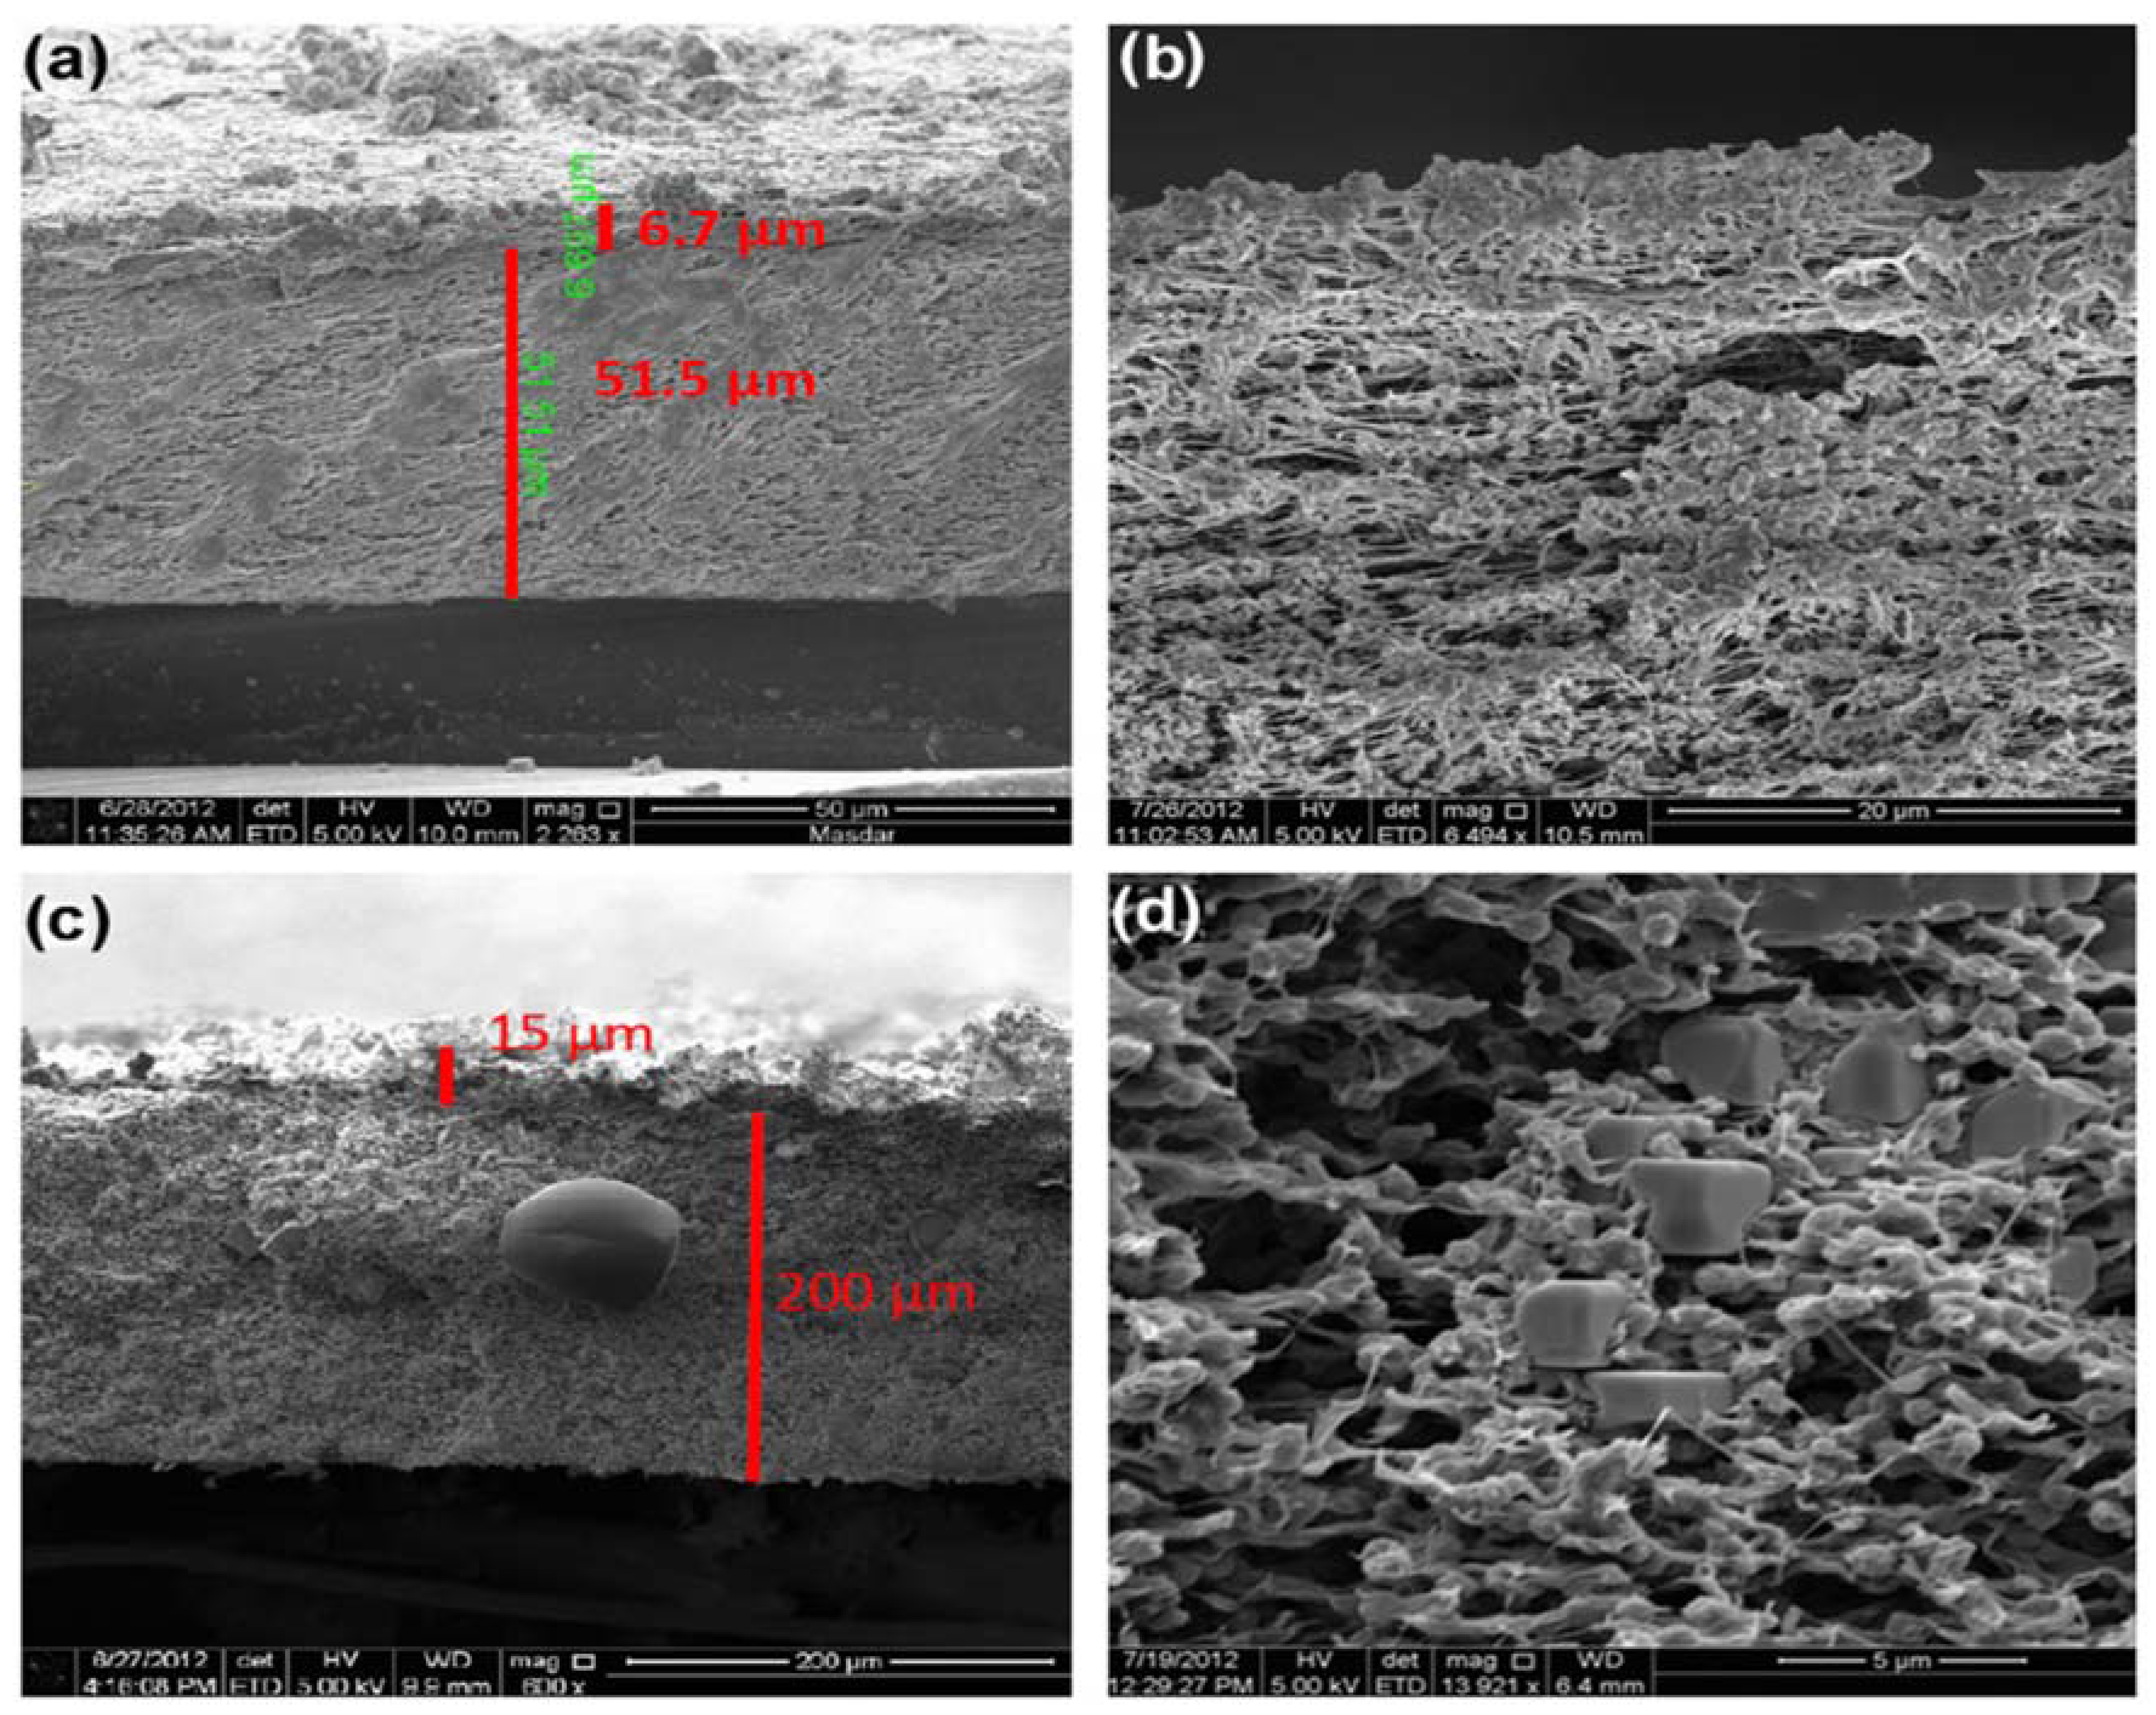
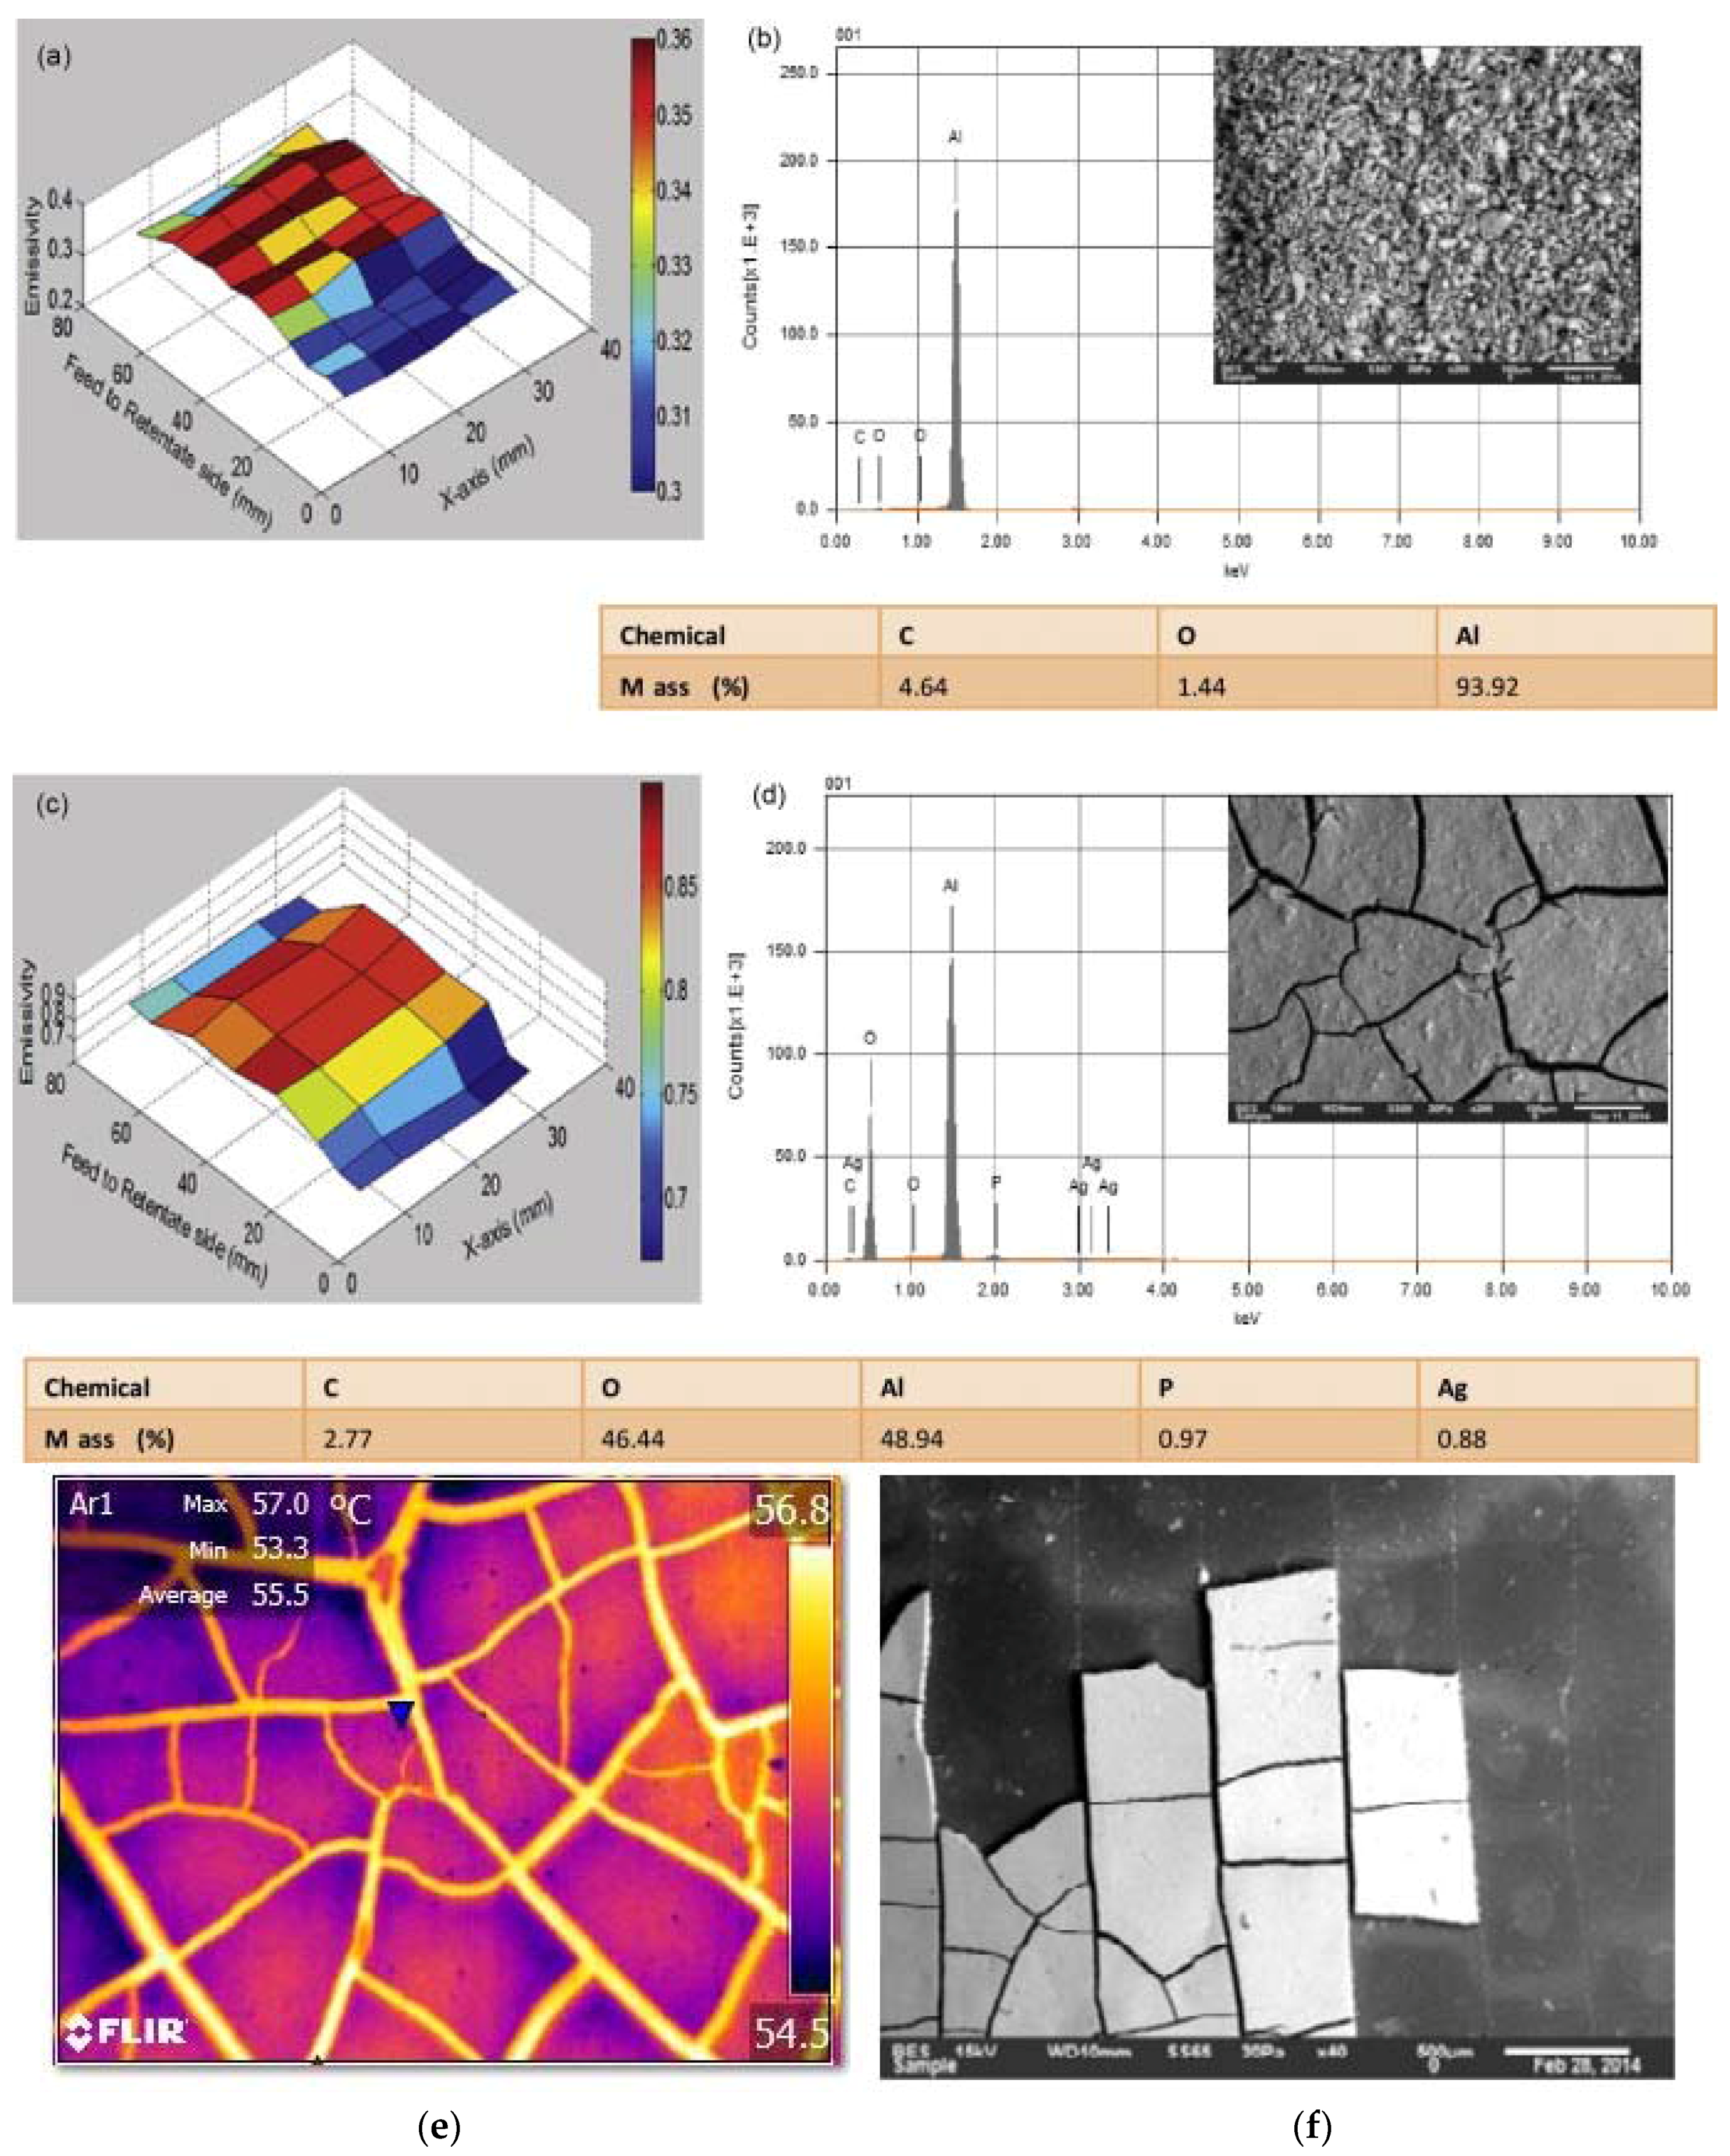
4.2.1. Scanning Electron Microscopy (SEM) and Energy Dispersive X-ray Spectroscopy (EDX)

SEM is one of the most used techniques to study both membrane surface and its cross-section [90,91,92,93]. In this technique, with the electron/sample interactions and the reflected electrons high resolution topographical images of fouled membranes are provided [94]. First, liquid nitrogen is used to freeze the membrane sample that is subsequently broken in small pieces [2,15]. Then the sample is coated with a layer of gold, carbon or platinum by sputtering to render it electrically conductive [15,95]. It must be pointed out that due to both immersion in liquid nitrogen and coating, the fouled membrane sample limits the use of this technique for fouling characterization because it gives the sample some artifacts and damages changing the fouling layer characteristics [2,15,96]. More details on this technique can be found in [2,15].
In addition, energy dispersive X-ray (EDX) spectroscopy can be applied together with SEM to analyze the composition and crystallographic nature of the membrane sample [94]. The principle of this technique relies on the interaction of a source of X-ray excitation and the metal coated sample. In this case, when an incident electron bombards an atom of the sample and knocks out an electron from the outer layer of the metal coated sample, a vacancy or hole is left in this layer. If an electron from another layer fills this vacancy (electron transitions), then X-rays are emitted. These transitions are characteristic of each chemical element [94].

4.2.2. Transmission Electron Microscopy (TEM)

This microscopy technique may be considered complementary to SEM mainly when the fouling structures are too small to be detected by SEM [97,98]. It is also adequate to study the presence of fouling particles inside the membrane pores. In this technique, a sufficiently accelerated electron beam collides with a thin sample (i.e., about ten nanometers). Depending on the sample thickness and the type of atoms forming it, some electrons cross the sample directly and others pass through it but are diverted. After passing the sample the electrons are collected and focused by a lens to form a final image on a CCD camera with a high definition. If the image is formed from the transmitted beam, which has not undergone scattering, then the image of the object is dark on a bright background. On the other hand, if the scattered electrons are used in this case, the image appears bright on a dark background. Therefore, these two techniques are called image formation in a clear field and in a dark field, respectively; the first one is the most used. More details on this technique can be found in [99].
Among the followed procedures to prepare transparent specimens to electrons, the most important and most used one is based on a mechanical thinning of the material in a very controlled way. This produces a flat specimen of a few microns thick with a flawless surface, which is then subjected to ionic surface polishing at low angle and low energy to achieve extremely thin areas ready for TEM observation. Ultramicrotomy is another technique used to produce TEM specimens, usually reserved for soft materials. The procedure consists of cutting sample slices using diamond blade. Polymeric samples of about 50 nm thickness can be prepared. Samples can be cut in a temperature range between −180 °C and ambient temperature depending on the characteristics of the material.
It is worth noting that TEM is not applied yet in MD, OD and OMD fouling analysis due to the necessity to prepare extremely thin samples to be transparent to electrons affecting considerably the fouling layer.

4.2.3. Atomic Force Microscopy (AFM)

AFM is one of the advanced techniques used for characterization of the membrane surface without requiring any previous sample preparation. Unlike conventional optical or electron microscopy, AFM requires physical interaction between a probe with a sharp tip and the sample surface. It is possible to work in contact, non-contact or intermittent contact mode to get the three-dimensional topographical images of the membrane surface. The measurements can be made in different media: air, liquid, vacuum, controlled atmosphere, etc. The AFM probe scans the sample onto which a laser beam is directed and reflected onto a four-quadrant photodiode. The feedback controller evaluates the signal coming out of the photodiode. Moreover, piezoelectric elements are included in the scan head to ensure precise nanoscale motion [100]. Comprehensive information on this technique can be found in [101,102].
In general, AFM technique is used to determine surface roughness parameters, mean pore size, pore size distribution, surface porosity and pore density of both new and fouled membranes [101]. This technique is commonly used for characterization of MD membranes. As an example, Zarebska, et al. [103] used AFM morphological analysis to understand the observed decrease in contact angle and surface charge of PTFE and PP membranes used in MD. The three-dimensional AFM pictures of virgin and fouled PTFE and PP membranes with model manure solution and pig manure after sieving with MF and UF showed that the foulants accumulate in the “valleys” leading to a drop of surface roughness [103].

4.2.4. Confocal Laser Scanning Microscopy (CLSM)
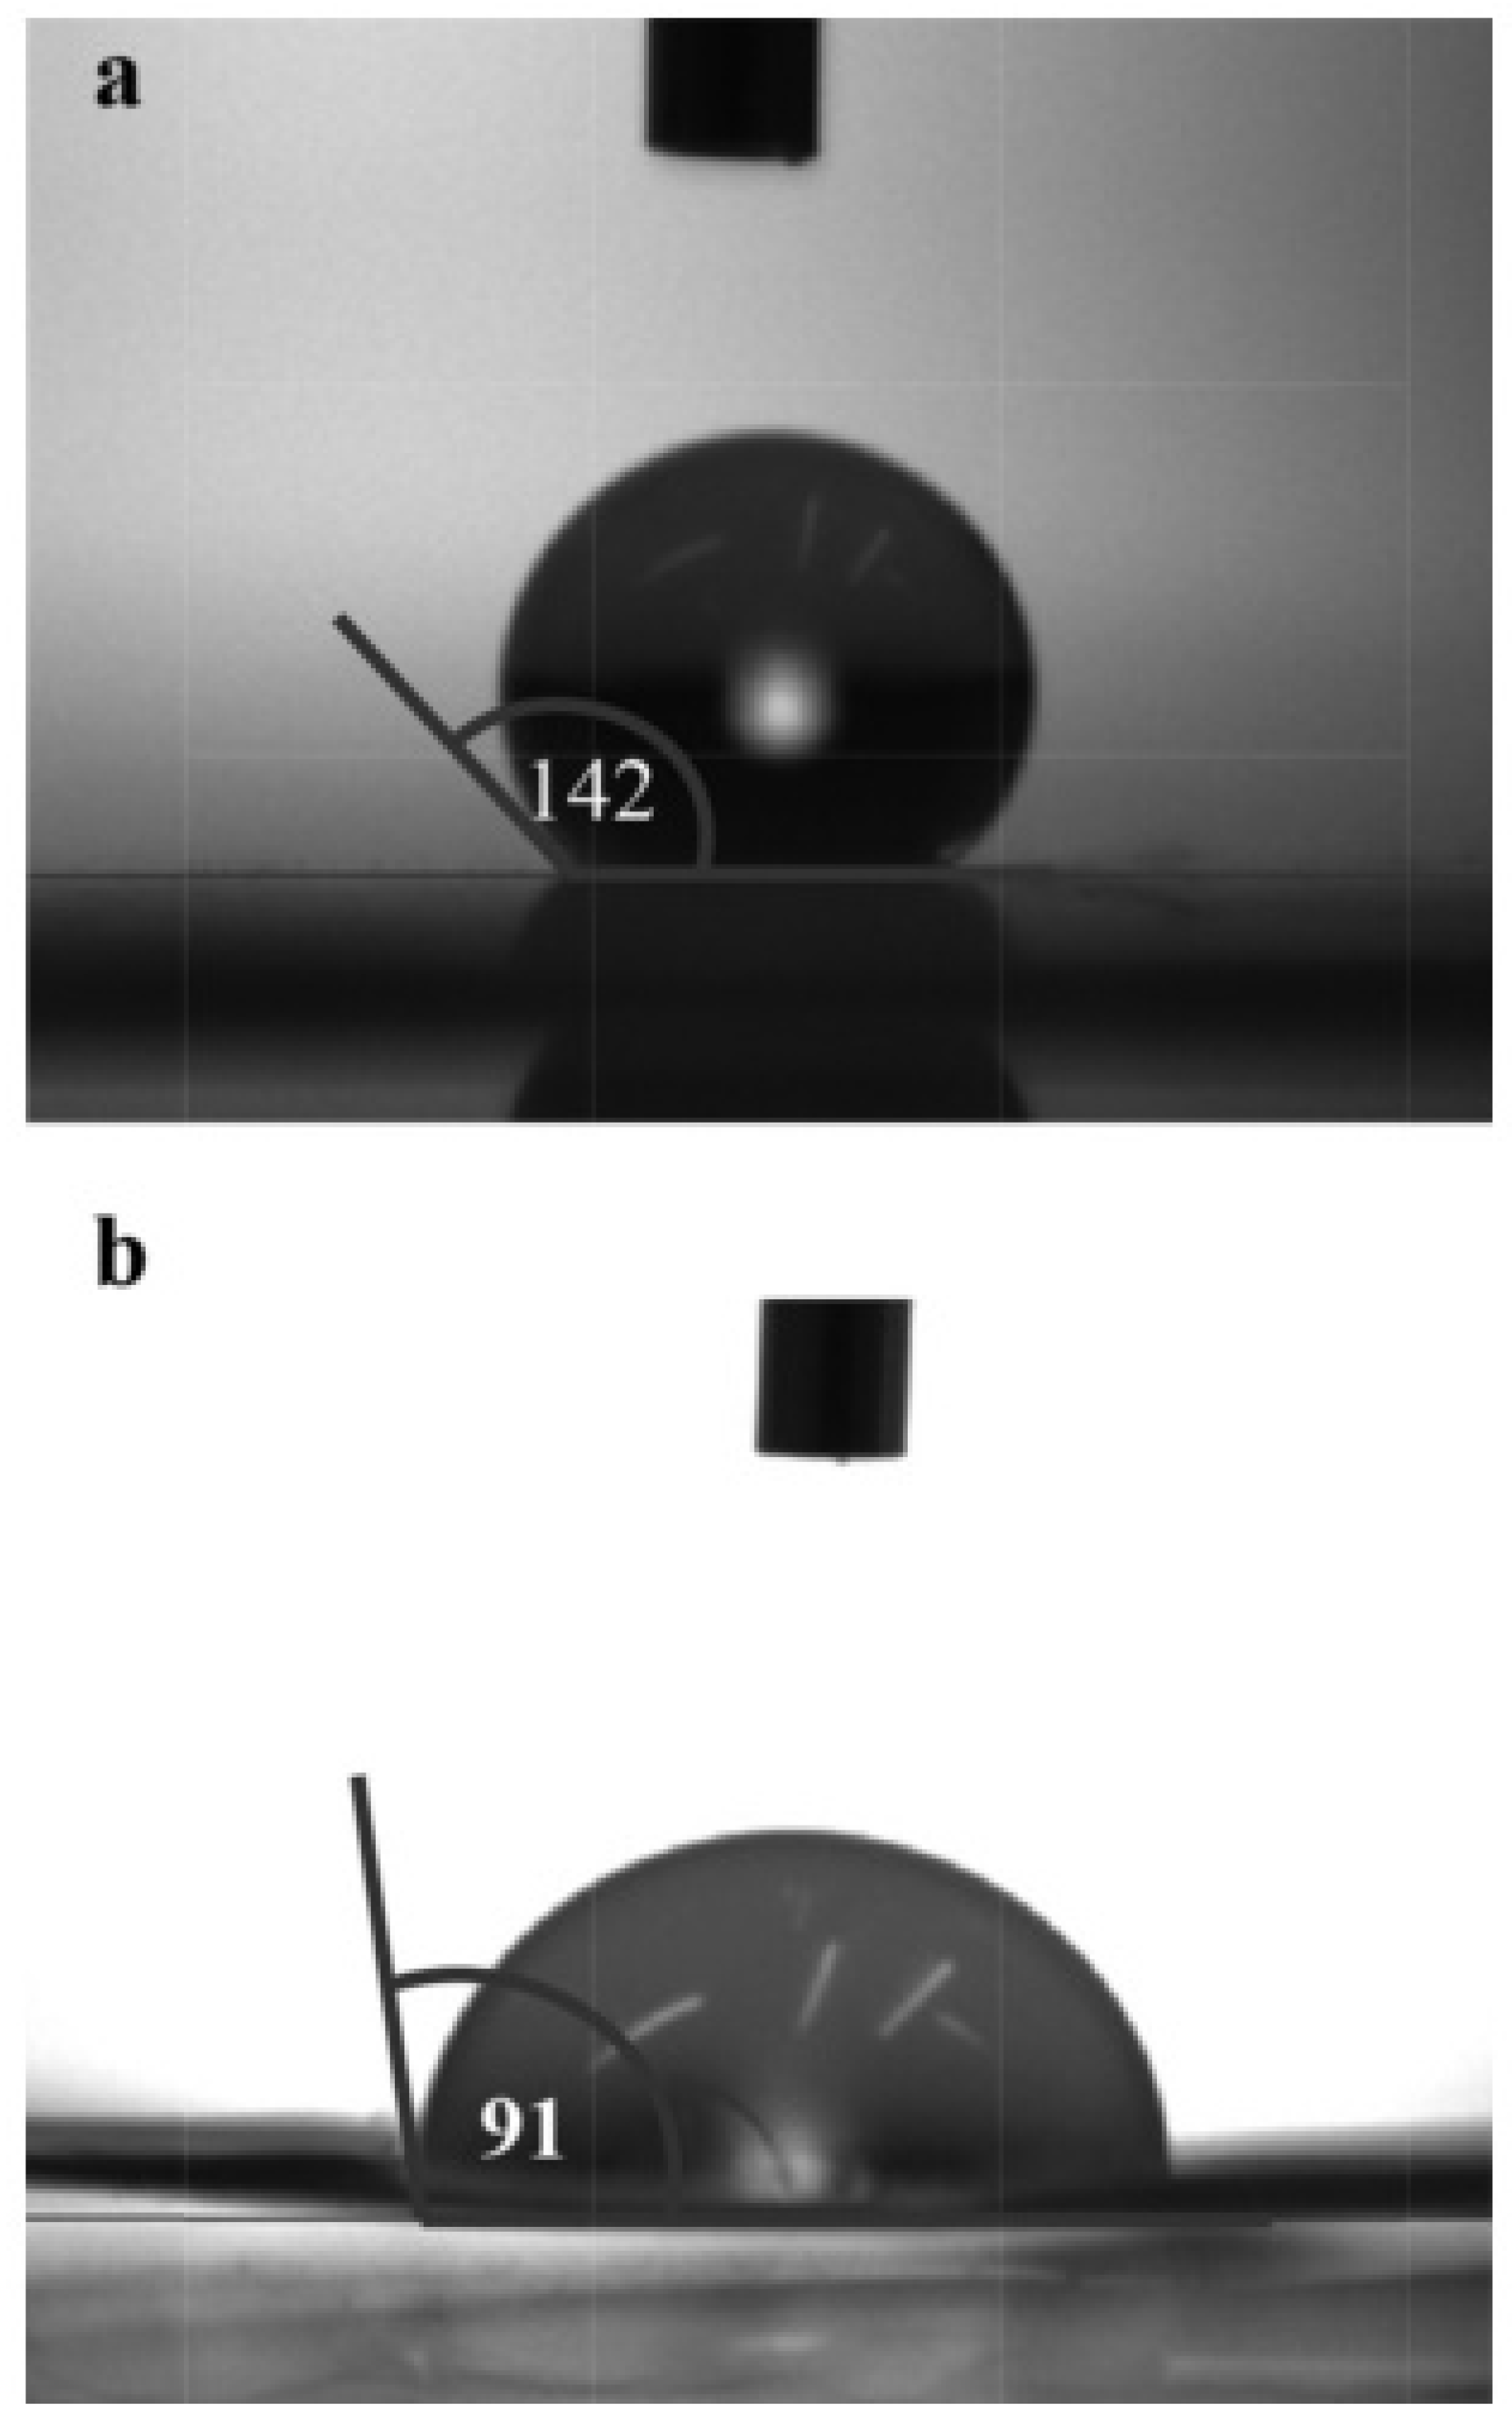
CLSM technique is used to analyze both the surface and internal structure of the membrane based on the fluorescence emitted by a sample after its irradiation by a laser beam, obtaining three dimensional images of the samples. It permits us to increase the optical resolution and contrast by means of eliminating the out-of-focus light, achieving a controlled and highly limited depth of focus. CLSM is a non-destructive technique allowing in situ visualization of membranes and one of the most important techniques in the field of fluorescence imaging and scanning to obtain high-resolution optical images [15,104].
CLSM is basically used to take images of membrane biofouling, combining the laser scanning method with the 3D detection of biological objects labeled with fluorescent markers. It runs by focusing a laser beam onto a small sample of the fouled membrane and then the reflected light is detected by a photodetection device. The images are then acquired point-by-point and reconstructed with a computer, allowing three-dimensional reconstructions of topologically complex objects [15,104]. More details on this technique can be found in [105,106].
It is worth noting that few authors used this technique to characterize the membrane biofouling. Yuan, et al. [106] used CLSM to observe the growth of biofouling layer in osmotic membrane bioreactors (OMBRs). The CLSM images showed that during OMBRs operation the variation of the quantity and distribution of polysaccharides, proteins and microorganisms in the biofouling layer were significantly different. Ferrando, et al. [107] used CLSM to determine the fouling produced during the filtration of protein solutions. Other authors considered this technique to validate the efficiency of membrane cleaning [108,109]. However, this technique is not applied yet in MD, OD and OMD fouling analysis.

4.3. Contact Angle

In general, contact angle measurement is considered to quantify the hydrophobic character of the membranes used in MD, OD and OMD. It can be used to determine the hydrophobicity reduction of the membrane caused by fouling. To carry out this measurement, the sample does not require any previous preparation. The tip of a syringe is placed near the sample surface and then depressed so that a constant liquid drop volume (i.e., distilled water) of about 2 µL is deposited on it. Images of the drop are taken by a camera and a specific software permits to determine the liquid contact angles. A mean value together with its standard deviation are finally calculated from more than ten to fifteen readings [2]. In addition to the water contact angle, the same system can be used to measure the surface tension of the membrane and then figure out its change depending on the adsorbed foulants compared to new membrane. More details on this technique can be found in [2,110].
Various authors have used this membrane surface characterization technique before and after carrying out the separation process. According to Guillen-Burrieza, et al. [111] a clear decrease of the water contact angle value from an average of 129° for the virgin PTFE membrane to 108° for the fouled one (i.e., scaling) was observed. Sanmartino, et al. [112] also detected smaller water contact angles of fouled PTFE membranes (TF200 and TF450) than those of new ones. The membrane having higher values of crystallization fouling factor exhibited the lower value of the water contact angle. Zarebska, et al. [58] measured the water contact angles of new and fouled PP membranes used in MD. Figure 4 shows the water drops on the surface of these membranes. A clear water contact angle reduction from 142° for the clean PP membrane to 91° for the fouled membrane. It was claimed that the loss of the membrane hydrophobicity was attributed to partial wetting of the membrane due to fouling deposit (i.e., inorganic ions, proteins and/or peptides and microorganisms present in pig manure).

4.4. Infrared Thermography Technique (IRT)

IRT is a non-contact method that permits, through the infrared radiation emitted by objects, the measurement of the surface temperature and its distribution [113]. Before using this technique, the membrane sample must be dried, assuming that the temperature is affected by the humidity, and the temperature on the membrane surface must be determined correctly. In this method, an IR camera obtains infrared images due to IR radiation coming from the fouled membrane [114]. It permits the measurements of the emissivity of foulant(s) and membrane surface temperature. More details on this technique can be found in [113,115].
The aim of using this technique is to distinguish between foulants having metallic properties from those that are non-metallic, as can be seen in Figure 5 [115]. The results obtained with this technique were compared to those obtained with SEM-EDX analysis to corroborate the ability of the IRT technique to figure out whether a foulant was metallic or non-metallic in nature. Ndukaife, et al. [115] used IRT technique to study fouling of an UF flat sheet membrane. Different fouling experiments were realized using an aqueous feed solution containing an aluminum oxide nanoparticle. The results showed that the technique could detect the modifications that occur on the membrane surface after desalination process due to foulants deposition. The emissivity of the membrane surface depended on the fouled surface roughness and the composition of the foulant(s) [115]. It is to be noted that no fouling analysis was carried out yet with IRT in MD, OD and OMD processes.

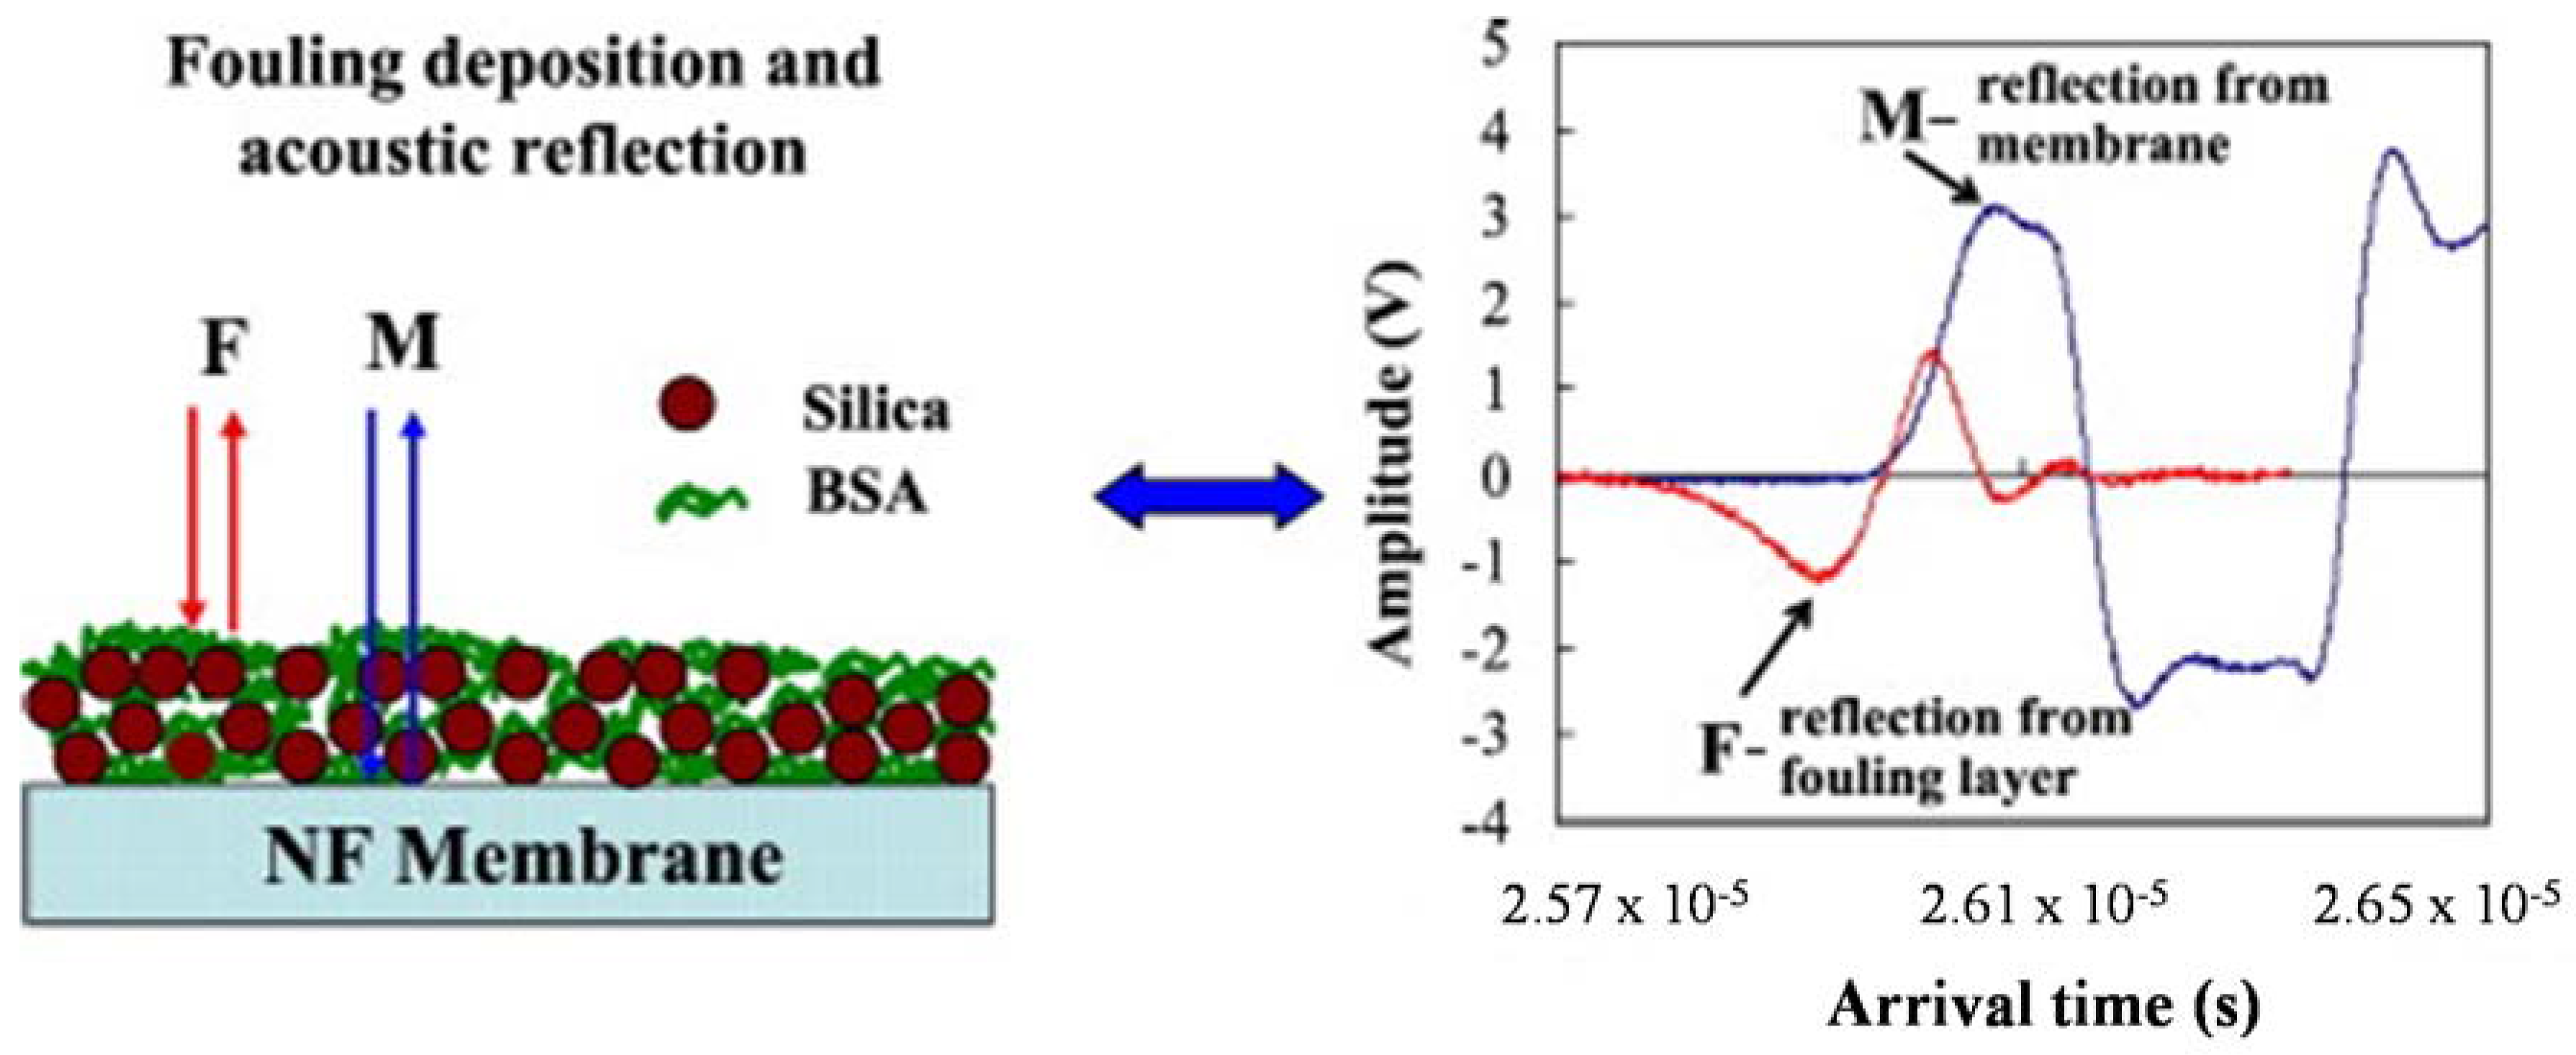
4.5. Ultrasonic Time Domain Reflectometry (UTDR)
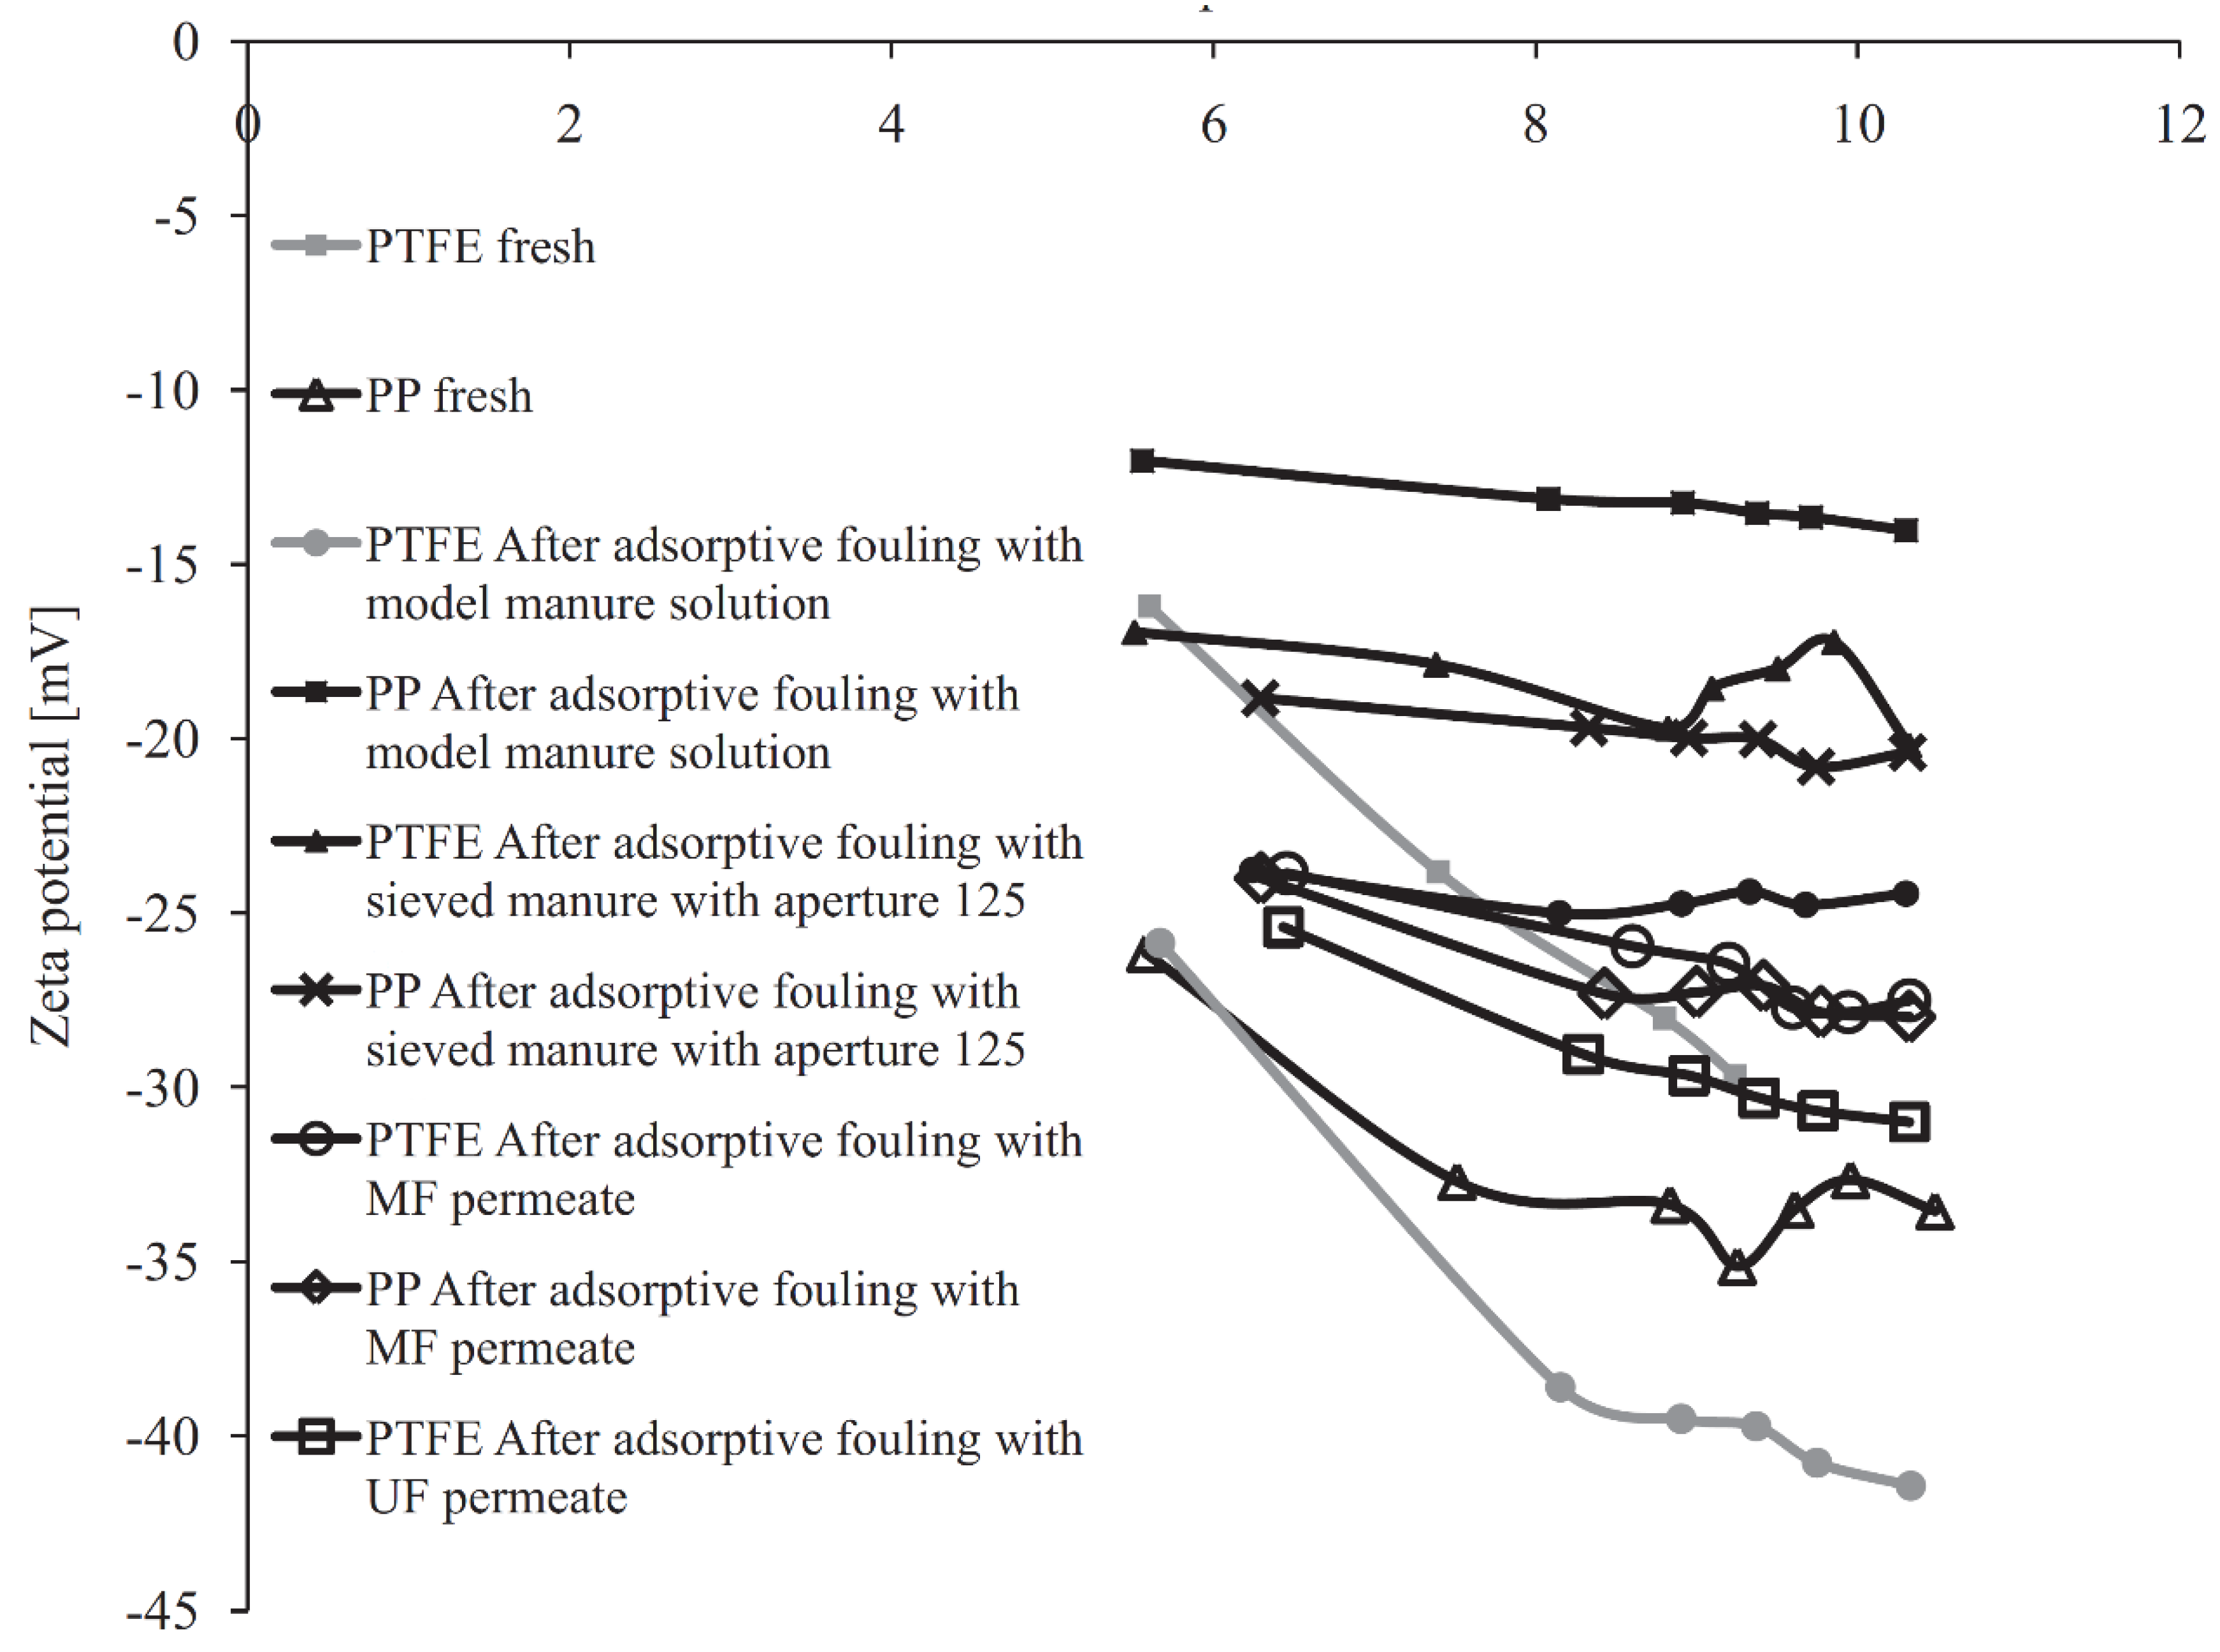
UTDR is a non-invasive technique used to monitor the deposition of combined organic and colloidal fouling on membrane surface [116]. This does not require any sample preparation and is based on the propagation of mechanical waves. The reflection and transmission can occur when an ultrasonic wave encounters an interface between two media. More details can be found in [116,117,118]. UTDR technique coupled with differential signal analysis was used to investigate the combined fouling deposition processes on membrane surface [118]. The steady-state waveform of distilled water was considered as the reference and the waveform of fouled membrane was considered as the test waveform. The difference between the two signals represented the signal of the fouling layer. UTDR was used for fouling detection by different authors in filtration processes. As an example, Li, et al. [116] investigated the fouling behavior of mixed silica–BSA solution and silica–NaCl solution using UTDR technique in NF membranes (see Figure 6). The UTDR results of NF experiments showed that the fouling layer obtained from the combined organic–colloidal fouling (mixed silica and bovine serum albumin (BSA) and silica and NaCl solution) was denser than that obtained from the colloidal fouling layer in the presence of NaCl. The formation of the denser fouling layer was due to the electrostatic interactions between foulants and membrane surface as well as the electrostatic interactions among the foulants due to absorption of BSA onto silica [116]. Taheri, et al. [119] used UTDR technique to provide a good estimation of the fouling layer thickness formed during RO tests. Xu, et al. [120] described the extension of UTDR as a non-invasive fouling monitoring technique used for the real-time measurement of particle deposition in a single hollow fiber membrane during MF. Tung, et al. [121] used a high-frequency 50-MHz ultrasound system to measure the fouling distribution in spiral wound UF and RO membrane modules. It is necessary to point out that this technique has not been applied yet in MD, OD and OMD fouling.

4.6. Zeta Potential

Fouling can change the membrane surface charge and by measuring the zeta potential of new and fouled membranes one can evaluate the possibility of foulant(s) to adhere or not to the membrane surface. It is a measure of the magnitude of electrostatic repulsion or attraction between particles. In general, zeta potential is a key indicator of the stability of colloidal particles and it is a good method to describe double-layer properties of colloidal dispersions [15,103]. Various factors affect the zeta potential such as the concentration, composition, temperature and pH of the solution as well as the membrane surface properties (i.e., charge, roughness, chemical heterogeneity, etc.) [122]. Therefore, it is a useful technique to determine whether a membrane is modified in order to improve the considered process performance. The determination of the zeta potential can be carried out using several methods such as the streaming potential, vibrational potential, electrophoresis, electro-osmosis, etc. For fouling characterizations streaming potential and electrophoresis are the most considered methods [123].
Electrophoresis is the movement of charged particles or polyelectrolytes in a liquid under the influence of an external electric field. The electrophoretic mobility of a charged particle is determined by the balance of electrical and viscous forces that could be used to determine the zeta potential. The streaming potential is measured when the electrolyte solution is forced with a known pressure through a channel [124]. A resulting voltage is measured between electrode probes on either side of the channel and compared with the voltage at zero applied pressure. The streaming potential can be related to the zeta potential by factors that include the electrical conductivity, fluid viscosity and the structure of the channel [123]. More experimental details of zeta potential can be found in [122].
Zarebska, et al. [103] measured the streaming zeta potential of PP and PTFE membranes after their use in MD for the treatment of different pretreated model manure feed solutions. It was stated that new PP and PTFE exhibited a small negative zeta potential (above −30 mV, at pH ≈ 9). The fouled PTFE membrane exhibited the more negative zeta potential (above −40 mV, at pH ≈ 9) indicating the higher electrostatic repulsion between model manure solution and the membrane surface. However, for the PP after adsorptive fouling with model manure solution the zeta potential was above −15 mV (at pH ≈ 9) (see Figure 7) suggesting an increased fouling potential due to decreased electrostatic repulsion between the membrane surface and the model manure solution.
An et al. [29,30] characterized both commercial and prepared MD membranes by means of zeta potential at different pH values and claimed that the negatively charged MD membranes were resistant to dye adsorption and subsequent fouling.

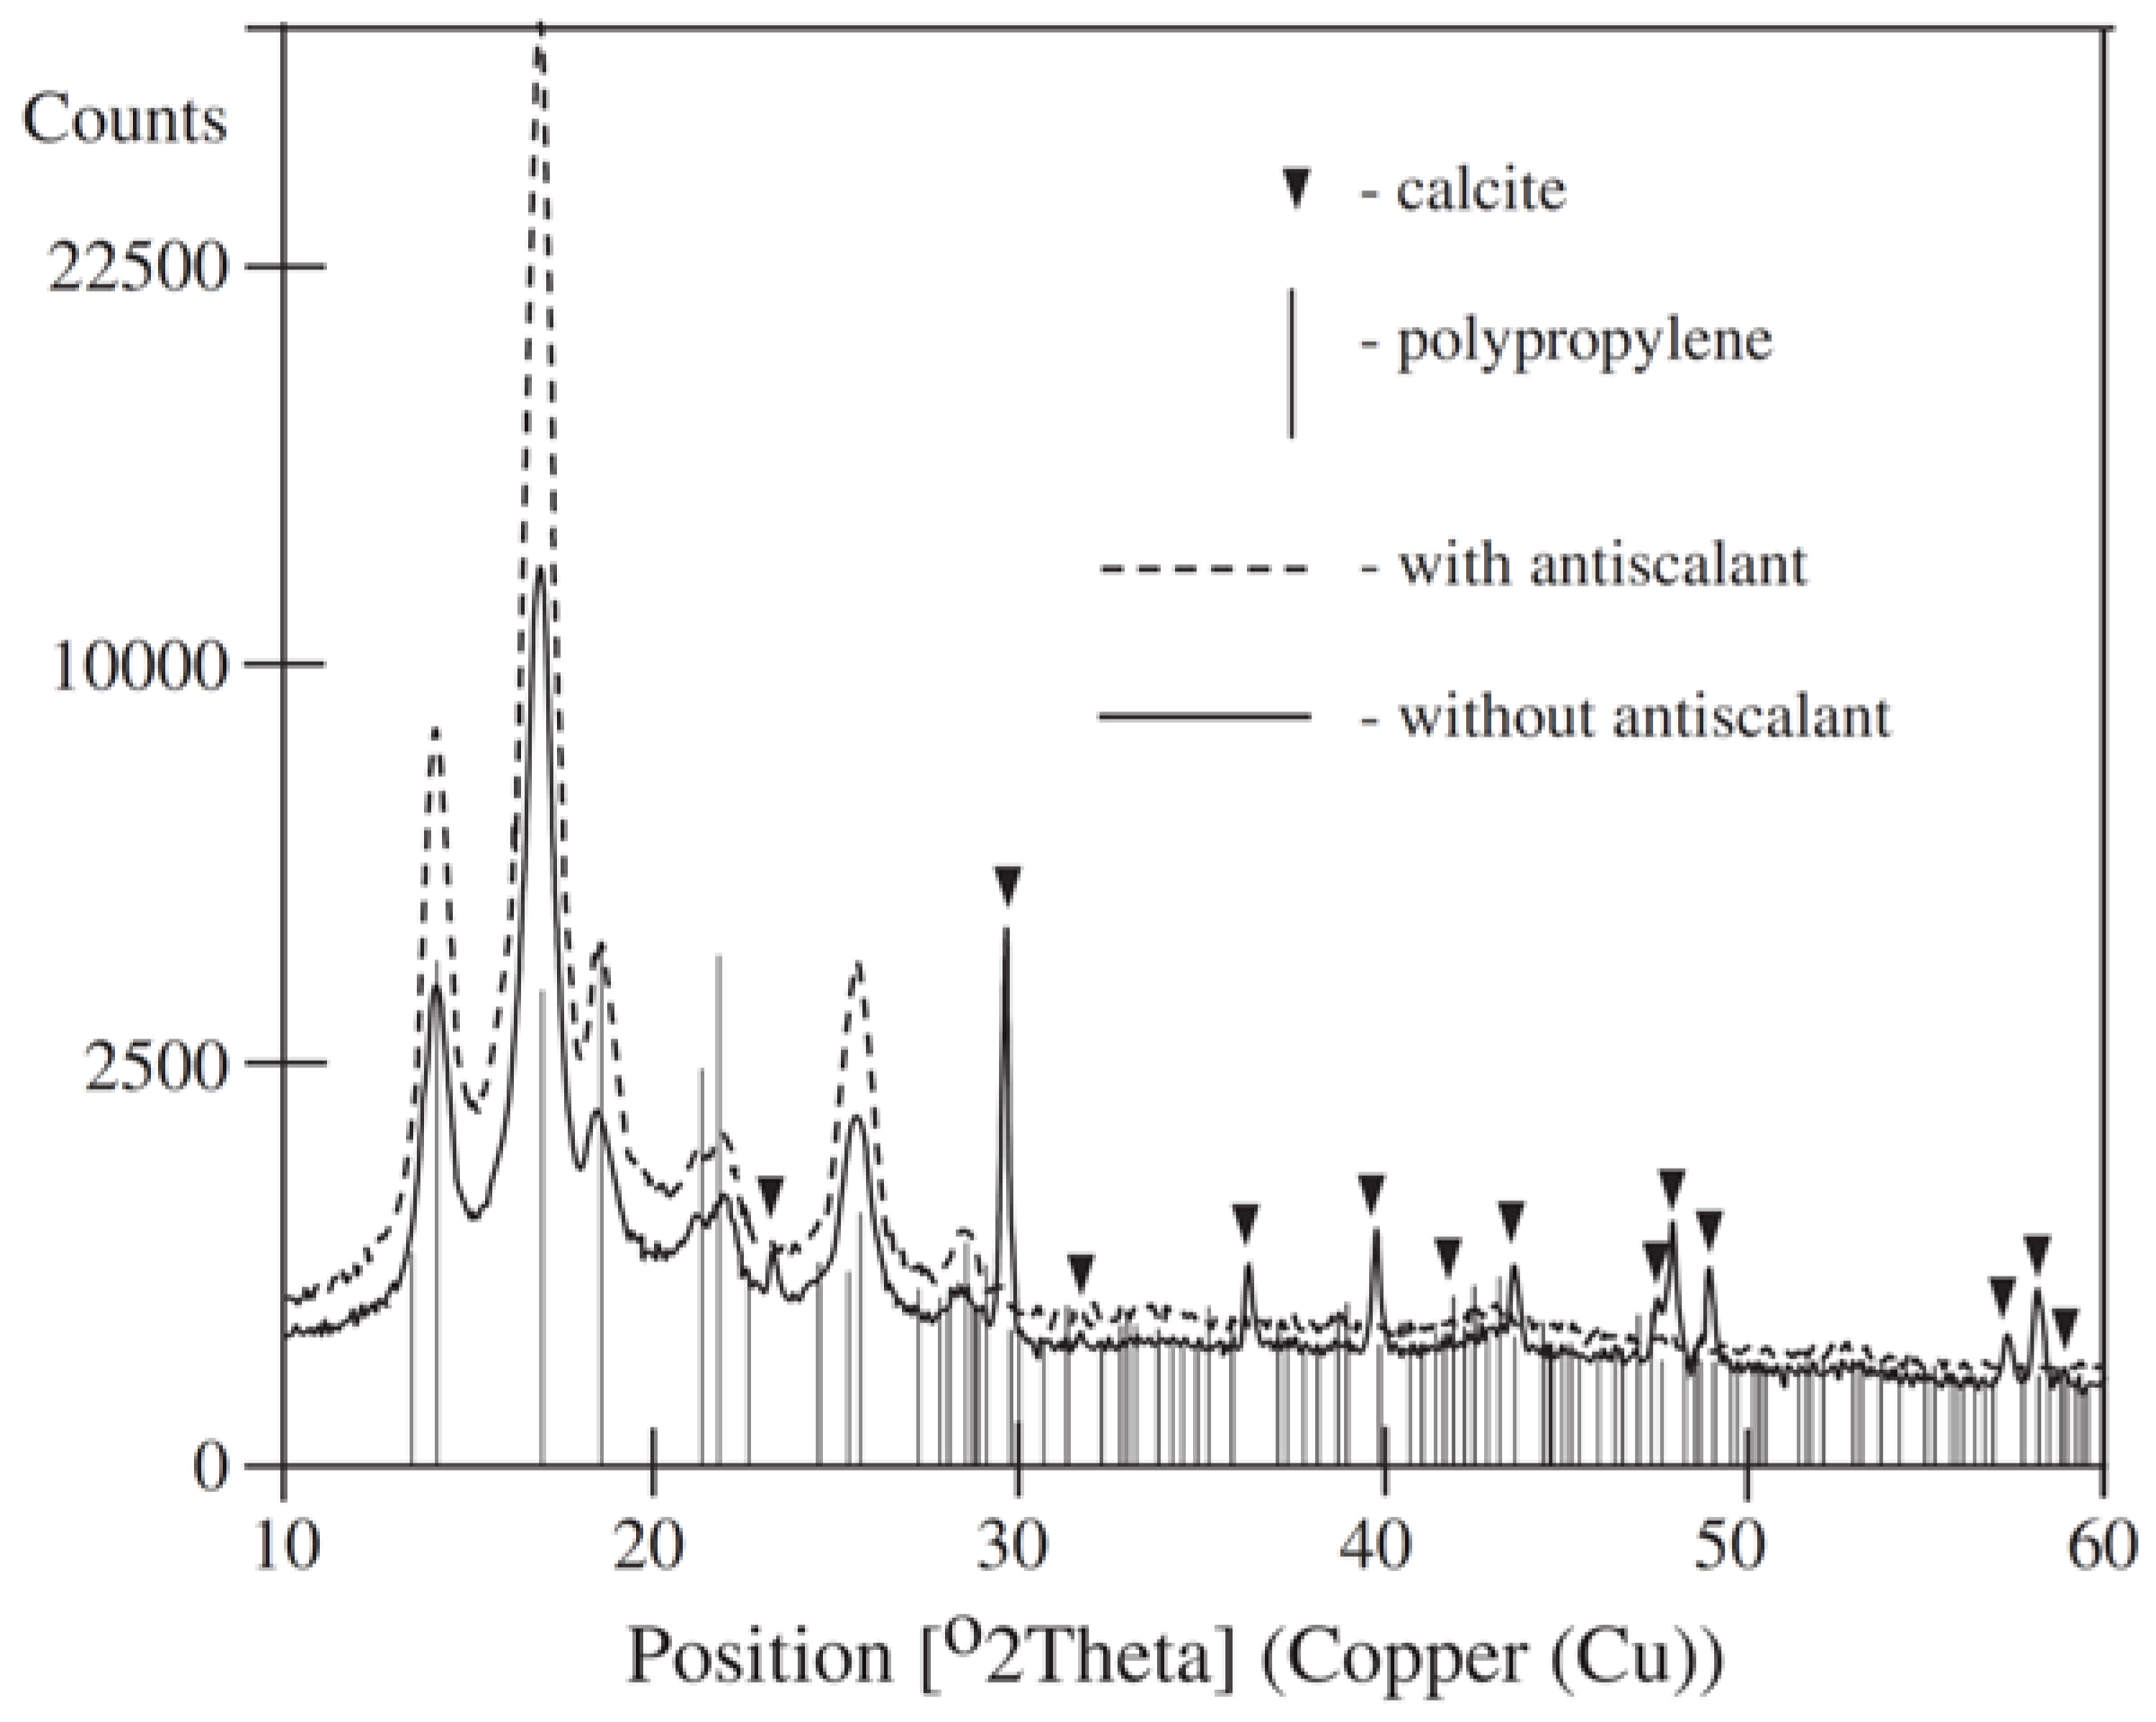
4.7. X-ray Diffraction (XRD)

XRD is an analytical measurement technique that identifies the crystalline nature of the foulant(s) either organic or inorganic, polymeric or metallic deposited on the membrane surface. It reveals important information about the crystal structure, size, shape, etc. Different type of polycrystalline samples can be measured. The foulants deposited on the membrane surface can be extracted and ground to a powder form, and then arranged in a very thin layer on a sample holder. On the other hand, membrane samples can also be measured directly. Both types of samples are usually analyzed with a diffractometer equipped with monochromatic Cu-Kα radiation [95]. The irradiated crystals disperse the X-rays only in some determined directions with intensities that depend on how the atoms are ordered at the microscopic level. With this information, direction and intensity of each ray, it is able to obtain the molecular structure of crystals. More details on XRD technique and analysis can be found in [125].
It is necessary to point out that XRD has widely been applied to study membrane fouling [15], even in MD. As example, Gryta [46] used XRD to analyze the components of scaling on PP membrane. As can be seen in Figure 8, the spectra showed the presence of calcite crystals when the antiscalant was not used, and the calcite peak disappeared after using the antiscalant. Kim, et al. [126] characterized the components making up the crystals formed in the crystallizer of an integrated MD and membrane crystallization (MDC) system for shale gas produced water (SGPW) treatment.

4.8. X-ray Fluorescence (XRF)

XRF is a semi-quantitative analytical technique based on wavelength-dispersive spectroscopic principle similar to an electron microprobe [127,128]. The sample material emits secondary or fluorescent X-rays after being excited by a primary X-ray source. Each of the elements present in the sample produces a set of characteristic fluorescent X-rays (i.e., a fingerprint) that is unique for that specific element, which is why XRF spectroscopy is an excellent technology for elemental and chemical analysis. This technique requires a previous sample preparation like XRD.
The utility of this technique in membrane fouling characterization is to determine the elemental composition of both new and fouled membranes and subsequently figure out the chemical nature of the deposit(s). This technique is distinguished by its highest accuracy and precision as well as by its simple and fast sample preparation for the elemental analysis. More details of sample preparation and procedure concerning this characterization technique can be found in [127,128]. It must be mentioned that this technique is not used yet for fouling analysis in MD, OD and OMD. However, it was used in the assessment of long-term fouling of RO membranes [127].

4.9. Attenuated Total Reflectance-Fourier Transform Infrared Spectroscopy (ATR-FTIR)

ATR-FTIR offers quantitative and qualitative analysis of both organic and inorganic solid and liquid samples and it is a well-known technique for fouling analysis.
It is a label free technique that provides information on the chemical composition of the fouling layer [129]. ATR-FTIR measurements only collect signals from the surface and to a depth of 1.6 mm inside the sample by using a beam splitter KBr and an infrared source employing an attenuated total reflectance. When the infrared radiation reaches the sample, part of the radiation is absorbed by the sample and the rest is transmitted through it. The resulting signal in the detector is a spectrum representing the molecular “fingerprint” of the sample. The utility of infrared spectroscopy is the fact that different chemical structures (molecules) produce different spectral traces. The Fourier transform converts the output of the detector into an interpretable spectrum that provides information about chemical bonds and functional group in a molecule. In this technique the sample does not need any specific type of preparation. Further details about this technique can be found in [103,129].
Thygesen, et al. [129] used ATR-FTIR technique to determine the composition of the fouling layers deposited on PP and PTFE membranes used for ammonia removal from model manure by MD. It was proved that the fouling layer was formed by only organic compounds, whereas no indication of inorganic scaling was detected [129]. Zarebska, et al. [103] used ATR-FTIR to detect functional groups in PP and PTFE membranes used in MD for the treatment of model manure solution. This technique showed that fouling layer composition was not uniform across the entire membrane surface and all the bands found by ATR-FTIR spectroscopy were assigned to organic fouling. Tomaszewska and Białończyk [130] also used ATR-FTIR method to analyze fouling composition during whey concentration process by MD. The ATR-FTIR spectra of both clean and fouled PP membrane confirmed the presence of whey proteins in the fouled membrane structure.

4.10. Inductively Coupled Plasma Atomic Emission Spectrometry (ICP-AES)

ICP-AES is also referred as inductively coupled plasma optical emission spectrometry (ICP-OES). It is a type of emission spectroscopy that uses the inductively coupled plasma to produce excited atoms and ions that emit electromagnetic radiation at wavelengths characteristic of a particular element. It is a flame technique with a flame temperature in the range 6000–10,000 K. The intensity of this emission is indicative of the concentration of the element within the sample. It is used for the detection of trace metals (e.g., Al, Cu, Fe, Cr, Zn, Ni, B, Mn, etc.) [123,127], being very suitable for inorganic fouling but it gives only qualitative information. Consequently, it needs to be coupled with additional analytical methods like atomic absorption spectroscopy (AAS) mentioned below. ICP-OES technique requires an exhaustive preparation of the sample before its analysis. This is one of the reasons why it is not a very used technique in fouling characterization. Very few studies have been conducted using this technique. For example, Nguyen, et al. [131] used ICP-OES to analyze the inorganic elements accumulated in the fouling layer of MD membrane used with SWRO brines. A possible sample preparation is the immersion in an acid solution such as HCl or H2SO4 in order to dissolve the precipitates and transform them into ionic form or heating the sample in furnace at 550 °C for about 16 h followed by a dissolution in an acid solution (HCl or HNO3) and the subsequent analysis of the obtained solution(s) [123]. ICP-OES is very suitable for inorganic fouling. More details can be found in [123,127].

4.11. Atomic Absorption Spectroscopy (AAS) Analysis

AAS is a spectroanalytical procedure employed for the quantitative determination of chemical elements in a sample using the absorption of optical radiation (i.e., light) by free atoms in the gaseous state. It is based on the analyte atomization using different atomizers in a liquid matrix. The electrons of the atoms in the atomizer can be promoted to higher orbitals (excited state) for a short period of time (nano-seconds) by absorbing a defined quantity of energy (radiation of a given wavelength). This amount of energy (i.e., wavelength) is specific to a particular electron transition in a particular element. In general, each wavelength corresponds to only one element, and the width of an absorption line is only of the order of a few pico-meters, which gives the technique its elemental selectivity.
The determination of fouling composition by AAS needs the same sample preparation as that indicated for ICP-OES [123,127]. As it is explained above, for fouling analysis it is usually coupled with ICP-OES. As an example, Melián-Martel, et al. [127] used this method in the determination of the long-term fouling of RO membranes.

4.12. Excitation Emission-Matrix Fluorescence Spectroscopy (EEM)

EEM technique has been widely used to characterize dissolved organic matter in water and soil. It is based on the fluorescence analysis from a sample by using a luminescence spectrometer. A beam of light, usually ultraviolet light, excites the electrons in molecules of certain compounds and causes them to emit light. In the field of membrane science, it is useful for the detection of HA and other organic matter present in fouled membranes. The use of EEM technique demonstrated that changes in a sample, containing HA, proteins, etc., can considerably change the intensity distribution of the fluorescence spectra, particularly if strong adsorbant non-fluorescent species are present [132]. Solid sample slices are directly mounted in the sample compartment of the spectrofluorimeter. More details on sample preparation and method can be found in [132,133]. To date there has been no MD, OD or OMD research study in which this technique has been applied.

4.13. Field Flow Fractionation (FFF)

FFF is a technique applied for the separation and characterization of macromolecules, supramolecular assemblies, colloids and particles. In this separation technique, a field is applied perpendicularly to the laminar flow of a carrier liquid in order to cause the separation of the particles present in this liquid, depending on their different mobilities under the force exerted by the field. The particles change their positions (i.e., levels) and speed depending on their size/mass. Since these components travel at different speeds, their separation occurs. This separation can be carried out with a high resolution over a wide size range from 1 nm to 100 µm [134].
Various fields can be applied in FFF depending on the nature of the material to be analyzed including flow field-flow fractionation (FlF-FF), thermal (ThFFF), electrical (ElFFF), sedimentation (SdFFF), gravitational (GrFFF), dielectrophoretic (DEP-FFF), acoustic (AcFFF) and magnetic (MgFFF) field-flow fractionation [134]. Further details on these techniques can be found elsewhere [134,135].
It must be pointed out that FIF-FF is the most commonly used FFF techniques for surface and polymer analysis. One of the largest areas of active research in FlF-FF is in the area of proteins, bacteria and sub-cellular structures [134]. Therefore, Fl-FFF can be effectively used to predict biofouling [136]. However, this technique is still not considered in MD, OD or OMD fouling analysis.

5. Methodologies for Membrane Fouling Prevention and Reduction

Different strategies have been adopted to improve the performance of MD, OD and OMD processes in terms of fouling prevention and extension of the life-time of membranes. These can be established in two possible ways: (i)—to treat the feed solution by means of pretreatments to diminish the foulants content or by adding antiscalants to inhibit inorganic scaling during the process; (ii)—to design fouling resistant membranes with improved MD, OD or OMD performance considering membrane modification or to establish systematic membrane cleaning steps during MD, OD and OMD processes.

5.1. Pretreatment

Appropriate and effective pretreatment is one of the essential keys to improve MD, OD or OMD processes and minimize their fouling and scaling problems. To date, pretreatment has been claimed to be the effective method to prevent and control fouling in the MD process [15]. The degree of pretreatment depends on the type of membrane material, nature of the feed solution, water recovery level and frequency of membrane cleaning [137,138]. Pretreatment can change the properties (chemical and/or biological) of the feed solution leading to less fouling formation and improving the permeate flux, separation factor and life-time of the membrane. Pretreatment techniques and technologies can be categorized in three types: (i) mechanical; (ii) chemical; (iii) thermal and (iv) combination of mechanical and chemical or mechanical and thermal procedures. Table 4 summarizes some pretreatments considered before carrying out MD and OD processes.
Mechanical pretreatment involves physical techniques such as membrane-based filtration (NF, UF or MF) to reduce suspended solids, colloids, microorganism and organic matter present in feed aqueous solutions subjected to MD, OD or OMD treatment. It is important to reduce or eliminate these species previous MD, OD and OMD process in order to minimize membrane fouling and prevent damage of the membrane. NF and RO permeates after treatment of surface water were used as feed for MD process, the results showed that the fouling problem was reduced in the MD process [139]. In spite of NF permeate, which still contained a significant amount of carbonate that can form a fouling layer on the membrane surface, small amounts of HCI (pH = 5) added to the NF permeate permitted the elimination of this phenomenon in the MD process. When the RO permeate was employed as feed for the MD process, the problem of fouling was not detected.
Bailey, et al. [140] studied the effect of UF as a pretreatment on the subsequent concentration of grape juice by OD. UF using membranes with pore diameters of 0.1 µm or less showed an important enhancement of the permeate flux compared to that observed without using UF pretreatment. Furthermore, it was found that the content of fermentable sugars, considered as glucose and fructose, of whole juice was decreased and the removal of proteins with UF resulted in an enhancement of the juice surface tension and the subsequent reduction of the risk of membrane pore wetting.
Recently, Jansen, et al. [142] used filtration (i.e., 10 μm pore size) followed by degassing as pretreatments to LGMD pilot plant and obtained high quality distillate. It was reported that the effect of degassing on the MD process was not conclusive, even though all the results showed that degassing had a positive effect on the permeate flux.
Chemical pretreatment has been focused on bacteria, hardness scale and oxidizing agents for their inhibition, destruction or reduction. It involves several methods such as coagulation, flocculation, precipitation, softening, pH control, etc.
He, et al. [35] applied acidification with HCl (pH = 4.1) in order to mitigate membrane scaling in DCMD. The results showed a quite stable permeate flux during the DCMD operating time (i.e., 7 h) proving that the acidification with HCl reduced the concentration of HCO3 or CO23 in the feed aqueous solution due to the neutralization by H+ following this reaction (H+ + HCO3 → H2O + CO2).
El-Abbassi, et al. [85] employed coagulation/flocculation and MF as pre-treatment processes for the treatment of OMW by DCMD. It was found that MF was the optimum pretreatment to be integrated to DCMD for OMW compared to coagulation/flocculation. MF allowed a reduction of about 30% of the total solids, whereas coagulation/flocculation permitted only 23% of the total solids.
Thermal pretreatment was considered to remove most bicarbonate from water, which in turn reduced the amount of precipitate formed during MD process. Thermal softening pretreatment or boiling followed by filtration was used to reduce the concentration of HCO3 ion below the level of 0.6 mmol/L (i.e., lowered 2–3 times) by keeping water at the boiling [144]. Gryta [33] investigated the effect of boiling and filtration of saline wastewater containing proteins to limit the intensity of fouling in DCMD. Two pretreatments were investigated: (i) sedimentation followed by UF and the obtained UF permeate was used as a feed for DCMD process, so that the results showed a significant permeate flux decrease; (ii) wastewater was boiled for 30 min and after cooling at room temperature after 12 h it was filtered through a filter paper and the result showed that TOC concentration decreased from 2780 to 1120 mg TOC/dm3 while the solution turbidity was reduced from 68.1 to 14.3 NTU. This proved that the thermal pretreatment followed by filtration permitted to avoid the rapid permeate flux decline and allowed to remove proteins foulants from the feed, therefore minimizing their precipitation on the membrane surface.
Wang, et al. [145] studied the performance and the effect of coagulation pretreatment on the efficiency of MD process for desalination of recirculating cooling water (RCW). Coagulation, filtration, acidification and degasification units were used in this study. Poly-aluminum chloride (PACl) used as coagulant was effective to remove most of the natural organic matter (NOM), antiscalant additives total phosphorus (TP) substances and suspended substance (SS) in RCW. After the coagulation and sedimentation processes, the RCW was filtered through 5 µm filter and then an acidification treatment was carried out using 0.2 mol/L HCl followed by degassing in order to reduce the CO2 concentration. The results indicated that when coagulation pretreatment was not employed for desalination by MD process, a rapid decline of the MD permeate flux was observed. However, about 23% improvement of the permeate flux was obtained by using coagulation pretreatment after 30 days operation.
The efficiency of any pretreatment depends on many parameters such as the nature of feed solutions, their foulant(s) properties and the characteristics of the membrane. All pretreatments represent an additional economic cost since either another membrane-based filtration system must be set up or a higher energy cost (i.e., boiling temperature, thermal softening, cooling recirculation, etc.) must be added. However, the importance of a pretreatment in MD cannot be overlooked because it acts as the first strategy plan for membrane fouling prevention.
Independently of the selected pretreatment, the performance of MD and OD processes is always improved when a pretreatment was carried out. However, other actions focused on the feed solution treatment (i.e., use of antiscalants) and on the membrane should be also considered to reduce or prevent fouling phenomena.

5.2. Use of Antiscalants

Antiscalants or scale inhibitors are surface active materials that inhibit inorganic scaling not only at low temperature but also at high temperature processes. These agents can prevent scaling not only in MD but also in OD or OMD [46] specially in pilot-scale desalination or RO brine treatment. The antiscalants are used to minimize the potential of scale formation on membrane surface. Antiscalants interfere with precipitation reactions in three primary ways: threshold inhibition, crystal formation and dispersion [146]. The first one refers to the capacity of an antiscalant to maintain supersaturated solutions of sparingly soluble salts (e.g., CaCO3, CaSO4, MgCO3, Fe(OH)3, CaF2, Fe(OH)3, Al(OH)3, etc.). The second one concerns the process of an antiscalants to deform crystal shapes, resulting in soft non adherent scales. The third one means the ability of some antiscalants to adsorb on crystals or colloidal particles and impart a highly negative charge to the crystal thereby keeping them separated and preventing propagation.
Early antiscalants used sodium hexametaphosphate (SHMP) as a threshold agent to inhibit the growth of calcium carbonate and sulfate-based scales. Care must be taken to avoid hydrolysis of SHMP in the dosing tank that may decrease the scale inhibition efficiency. The following reaction can describe the steps of polyphosphate hydrolysis to ortho-phosphate (PO3 + H2O → H2PO4 → HPO42− → PO43−) [146,147]. In addition to the hydrolysis problem there is a calcium phosphate scaling risk that can be described as (3Ca2+ + 2PO43− → Ca3(PO4)2).
The most used antiscalants in desalination are derived from three chemical groups [148]. Those including condensed polyphosphates, organophosphonates and polyelectrolytes. Effective polyelectrolyte inhibitors are mostly polycarboxylic acids (e.g., polyacrylic acid, polymethacrylic acid and polymaleic acid) [46]. In general, the most effective antiscalant contains a blend of polyacrylic acid (PAA) and phosphoric acid or polyacrylate and a hydroxyethylidene diphosphonate (HEDP) [46].
Gryta [46] investigated the effect of polyphosphates antiscalant on the formation of CaCO3 using a PP capillary module under DCMD configuration. When the feed without antiscalant was used the results of XRD analysis of the deposit formed on the PP membrane surface showed the calcite polymorphic form of CaCO3 scale. However, when polyphosphates were applied as antiscalant under various compositions (2–20 ppm), practically no CaCO3 crystal was detected on the membrane surface.
According to He, et al. [149] five different commercial antiscalants, namely K797 (water acrylic terpolymer), K752 (polyacrylic acid and sodium polyacrylate based compound), GHR (solution of a nitrogen containing organo-phosphorus compound), GLF (organo-phosphorus antiscalant) and GSI (based on neutralized carboxylic and phosphonic acids), were tested in DCMD process with different concentrations in the range 0.6 to 70 mg/L using a PP hollow fiber membrane coated with fluorosilicone on its external surface. The antiscalant K752 was found to be more effective in inhibiting CaSO4 scaling compared with the other tested antiscalants due to its excellent thermal stability compared with polyphosphates and other copolymers antiscalants. In addition, GHR reduced calcite scaling, whereas not much difference was observed between the performances of the other antiscalants. It is necessary to point out that no wetting problem was detected because the surface tension of antiscalants solutions (71.5 mN/m) was near to that of tap water (71.8 mN/m).
It must be mentioned that many antiscalants molecules, typically amphiphilic molecules, such as surfactants and other amphiphilic organics, often reduce the surface tension of water solutions resulting in membrane pore wetting problems and shortening the life-time of the membrane [92,150]. Therefore, prior to use, it is necessary to determine the surface tension of the feed solutions treated with antiscalants and measure the LEP of the membrane using these feed solutions. In addition, it is to be noted that there is a risk of microbiological contamination of antiscalant solutions because some antiscalants are nutrients for microbes, algae and bacteria (e.g., SHMP, orthophosphate). Moreover, other antiscalants containing phosphorous can accelerate the growth of microbes [151].

5.3. Membrane Modification

As previously mentioned, another methodology to prevent membrane fouling is to design fouling resistant membranes. This can be achieved using specific material and membrane surface modification. For instance, hydrophobicity, roughness and charge of the membrane surface are strongly related to fouling due to several interactions or adsorption/desorption between the membrane and the foulant(s). Various surface modification methods such as photochemical land redox grafting, immobilization of nanoparticles, plasma treatment, physical coating with polymers and chemical reactions on the membrane surface have been adopted in order to reduce or inhibit membrane fouling. In general, for MD, OD and OMD, membrane modification should focus on the improvement of both hydrophobicity, membrane surface omniphobicity and LEP characteristics to prevent pore wetting [24,27,28].
In order to prepare a superhydrophobic membrane, Razmjou, et al. [152] modified a microporous PVDF membrane by depositing TiO2 nanoparticles on the membrane surface using a low temperature hydrothermal. Subsequently, the TiO2 coated membrane was fluorosilanized by H,1H,2H,2H-perfluorododecyltrichlorosilane. The modified membrane showed a good hydrophobicity exhibiting a water contact angle up to 166° compared to new membrane, 125°. Moreover, the LEP was increased from 120 kPa to 190 kPa after membrane modification. Fouling mitigation was examined in a DCMD process using HA and NaCl as a feed solution. A 20 h fouling experiment with HA did not show any reduction of the permeate flux for virgin and modified membranes but when 3.8 mM CaCl2 was added in the feed solution a significant permeate flux reduction was observed due to the formation of the complexes with HA. Nevertheless, the modified membrane was less prone to fouling than the unmodified one.
Xu, et al. [153] coated microporous PTFE membranes with sodium alginate hydrogel for OD of oily feeds. The results showed that the transmembrane mass transfer coefficient decreased by less than 5% because of the membrane surface coating and the OD permeate flux, when using 0.2, 0.4 and 0.8 wt % orange oil water mixtures as feed over a period of 300 min, indicated that the coated membranes were resistant to wetting. However, the uncoated membrane was immediately wet by 0.2 wt % orange oil water feed solution.
In another study, Zuo and Wang [154] developed an effective method to modify hydrophobic PVDF membrane to enhance anti-oil fouling property for MD applications. The PVDF flat sheet membrane surface was successfully grafted by polyethylene glycol (PEG) and TiO2 particles via plasma treatment. Compared to the modified PTFE membranes by Xu, et al. [153], the MD experiments showed that the modified membrane presented a stable water permeate flux over 24 h of operation without oil fouling nor wetting.
Zhang, et al. [155] fabricated a superhydrophobic membrane by spraying a mixture of polydimethylsiloxane (PDMS) and hydrophobic SiO2 nanoparticles on PVDF flat sheet membranes surfaces. The water contact angle and LEP increased from 107° and 210 kPa to 156° and 275 kPa, respectively. The results of the DCMD experiments, which lasted 180 h using 25 wt % NaCl as a feed solution, indicated for the modified membrane a rejection factor above 99.99% with a slight decline of the permeate flux. However, the permeate flux of the unmodified membrane was decreased considerably. In addition, the SEM image indicated good fouling resistance of the modified membrane. Comparatively, An, et al. [30] showed that the hydrophobic PDMS microspheres coated on an electrospun PVDF-HFP membrane improved anti-wetting (i.e., a significant increase of the water contact angle 155.4°) and antifouling properties of the membrane when treating dyes aqueous solutions. This membrane exhibited a more negative charge than that of a commercial PVDF and therefore less fouling to differently-charged dyes.
He, et al. [34], who coated PP hollow fiber membranes with a porous fluorosilicone for their use in DCMD process, claimed that the fluorosilicone coating could discourage surface nucleation and particles attachment. In another study [35], mentioned that the porous fluorosilicone coating layer on the PP hollow fiber membranes was helpful to eliminate and develop the necessary resistance against the deposit scale such as CaSO4 and CaCO3 in DCMD experiments.
It is worth noting that modification of hydrophobic membranes for the improvement of the membrane fouling resistance is less studied compared to that of hydrophilic membranes. In general, there is a lack of information about the effect of the hydrophobic polymer type on the prevention of fouling/scaling in MD processes. The fouling mechanism in MD must be investigated in depth because a systematic study on the interactions of membranes with different feed solutions has not been performed yet.

5.4. Membrane Cleaning

Unlike the use of pretreatments and antiscalants that reduce to the maximum the fouling phenomena, cleaning of fouled membranes is other of the explored strategies to extend the membrane life. Generally, after rinsing the membrane with distilled water, the used chemical cleaning agents include acids, alkalis, surfactants, enzymes and metal chelating agents (i.e., organic compounds that form complexes with metal ions) [15,17,156]. Research studies used different strong and weak acids to clean scales such as HCl, which is particularly effective to remove basic crystal salts (e.g., CaCO3) by dissolving the deposit from the membrane surface [14,49,69]. According to Gryta [49], rinsing the membrane module by 3 wt % HCl allowed to dissolve the CaCO3 scale on the PP hollow fiber membrane and restore the initial membrane permeability. In another study, Gryta [69] used 2–5 wt % HCl solution to rinse the membrane module every 40–80 h of DCMD operation. As a result, the formed deposit, which was mainly CaCO3, was removed and the initial efficiency of the membrane module was recovered. Similarly, Curcio, et al. [157] used two steps to clean a fouled membrane with HA and CaCO3 by using citric acid aqueous solution at pH 4 for 20 min followed by 0.1 M NaOH aqueous solution for 20 min. This cleaning procedure also allowed the complete recovery of the permeate flux and the hydrophobicity of the membrane.
The high efficiency of basic cleaning procedures against the deposit of HA due to its good dissociation and dissolution at high pH values was also confirmed by Srisurichan, et al. [42] who reported that rinsing with distilled water the fouled membrane by HA containing CaCl2, for 2 h followed by 20 min recirculation of 0.1 M NaOH aqueous solution resulted in 100% permeate flux recovery. Guillen-Burrieza, et al. [111] studied membrane fouling and cleaning of solar MD plant following different cleaning strategies to remove the fouling layer and restore the membrane properties (i.e., distilled water at pH = 6.15, 5 wt % sulfuric acid at pH = 1, 5 wt % citric acid at pH = 1.77, 5 wt % formic acid at pH = 1.72, 0.1 wt % Na5P3O10 + 0.2 wt % EDTA at pH = 6.67 and 0.1 wt % oxalic acid + 0.8 wt % citric acid at pH = 2.2). The use of 0.1 wt % oxalic acid and 0.8 wt % citric acid solution was found to be the most suitable cleaning protocol as it was able to remove a great part of the scaling layer, formed mainly by NaCl, Fe, Mg and Al oxides. After the second cleaning procedure, the distillate quality was improved (i.e., salt rejection factor was 85%).
Durham and Nguyen [82] developed an effective cleaning procedure for PTFE membranes fouled after 2 h of OD processing with 21.5% of tomato puree. The permeate side of the membrane was flushed with fresh water, whereas the feed side of the membrane was rinsed with water at 40–50 °C for 10 min and then the cleaning agents were circulated at the same temperature range for 60 min. The cleaning agents included water, NaOH, HNO3 and enzymes (lipolase, alcalase, palatase and pectinex) with different concentrations. The enzyme/surfactant cleaning was performed using P3 Ultrasi1 25, P3 Ultrasil 30, P3 Ultrasi1 53, P3 Ultrasil 56, P3 Ultrasil 60A and 1% P3 Ultrasil 75. It was observed that acidic and enzymatic cleaning agents were ineffective cleaners. However, 1% NaOH was the most effective cleaner for membranes with a surface tension greater than 23 mN/m and 1% P3 Ultrasil56 was the best cleaner too for membranes with a surface tension less than 23 mN/m as it was able to maintain the water permeate flux in addition to the hydrophobicity of the membrane.
Zarebska, et al. [103] investigated the effect of consecutive cleaning of MD membranes used for the treatment of model manure solution by using distilled water, alkaline/acid and Novadan cleaning agents. The results showed that cleaning with distilled water had the lowest cleaning efficiency, whereas cleaning with distilled water followed by either NaOH/citric acid or Novadan agents was more efficient. Among the tested cleaning strategies, it was claimed that Novadan agent was the most successful in removing proteins and carbohydrates from PTFE membrane while it removed only proteins from PP membrane [103].
For cleaning biofouled membranes, the use of biocides [15] followed by rinsing with distilled water can be effective to recover the initial permeate flux. Krivorot, et al. [158] used NaOH at a pH value of about 12 and a temperature of 40 °C to hydrolyze organic/bacterial fouling, followed by distilled water and 70% ethanol for sterilizing the system, and finally distilled water to remove ethanol. It was observed that the initial permeability was recovered by removing the biofilm deposit.
The use of the appropriate cleaning agent depends on the fouling and scaling nature, deposit location and the membrane resistance to chemical cleaning [2,111]. Typical MD polymers (PP, PTFE, PVDF) offer high resistance to chemical cleaning. However, it must be noted that cleaning porous and hydrophobic membranes used in MD, OD and OMD is not an easy task because of the high risk of pore wetting. In fact, generally in MD process, cleaning of membranes was found to be insufficient provided that fouling is also associated with membrane wettability. For instance, pressure and temperature play an important role in membrane cleaning [156]. High temperatures improve cleaning by increasing transport and solubility of the fouling material as well as the reaction kinetics. Minimum pressure cannot force the fouling layer onto the membrane surface, making it less adhesive.

6. Conclusions and Future Perspectives

Membrane fouling is a common problem and complex phenomena in all processes used for seawater desalination and waste water treatment applications. For MD, OD and OMD, fouling leads to membrane pore wetting and blocking. Compared to other membrane separation processes such as the pressure-driven membrane processes (MF, UF, RO, etc.), very few research studies have been published so far on fouling mechanisms in MD, OD and OMD, and investigations on the kinetics behind fouling phenomena and fouling mitigation remain very scarce and poorly understood. Moreover, when fouling is studied, the considered characterization techniques focused only on the average physico-chemical properties of the surface deposits but not on the underlying deposit layers.
In MD, OD and OMD, fouling is influenced by various parameters such as the membrane characteristics, especially the pore size and the material of the membrane surface, operation conditions and nature of the fee aqueous solutions.
As it is well known, MD, OD and OMD membrane technologies suffer from the temperature and concentration polarization phenomena and various strategies have been adopted in order to reduce their effects including the increase of the flow rate of both the feed and permeate solutions, turbulent promoters, etc. These polarization phenomena can have a major influence on inorganic fouling. For salts like CaCO3 and CaSO4 whose solubility in water decreases with increasing temperature, the temperature polarization phenomenon encourages the crystals formation of these salts in the bulk feed solution. However, for salts like NaCl whose solubility in water increases with increasing temperature, the concentration and temperature polarization phenomena encourage the crystals formation of these salts on the membrane surface where the temperature is lower and the concentration is higher.
Greater hydrophobicity and lower pore size tend to increase organic fouling effects. This type of fouling also depends on the nature of the organic matter, the MD operating conditions (temperature, transmembrane pressure, flow rate) and the characteristics of the feed solution (pH, ionic strength).
Biofouling refers to the growth of bacteria or micro-organisms on the membrane surface and to biological particles that may be trapped at both the membrane surface and/or pores forming a biofilm. This type of fouling is the least studied in MD, OD and OMD compared to the other types of fouling.
Fouling investigation in OD has received less attention compared to MD and fouling in OMD may take place following the same mechanisms as those occurred in DCMD and OD fouling, provided that OMD combines both MD and OD.
Many research studies using different membrane characterization techniques still need to be done in order to understand the formation mechanisms of the different fouling types. Some characterization techniques reported in the present review paper (TEM, UTDR, EEM and FFF) are yet to be applied to analyze fouled membranes used in MD, OD and OMD processes. No analytical technique can be used on its own to characterize the fouling deposit on the membrane surface. A combination of different techniques seems to be more appropriate.
Feed pretreatment, membrane modification, use of antiscalants and cleaning strategies of membrane surfaces are the most used methods to diminish or prevent foulant(s) deposition onto the membrane surface and in its pores during MD, OD or OMD applications. Up to now, pretreatment has been the appropriate method to prevent and minimize fouling in MD, OD and OMD processes. Antiscalants inhibit the inorganic fouling (i.e., scaling) and minimize the potential for forming scale layer on the membrane surface. Condensed polyphosphates, organophosphonates and polyelectrolytes are the common antiscalants used in desalination [140]. Attention should be paid to some antiscalants that are nutrients for microbes, algae and bacteria increasing therefore the risk of microbiological contamination.
One explored strategy to extend the membrane life is the chemical cleaning. In general, alkaline agents are advisable for cleaning organic fouled membranes. However, soluble salts like calcium carbonate or iron oxides, require acid cleaners. In addition, membrane surface modification seems to be one of the promising methods for developing anti-fouling membranes as it can enhance both hydrophobicity and LEP characteristics of the membranes in order to prevent pore wetting. Generally, in MD, OD and OMD processes, cleaning membranes was found to be insufficient provided that fouling is also associated with membrane wettability.
Although the fouling topic has generated much interest among researchers, this phenomenon still needs to be deeply studied using different characterization techniques applied not only on the membrane surface but also inside its pores. This will permit us to understand this phenomenon well and propose new methods to prevent it. On the other hand, there is a need to design novel and advanced membranes for MD, OD, OMD resistant to fouling.

Author Contributions

The author Mourad Laqbaqbi collected, classified and analysed all data from the cited literature. He wrote the first draft of the paper and followed its revision. All authors contributed in the writing, discussion, analysis and completion of the manuscript.

Conflicts of Interest

The authors declare no conflicts of interest.

References

  1. Alkhudhiri, A.; Darwish, N.; Hilal, N. Membrane distillation: A comprehensive review. Desalination 2012, 287, 2–18. [Google Scholar] [CrossRef]
  2. Khayet, M.; Matsuura, T. Membrane Distillation: Principles and Aplication; Elsevier: Amsterdam, The Netherlands, 2011. [Google Scholar]
  3. Chew, J.W.; Krantz, W.B.; Fane, A.G. Effect of a macromolecular- or bio-fouling layer on membrane distillation. J. Membr. Sci. 2014, 456, 66–76. [Google Scholar] [CrossRef]
  4. Bui, A.V.; Nguyen, H.M.; Muller, J. A laboratory study on glucose concentration by OD in hollow fibre module. J. Food Eng. 2004, 63, 237–245. [Google Scholar] [CrossRef]
  5. Zambra, C.; Romero, J.; Pino, L.; Saavedra, A.; Sanchez, J. Concentration of cranberry juice by osmotic distillation process. J. Food Eng. 2015, 144, 58–65. [Google Scholar] [CrossRef]
  6. Cassano, A.; Drioli, E. Concentration of clarified kiwifruit juice by osmotic distillation. J. Food Eng. 2007, 79, 1397–1404. [Google Scholar] [CrossRef]
  7. Gryta, M. Osmotic MD and other membrane distillation variants. J. Membr. Sci. 2005, 246, 145–156. [Google Scholar] [CrossRef]
  8. Wang, L.; Min, J. Modeling and analyses of membrane osmotic distillation using non-equilibrium thermodynamics. J. Membr. Sci. 2011, 378, 462–470. [Google Scholar] [CrossRef]
  9. Ravindra Babu, B.; Rastogi, N.K.; Raghavarao, K.S.M.S. Concentration and temperature polarization effects during osmotic membrane distillation. J. Membr. Sci. 2008, 322, 146–153. [Google Scholar] [CrossRef]
  10. Raghavarao, K.S.M.S.; Madhusudhan, M.C.; Tavanandi, T.H.; Niranjan, K. Athermal Membrane Processes for the Concentration of Liquid Foods and Natural Colors. Chapter 12 BOOK Da-Wen Sun-Emerging Technologies for Food Processing, 2nd ed.; Academic Press, Elsevier: New York, NY, USA, 2014. [Google Scholar]
  11. Khayet, M.; Mengual, J.I. Effect of salt concentration during the treatment of humic acid solutions by membrane distillation. Desalination 2004, 168, 373–381. [Google Scholar] [CrossRef]
  12. Hausmann, A.; Sanciolo, P.; Vasiljevic, T.; Weeks, M.; Schroën, K.; Gray, S.; Duke, M. Fouling mechanisms of dairy streams during membrane distillation. J. Membr. Sci. 2013, 441, 102–111. [Google Scholar] [CrossRef]
  13. Nguyen, Q.M.; Lee, S. Fouling analysis and control in a DCMD process for SWRO brine. Desalination 2015, 367, 21–27. [Google Scholar] [CrossRef]
  14. Warsinger, D.M.; Swaminathan, J.; Guillen-Burrieza, E.; Arafat, H.A.; Lienhard V, J.H. Scaling and fouling in membrane distillation for desalination applications: A review. Desalination 2015, 356, 294–313. [Google Scholar] [CrossRef]
  15. Tijing, L.D.; Woo, Y.C.; Choi, J.S.; Lee, S.; Kim, S.H.; Shon, H.K. Fouling and its control in membrane distillation—A review. J. Membr. Sci. 2015, 475, 215–244. [Google Scholar] [CrossRef]
  16. Alklaibi, A.M.; Lior, N. Membrane-distillation desalination: Status and potential. Desalination 2005, 171, 111–131. [Google Scholar] [CrossRef]
  17. Lee, H.; Amy, G.; Cho, J.; Yoon, Y.; Moon, S.H.; Kim, I.S. Cleaning strategies for flux recovery of an ultrafiltration membrane fouled by natural organic matter. Water Res. 2001, 35, 3301–3308. [Google Scholar] [CrossRef]
  18. Wang, P.; Chung, T.S. Recent advances in membrane distillation processes: Membrane development, configuration design and application exploring. J. Membr. Sci. 2015, 474, 39–56. [Google Scholar] [CrossRef]
  19. Khayet, M. Membranes and theoretical modeling of membrane distillation, a review. Adv. Colloid Interface Sci. 2011, 164, 56–88. [Google Scholar] [CrossRef] [PubMed]
  20. Nane, S.; Patil, G.; Raghavarao, K.S.M.S. Chapter 19: Membrane Distillation in Food Processing. In Handbook of Membrane Separations: Chemical, Pharmaceutical, Food, and Biotechnological Applications; Pabby, A.K., Rizvi, S.S.H., Sastre, A.M., Eds.; CRC Press: Boca Raton, FL, USA, 2008. [Google Scholar]
  21. Lawson, K.W.; Lloyd, D.R. Membrane distillation: A review. J. Membr. Sci. 1997, 124, 1–25. [Google Scholar] [CrossRef]
  22. Drioli, E.; Ali, A.; Macedonio, F. Membrane distillation: Recent developments and perspectives. Desalination 2015, 356, 56–84. [Google Scholar] [CrossRef]
  23. Eykens, L.; De Sitter, K.; Dotremont, C.; Pinoy, L.; Van der Bruggen, B. How to Optimize the Membrane Properties for Membrane Distillation: A Review. Ind. Eng. Chem. Res. 2016, 55, 9333–9343. [Google Scholar] [CrossRef]
  24. Hilal, N.; Khayet, M.; Wright, C.J. Membrane Modification: Technology and Application; CRC Press, Taylor & Francis Group: Boca Raton, FL, USA, 2012. [Google Scholar]
  25. Mansouri, J.; Fane, A.G. Membrane development for processing of oily feeds in IMD, osmotic distillation: Developments in technology and modelling. In Proceedings of the Workshop on “Membrane Distillation, Osmotic Distillation and Membrane Contactors” (CNRIRMERC), Cetraro, Italy, 2–4 July 1998; pp. 43–46. [Google Scholar]
  26. Cheng, D.Y.; Wiersma, S.J. Composite Membrane for Membrane Distillation System. U.S. Patent 4,419,242, 23 February 1982. [Google Scholar]
  27. Boo, C.; Lee, J.; Elimelech, M. Engineering Surface Energy and Nanostructure of Microporous Films for Expanded Membrane Distillation Applications. Environ. Sci. Technol. 2016, 50, 8112–8119. [Google Scholar] [CrossRef] [PubMed]
  28. Lee, J.; Boo, C.; Ryu, W.H.; Taylor, A.D.; Elimelech, M. Development of Omniphobic Desalination Membranes Using a Charged Electrospun Nanofiber Scaffold. ACS Appl. Mater. Interfaces 2016, 8, 11154–11161. [Google Scholar] [CrossRef] [PubMed]
  29. An, A.K.; Guo, J.; Jeong, S.; Lee, E.J.; Tabatabai, S.A.; Leiknes, T. High flux and antifouling properties of negatively charged membrane for dyeing wastewater treatment by membrane distillation. Water Res. 2016, 103, 362–371. [Google Scholar] [CrossRef] [PubMed]
  30. An, A.K.; Guo, J.; Lee, E.J.; Jeong, S.; Zhao, Y.; Wang, Z.; Leiknes, T. PDMS/PVDF hybrid electrospun membrane with superhydrophobic property and drop impact dynamics for dyeing wastewater treatment using membrane distillation. J. Membr. Sci. 2017, 525, 57–67. [Google Scholar] [CrossRef]
  31. Khayet, M.; Velázquez, A.; Mengual, J.I. Direct contact membrane distillation of humic acid solutions. J. Membr. Sci. 2004, 240, 123–128. [Google Scholar] [CrossRef]
  32. Narayan, A.V.; Nagaraj, N.; Hebbar, H.U.; Chakkaravarthi, A.; Raghavarao, K.S.M.S.; Nene, S. Acoustic field-assisted osmotic membrane distillation. Desalination 2002, 147, 149–156. [Google Scholar] [CrossRef]
  33. Gryta, M. Fouling in direct contact membrane distillation process. J. Membr. Sci. 2008, 325, 383–394. [Google Scholar] [CrossRef]
  34. He, F.; Gilron, J.; Lee, S.; Sirkar, K.K. Potential for scaling by sparingly soluble salts in cross flow DCMD. J. Membr. Sci. 2008, 311, 68–80. [Google Scholar] [CrossRef]
  35. He, F.; Sirkar, K.K.; Gilron, J. Studies on scaling of membranes in desalination by direct contact membrane distillation: CaCO3 and mixed CaCO3/CaSO4 systems. Chem. Eng. Sci. 2009, 64, 1844–1859. [Google Scholar] [CrossRef]
  36. Jacob, P.; Phungsai, P.; Fukushi, K.; Visvanathan, C. Direct contact membrane distillation for anaerobic effluent treatment. J. Membr. Sci. 2015, 475, 330–339. [Google Scholar] [CrossRef]
  37. Hausmann, A.; Sanciolo, P.; Vasiljevic, T.; Weeks, M.; Schroën, K.; Gray, S.; Duke, M. Fouling of dairy components on hydrophobic polytetrafluoroethylene (PTFE) membranes for membrane distillation. J. Membr. Sci. 2013, 442, 149–159. [Google Scholar] [CrossRef]
  38. Ding, Z.; Liu, L.; Liu, Z.; Ma, R. Fouling resistance in concentrating TCM extract by direct contact membrane distillation. J. Membr. Sci. 2010, 362, 317–325. [Google Scholar] [CrossRef]
  39. Naidu, G.; Jeong, S.; Vigneswaran, S. Interaction of humic substances on fouling in membrane distillation for seawater desalination. Chem. Eng. J. 2015, 262, 946–957. [Google Scholar] [CrossRef]
  40. Naidu, G.; Jeong, S.; Kim, S.J.; Kim, I.S.; Vigneswaran, S. Organic fouling behavior in direct contact membrane distillation. Desalination 2014, 347, 230–239. [Google Scholar] [CrossRef]
  41. Guillen-Burrieza, E.; Thomas, R.; Mansoor, B.; Johnson, D.; Hilal, N.; Arafat, H. Effect of dry-out on the fouling of PVDF and PTFE membranes under conditions simulating intermittent seawater membrane distillation (SWMD). J. Membr. Sci. 2013, 438, 126–139. [Google Scholar] [CrossRef]
  42. Srisurichan, S.; Jiraratananon, R.; Fane, A.G. Humic acid fouling in the membrane distillation process. Desalination 2005, 174, 63–72. [Google Scholar] [CrossRef]
  43. Ge, J.; Peng, Y.; Li, Z.; Chen, P.; Wang, S. Membrane fouling and wetting in a DCMD process for RO brine concentration. Desalination 2014, 344, 97–107. [Google Scholar] [CrossRef]
  44. Mokhtar, N.M.; Lau, W.J.; Ismail, A.F.; Veerasamy, D. Membrane Distillation Technology for Treatment of Wastewater from Rubber Industry in Malaysia. Procedia CIRP 2015, 26, 792–796. [Google Scholar] [CrossRef]
  45. Yu, X.; Yang, H.; Lei, H.; Shapiro, A. Experimental evaluationon concentrating cooling tower blow down water by direct contact membrane distillation. Desalination 2013, 323, 134–141. [Google Scholar] [CrossRef]
  46. Gryta, M. Polyphosphates used for membrane scaling inhibition during water desalination by membrane distillation. Desalination 2012, 285, 170–176. [Google Scholar] [CrossRef]
  47. Gryta, M. Influence of polypropylene membrane surface porosity on the performance of membrane distillation process. J. Membr. Sci. 2007, 287, 67–78. [Google Scholar] [CrossRef]
  48. Gryta, M.; Tomaszewska, M.; Grzechulska, J.; Morawski, A.W. Membrane distillation of NaCl solution containing natural organic matter. J. Membr. Sci. 2001, 181, 279–287. [Google Scholar] [CrossRef]
  49. Gryta, M. Alkaline scaling in the membrane distillation process. Desalination 2008, 228, 128–134. [Google Scholar] [CrossRef]
  50. Gryta, M.; Grzechulska-Damszel, J.; Markowska, A.; Karakulski, K. The influence of polypropylene degradation on the membrane wettability during membrane distillation. J. Membr. Sci. 2009, 326, 493–502. [Google Scholar] [CrossRef]
  51. Tian, R.; Gao, H.; Yang, X.H.; Yan, S.Y.; Li, S. A new enhancement technique on air gap membrane distillation. Desalination 2014, 332, 52–59. [Google Scholar] [CrossRef]
  52. Alkhudhiri, A.; Darwish, N.; Hilal, N. Treatment of high salinity solutions: Application of air gap membrane distillation. Desalination 2012, 287, 55–60. [Google Scholar] [CrossRef]
  53. Mericq, J.P.; Laborie, S.; Cabassud, C. Vacuum membrane distillation of seawater reverse osmosis brines. Water Res. 2010, 44, 5260–5273. [Google Scholar] [CrossRef] [PubMed]
  54. Zhao, Z.P.; Zhu, C.Y.; Liu, D.Z.; Liu, W.F. Concentration of ginseng extracts aqueous solution by vacuum membrane distillation 2. Theory analysis of critical operating conditions and experimental confirmation. Desalination 2011, 267, 147–153. [Google Scholar] [CrossRef]
  55. Ji, Z.; Wang, J.; Hou, D.; Yin, Z.; Luan, Z. Effect of microwave irradiation on vacuum membrane distillation. J. Membr. Sci. 2013, 429, 473–479. [Google Scholar] [CrossRef]
  56. Zhiqing, Y.; Xiaolong, L.; Chunrui, W.; Xuan, W. Effect of pretreatment on membrane fouling and VMD performance in the treatment of RO- concentrated wastewater. Desalin. Water Treat. 2013, 51, 6994–7003. [Google Scholar] [CrossRef]
  57. Banat, F.; Al-Asheh, S.; Qtaishat, M. Treatment of waters colored with methylene blue dye by vacuum membrane distillation. Desalination 2005, 174, 87–96. [Google Scholar] [CrossRef]
  58. Zarebska, A.; Nieto, D.R.; Christensen, K.V.; Norddahl, B. Ammonia recovery from agricultural wastes by membrane distillation: Fouling characterization and mechanism. Water Res. 2014, 56, 1–10. [Google Scholar] [CrossRef] [PubMed]
  59. Criscuoli, A.; Zhong, J.; Figoli, A.; Carnevale, M.C.; Huang, R.; Drioli, E. Treatment of dye solutions by vacuum membrane distillation. Water Res. 2008, 42, 5031–5037. [Google Scholar] [CrossRef] [PubMed]
  60. Yuan, W.; Zydney, A.L. Humic acid fouling during microfiltration. J. Membr. Sci. 1999, 157, 1–12. [Google Scholar] [CrossRef]
  61. Jermann, D.; Pronk, W.; Meylan, S.; Boller, M. Interplay of different NOM fouling mechanisms during ultrafiltration for drinking water production. Water Res. 2007, 41, 1713–1722. [Google Scholar] [CrossRef] [PubMed]
  62. Nilson, J.A.; Digiano, F.A. Influence of NOM composition on nanofiltration. J. Am. Water Works Assoc. 1996, 88, 53–66. [Google Scholar]
  63. Hong, S.; Elimelech, M. Chemical and physical aspects of natural organic matter (NOM) fouling of nanofiltration membranes. J. Membr. Sci. 1997, 132, 159–181. [Google Scholar] [CrossRef]
  64. Gryta, M. Concentration of saline wastewater from the production of heparin. Desalination 2000, 129, 35–44. [Google Scholar] [CrossRef]
  65. Hamrouni, B.; Dhahbi, M. Calco-carbonic equilibrium calculation. Desalination 2002, 152, 167–174. [Google Scholar] [CrossRef]
  66. Wirth, D.; Cabassud, C. Water desalination using membrane distillation: Comparison between inside/out and outside/in permeation. Desalination 2002, 147, 139–145. [Google Scholar] [CrossRef]
  67. Safavi, M.; Mohammadi, T. High-salinity water desalination using VMD. Chem. Eng. J. 2009, 149, 191–195. [Google Scholar] [CrossRef]
  68. Gryta, M.; Tomaszewska, M.; Karakulski, K. Wastewater treatment by membrane distillation. Desalination 2006, 198, 67–73. [Google Scholar] [CrossRef]
  69. Gryta, M. Long-term performance of membrane distillation process. J. Membr. Sci. 2005, 265, 153–159. [Google Scholar] [CrossRef]
  70. Tun, C.M.; Fane, A.G.; Matheickal, J.T.; Sheikholeslami, R. Membranes distillation crystallization of concentrated salts-flux and crystal formation. J. Membr. Sci. 2005, 257, 144–155. [Google Scholar] [CrossRef]
  71. Yun, Y.; Ma, R.; Zhang, W.; Fane, A.G.; Li, J. Direct contact membrane distillation mechanism for high concentration NaCl solutions. Desalination 2006, 188, 251–262. [Google Scholar] [CrossRef]
  72. Mariah, L.; Buckley, C.A.; Brouckaert, C.J.; Curcio, E.; Drioli, E.; Jaganyi, D.; Ramjugernath, D. Membrane distillation of concentrated brines-Role of water activities in the evaluation of driving force. J. Membr. Sci. 2006, 280, 937–947. [Google Scholar] [CrossRef]
  73. Drioli, E.; Criscuoli, A.; Curcio, E. Integrated membrane operation for seawater desalination. Desalination 2002, 147, 77–81. [Google Scholar] [CrossRef]
  74. Curcio, E.; Profio, G.D.; Drioli, E. Membrane crystallization of macromolecular solutions. Desalination 2002, 145, 173–177. [Google Scholar] [CrossRef]
  75. Bouguecha, S.; Dhabi, M. Fluidized bed crystallizer and air gap membrane distillation as a solution to geothermal water desalination. Desalination 2002, 152, 237–244. [Google Scholar] [CrossRef]
  76. Gryta, M. The assessment of microorganism growth in the membrane distillation system. Desalination 2002, 142, 79–88. [Google Scholar] [CrossRef]
  77. Vogt, M.; Flemming, H.; Veeman, W. Diffusion in Pseudomonas aeruginosa biofilms: A pulsed field gradient NMR study. J. Biotechnol. 2000, 77, 137–146. [Google Scholar] [CrossRef]
  78. Flemming, H.C.; Schaule, G.; McDonogh, R.; Ridgway, H.F. Effects and extent of biofilm accumulation in membrane systems. In Biofouling and Biocorrosionin Industrial Water Systems; Geesey, G.G., Lewandowsky, Z., Flemming, H.C., Eds.; CRC Press/Lewis Publishers: Boca Raton, FL, USA, 1994; pp. 63–89. [Google Scholar]
  79. Goh, S.; Zhang, J.; Liu, Y.; Fane, A.G. Fouling and wetting in membrane distillation (MD) and MD-bioreactor (MDBR) for wastewater reclamation. Desalination 2013, 323, 39–47. [Google Scholar] [CrossRef]
  80. Goh, S.; Zhang, Q.; Zhang, J.; McDougald, D.; Krantz, W.B.; Liu, Y.; Fane, A.G. Impact of a biofouling layer on the vapor pressure driving force and performance of a membrane distillation process. J. Membr. Sci. 2013, 438, 140–152. [Google Scholar] [CrossRef]
  81. El-Abbassi, A.; Khayet, M.; Kiai, H.; Hafidi, A.; García-Payo, M.C. Treatment of crude olive mill wastewaters by osmotic distillation and osmotic membrane distillation. Sep. Purif. Technol. 2013, 104, 327–332. [Google Scholar] [CrossRef]
  82. Durham, R.J.; Nguyen, H.M. Hydrophobic membrane evaluation and cleaning for osmotic distillation of tomato puree. J. Membr. Sci. 1994, 87, 181–189. [Google Scholar] [CrossRef]
  83. Kujawski, W.; Sobolewska, A.; Jarzynka, K.; Güell, C.; Ferrando, M.; Warczok, J. Application of osmotic membrane distillation process in red grape juice concentration. J. Food Eng. 2013, 116, 801–808. [Google Scholar] [CrossRef]
  84. Bui, A.V.; Nguyen, H.M. Scaling up of osmotic distillation from laboratory to pilot plant for concentration of fruit juices. Int. J. Food Eng. 2005, 1, 1556–3758. [Google Scholar] [CrossRef]
  85. El-Abbassi, A.; Hafidi, A.; Khayet, M.; García-Payo, M.C. Integrated direct contact membrane distillation for olive mill wastewater treatment. Desalination 2013, 323, 31–38. [Google Scholar] [CrossRef]
  86. Ruiz Salmón, I.; Janssens, R.; Luis, P. Mass and heat transfer study in osmotic membrane distillation-crystallization for CO2 valorization as sodium carbonate. Sep. Purif. Technol. 2017, 176, 173–183. [Google Scholar] [CrossRef]
  87. Bui, A.V.; Nguyen, H.M.; Joachim, M. Characterisation of the polarisations in osmotic distillation of glucose solutions in hollow fibre module. J. Food Eng. 2005, 68, 391–402. [Google Scholar] [CrossRef]
  88. Karlsson, E.; Luh, B.S. Vegetable juices, sauces and soups. In Commercial Vegetable Processing; Luh, B.S., Woodroof, J.G., Eds.; Medtech: New York, NY, USA, 1988. [Google Scholar]
  89. Wills, R.B.H.; Lim, J.S.K.; Greenfield, H. Composition of Australian foods. Tomato Food Thechnol. Aust. 1984, 36, 78–80. [Google Scholar]
  90. Charfi, A.; Jang, H.; Kim, J. Membrane fouling by sodium alginate in high salinity conditions to simulate biofouling during seawater desalination. Bioresour. Technol. 2017, in press. [Google Scholar] [CrossRef] [PubMed]
  91. Lokare, O.R.; Tavakkoli, S.; Wadekar, S.; Khanna, V.; Vidic, R.D. Fouling in direct contact membrane distillation of produced water from unconventional gas extraction. J. Membr. Sci. 2017, 524, 493–501. [Google Scholar] [CrossRef]
  92. Wang, Z.; Lin, S. Membrane fouling and wetting in membrane distillation and their mitigation by novel membranes with special wettability. Water Res. 2017, 112, 38–47. [Google Scholar] [CrossRef] [PubMed]
  93. Zhao, F.; Chu, H.; Yu, Z.; Jiang, S.; Zhao, X.; Zhou, X.; Zhang, Y. The filtration and fouling performance of membranes with different pore sizes in algae harvesting. Sci. Total Environ. 2017. [Google Scholar] [CrossRef] [PubMed]
  94. Girão, A.V.; Caputo, G.; Ferro, M.C. Application of Scanning Electron Microscopy–Energy Dispersive X-Ray Spectroscopy (SEM-EDS). Compr. Anal. Chem. 2017, 75. [Google Scholar] [CrossRef]
  95. Jafarzadeh, Y.; Yegani, R.; Sedaghat, M. Preparation, characterization and fouling analysis of ZnO/polyethylene hybrid membranes for collagen separation. Chem. Eng. Res. Des. 2015, 94, 417–427. [Google Scholar] [CrossRef]
  96. Shirazi, S.; Lin, C.J.; Chen, D. Inorganic fouling of pressure-driven membrane processes—A critical review. Desalination 2010, 250, 236–248. [Google Scholar] [CrossRef]
  97. Liu, Z.; Ohsuna, T.; Sato, K.; Mizuno, T.; Kyotani, T.; Nakane, T.; Terasaki, O. Transmission electron microscopy observation on fine structure of zeolite NaA membrane. Chem. Mater. 2006, 18, 922–927. [Google Scholar] [CrossRef]
  98. Heinzl, C.; Ossiander, T.; Gleich, S.; Scheu, C. Transmission electron microscopy study of silica reinforced polybenzimidazole membranes. J. Membr. Sci. 2015, 478, 65–74. [Google Scholar] [CrossRef]
  99. Taheri, M.L.; Stach, E.A.; Arslan, I.; Crozier, P.A.; Kabius, B.C.; LaGrange, T.; Minor, A.M.; Takeda, S.; Tanase, M.; Wagner, J.B.; et al. Current status and future directions for in situ transmission electron microscopy. Ultramicroscopy 2016, 170, 86–95. [Google Scholar] [CrossRef] [PubMed]
  100. Weiss, C.; McLoughlin, P.; Cathcart, H. Characterisation of dry powder inhaler formulations using atomic force microscopy. A Review. Int. J. Pharm. 2015, 494, 393–407. [Google Scholar] [CrossRef] [PubMed]
  101. Khulbe, K.C.; Feng, C.Y.; Matsuura, T. Synthetic Polymeric Membranes: Characterization by Atomic Force Microscopy; Springer: Heidelberg, Germany, 2008. [Google Scholar]
  102. Bowen, W.R.; Hilal, N. Atomic Force Microscopy in Process Engineering: An Introduction to AFM for Improved Processes and Products; Elsevier: Oxford, UK, 2009. [Google Scholar]
  103. Zarebska, A.; Amor, Á.C.; Ciurkot, K.; Karring, H.; Thygesen, O.; Andersen, T.P.; Hägg, M.-B.; Christensen, K.V.; Norddahl, B. Fouling mitigation in membrane distillation processes during ammonia stripping from pig manure. J. Membr. Sci. 2015, 484, 119–132. [Google Scholar] [CrossRef]
  104. Yun, M.A.; Yeon, K.M.; Park, J.S.; Lee, C.H.; Chun, J.; Lim, D.J. Characterization of biofilm structure and its effect on membrane permeability in MBR for dye wastewater treatment. Water Res. 2006, 40, 45–52. [Google Scholar] [CrossRef] [PubMed]
  105. Canette, A.; Briandet, R. Confocal Laser Scanning Microscopy. Agro ParisTech 2014, 2, 1389–1396. [Google Scholar]
  106. Yuan, B.; Wang, X.; Tang, C.; Li, X.; Yu, G. In situ observation of the growth of biofouling layer in osmotic membrane bioreactors by multiple fluorescence labeling and confocal laser scanning microscopy. Water Res. 2015, 75, 188–200. [Google Scholar] [CrossRef] [PubMed]
  107. Ferrando, M.; Rrzek, A.; Zator, M.; Lopez, F.; Guell, C. An approach to membrane fouling characterization by confocal scanning laser microscopy. J. Membr. Sci. 2005, 250, 283–293. [Google Scholar] [CrossRef]
  108. West, S.; Horn, H.; Hijnen, W.A.M.; Castillo, C.; Wagner, M. Confocal laser scanning microscopy as a tool to validate the efficiency of membrane cleaning procedures to remove biofilms. Sep. Purif. Technol. 2014, 122, 402–411. [Google Scholar] [CrossRef]
  109. Spettmann, D.; Eppmann, S.; Flemming, H.-C.; Wingender, J. Visualization of membrane cleaning using confocal laser scanning microscopy. Desalination 2008, 224, 195–200. [Google Scholar] [CrossRef]
  110. Courel, M.; Tronel-Peyroz, E.; Rios, G.M.; Dornier, M.; Reynes, M. The problem of membrane characterization for the process of osmotic distillation. Desalination 2001, 140, 15–25. [Google Scholar] [CrossRef]
  111. Guillen-Burrieza, E.; Ruiz-Aguirre, A.; Zaragoza, G.; Arafat, H.A. Membrane fouling and cleaning in long term plant-scale membrane distillation operations. J. Membr. Sci. 2014, 468, 360–372. [Google Scholar] [CrossRef]
  112. Sanmartino, J.A.; Khayet, M.; García-Payo, M.C.; El Bakouri, H.; Riaza, A. Desalination and concentration of saline aqueous solutions up to supersaturation by air gap membrane distillation and crystallization fouling. Desalination 2016, 393, 39–51. [Google Scholar] [CrossRef]
  113. Bagavathiappan, S.; Lahiri, B.B.; Saravanan, T.; Philip, J.; Jayakumar, T. Infrared thermography for condition monitoring—A review. Infrared Phys. Technol. 2013, 60, 35–55. [Google Scholar] [CrossRef]
  114. Marinetti, S.; Cesaratto, P.G. Emissivity estimation for accurate quantitative thermography. NDT & E Int. 2012, 51, 127–134. [Google Scholar]
  115. Ndukaife, K.O.; Ndukaife, J.C.; Agwu Nnanna, A.G. Membrane fouling characterization by infrared thermography. Infrared Phys. Technol. 2015, 68, 186–192. [Google Scholar] [CrossRef]
  116. Li, X.; Zhang, H.; Hou, Y.; Gao, Y.; Li, J.; Guo, W.; Ngo, H.H. In situ investigation of combined organic and colloidal fouling for nanofiltration membrane using ultrasonic time domain reflectometry. Desalination 2015, 362, 43–51. [Google Scholar] [CrossRef]
  117. Mairal, A.P.; Greenberg, A.R.; Krantz, W.B.; Bond, L.J. Real time measurement of inorganic fouling of RO desalination membranes using ultrasonic time domain reflectometry. J. Membr. Sci. 1999, 159, 185–196. [Google Scholar] [CrossRef]
  118. Zhang, Z.X.; Greenberg, A.R.; Krantz, W.B.; Chai, G.Y. Study of membrane fouling and cleaning in spiral wound modules using ultrasonic time-domain reflectometry. In New Insights into Membrane Science and Technology Polymeric, Inorganic and Biofunctional Membranes; Butterfield, A.A., Bhattacharyya, D., Eds.; Elsevier: Amsterdam, The Netherlands, 2003; pp. 65–88. [Google Scholar]
  119. Taheri, A.H.; Sim, S.T.V.; Sim, L.N.; Chong, T.H.; Krantz, W.B.; Fane, A.G. Development of a new technique to predict reverse osmosis fouling. J. Membr. Sci. 2013, 448, 12–22. [Google Scholar] [CrossRef]
  120. Xu, X.; Li, J.; Li, H.; Cai, Y.; Cao, Y.; He, B.; Zhang, Y. Non-invasive monitoring of fouling in hollow fiber membrane via UTDR. J. Membr. Sci. 2009, 326, 103–110. [Google Scholar] [CrossRef]
  121. Tung, K.-L.; Teoh, H.-C.; Lee, C.-W.; Chen, C.-H.; Li, Y.-L.; Lin, Y.-F.; Chen, C.-L.; Huang, M.-S. Characterization of membrane fouling distribution in a spiral wound module using high-frequency ultrasound image analysis. J. Membr. Sci. 2015, 495, 489–501. [Google Scholar] [CrossRef]
  122. Hunter, R.J. Zeta Potential in Colloid Science: Principles and Applications; Academic Press: London, UK, 1981. [Google Scholar]
  123. Mikhaylin, S.; Bazinet, L. Fouling on ion-exchange membranes: Classification, characterization and strategies of prevention and control. A review. Adv. Colloid Interface Sci. 2016, 229, 34–56. [Google Scholar] [CrossRef] [PubMed]
  124. Erickson, D.; Li, D. Streaming Potential and Streaming Current Methods for Characterizing Heterogeneous Solid Surfaces. J. Colloid Interface Sci. 2001, 237, 283–289. [Google Scholar] [CrossRef] [PubMed]
  125. Tanaka, K.; Kodama, S.; Goto, T. X-ray Diffraction Studies on the Deformation and Fracture of Solids; Elsevier: Amsterdam, The Netherlands, 1993; Volume 10. [Google Scholar]
  126. Kim, J.; Kwon, H.; Lee, S.; Lee, S.; Hong, S. Membrane distillation (MD) integrated with crystallization (MDC) for shale gas produced water (SGPW) treatment. Desalination 2017, 403, 172–178. [Google Scholar] [CrossRef]
  127. Melián-Martel, N.; Sadhwani, J.J.; Malamis, S.; Ochsenkühn-Petropoulou, M. Structural and chemical characterization of long-term reverse osmosis membrane fouling in a full scale desalination plant. Desalination 2012, 305, 44–53. [Google Scholar] [CrossRef]
  128. Beckhoff, B.; Kanngießer, B.; Langhoff, N.; Wedell, R.; Wolff, H. Handbook of Practical X-ray Fluorescence Analysis; Springer: Berlin/Heidelberg, Germany, 2006. [Google Scholar]
  129. Thygesen, O.; Hedegaard, M.A.B.; Zarebska, A.; Beleites, C.; Krafft, C. Membrane fouling from ammonia recovery analyzed by ATR-FTIR imaging. Vib. Spectrosc. 2014, 72, 119–123. [Google Scholar] [CrossRef]
  130. Tomaszewska, M.; Białończyk, L. Influence of proteins content in the feed on the course of membrane distillation. Desalin. Water Treat. 2013, 51, 2362–2367. [Google Scholar] [CrossRef]
  131. Nguyen, Q.-M.; Jeong, S.; Lee, S. Characteristics of membrane foulants at different degrees of SWRO brine concentration by membrane distillation. Desalination 2017, 409, 7–20. [Google Scholar] [CrossRef]
  132. Matthews, B.J.H.; Jones, A.C.; Theodorou, N.K.; Tudhope, A.W. Excitation-emission-matrix fluorescence spectroscopy applied to humic acid bands in coral reefs. Mar. Chem. 1996, 55, 317–332. [Google Scholar] [CrossRef]
  133. Huang, W.; Chu, H.; Dong, B.; Liu, J. Evaluation of different algogenic organic matters on the fouling of microfiltration membranes. Desalination 2014, 344, 329–338. [Google Scholar] [CrossRef]
  134. Messaud, F.A.; Sanderson, R.D.; Runyon, J.R.; Otte, T.; Pasch, H.; Williams, S.K.R. An overview on field-flow fractionation techniques and their applications in the separation and characterization of polymers—A review. Polym. Sci. 2009, 34, 351–368. [Google Scholar]
  135. Giddings, J.C. Field-flow fractionation: Analysis of macromolecular, colloidal, and particulate materials. Science 1993, 260, 1456–1465. [Google Scholar] [CrossRef] [PubMed]
  136. Lee, E.; Shon, H.K.; Cho, J. Biofouling characteristics using flow field-flow fractionation: Effect of bacteria and membrane properties. Bioresour. Technol. 2010, 101, 1487–1493. [Google Scholar] [CrossRef] [PubMed]
  137. Karakulski, K.; Gryta, M.; Sasim, M. Production of process water using integrated membrane processes. Chem. Pap. 2006, 60, 416–421. [Google Scholar] [CrossRef]
  138. Schäfer, A.; Fane, A.; Waite, T. Nanofiltration: Principles and Applications; Elsevier: Oxford, UK, 2005. [Google Scholar]
  139. Karakulski, K.; Gryta, M.; Morawski, A. Membrane processes used for potable water quality improvement. Desalination 2002, 145, 315–319. [Google Scholar] [CrossRef]
  140. Bailey, A.F.G.; Barbe, A.M.; Hogan, P.A.; Johnson, R.A.; Sheng, J. The effect of ultrafiltration on the subsequent concentration of grape juice by osmotic distillation. J. Membr. Sci. 2000, 164, 195–204. [Google Scholar] [CrossRef]
  141. Song, L.; Ma, Z.; Liao, X.; Kosaraju, P.B.; Irish, J.R.; Sirkar, K.K. Pilot plant studies of novel membrane sand devices for direct contact membrane distillation-based desalination. J. Membr. Sci. 2008, 323, 257–270. [Google Scholar] [CrossRef]
  142. Jansen, A.E.; Assink, J.W.; Hanemaaijer, J.H.; Medevoort, J.v.; Sonsbeek, E.v. Development and pilot testing of full-scale membrane distillation modules for deployment of waste heat. Desalination 2013, 323, 55–65. [Google Scholar] [CrossRef]
  143. Gryta, M.; Karakulski, K.; Tomaszewska, M.; Morawski, A. Treatment of effluents from the regeneration of ion exchangers using the MD process. Desalination 2005, 180, 173–180. [Google Scholar] [CrossRef]
  144. Gryta, M. Desalination of thermally softened water by membrane distillation process. Desalination 2010, 257, 30–35. [Google Scholar] [CrossRef]
  145. Wang, J.; Qua, D.; Tie, M.; Ren, H.; Peng, X.; Luan, Z. Effect of coagulation pretreatment on membrane distillation process for desalination of recirculating cooling water. Sep. Purif. Technol. 2008, 64, 108–115. [Google Scholar] [CrossRef]
  146. Kucera, J. Reverse Osmosis: Design, Processes, and Applications for Engineers; Wiley: New York, NY, USA, 2010. [Google Scholar]
  147. Prihasto, N.; Liu, Q.; Kim, S. Pre-treatment strategies for seawater desalination by reverse osmosis system. Desalination 2009, 249, 308–316. [Google Scholar] [CrossRef]
  148. Ketrane, R.; Saidant, R.; Gil, O.; Leleyter, L.; Baraud, F. Efficiency of five scale inhibitors on calciumcarbonate precipitation fromhardwater: Effect of temperature and concentration. Desalination 2009, 249, 1397–1404. [Google Scholar] [CrossRef]
  149. He, F.; Sirkar, K.K.; Gilron, J. Effects of antiscalants to mitigate membrane scaling by direct contact membrane distillation. J. Membr. Sci. 2009, 345, 53–58. [Google Scholar] [CrossRef]
  150. Franken, A.C.M.; Nolten, J.A.M.; Mulder, M.H.V.; Bargeman, D.; Smolders, C.A. Wetting criteria for the applicability of membrane distillation. J. Membr. Sci. 1987, 33, 315–328. [Google Scholar] [CrossRef]
  151. Al-Shammiri, M.; Safar, M.; Al-Dawas, M. Evaluation of Two Different Antisclant in Real Operation at the Doha. Res. Plant 2000, 128, 1–16. [Google Scholar]
  152. Razmjou, A.; Arifin, E.; Dong, G.; Mansouri, J.; Chen, V. Superhydrophobic modification of TiO2 nanocomposite PVDF membranes for applications in membrane distillation. J. Membr. Sci. 2012, 415–416, 850–863. [Google Scholar] [CrossRef]
  153. Xu, J.B.; Lange, S.; Bartley, J.P.; Johnson, R.A. Alginate-coated microporous PTFE membranes for use in the osmotic distillation of oily feeds. J. Membr. Sci. 2004, 240, 81–89. [Google Scholar] [CrossRef]
  154. Zuo, G.; Wang, R. Novel membrane surface modification to enhance anti-oil fouling property for membrane distillation application. J. Membr. Sci. 2013, 447, 26–35. [Google Scholar] [CrossRef]
  155. Zhang, J.; Song, Z.; Li, B.; Wang, Q.; Wang, S. Fabrication and characterization of superhydrophobic poly (vinylidene fluoride) membrane for direct contact membrane distillation. Desalination 2013, 324, 1–9. [Google Scholar] [CrossRef]
  156. Al-Amoudi, A.; Lovitt, R.W. Fouling strategies and the cleaning system of NF membranes and factors affecting cleaning efficiency. J. Membr. Sci. 2007, 303, 4–28. [Google Scholar] [CrossRef]
  157. Curcio, E.; Ji, X.; Di Profio, G.; Sulaiman, A.O.; Fontananova, E.; Drioli, E. Membrane distillation operated at high seawater concentration factors: Role of the membrane on CaCO3 scaling in presence of humic acid. J. Membr. Sci. 2010, 346, 263–269. [Google Scholar] [CrossRef]
  158. Krivorot, M.; Kushmaro, A.; Oren, Y.; Gilron, J. Factors affecting biofilm formation and biofouling in membrane distillation of seawater. J. Membr. Sci. 2011, 376, 15–24. [Google Scholar] [CrossRef]
Figure 1. Illustration of the adsorption–desorption mechanism for humic acid (HA) migration through a membrane pore. The process involves (a) adsorption of HA onto membrane surface; (b) hydrogen bonding between water and HA; (c,d) weakening of hydrogen bond as water vapor moves through the membrane; (e) re- adsorption of HA onto the membrane and (f) the pore wetting phenomenon.
Applsci 07 00334 g001
Figure 2. Cross sectional SEM images after the 4th week of seawater exposure for (a,b) PTFE membrane (with 0.2 μm pore size and PP nonwoven support, purchased from Thermoscientific) and (c,d) PVDF membrane (with 0.45 μm pore size and no support, purchased from Thermoscientific). Reproduced with permission from [41], Copyright Elsevier, 2013.
Applsci 07 00334 g002
Figure 3. SEM micrograph of the micro-organisms (nonfermenting gram-negative rods) in the deposit collected from the distillate tank walls. Reproduced with permission from [69], Copyright Elsevier, 2005.
Applsci 07 00334 g003
Figure 4. (a) Water droplet on clean flat sheet polypropylene (PP) membrane; (b) Water droplet on flat sheet PP membrane fouled by pig manure. Reproduced with permission from [58], Copyright Elsevier, 2014.
Applsci 07 00334 g004
Figure 5. 3D plots showing emissivity values of various locations on the fouled membranes at 1833 ppm feed concentrations of the synthetic feed water alongside SEM images and EDX analysis (a,b) aluminum; and (c,d) aluminum oxide. Comparison of images obtained by (e) IRT and (f) SEM. Adapted with permission from [115], Copyright Elsevier, 2015.
Applsci 07 00334 g005
Figure 6. Ultrasonic signal responses of the clean NF membrane (blue line) and differential signals (red line) obtained at 300 min of fouling operation with the feed solution of 1000 mg/L silica and 1000 mg/L NaCl under a constant pressure operation. Adapted with permission from [116], Copyright Elsevier, 2015.
Applsci 07 00334 g006
Figure 7. Zeta potential of polytetrafluoroethylene (PTFE) and PP membranes as a function of pH after adsorptive fouling. Reprinted with permission from [103], Copyright Elsevier, 2015.
Applsci 07 00334 g007
Figure 8. X-ray Diffraction (XRD) analysis of the deposit formed on the membrane surface. Broken line—without antiscalant, continuous line—with 10 ppm antiscalant. Feed solution prepared by dissolving NaHCO3 and CaCl2 (mole ratio 2:1) 3.1 mmol HCO3/dm3. Reprinted with permission from [46], Copyright Elsevier, 2012.
Applsci 07 00334 g008
Table 1. Published studies on membrane fouling in DCMD for different membrane materials and types (dp: pore size; ε: porosity; δ: thickness; Tf: Feed temperature; Tp: Permeate temperature; v: feed velocity (or φ: feed flow rate); Jp: Permeate flux; FDn: Normalized flux decline; F: Feed; P: Permeate).
Membrane Material and Typedp (µm)ε (%)δ (µm)Foulant(s)Tf/Tp
(°C)
v (m·s−1)Jp (kg·m−2·h−1)FDn (%)ObservationsRef.
PTFE Flat-sheet0.1-30Organic fouling: sludge and brown spots40–70/100.005–0.0141.41–9.2270% at 12g/L
50% at 6 g/L
The feed was from a thermophilic anaerobic membrane bioreactor. After cleaning using deionized (DI) water 15 mg/L of NaOH, the membrane could recover 96% of initial Jp.[36]
0.5-20Skim milk,
Whey proteins
54/50.0473Skim milk: 85%
Whey: 20%
Membrane wetting was not observed even after 20 h operation.[37]
0.28060Traditional Chinese medicine
(mostly inorganic salt, such as CaCO3)
60/250.07–0.1332.7830% at 1.5 g/LFouling layer can be effectively limited by increasing either the feed temperature or feed flow velocity.[38]
0.270–80179Humid Acid (HA)70/251.135.760%Seawater organic fouling was irreversible in DCMD. CaSO4 reduced the disaggregation of humic substances due to the binding effect.[39]
0.5-20Skim milk
Whey proteins
54/50.04722Skim milk: 79%
Whey: 11%
Whey proteins had weaker attractive interaction with the membrane and adhesion depended more on the presence of phosphorus near the membrane surface.[12]
0.270–80179HA, alginate acid (AA) and bovine serum albumin (BSA)50, 70/241.135HA: 56.2%
AA: 44.1%
BSA 64.5%
Feed concentration: 10 mg·C·L−1.[40]
0.26541NaCl, MgSiO3,
MgCO3 CaCO3
30–50/240.32~28, at ΔT = 15 °C28%The PTFE membrane surfaces showed some salt scaling and a larger population of crystals.[41]
PVDF Flat-sheet0.280197~5, at ΔT = 15 °C32%PVDF membranes showed a smaller population of salt crystals on their surface.
0.4560127~32, at ΔT = 15 °C20%The salt crystals formed were larger than the pore size of the membranes.
0.220.75125HA50, 70/200.2330.6 to 35.15%The addition of divalent cations (Ca2+) affected to permeate flux by forming complexes with HA.[42]
PVDF Hollow fiber0.1690.8200CaSO4 (RO brine)55–77/350.0112.5–5.830%Membrane wetting was more significant at high feed temperatures. Salts promoted membrane pore wetting.[43]
0.08883.7126Rubber wastewater55.5/20.0-7.1979%Permeate flux decline was due to the presence of complex components (e.g., latex and protein in the rubber effluent).[44]
PP Flat-sheet0.165–70100CaCO3, CaSO4, silica60/20φ: 0.6/0.5 L·min−130Feed A: 93%
Feed B: 27%
Membrane scaling caused a drop of permeate flux and a decrease in salt rejection. Feed A: NaHCO3 + Na2SO4, + CaCl2; Feed B: Na2SiO3·9H2O.[45]
PP Hollow fiber0.2273400CaCO385, 90/20F: 0.15–0.63
P: 0.12
25–38.740% without antiscalant
20% with antiscalant
0% Rising with HCl
The application of antiscalant minimized the penetration of salts into the pores. A high permeate flux was maintained over 260 h of operation using periodical rinsing with HCl solution[46]
0.1
0.2
0.6
50
60–80
150
50
52.5
CaCO3 and CaCO3–CaSO470–75–80/20φ: 0.084–0.688–1.438 L·min−1Uncoated: 14.3–4.8
Coated: 5.5
11%Fluorosilicone coating was proven to be helpful to eliminate membrane scaling. The scaling problem was successfully solved by HCl acidification prior to MD[35]
PP Capillary0.2273400CaCO360–80/50F: 0.42–0.96
P: 0.29
27.9–22.910%Reduction of the number and dimensions of the pores on the membranes surfaces. Large pores were wetted because of CaCO3 depostion inside the pores. Flow rate of distillate was constant.[47]
0.2273400Protein and NaCl
(50 g/L)
85/20φ: 0.84 L·min−112.525% NaCl up to saturation
0% Boiling feed
The feed solution was NaCl solution containing natural organic matter. Pre-treatment method of the feed does not result in the complete removal of the foulants.[48]
0.2273400Mainly CaCO380, 90/20F: 0.3–1.4
P: 0.29
30.8
(Tf = 80 °C)
41% at 0.31 m/s
12% at 1.4 m/s
The application of tap water as a feed caused a rapid decline of permeate flux due to the deposition of CaCO3.[49]
0.2272200NaCl70-85/20φ: 0.42 L·min−127.519% at 1 year
28% at 9 years
Chemical reaction of salt with the hydroxyl and carbonyl groups found on the PP surface. Degradation time dependence.[50]
Table 2. Published studies on membrane fouling in AGMDVMD for different membrane materials and types (dp: pore size; ε: porosity; δ: thickness; Tf: Feed temperature; Tp: Permeate temperature; v: feed velocity (or φ: feed flow rate); Jp: Permeate flux; FDn: Normalized flux decline; F: Feed; C: Cooling; pv: Vacuum or low pressure) [51,52,53,54,55,56,57,58,59].
MD Config.Membrane Material and Typedp (µm)ε (%)δ (µm)FoulantTf/Tp (°C)
pv (kPa)
v (m·s−1)Jp (kg·m−2·h−1)FDn (%)ObservationsRef.
AGMDPTFE Flat-sheet10.85150Salts deposition77/12φ: F: 58 g/s
C: 75 g/s
119-Feed: tap water.[51]
0.2-175NaCl, MgCl2,
Na2CO3, Na2SO4
50/10φ: F: 1.5
L·min−1
NaCl: 1.02
Na2SO4: 0.38
Na2CO3: 0.12
0% after 5 hThe permeate flux declined as the concentration of salt increased, and increased as the pore size increased.[1]
0.45-175NaCl, MgCl2,
Na2CO3, Na2SO4
50/10φ: F: 1.5
L·min−1
NaCl: 1.45
Na2SO4: 0.56
Na2CO3: 0.19
0% after 5 h
VMD0.2240175CaCO3, CaSO4
organic matter
25–75
pv: 0.1–10
0.4-2.09.3–8.324%Synthetic RO brine feed,
Salt concentration: 300 g·L−1.
[53]
0.2-50Ginseng aqueous solution (polysaccharide, amino acid & biomacromolecule)60
pv: 83–89.5
0.74 to 0.4624.7 to 21.6From 0% to 27%The results showed the existence of critical fouling operating conditions in VMD process.[54]
PVDF Hollow fiber0.2579150CaCO352–68
pv: 96
0.148.96–21
(13.43–25 with microwave)
-Microwave irradiation increased the deposition of calcium carbonate.[55]
0.1682–85-Mainly hardness and organic matter70
pv: 8.5
1--The permeate flux was 30% higher when using pretreatment.[56]
PP Shell and tube0.2-1500Dye and Nacl40–70
pv: 0.667
0.84 to 3.428.295%The flux was dependent strongly on the feed temperature but was independent of salt concentration.[57]
PP Flat-sheet0.2--Inorganic elements: O, S, Fe, Na, Mg, K. Microorganisms and proteins,40 °Cφ: F: 4 L·min−1
Strip flow rate: 3 L·min−1
4295%The fouling layer thickness was estimated to 10–15 µm and it becomes severe as the membrane surface changes from hydrophobic to hydrophilic.[58]
PP Capillary0.245510Dye40, 50, 60
pv: 1.0
0.78–1.6727.5–35–57.0, respectively27%The flux decrease probably due to an interaction with the polymeric membrane.[59]
Table 3. Published studies on membrane fouling in OD and OMD for different membrane materials and types (dp: pore size; ε: porosity; δ: thickness; Tf: Feed temperature; Tp: Permeate temperature; v: feed velocity (or φ: feed flow rate); Jp: Permeate flux; FDn: Normalized flux decline) [4,81,82,83,84,85,86].
OD/OMDMembrane Material and Typedp (µm)Ε (%)δ (µm)Foulant (s)Tf/Tp (°C)v (m·s−1)Jp (kg·m−2·h−1)FDn (%)ObservationsRef.
ODPTFE Flat-sheet0.2
0.45
1
80178Phenolic compounds from crude olive mill wastewater30500 rpm2.64–2.23
3.01–2.64
3.86–2.85
15%
13%
26%
The decrease of the permeate flux with time is more obvious for the membrane which pore size of 1 µm.[81]
0.2788.5Tomato puree20–24φ: 0.5 L·min−11.25 for 6 wt %
0.7 for 21.5 wt %
-Tomatoes are composed of 95% water, 3–4% carbohydrate, 0.51% protein and 0.1–0.3% fat.[82]
0.2
0.45
1.2
--Phenolic content of red grape juice35-8–484%Initial juice concentration 5 °Brix.
Initial concentration of stripping solution 50 wt % CaCl2.
[83]
PVDF Hollow fiber0.275125Glucose25, 35, 450.4; 0.6; 0.81.67 to 4.73
Concentration factor: From 30 to 40 °Brix
-Feed concentration and brine velocity have significant effect on OD permeate flux (while the brine concentration was remained constant)
Their effects depend on the range of the feed concentration.
[4]
0.264170Glucose25, 35, 450.2; 0.4; 0.51.00 to 2.87
Concentration factor: From 45 to 60 °Brix
-
PP0.2-125Apple juice23–33φ: 10 L·min−1From 2.25 to 0.971%OD can be almost free from fouling due to the hydrophobic OD membrane.
Few substances (e.g., fat and wax) may stick to the membrane surface.
[84]
OMDPTFE Flat-sheet0.280178Phenolic compounds from crude olive mill wastewater40/20500 rpmFrom 3.9 to 1.313.5%Membrane fouling is of less importance when using OMD by PTFE membranes.[81]
PP Hollow fiber0.044040Crystals formed from Na2CO340/20φ: 1.4, 0.6, 0.45 L·min−1From 0.12 to 0.07830%Membrane scaling was observed is due of the accumulation of crystals on the membrane surface.[86]
Table 4. Pretreatments considered in MD and OD processes.
PretreatmentMD/OD Set UpFeed SolutionSpecies AddressedObservationRef.
UF, NF, RODCMDSurface water (lake)Organic compounds, suspended solids, colloids
-
UF reduced the silt density index from 8 to 2.
-
NF removed dissolved organic carbon and the rejection of hardness between 60% and 87%.
-
The rejection of TDS obtained in the RO system was at a level of 99.7%.
[139]
MFDCMDHot brine
City water
contaning salt
(3.5, 6 or 10%) or Seawater
Organic compounds, Colloids and bacteriaHydrophobicity of the outside membrane surface was reduced.
Very limited flux reduction at salts concentration up to 19.5% from seawater.
[141]
UFODGrape juiceFermentable sugars and proteinsIncreased flux during subsequent concentration of the permeate by OD and wetting reduction because of increase in juice surface tension.[140]
MF followed by degassingLGMDPolluted seawaterSalts, oil, silt, sludge and unknown organic compoundsDistillate with high quality and salt separation factors well above 10.000 have been obtained.[142]
pH contol using HCl at pH = 4.1DCMDTap water, CaCO3 and mixed CaCO3/CaSO4 solutionsHardness CaCO3/CaSO4Quite stable vapor flux during the experiment time (7 h).[35]
Lime precipitation by Ca(OH)2, sedimentation and filtrationDCMDWastewaterCaSO4 and silicon compoundThe fouling was significantly diminished.[143]
Coagulation/flocculation and MFDCMDOMWSolids and organic compounds (Phenolic compounds, Sugar and Proteins)MF pre-treatment improved significantly the DCMD permeate flux compared to coagulation/flocculation pre-treatment.[85]
Thermal softening followed by filtrationDCMDTap/ground/lake waterHardness (bicarbonate)HCO3 ions was lowered 2–3 times by keeping water at the boiling point for 15 min.[144]
Sedimentation and UF
Boiling and MF
DCMDBilge water/saline wastewaterHardness, organic compounds and proteinsSedimentation and UF showed a significant flux decline. But boiling and MF pretreatment avoided the rapid flux decline.[33]
Coagulation, filtration, acidification and degasificationDCMDRecirculating Cooling Waterorganic matter (NOM), total phosphorus (TP) and suspended substance (SS)About 23% of improvement of flux was obtained by using coagulation pretreatment after 30 days of operation.[145]
UF with coagulationVMDRO-concentrated wastewater from steel plantMainly hardness and Organic matterThe flux was 30% higher when the pretreatment was used and the CODcr removal reached 40%.[56]

