1. Introduction
Because of more economic objectives for operation, power grids are being operated around their stability limits nowadays. Cascading events, such as failures because of the protection system and human errors, can lead to catastrophic blackouts, as revealed by the 14 August 2003 blackout [
1]. In general, splitting the system into controlled islands is considered as the last resort against a blackout after large disturbances [
2]. A suitable under frequency load shedding (UFLS) scheme is the key to preventing frequency collapse in small receiving-end power systems [
3,
4,
5].
The concept and model of UFLS schemes for isolated power systems are simple and well known, but it must be robust to prevent frequency collapse against many possible disturbances in the isolated power system. Due to the introduction of electricity markets and to the increasing integration of converter-connected renewable generation [
6,
7] (e.g., doubly-fed induction generator, DFIG), permanent magnet synchronous generators (PMSG), and photovoltaic (PV)), the power system dynamic frequency responses have recently undergone significant changes. The performance of the UFLS schemes, which are designed based on experience, cannot be necessarily guaranteed in the modern power system. So, several optimization methods have been extensively investigated to design UFLS schemes [
3,
8,
9,
10,
11,
12,
13]. To minimize the amount of shed load, both traditional optimization methods and the evolutionary algorithms have been employed to determine the UFLS relay parameters, i.e., frequency thresholds, step sizes, and time delay. The deterministic optimization algorithms, such as the quasi-Newton method [
3], sequential quadratic programming (SQP) [
9], and the mixed-integer linear program (MILP) [
10] were applied to designing UFLS schemes as effective approaches. Heuristic methods were also given credit for optimizing UFLS relay parameters. The genetic algorithm (GA) [
11] and simulated annealing (SA) [
12] were developed for setting UFLS relay parameters successfully.
The design methods for UFLS schemes reported in the literature were almost established on the system frequency response (SFR) model, which was first proposed in [
13]. Higher adaptability of the model was advanced by reducing the SFR model to a simplified equivalent SFR model expressed by [
14]. Consequently, the performances of the optimized UFLS scheme mainly depends on the precision of the parameters of the SFR model or simplified SFR model except for optimizing strategies. Bogovic et al. used the probability-based approach to analyze the control performance of a traditional UFLS strategy in [
15], which is of great significance for promoting the application of traditional UFLS. At the same time, with the rapid development of the modern power system, the complexity of the power system dynamic rose sharply, and the parameters derived by using the conventional static equivalence method were hard to meet the requirements of controlling the scheme design. In recent years, wide area measurement system (WAMS) based adaptive UFLS strategies have been proposed [
16]. In particular, Rudez and Mihalic’s research [
17,
18] on WAMS-based UFLS have made important contributions. However, due to the limited numbers of the Phasor Measurement Unit (PMU), the traditional UFLS is still the most widely used in practical engineering at the present stage.
Therefore, this paper describes the development of a parameter identifying strategy based on particle swarm optimization (PSO) [
19,
20] technology. Then, a model for the design of a robust and high-performance UFLS scheme is proposed based on the simplified SFR model with the identified parameters. In order to achieve the efficiency of the UFLS scheme, the PSO algorithm is also applied to optimize the UFLS relay parameters by capturing the trade-off between minimizing the frequency deviation and the amount of the total load needed to be shed.
PSO is a heuristic algorithm with good properties, and it has been widely applied to solve complex optimization problems in power systems, i.e., stability control, operation, and planning [
21,
22]. The results based on the time domain simulation with the full-scale power system are presented to demonstrate the precision of the simplified SFR model with the identified parameters and the effectiveness of the proposed optimizing strategies for UFLS scheme design.
Section 2 describes the system model and the proposed formulation used to represent the dynamic frequency response of the power system. The parameter identification strategy for the simplified SFR and UFLS designing models are presented in
Section 3. In
Section 3.4, the optimized models based on PSO are described. The simulation and results are given in
Section 4. Finally, conclusions are offered in
Section 5.
2. System Model and Formulation
2.1. Typical System Frequency Response Model
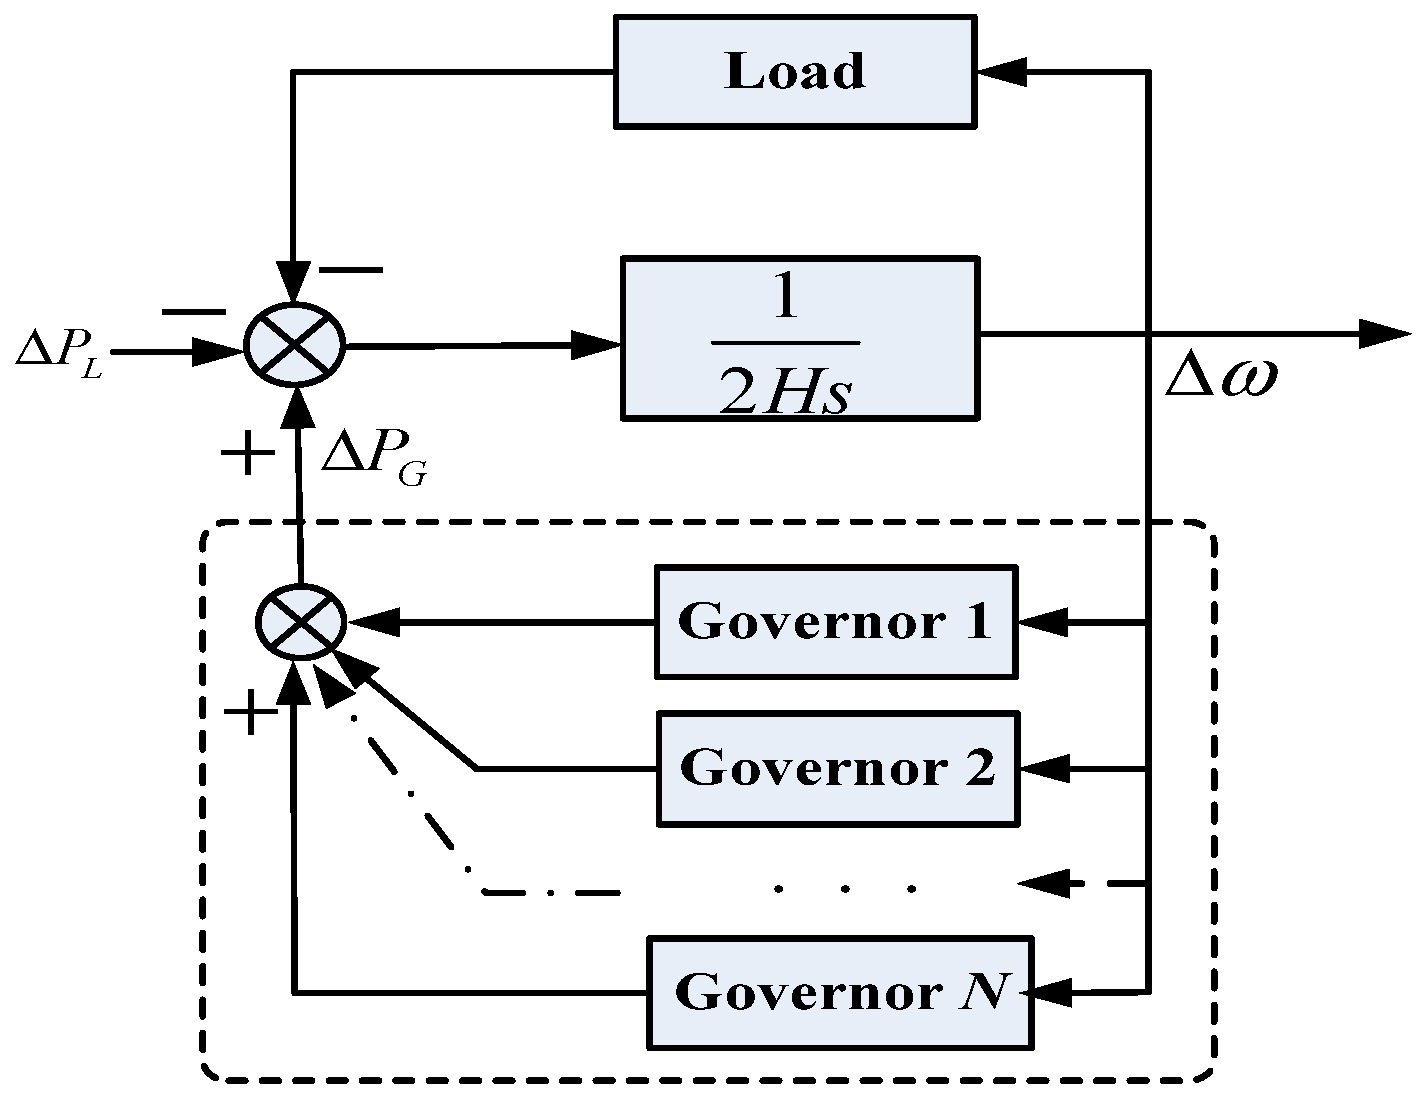
Figure 1 shows the classical model developed to represent the dynamic frequency response of the power system. The Governor
i represents the model of the speed governor-prime mover of machine
i. Δ
ω is frequency deviation, Δ
PL is increment of load power, Δ
PG is total output of governors, and
H is the equivalent inertia. The Load represents the frequency dependent model of load.
In this general model, the response of the governors-prime movers and the dynamic characteristic of loads are taken into account. The inter machine oscillation is neglected, so the frequency is assumed to be uniform throughout the system. The overall frequency response of the loads is modeled using a single frequency dependent model because of their frequency dependency.
2.2. Complex Speed Governor-Prime Mover Model
In the published literature, dynamic models have been widely developed and used to adequately depict the behavior of the speed governor-prime movers. Dynamic models of steam turbines are detailed in [
23,
24] and provide the models of hydraulic turbines. Models of gas turbines are presented in [
25]. Other speed governor-prime mover models are also described in [
26,
27].
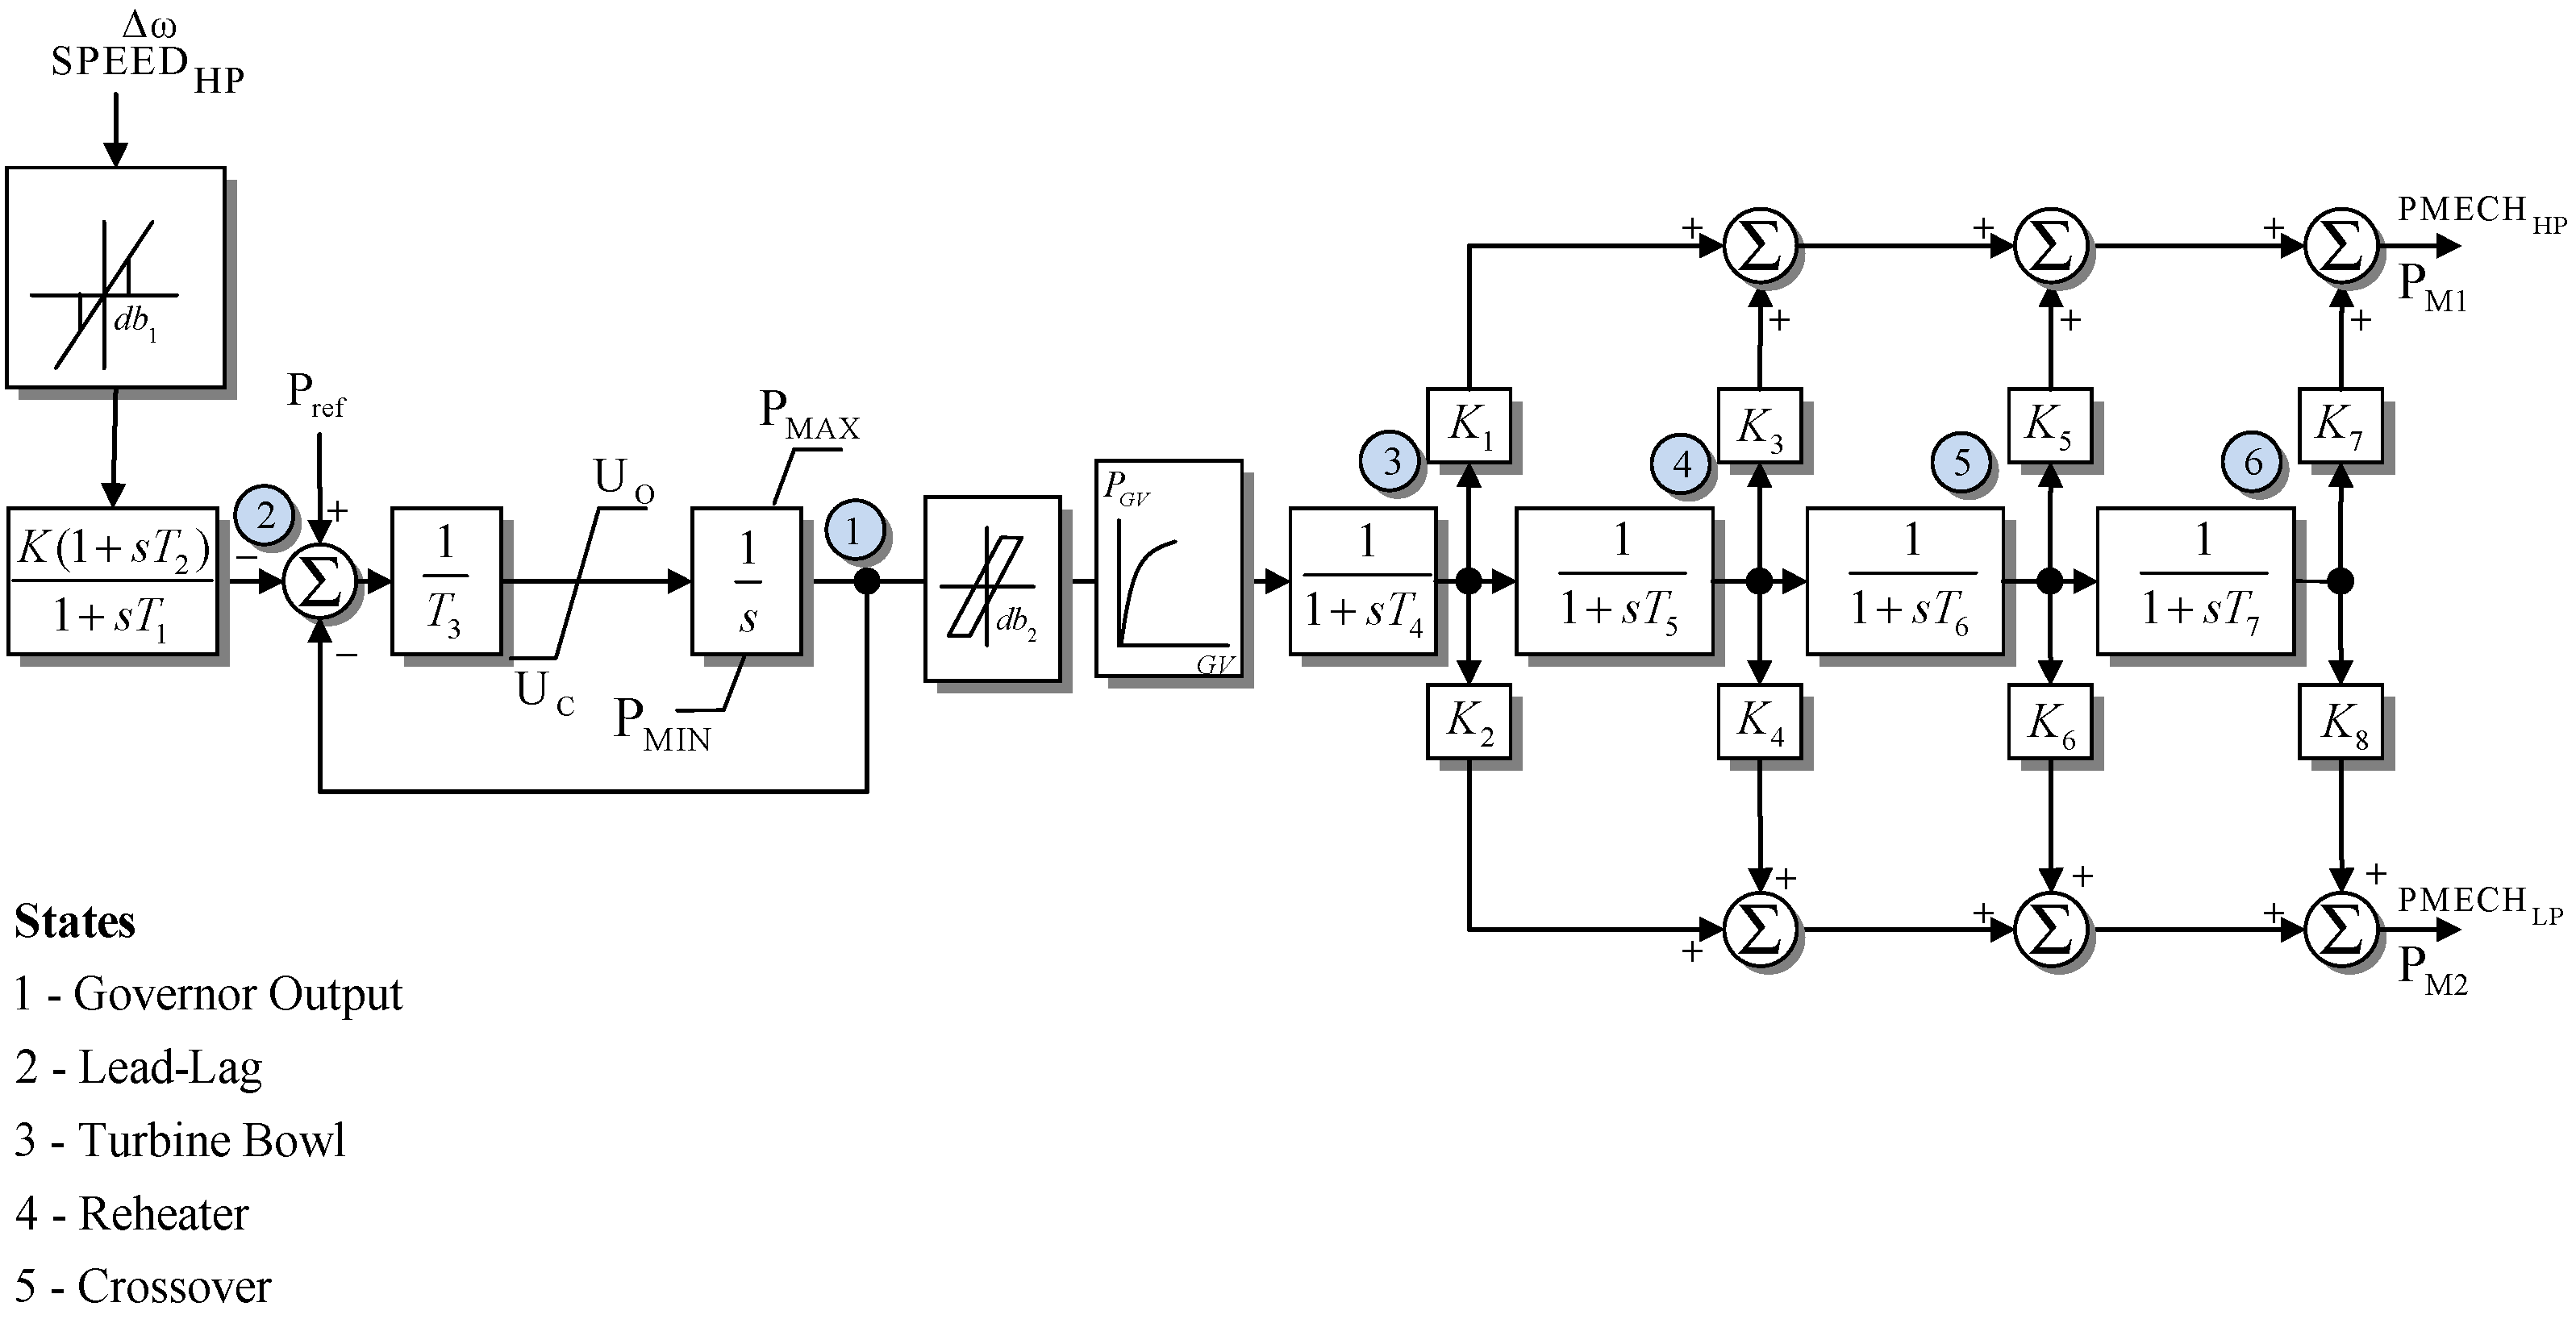
Figure 2,
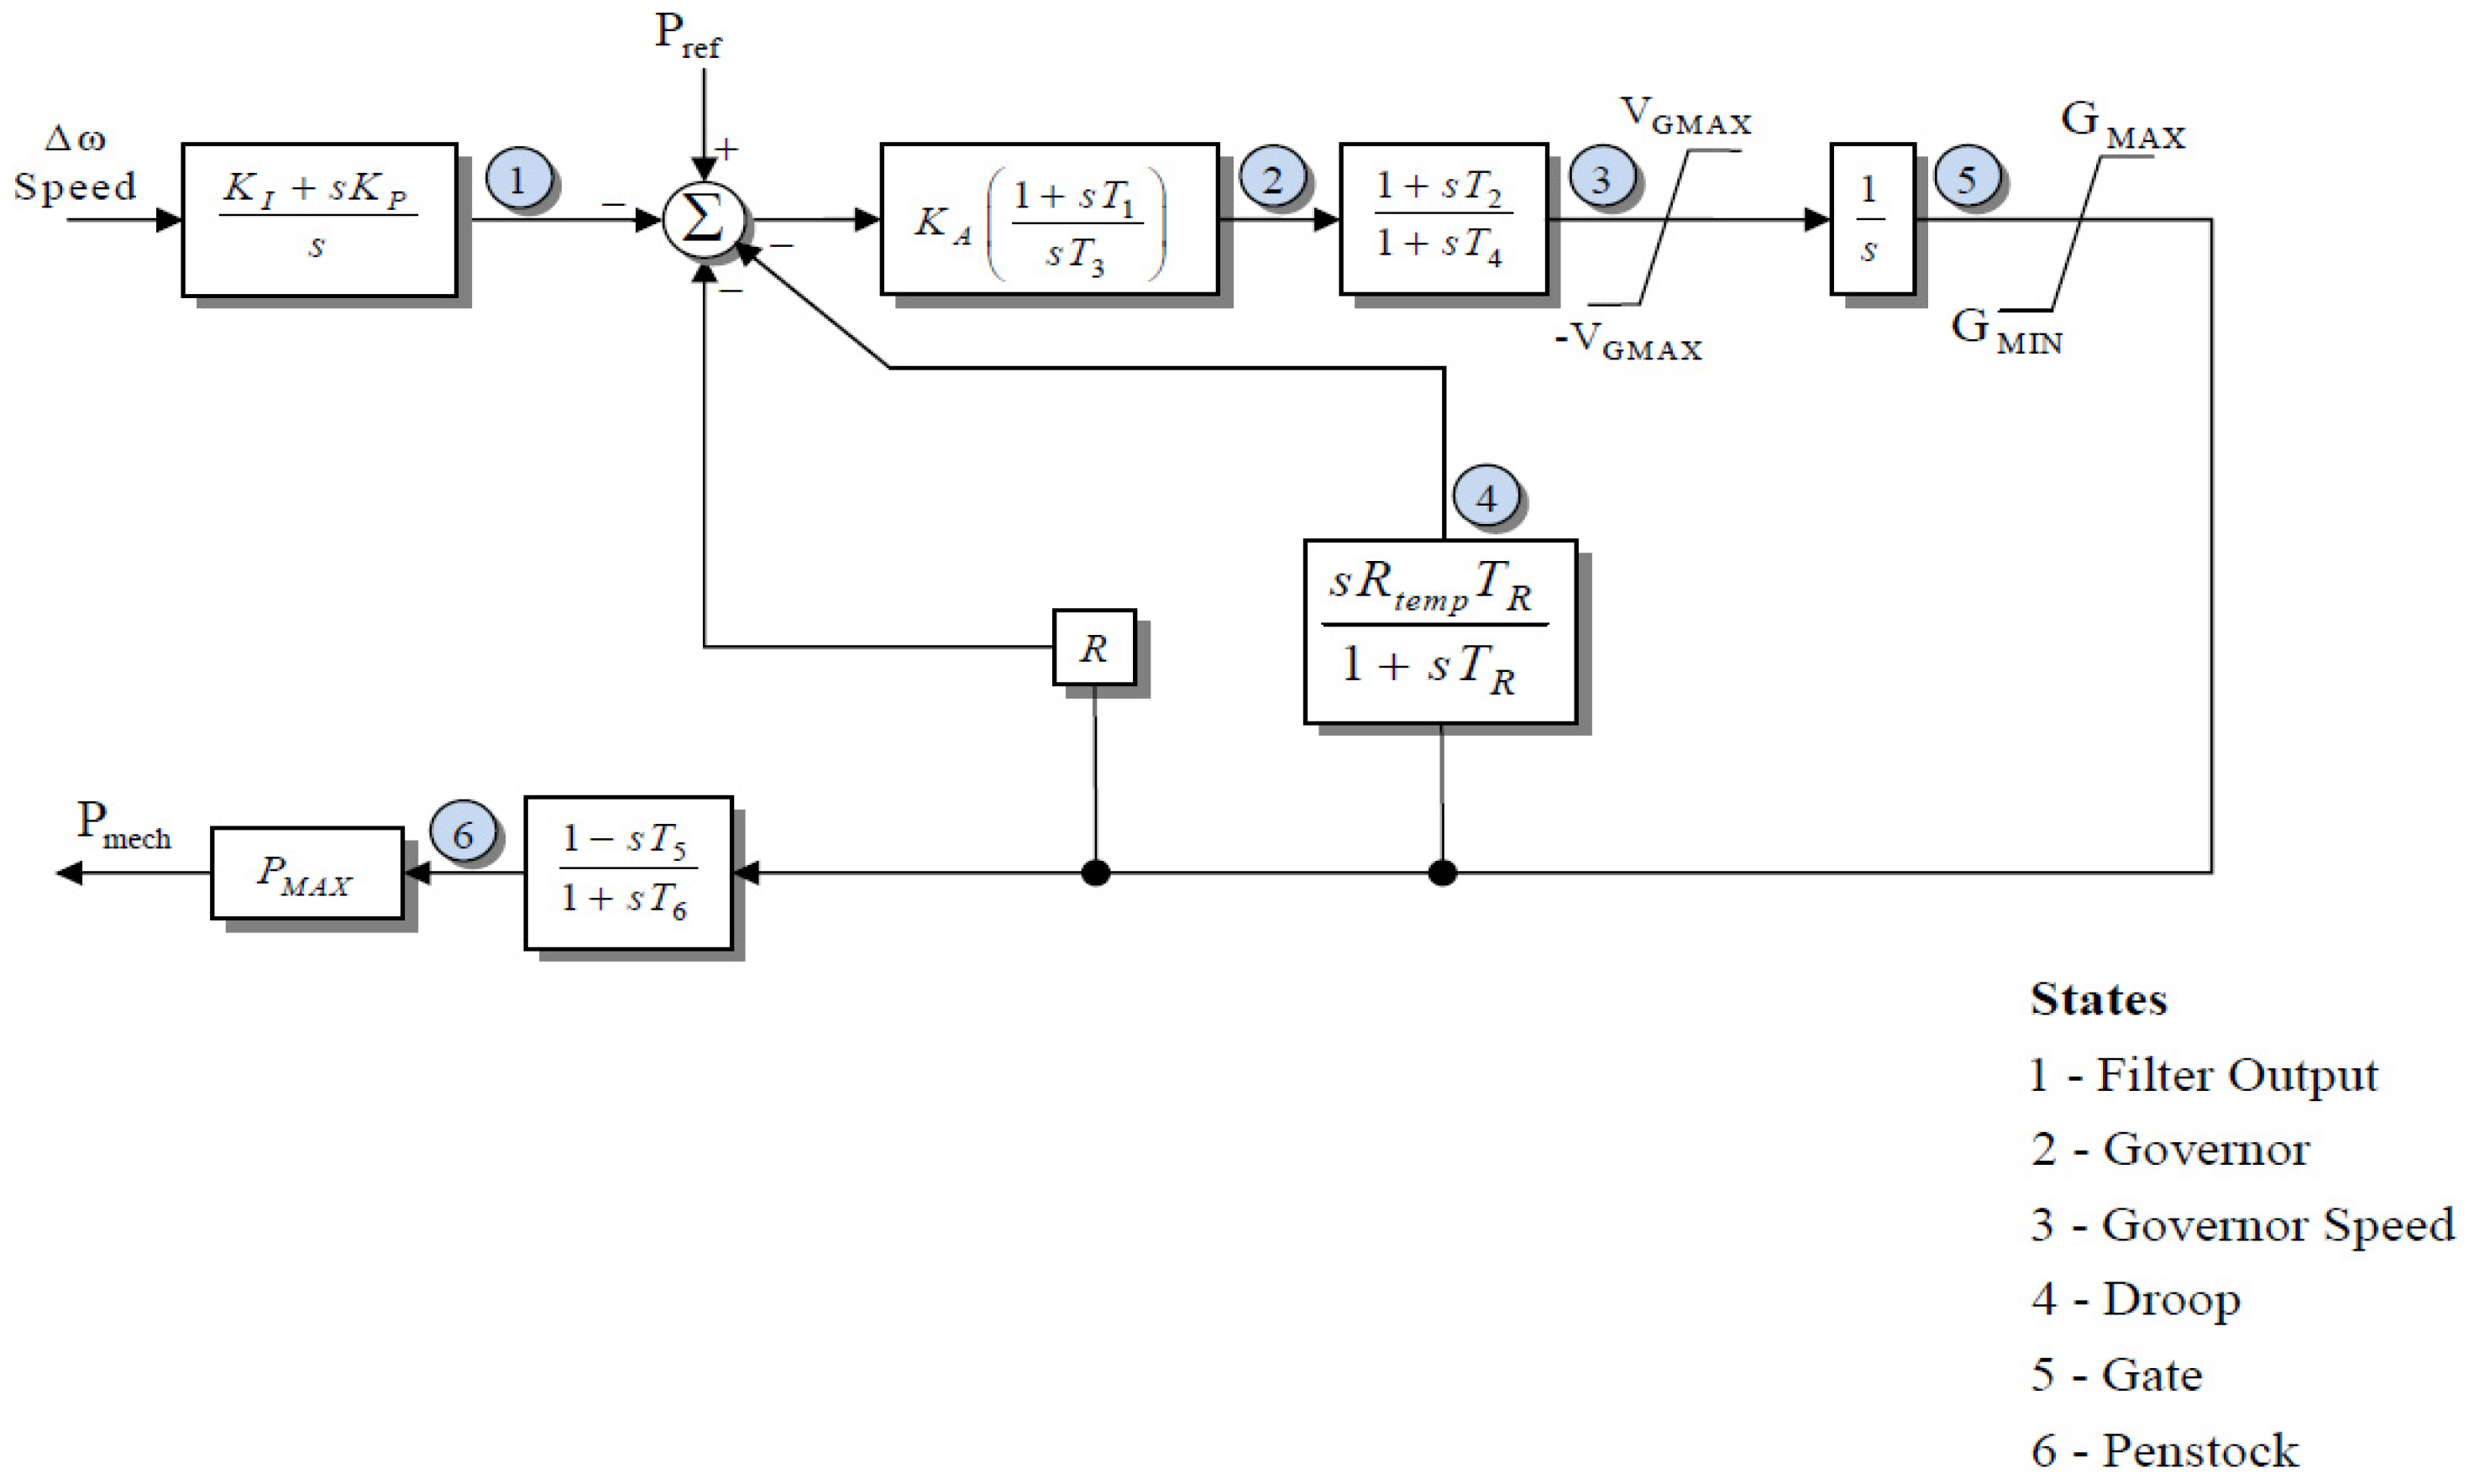
Figure 3 and
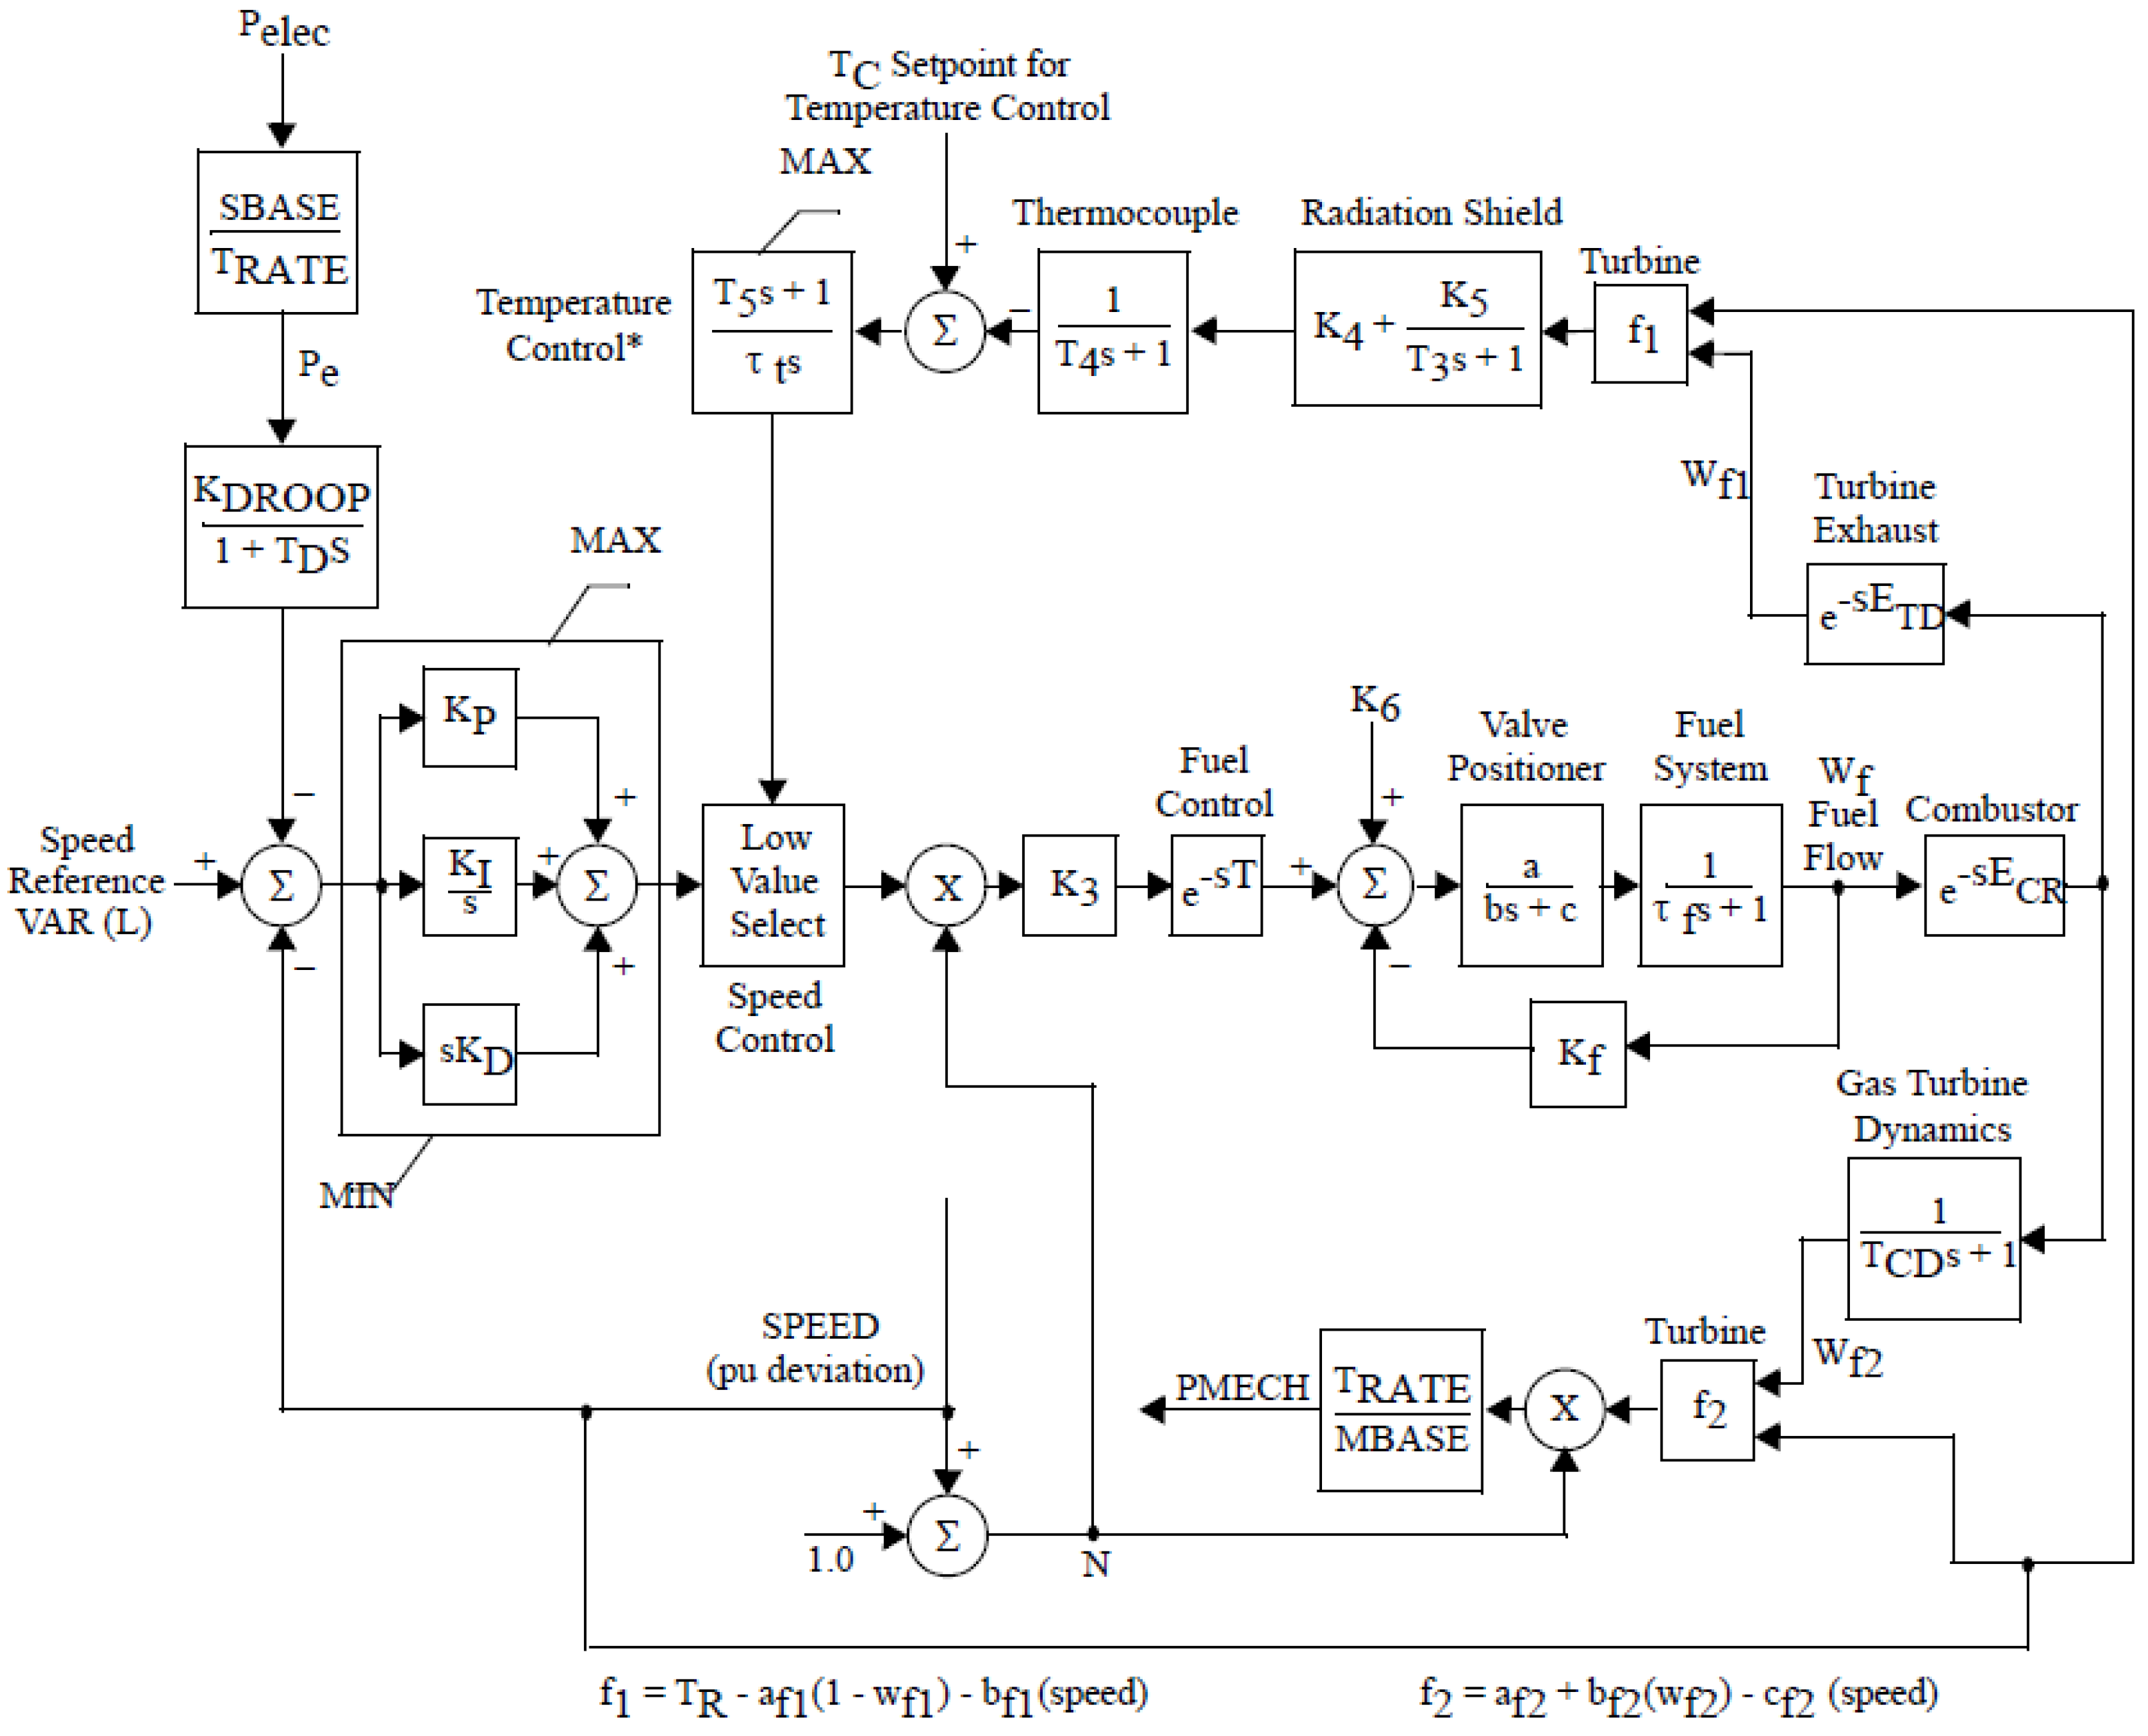
Figure 4 show the typical models of speed governor-prime movers, respectively: the Institute of Electrical and Electronics Engineers (IEEE) general model for a steam turbine governing system in
Figure 2, a typical hydraulic turbine model in
Figure 3, and a classical gas turbine model in
Figure 4.
2.3. Complex Load Model
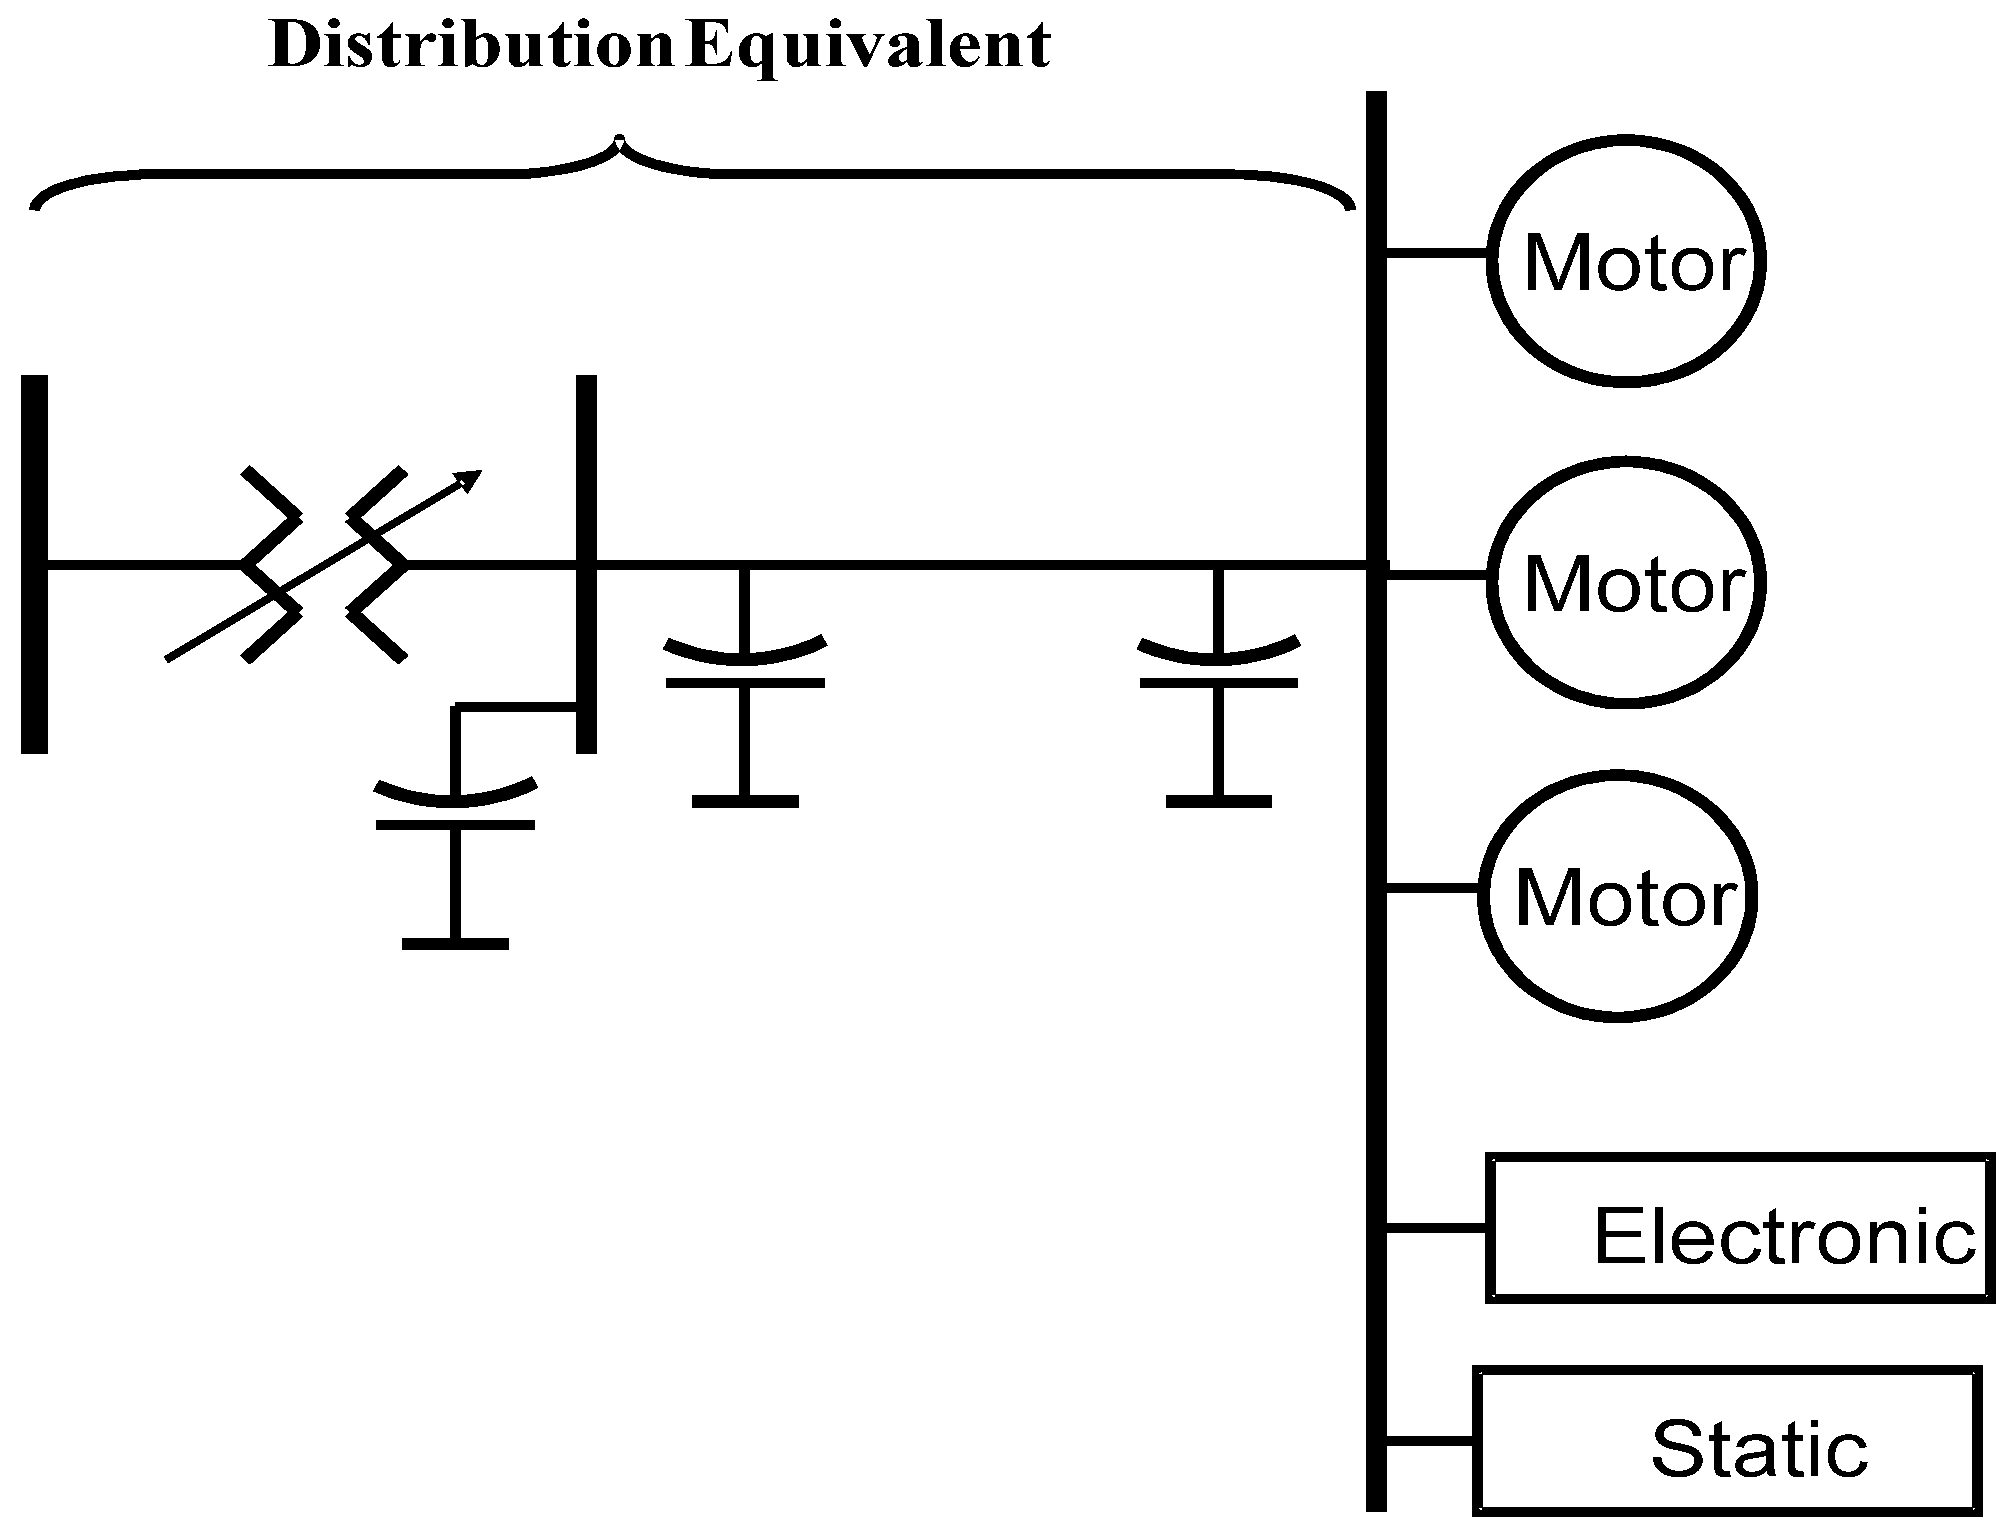
At present, many load models, such as the constant power model, constant current model, and constant impedance model, are used in power load flow, transient stability studies, and system control. An excellent formulation can predict the system performance more accurately.
Figure 5 shows the composite load model proposed by the Western Electricity Coordinating Council (WECC) [
28].
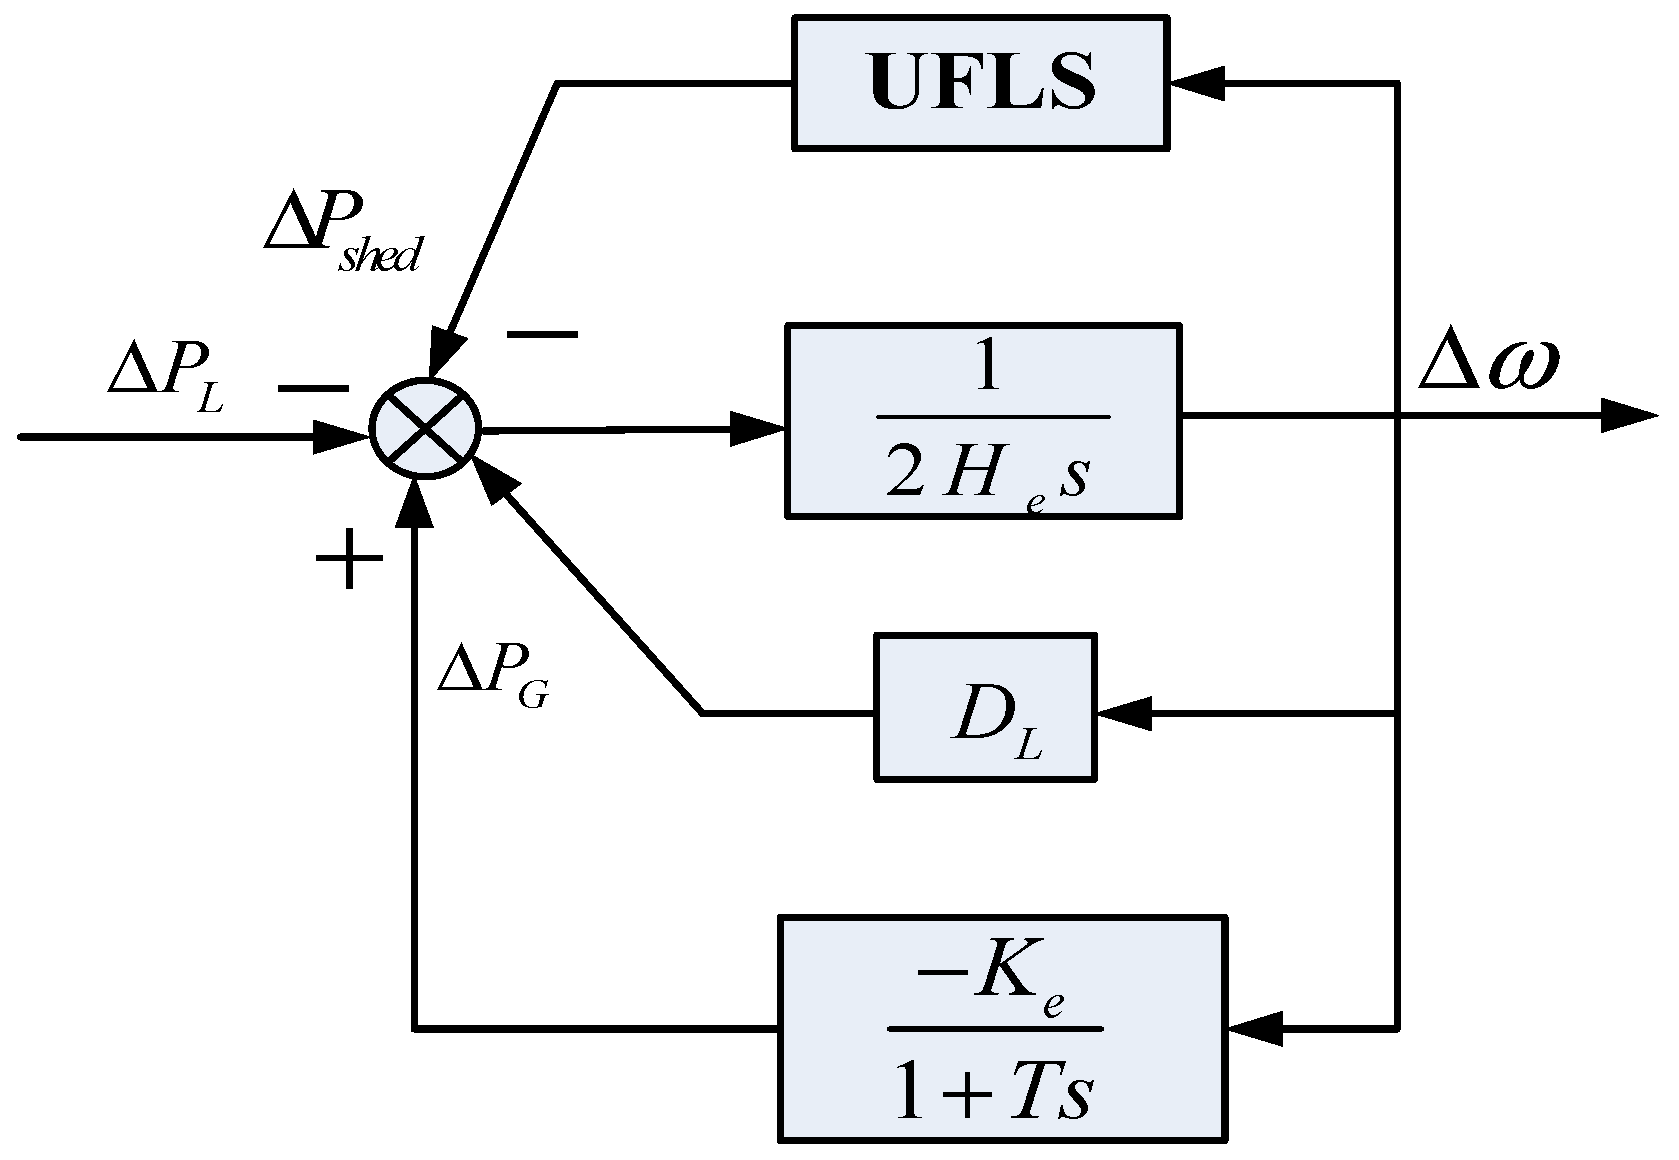
2.4. Simplified System Frequency Response Model Incorporating UFLS
As mentioned before, the dynamic model used to adequately predict the behaviors of a power system are usually very complex, which makes it difficult to obtain a simple analytical model regarding the response of the system frequency and to design the UFLS schemes. In the presented literature, the full scale model is commonly reduced to a simplified equivalent single-machine model in the analysis of the system dynamic frequency behaviors and the UFLS scheme design. This assumption can be accepted for small receiving-end power systems after islanding.
The simplified SFR model incorporating UFLS schemes for a small power system is shown in
Figure 6. The simplified SFR model is a single-mass model. The inertias of the different machines are joined in one equivalent inertia. The overall characteristics of the loads due to their frequency dependency is modeled by a single damping factor
DL, which is the system load frequency damping factor. Governors and prime movers are demonstrated by a short-term first-order model approximation. Generally, the equivalent inertia
He and the equivalent gain
Ke of the simplified SFR model can be calculated from the individual generator and governor-prime mover as:
where
Hi is the inertia constant of the
ith generator with a power base
Si and
Ki is the gain of the
ith governor-prime mover with a power base
Si.
S is the system power base.
T is the equivalent time constant of the governor-prime mover and ΔPshed is the amount of load shedding. However, DL and T are obtained with difficultly because of the variety of load dynamic behaviors and the different governors-prime movers installed in the different generators. The model and method used to extract the accurate parameters of the simplified SFR model will be proposed in the next section.
3. Models for Parameters’ Identification and UFLS Schemes’ Optimization
3.1. A Review of Particle Swarm Optimization (PSO)
The PSO algorithm was developed by Kennedy and Eberhart in 1995 [
19]. PSO is defined as an Evolutionary Computation (EC) method that searches the space to determine the optimal solution for an objective function [
20]. The PSO algorithm evaluates itself based on the travels of each particle as well as the swarm cooperation. Each particle starts to traverse randomly accordingly to its own best knowledge and the swarm’s experience. The basic regulation of PSO method can be explained by the following:
- (1)
Evaluating the objective value of each particle;
- (2)
Updating the local and global best objective and positions;
- (3)
Updating the velocity and the position of each particle.
For each iteration, the velocity vector of the
ith particle is updated based on the following Equation:
In Equation (3), w is the inertia weight factor, is the previous velocity of the particle, is the present velocity of the particle, c1 and c2 are weighting acceleration constants, is the best position that a particle of the group has achieved up to now, is the best position that the whole group has achieved up to now, and r1 and r2 are random parameters ranging from [0,1] , with values produced for each particle in each iteration.
After updating the velocity of the
ith particle, the particle moves toward its new position from its present position by:
Figure 7 illustrates the search processes of the PSO utilizing the modified velocity and position of the individual based on Equations (3) and (4).
3.2. Parameter Identification Strategy for Simplified SFR
It is well known that accurate parameters are necessary for the design of the protection scheme and parameter identification techniques based on measurements have become mature after many years of development. Accordingly, the parameter identification method for the simplified SFR model is proposed in this section.
For a model with unknown parameters but a known model structure, the parameter identification problem can be regarded as an optimization in which the model output is compared with the actual output. In order to evaluate the parameters to be identified, the actual output is compared with the model output. Generally, the objective function can be defined as a weighted quadratic function:
where
g(.) denotes the objective function,
W is a positive definitive weight matrix,
y is the model output,
ys is the actual output,
x is the vector of unknown parameters to be identified and
m is the number of recorded data sets.
In the proposed method, the objective function developed as a measure of how the simplified SFR model output satisfies the measurement of the full scale power system output. Then the parameter identification method for the simplified SFR model is formulated as an optimization model:
The objective function (6) is built with the system frequency response at the center of inertia (COI) [
29], and
x = [
H D K T]
T are the four unknown parameters to be identified,
and
are the system frequency response at the COI of the full scale system output and that of the simplified SFR model output, respectively, and
n is the number of sampled data.
So far, the parameter identification problem for the simplified SFR model has been transformed into an optimization model.
3.3. Optimal UFLS Scheme Design
Since the UFLS schemes are desired to be robust and efficient, a quantitative set of design criteria and quantitative performance criteria are considered, shown in the following [
9]:
Number of load shedding stages, kmin ≤ k ≤ kmax;
Limits on frequency thresholds, fth_min ≤ ≤ fth_max;
Range of load shedding sizes for each stage, Δdmin ≤ Δdj ≤ Δdmax;
Range of time delay for each stage, td_min ≤ ≤ td_max;
Margin between two consecutive UFLS threshold frequencies, − ≥ fε;
Minimum steady state frequency, fss ≥ fss_min;
Minimum transient frequency, ≥ fts_min;
Maximum transient frequency, ≤ fts_max;
Thus, the design of the UFLS can be configured into a framework optimization in which the objective function captures the trade-off between the frequency deviations and the amount of the total load shed. Then the optimization model for the robust UFLS scheme design can be described as follows:
The trade-off between minimizing the frequency deviation and the amount of the total load needed to be shed is captured in the developed objective function, shown as Equation (4). Ce and Cls are the constant cost coefficient of system energy and load shed, respectively.
As stated in the above description, the design of UFLS schemes can be defined as a standard nonlinear constrained optimization model. The PSO algorithm is applied to solve the optimization problem using Equations (4)–(7).
3.4. Solving the Proposed Optimization Model Using PSO
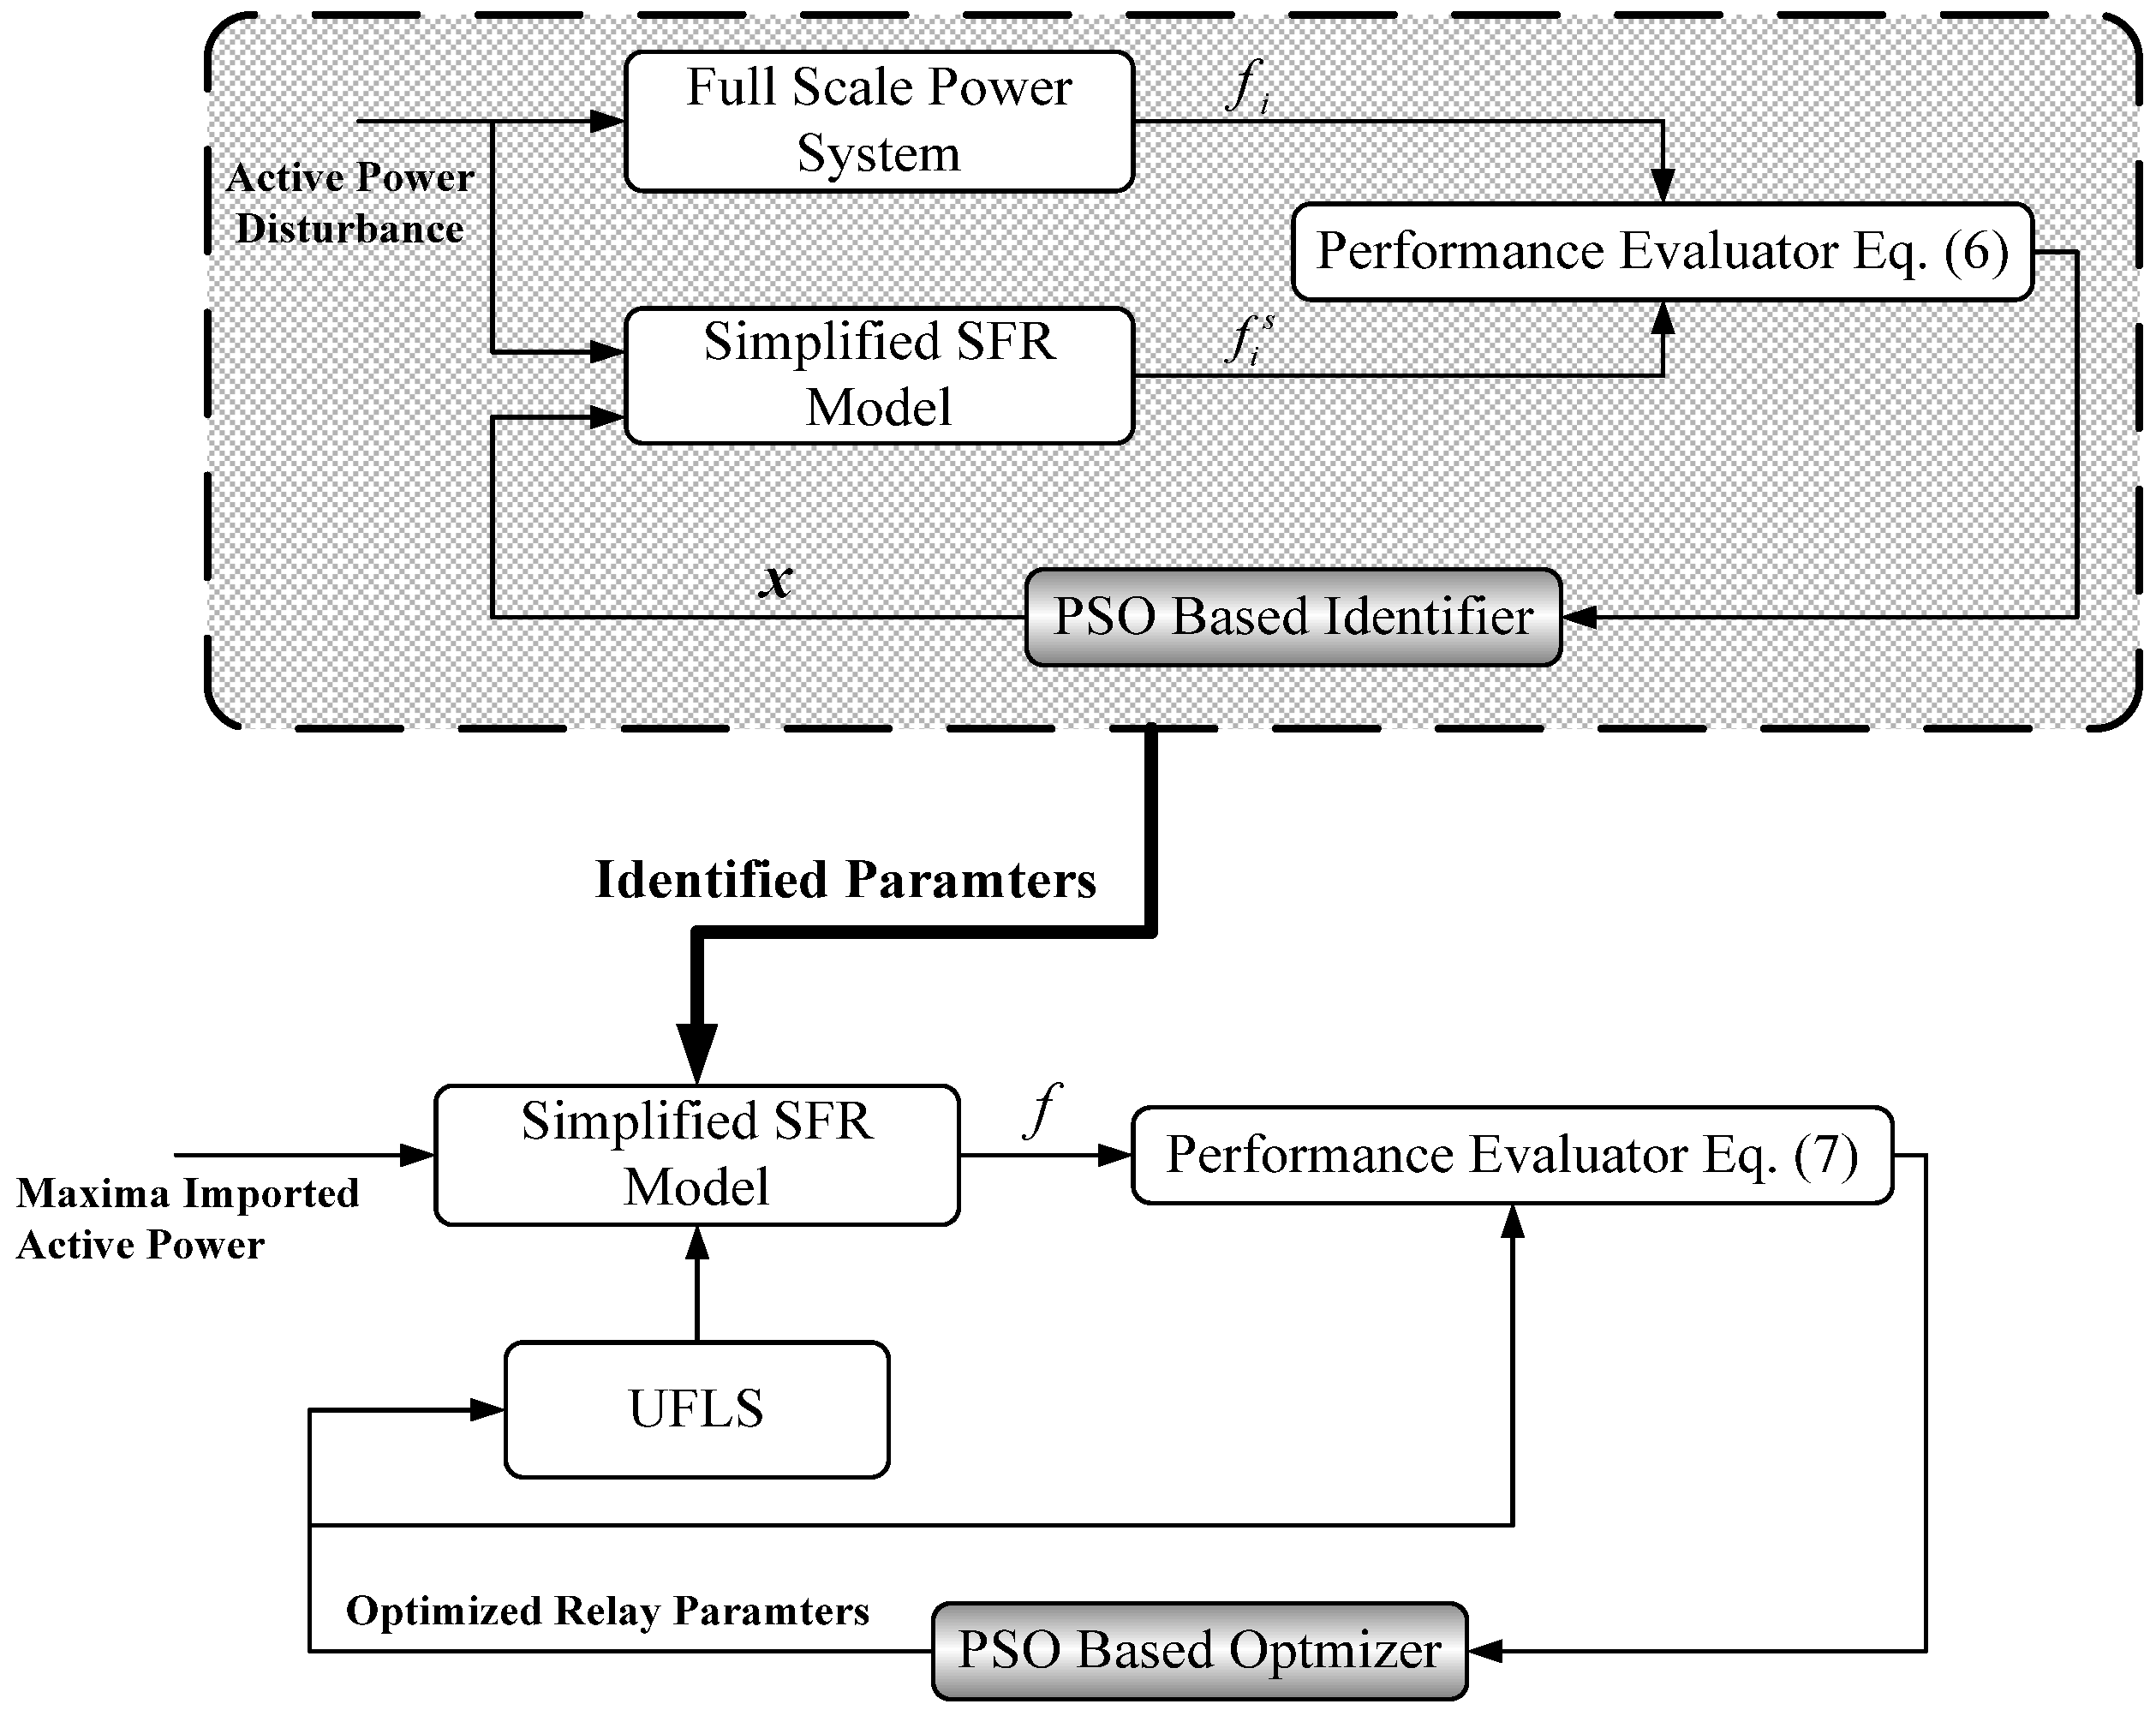
From the above description, it can be seen that parameter identification for the simplified SFR model and the robust UFLS scheme design is a standard nonlinear constrained optimization problem. So, a PSO population-based stochastic search algorithm is used to identify the parameters of the simplified SFR model and design the robust UFLS scheme for the small receiving-end power system after islanding in this paper. The tuning process of a UFLS scheme for a small power system utilizing the PSO algorithm is shown in
Figure 8.
The following describes the incorporation of the PSO approach for solving the proposed optimization models described in Equations (6) and (7).
- Step 1:
Input PSO parameters, system data, active power disturbance set, the maxima imported active power, and the upper and lower boundaries of each variable.
- Step 2:
Time-domain simulation for a period of 50 s is carried out on the full scale model system to determine the system frequency response at COI for the given contingency set.
- Step 3:
Initialize the swarm comprising the four design parameters, x = [H D K T]T , of the simplified SFR model, and relay the parameter Z of the UFLS scheme, with all parameters satisfying their constraints.
- Step 4:
For each particle in the swarm, the simplified SFR model is used to determine the system frequency response for the given contingency set.
- Step 5:
Evaluate the objective g(x) of each particle utilizing the objective function in Equation (6).
- Step 6:
Find the best position of each particle, pbest, by comparing the evaluation value of each particle with the one in pbest of the last swarm. If the evaluation value is better, then set pbest as gbest.
- Step 7:
Check the termination condition. If the termination condition is satisfied, go to Step 10.
- Step 8:
The evolved existing population or swarm velocity and position are developed employing Equations (3) and (4).
- Step 9:
Return to Step 4 to repeat the evaluation process with the evolved position.
- Step 10:
Set the latest gbest as the parameters of the simplified SFR model with UFLS.
- Step 11:
Compute the system frequency response using the simplified SFR model with UFLS for each particle in the swarm.
- Step 12:
Evaluate the objective F(Z) of each particle using the objective function in Equation (7).
- Step 13:
Select the gbest of the relay parameters of the UFLS utilizing the process in Step 6.
- Step 14:
If the termination condition is satisfied, go to Step 17.
- Step 15:
Update the evolved existing swarm velocity and position using Equations (3) and (4).
- Step 16:
Return to Step 11 to repeat the evaluation process with the evolved position.
- Step 17:
The particle that gives the latest gbest has the relay parameters of the optimal UFLS scheme.
4. Simulations and Results
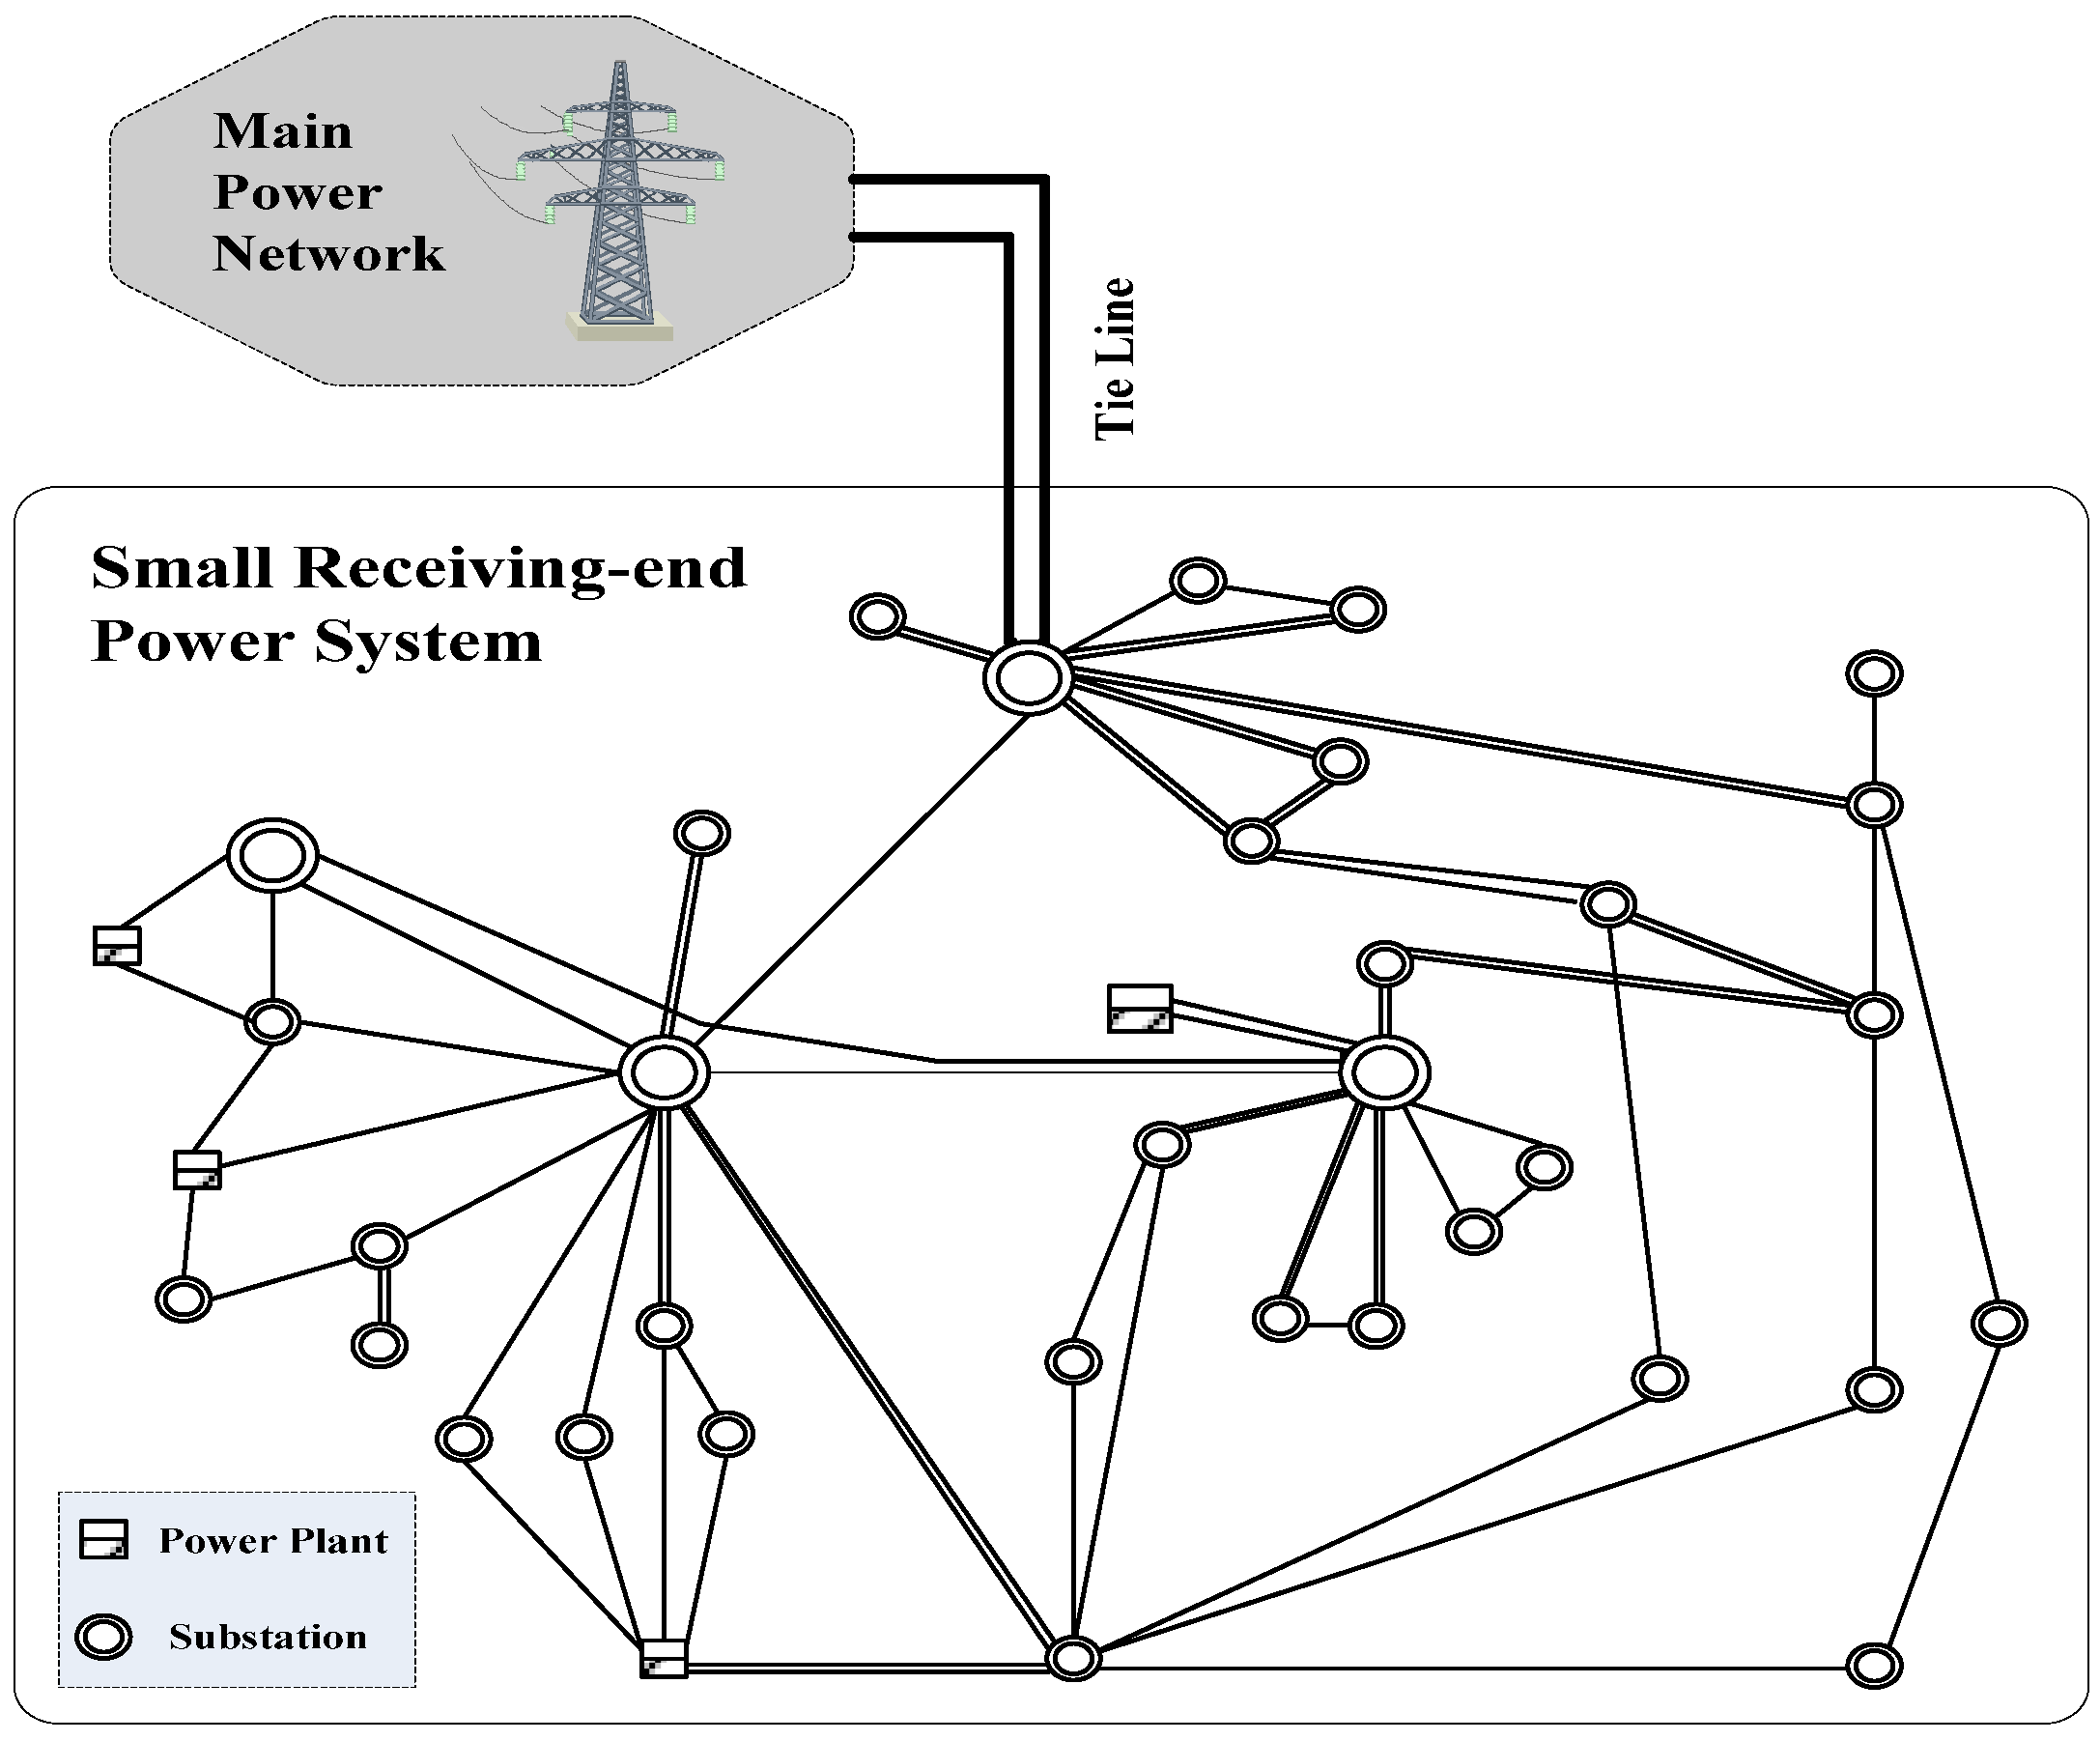
In order to illustrate the developed optimization framework for identifying parameters of the simplified SFR model and designing UFLS schemes, simulations were carried out on the Da Dan power grid. As shown in
Figure 9, the Da Dan power grid is a typical small receiving-end power system. The goal is to maximize active power import into the Da Dan power system from the main power network, because the small receiving-end power system has limited local generation but heavy load. Some large disturbances, for instance, a double circuit fault outage on the tile-line between the receiving-end system and the main network, would island the small receiving-end system from the main power system. Robust UFLS schemes must be deployed to safeguard the small receiving-end power system against such large impacts.
The Da Dan power grid consists of five power plants adding up to 3030 MVA. The imported active power is 800 MW and 1000 MW under valley demand and peak scenarios, respectively, as shown in the following.
The developed technology could be used for practical problems including the identification of parameters for the simplified SFR and the optimal design of UFLS schemes.
The whole optimization procedure was implemented in Matlab 7.1 (The MathWorks, Inc., Natick, MA, USA) and has been executed on an Intel (R) Core (TM) i3 3.2-GHz computer. During the optimization process using PSO, each swarm generation contained 60 position particles. The coefficients in Equation (8), ω, c1, and c2 are set to 0.8, 2, and 2, respectively.
4.1. Identification Parameters of Simplified SFR after Islanding for Small Receiving-End System
The general structure of the simplified SFR model is depicted in
Figure 1. This model is widely applied in UFLS scheme designs for small power systems.
Nominal parameters of the generator and governor model in the practical small receiving-end power system are listed in
Table 1. In the full scale system simulation, the composite load model (Power System Simulator/Engineering (PSS/E) model) is employed to represent the dynamic characteristics of loads.
Ten independent runs using PSO were simulated to collect the statistics including the standard deviation, mean, and best and worst optimum results, which are shown in
Table 2.
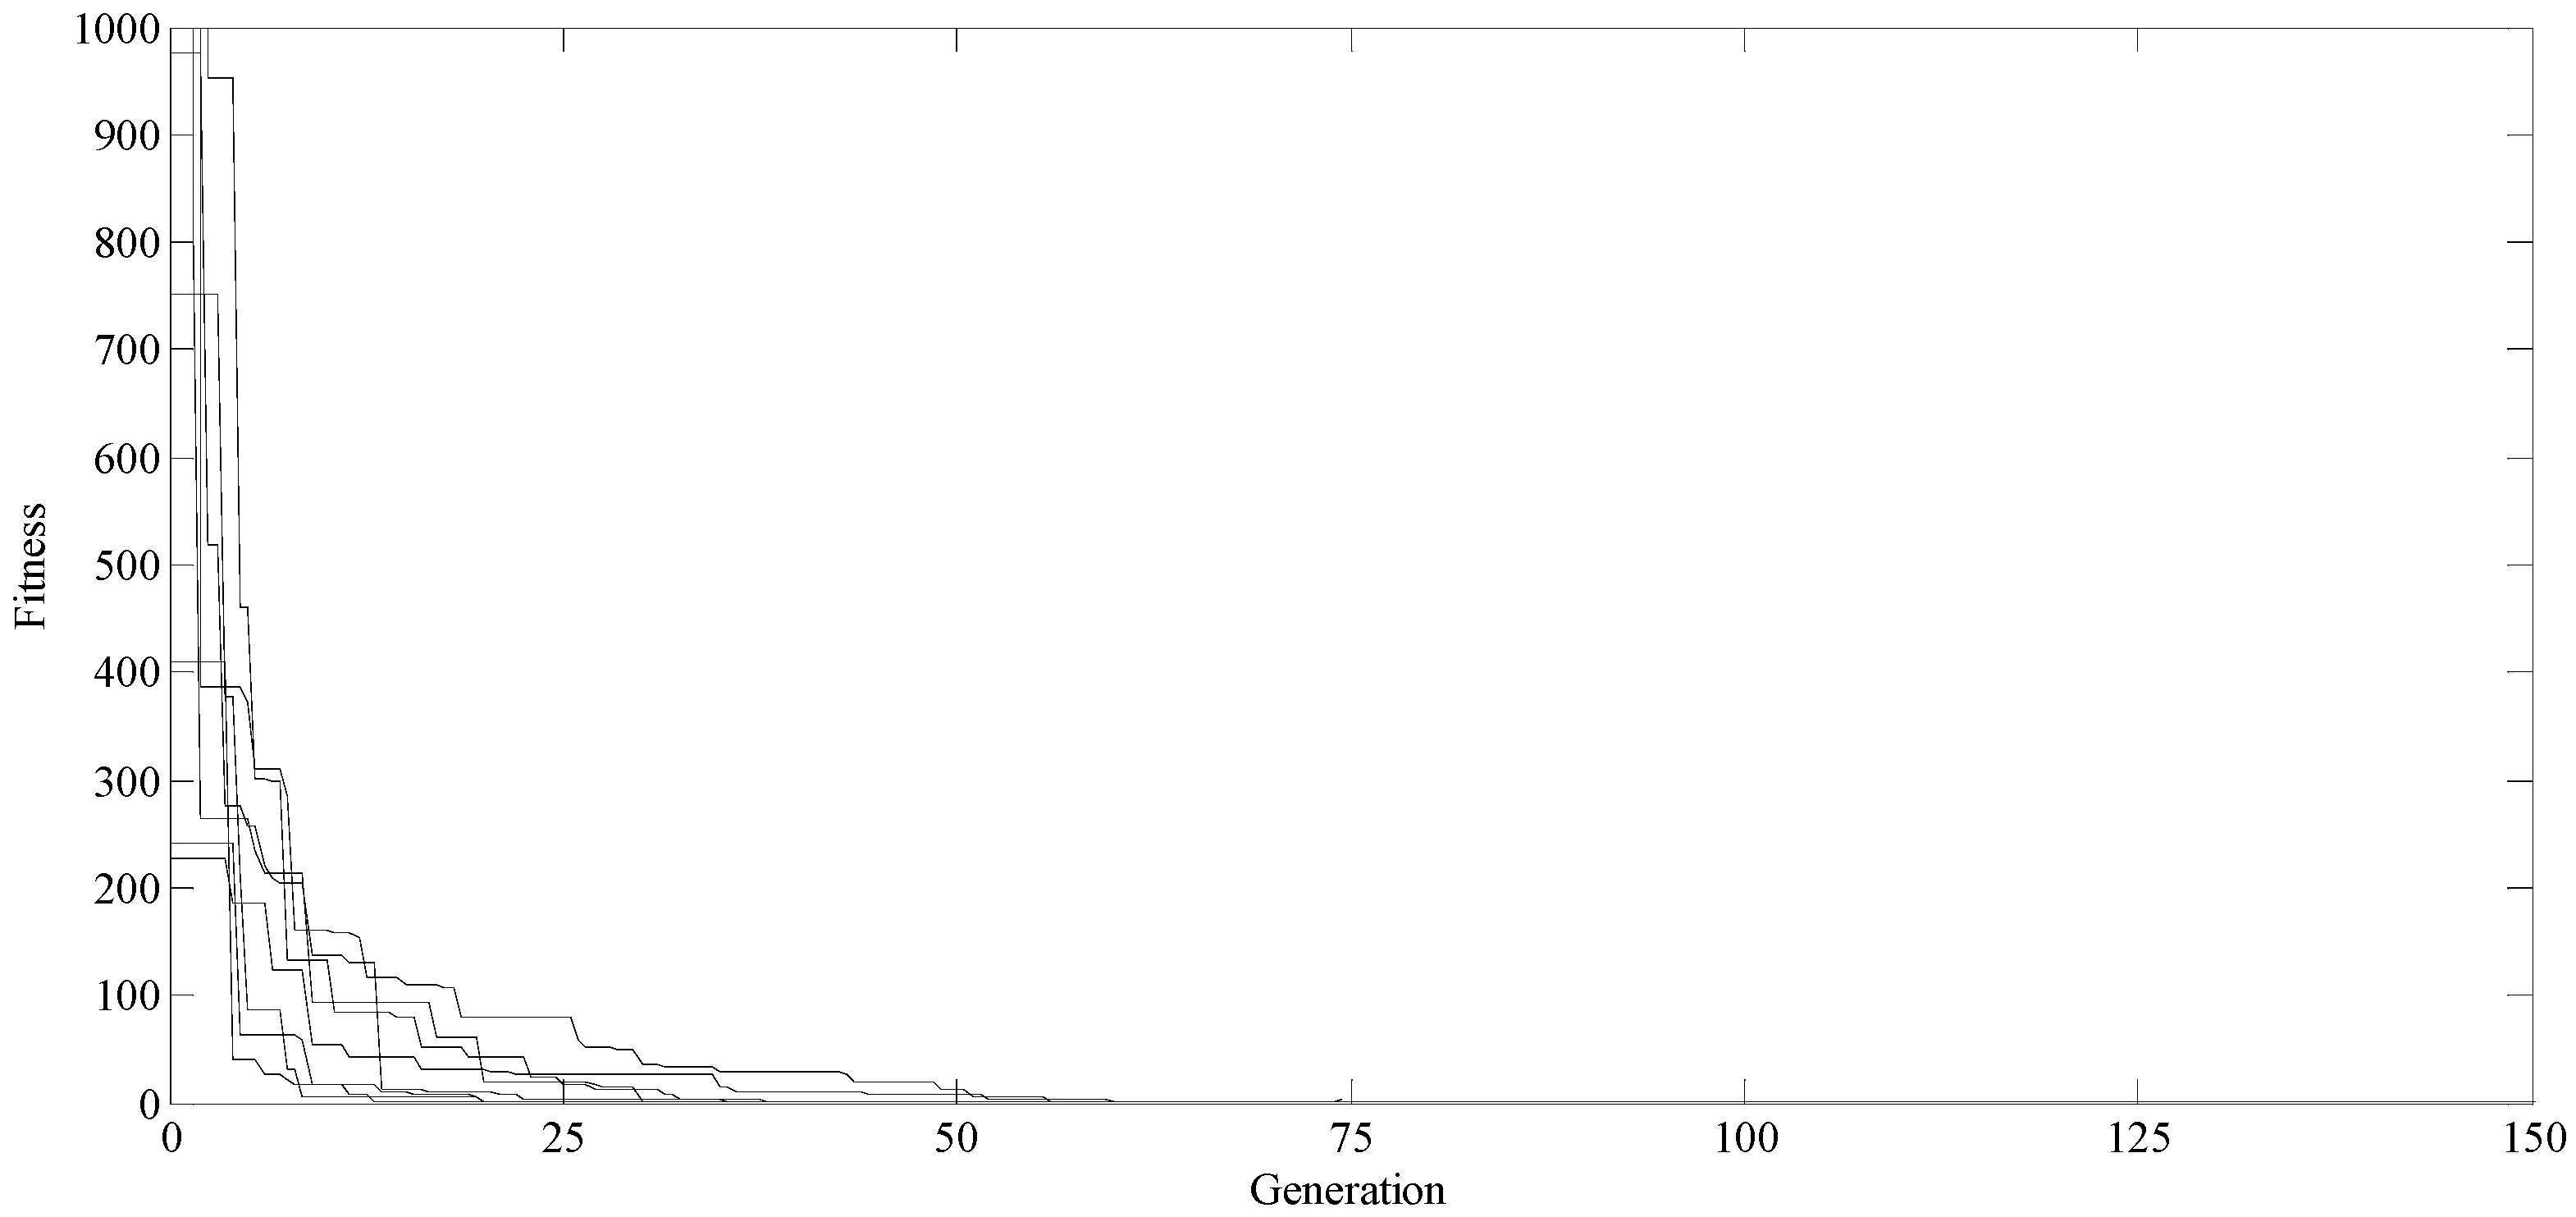
Figure 10 shows the optimization process of the presented model for two sample data sets derived from the full scale power system simulation after islanding. The simulation results show that the proposed model converges within 100 generations. The efficiency and accuracy of the proposed model make it useful for applications in parameter identification for the simplified SFR model.
The identified parameters are listed in
Table 3. At the same time, the parameters obtained by using the static equivalent (SE) and least square (LS) method proposed in [
14] are also listed in
Table 3 (The system power base
S is the sum of all loads).
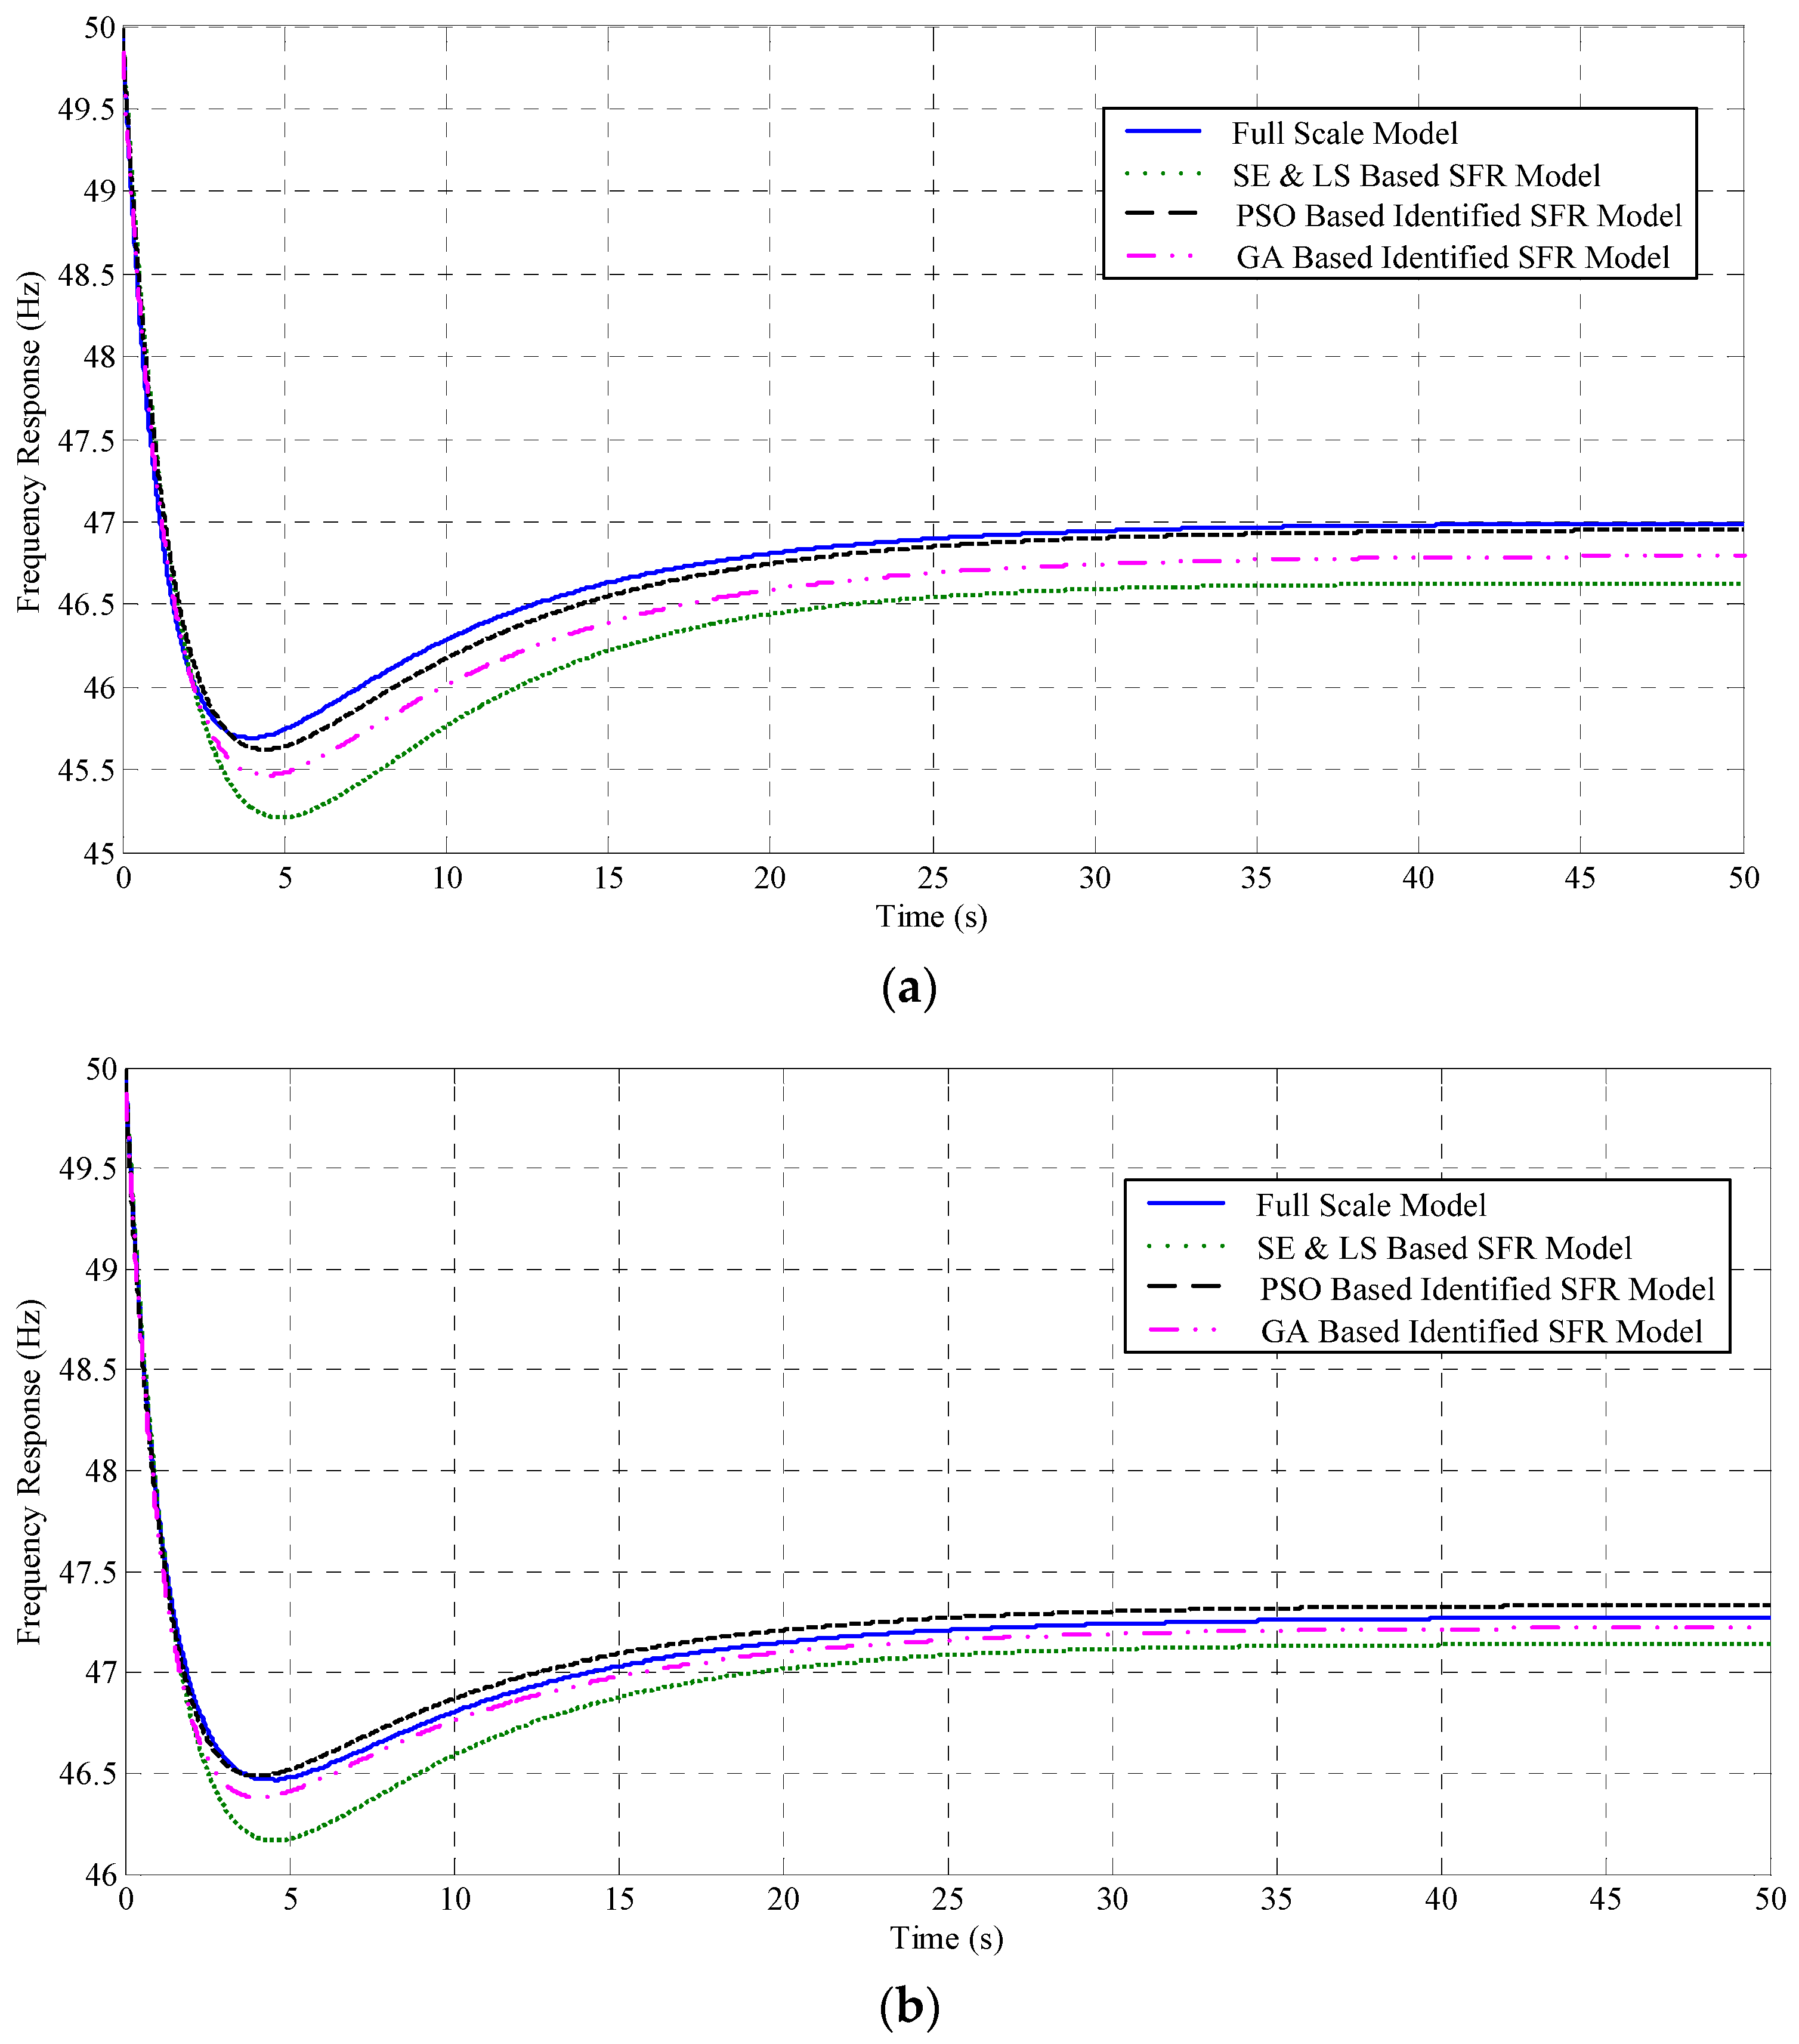
For thoroughly testing the advantages of the proposed PSO-based parameter identification model, the experimental results in
Figure 11 compare the performance of the identified model and the static equivalent model with that of the full scale power system.
Figure 11a shows the comparative results under 1000 MW imported active power and
Figure 11b under the 800 MW imported condition. Because the performance of the model with the identified parameters matches the results of the full scale system quite well, the advantages of the proposed PSO-based model parameters identification technique are demonstrated. Compared with the equivalent model obtained by using the static equivalent and least square methods, the dynamic frequency responses of the small receiving-end power system can be presented accurately and precisely after islanding.
4.2. UFLS Design Using the Identified Simplified SFR Model
In this paper, the main concern is to optimize the UFLS schemes to maximize the imported power under normal circumstances and yield acceptable system performance after islanding for the small receiving-end power system. To ensure the UFLS schemes against accidents or the loss of the maximized active power import, the PSO-based model proposed in
Section 3 was employed to minimize the frequency deviations and the total amount of the load needed to be shed.
In order to illustrate the proposed approach for designing UFLS schemes, we considered the small receiving-end system shown in
Figure 10 whose simplified SFR model parameters are identified using the developed model. Other parameters are set as:
Ce = 1.0 pu/pu,
Cls = 0.1 pu/pu [
9];
kmin = 1,
kmax = 6;
fth_min = 48.0 Hz,
fth_max = 49.5 Hz;
fε = 0.1 Hz; Δ
dmax = 0.3 pu, Δ
dmin = 0.01 pu;
td_min = 0.1 s,
td_max = 0.2 s;
fss_min = 49.8 Hz,
fts_min = 48.8 Hz,
fts_max = 50.2 Hz.
Table 4 shows the statistical optimization results for different
k by performing ten independent runs. As seen, the most favorable UFLS schemes are for
k = 3.
Table 5 shows the optimized relay setting of the UFLS schemes for the test system on the condition that the imported active power is maximized. Only the first two ranked values of the load shedding stages are shown in
Table 5.
4.3. Time Domain Verification of the Optimal UFLS Schemes
In this part, the designed optimal UFLS schemes in the afore-mentioned section were applied to the full scale small receiving-end system. The system dynamic frequency responses of the full scale system for disturbance events are simulated using the DSA Tool software [
30].
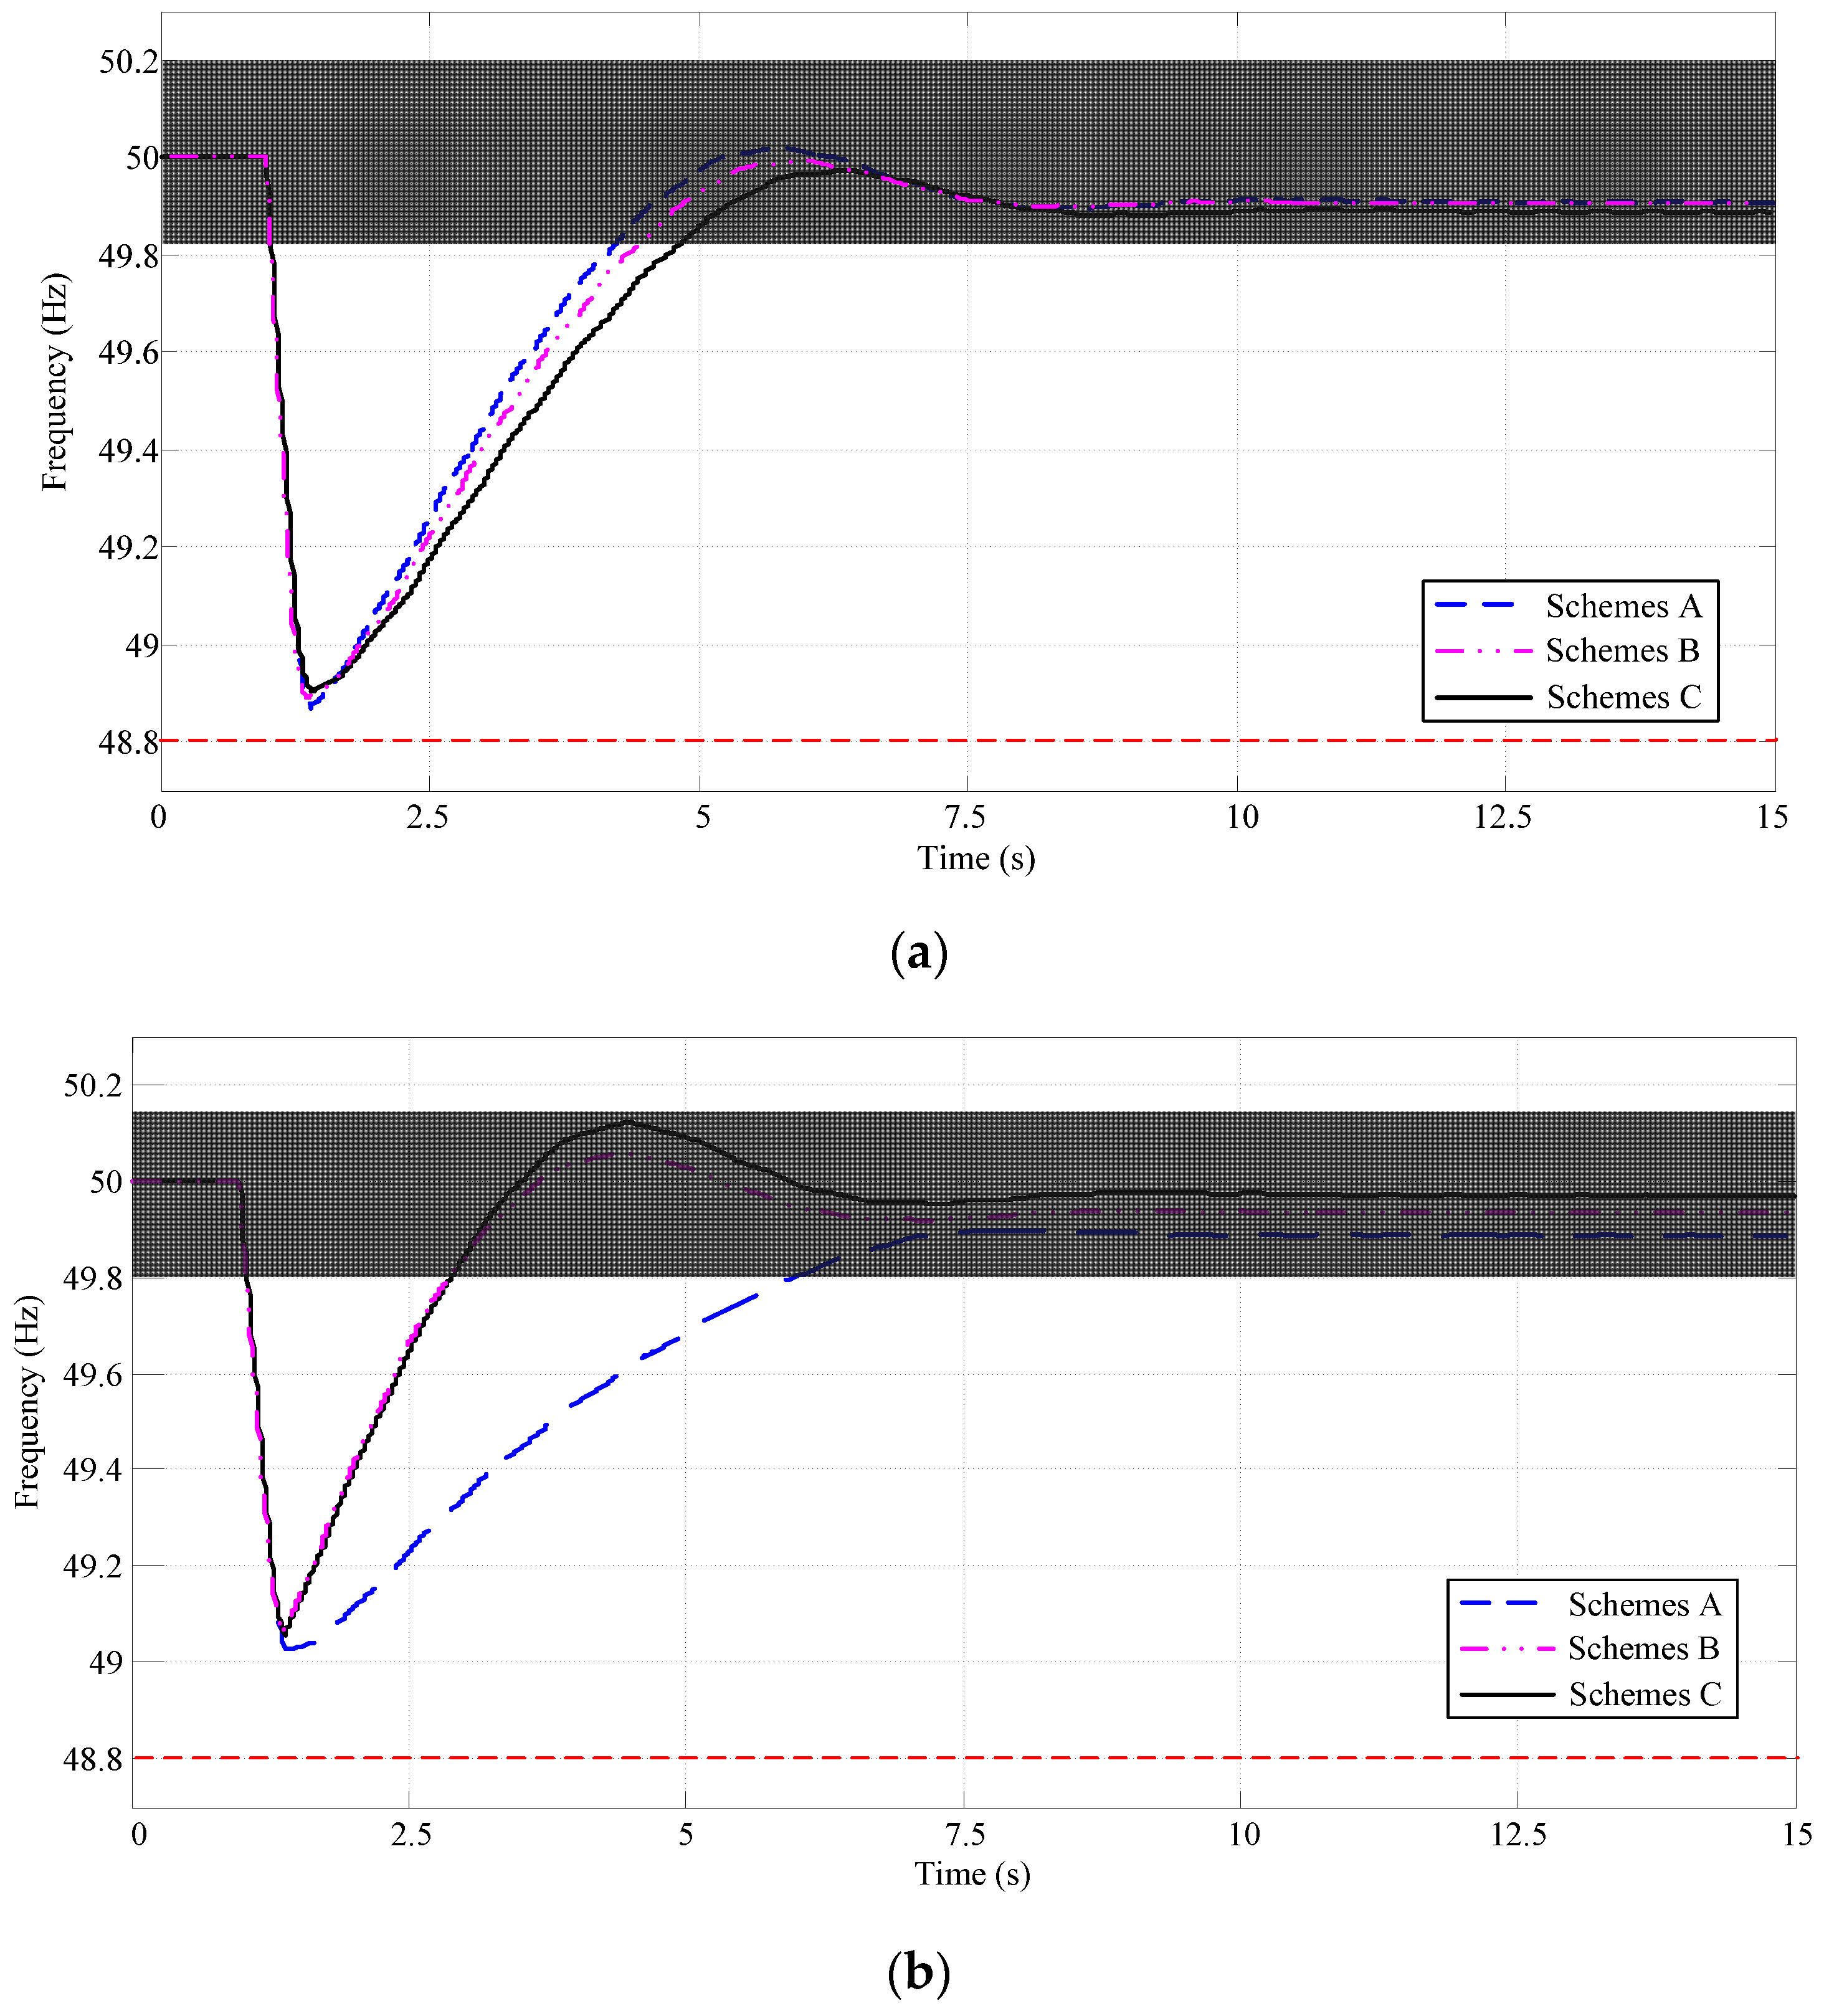
For this simulation, the performances of Scheme A designed using the SE and LS based SFR model, Scheme B designed using the GA based identified SFR model, and Scheme B designed using the PSO based identified SFR model are compared. The system frequency responses of the full scale system with the designed optimal UFLS schemes for the contingencies computed with the DSA Tool software are shown in
Figure 12. The numerical comparisons of different UFLS schemes are also given in
Table 6.
By means of the designed optimal UFLS schemes utilizing the proposed PSO-based model, the system frequency response trajectory for two contingencies is shown in
Figure 12. It is shown in
Figure 12 that the designed optimal UFLS schemes bring the system back to the safe region of [49.8Hz, 50.2Hz] (the shadowed part in
Figure 12) after islanding. The results also show that the system frequency does not settle above 50 Hz and does not exceed the safe range.
As shown in
Figure 12, the optimized UFLS schemes derived using the PSO based, identified simplified SFR model for two disturbances in the small receiving-end system performs better than the UFLS schemes designed using the SE and LS based SFR model. On the other hand, as depicted in
Table 6, the optimized UFLS schemes obtained using the PSO based, identified simplified SFR model have advantages of the set rules to guard the security system and thus minimize the total load that is needed to be shed for the islanded system. The results also show that the optimal UFLS schemes derived from the PSO based, identified simplified SFR model have better robustness.
In general, the optimized UFLS schemes derived utilizing the PSO based, identified simplified SFR model and the developed PSO-based UFLS schemes optimizing model gave better performances for the same contingency event, as shown in
Figure 12a,b.
