Article

Needle Segmentation in Volumetric Optical Coherence Tomography Images for Ophthalmic Microsurgery

1
Institut für Informatik, Technische Universität München, 85748 München, Germany
2
Carl Zeiss Meditec AG., 81379 München, Germany
3
School of Data and Computer Science, Sun Yat-Sen University, Guangzhou 510006, China
4
Augenklinik und Poliklinik, Klinikum rechts der Isar der Technische Universit München, 81675 München, Germany
*
Authors to whom correspondence should be addressed.
Appl. Sci. 2017, 7(8), 748; https://doi.org/10.3390/app7080748
Submission received: 22 June 2017 / Revised: 17 July 2017 / Accepted: 18 July 2017 / Published: 25 July 2017
(This article belongs to the Special Issue Development and Application of Optical Coherence Tomography (OCT))

Abstract

:
Needle segmentation is a fundamental step for needle reconstruction and image-guided surgery. Although there has been success stories in needle segmentation for non-microsurgeries, the methods cannot be directly extended to ophthalmic surgery due to the challenges bounded to required spatial resolution. As the ophthalmic surgery is performed by finer and smaller surgical instruments in micro-structural anatomies, specifically in retinal domains, difficulties are raised for delicate operation and sensitive perception. To address these challenges, in this paper we investigate needle segmentation in ophthalmic operation on 60 Optical Coherence Tomography (OCT) cubes captured during needle injection surgeries on ex-vivo pig eyes. Furthermore, we developed two different approaches, a conventional method based on morphological features (MF) and a specifically designed full convolution neural networks (FCN) method, moreover, we evaluate them on the benchmark for needle segmentation in the volumetric OCT images. The experimental results show that FCN method has a better segmentation performance based on four evaluation metrics while MF method has a short inference time, which provides valuable reference for future works.

Graphical Abstract

1. Introduction

Recent research shows that eye pathologies contribute to more than 280 million visual impairments [1]. Therefore, there is an increasing demand for the ophthalmic surgery due to such a large number of claims. Vitreoretinal surgery is a conventional ophthalmic operation consisting of complex manual tasks, as shown in Figure 1. The incisions, created by keratome and trocar at the sclera in a circle and 3.5 mm away from the limbus [2], are made to provide the entrance for three tools: light source, surgical tool, and irrigation cannula [3,4]. The irrigation cannula is used for liquid injection to maintain appropriate intraocular pressure (IOP). The light source is used to illuminate the intended area on the retina, allowing the planar view of the area obtained and analyzed by surgeons through the microscope. To address these challenges, the surgical progress proposes a great challenge of delicate operation and sensitive perception to surgeons. The surgical instrument segmentation is the first step to estimate the needle pose and position, which is extremely important to enhance surgeons’ concentration under low illumination intraocular condition.
Among a variety of surgical tools in ophthalmic operations, the beveled needle is a widely used surgical instrument for delivering the drug into micro-structural anatomies of the eye such as retinal blood vessels and sub-retinal areas. Many studies have been carried out with significant progress in the needle segmentation through microscopic images [5,6,7,8]. These works achieved satisfactory results using either color-based or geometry-based features. Nevertheless, due to the limitation of two-dimensional (2D) microscopic images, these detection results in en-face plane view cannot provide enough information to locate the needle pose and position in three-dimensional (3D) space. Many widely used 3D medical imaging technologies, such as computed tomography (CT) scans, fluoroscopy, magnetic resonance (MR) and ultrasound are already applied in brain, thoracic and cardiac surgeries, not only for diagnostic procedures but also as real-time surgical guides [9,10,11,12,13]. However, these imaging modalities cannot achieve a sufficient resolution for ophthalmic interventions. For instance, in MRI-guided interventions with millimeter resolution in breast and prostate biopsies, 18 gauge needles with a diameter of 1.27 mm are used. Yet for ophthalmic surgery, 30 gauge needles with a diameter of 0.31 mm require resolution submillimeter [14].
Optical Coherence Tomography (OCT) is originally used in ophthalmic diagnosis for its micron level resolution [15]. Recently, OCT application has been extented to provide real-time information of intra-operative interactions between the surgical instrument and intraocular tissue [16]. The microscope-mounted intra-operative OCT (iOCT) developed by Carl Zeiss Meditec (RESCAN 700) was firstly described in clinical use in 2014 [17]. The iOCT integrated to on this microscope is capable of sharing the same optical path with the microscopic view and provide real-time cross section information, which is an ideal imaging modality for ophthalmic surgeries. The iOCT device can also obtain a volumetric image cubes with multi B-scans acquirements. The scan area can be adjusted via region-of-interest (ROI) shown in the microscopic images in CALLISTO eye assistance computer system.
When using iOCT to estimate the needle pose and position, the first step is to obtain the needle point cloud and to segment the needle voxels in the volumetric OCT images. Apart from the difficulties caused by image speckle, low contrast, signal loss due to shadowing, and refraction artifacts, the needle in OCT images has much more details of the tip part (needle may have several fragments in the B-scan image) and has illusory needle reflection [18]. All these challenges make needle segmentation in OCT images different from other imaging modalities such as 3D ultrasound. To the best of our knowledge, there is no systematic empirical research addressing the needle segmentation in volumetric OCT images. Previous studies from [19,20] focused on the visualization of volumetric OCT. Rieke et al. [7,21] studied the surgical instrument segmentation in cross-sectional B-scan image. In their work, the position of the cross-section is localized by microscope image, and the pattern of needle in B-scan image is simplified. Therefore, their methods cannot be directly applied to segmenting the needle in volumetric OCT images.
This study focuses on developing the approaches in two popular mechanisms for needle segmentation in volumetric OCT images. We propose two methods, corresponding to mechanisms of manually feature exaction and automatically feature exaction, to tackle difficulties for the needle segmentation in OCT images: (a) with the needle shadow principle [22], a conventional method based on morphological features (MF) comes to the mind; (b) another approach is based on the recently developed fully convolution neural networks (FCN) [23], which has been applied for MRI medical image analysis. The MF method is usually straightforward which needs features with parameters manually input upon the analysis of all situations. The FCN is a complicated network which can learn all features automatically by properly training the model based on dataset. We extend the FCN method to identify the needle in OCT images. The main contributions of this paper are: (a) A specific FCN method is developed and compared with the conventional method for the needle segmentation with different pose and rotation; (b) A benchmark including 60 OCT cubes with 7680 images is set up using ex-vivo pig eyes for evaluation of both methods. The rest of the paper is organized as follows: Section 2 gives the basic configuration of OCT and typical patterns of needle in OCT B-scan images, afterwards, two methods are presented for needle segmentation in detail. We carry out the experiments and describe the results in Section 3. Section 4 gives the discussion and Section 5 concludes the presented work.

2. Method

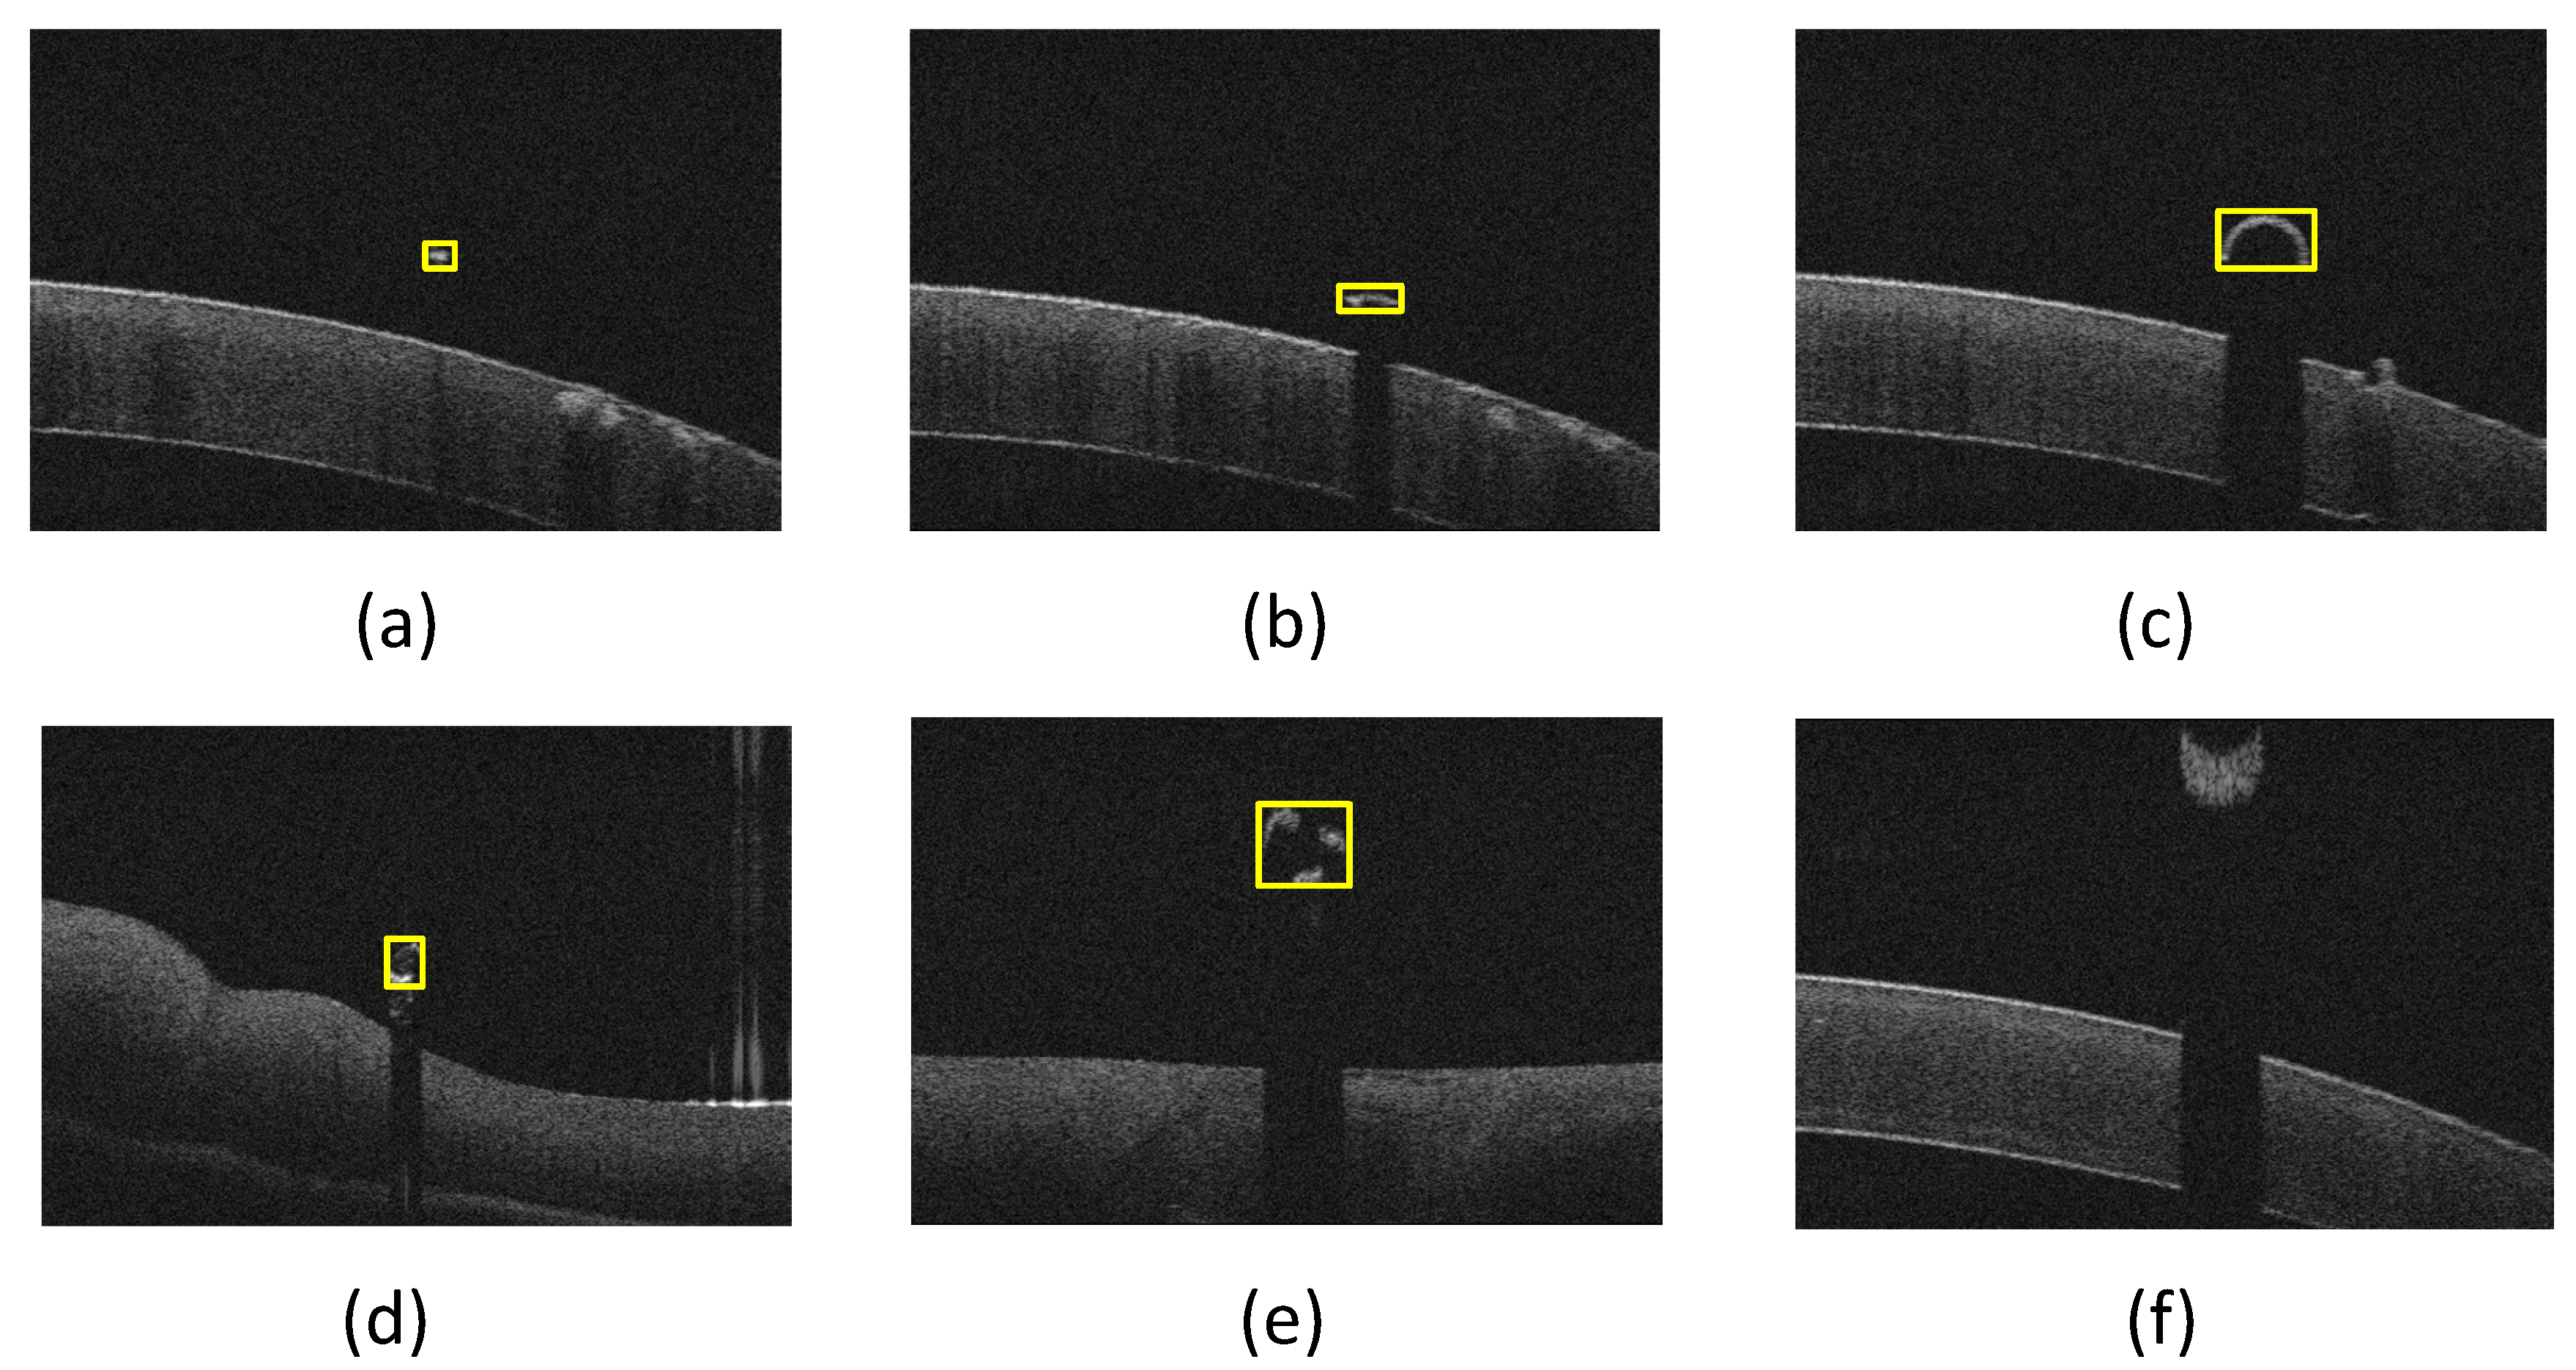
The schematic diagram of needle segmentation in OCT cube is shown in Figure 2. In order to preserve as much information as possible, the highest resolution of OCT scan on RESCAN 700 is selected which is 128 B-scans each with 512 A-sacns in 3 × 3 mm. Each A-scan has 1024 pixels for the 2 mm depth information (see Figure 2a). Figure 2b shows the needle in an ex-vivo pig eye experiment, which is an en-face plane view obtained by the ophthalmic microscope. The scan area is decided by the rectangle and can be adjusted by a foot panel connected to the RESCAN 700. Afterwards, the volumetric OCT images are generated (see Figure 2c). Figure 2d is the needle segmentation based on the process of OCT image cube. By taking consideration of different needle rotations and positions in OCT cube, the needle in B-scan can be seen as the following patterns in Figure 3. It shows that most of the needle fragments have the clear shadow except for the needle tip part. The refraction fragment usually has a larger amount of pixels in comparing to normal imaging parts. The qualified method should be able to segment as many needle pixels as possible in various conditions.

2.1. Morphological Features Based Method

Due to the fact that most of the needle parts in each B-scan are located outside the tissue creating shadows, a morphological feature based method is proposed. The B-scan gray image is transformed into a binary image by thresholding the OCT images. The threshold value is adaptively defined based on statistical measurements of each B-scan. This simple and effective method has been used and evaluated in the automatic segmentation of structures for OCT images [24]. Moreover, a median filter is applied for eliminating the noise. Furthermore, the topmost surface is segmented and considered as the tissue surface. By scanning from left to right, any vertical jump or drop in this surface layer is detected and considered as the beginning and the end of an instrument reflection, respectively. To avoid the misdetection of anatomical features of the eye tissue as a reflection caused by the needle, only reflections with invisible intra-tissue structures are confirmed to be needle reflections. A bounding box is used to cover the region of detected needle part, see Figure 2b–e, and the width of bounding box reflects the width of needle cross-section which can be used to analyze the diameter of the needle. In consideration of the situation for several needle tip parts, the bounding boxes in one B-scan image, whose distance between any two of them is less than a threshold d b , can be merged into one bounding box. The needle refraction fragment will be then removed from the detected results since it is not the real needle position. Removal operation will be performed when either of the conditions is satisfied: (1) the top edge of the needle fragment bounding box is closed to the upper edge of the image; (2) the number of needle pixels is more than a threshold. Here, in the MF method, features are obtained by observation and summarization of the needle patterns in the B-scan image. Some of the parameters are manually decided which may influence the accuracy of segmentation. In the next section, we will introduce another method that can learn the features by itself with the training dataset.

2.2. Full Convolution Neural Networks Based Method

2.2.1. Network Description

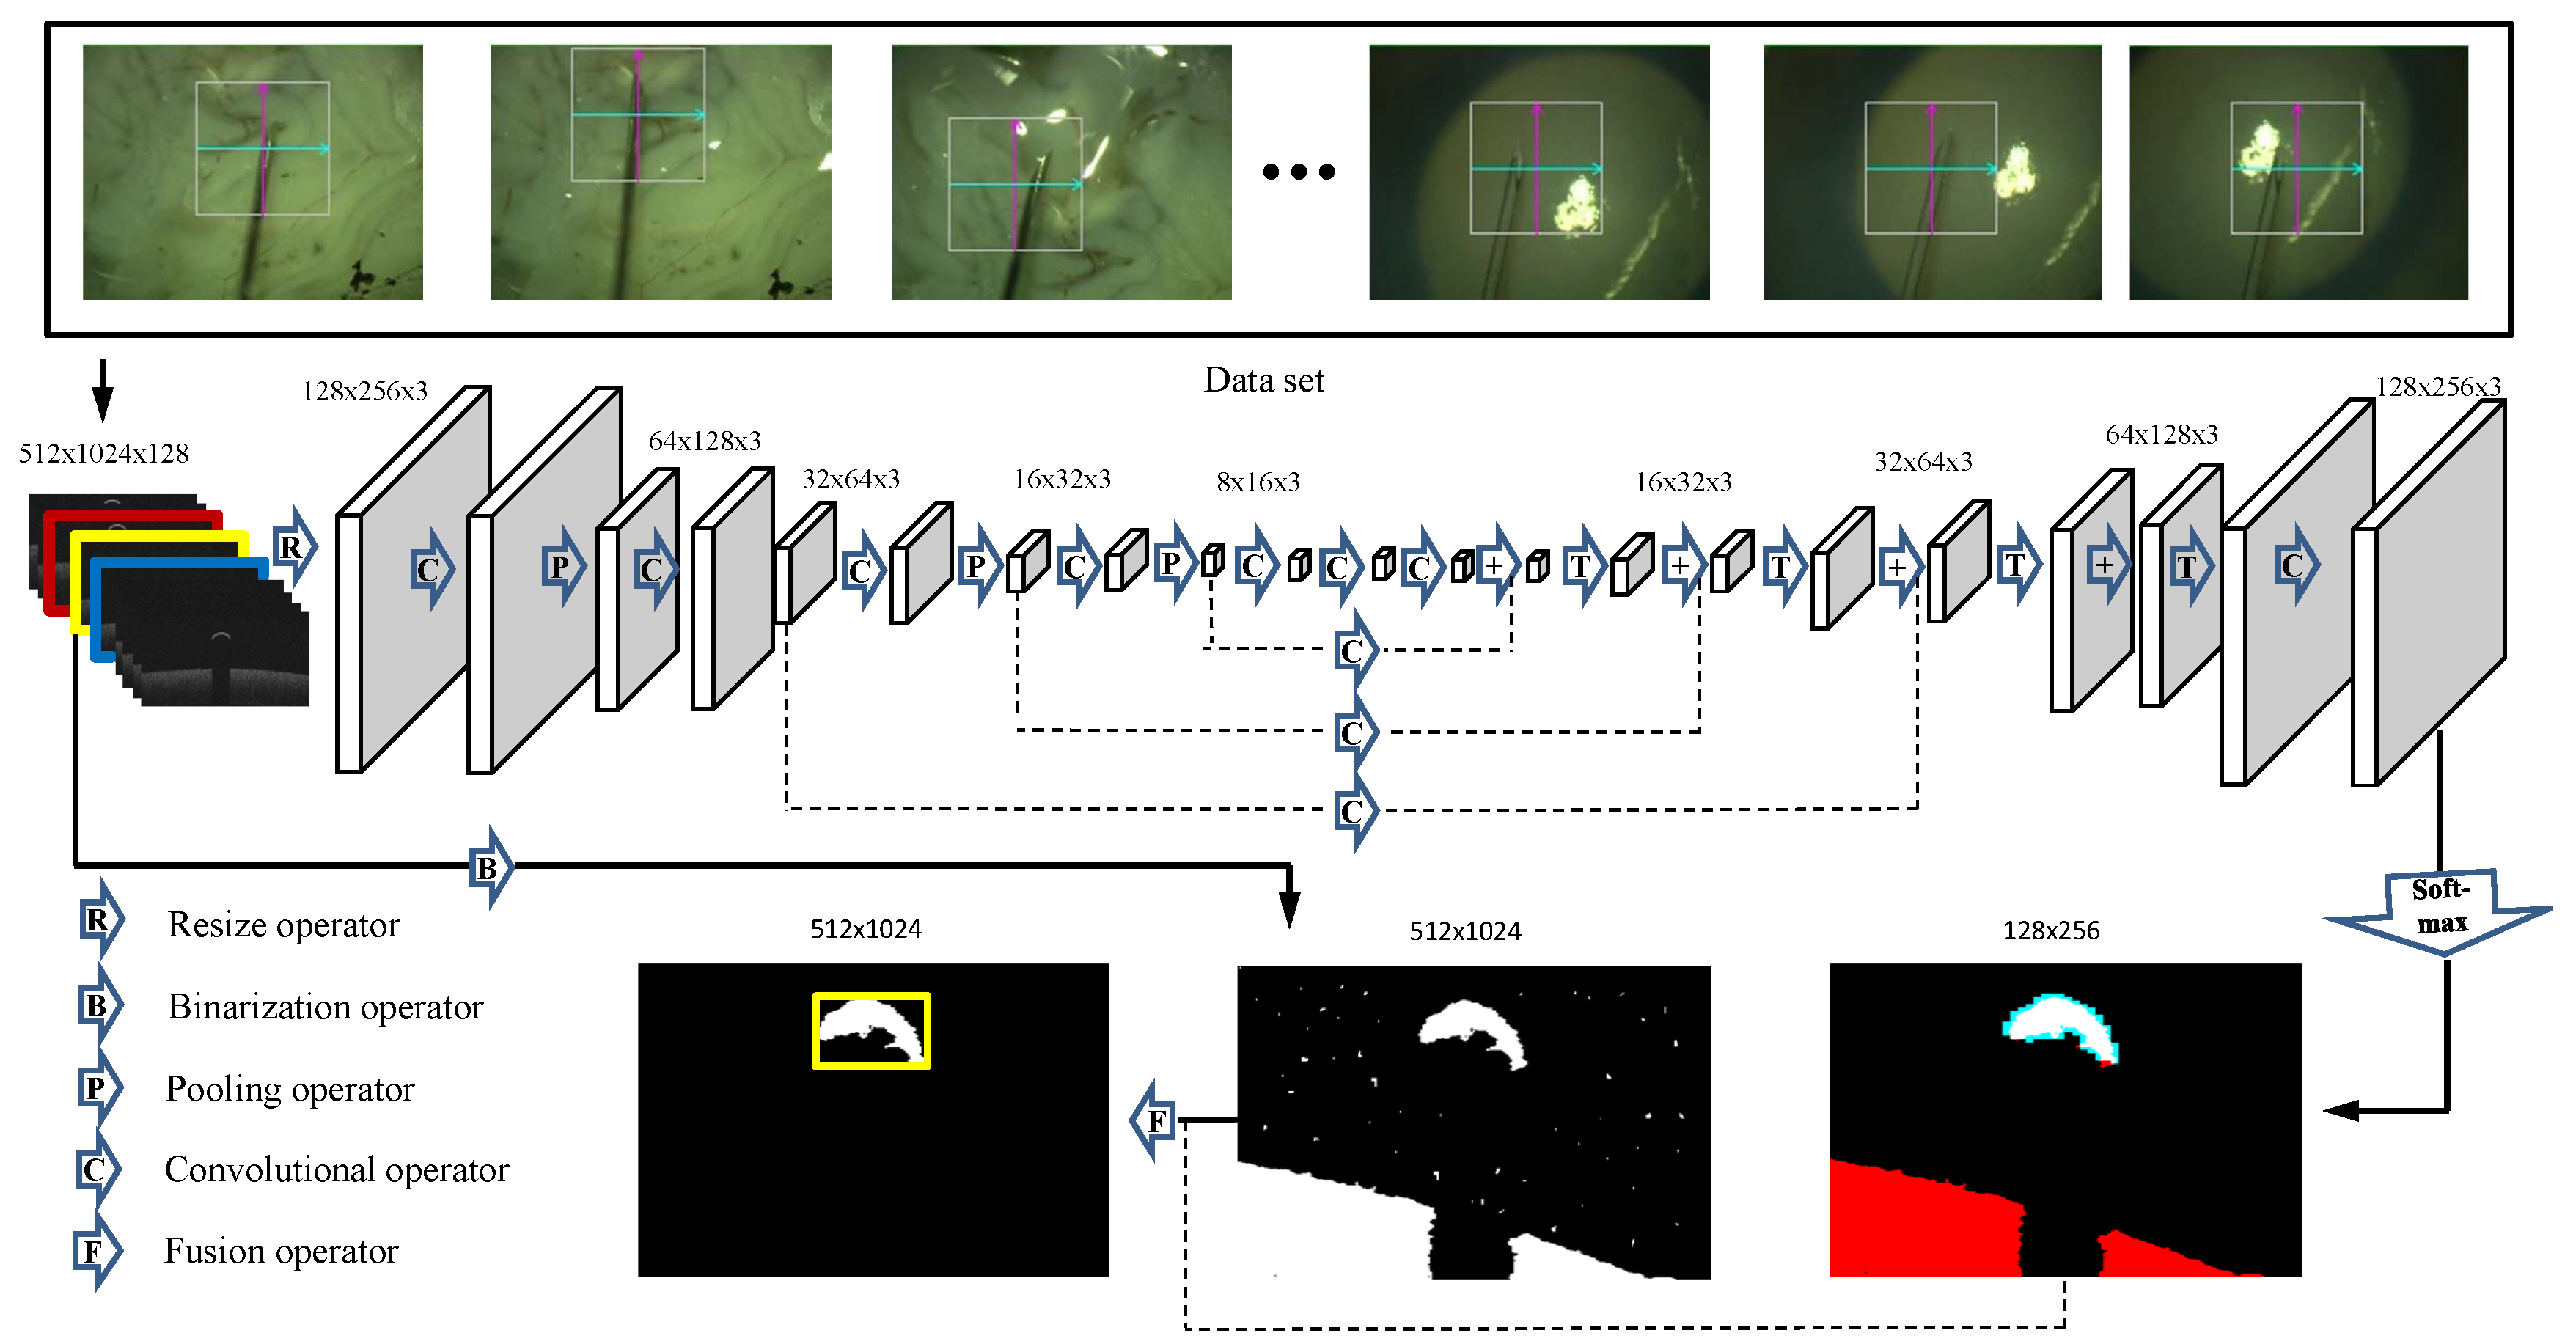
In this section, we present a specifically designed FCN method inspired by the work of Long et al. [23]. Figure 4 shows the schematic representation of our network. We perform convolutions aiming at both extracting features from the data and segmenting the needle out of the image. The left part of the network consists of a compression path, while the right part decompresses the signal until original sizes are reached.
In order to reduce the size of the network and consider existence of the needle in B-scan image sequence continuously, we take three adjacent B-scan images in OCT cube as input and resize the image with a factor of χ . The left side of the network is divided into different stages operating at different resolutions. Similar to the approach demonstrated in [23], each stage comprises one to two layers. The convolution layer performed in each stage uses volumetric kernels having a size of 7 × 7 × 3 voxels with stride 1. The pooling uses the max-pooling operation in FCN with 7 × 7 × 3 voxels with stride 2, thus the size of the resulting feature maps is halved. PReLu non linearities are applied throughout the network. Downsampling allows us to reduce the size of the input information, and furthermore increase the receptive field of the features being computed in subsequent network layers. Each pair of the convolutional and pooling layers computes two times higher features more than the one in the previous layer.
After three convolutional layers with image size of 4 × 8 × 3 , the network increases the low-resolution input by de-convolution combining the pooling results from previous layers [23]. The two feature maps computed from the last convolutional layer, having 1 × 1 × 1 kernel size and producing the same size as input images which will be converted to probabilistic segmentations of the foreground and background regions by using soft-max operation. In order to obtain the original resolution of the needle foreground, the segmentation result from FCN is used to fuse with the original image after binarization and 4-connected components labeling. The labeled area with a certain number of pixels voting from the output foreground of FCN will be considered as the needle fragments. All needle fragments will be covered by one bounding box to indicate the ROI.

2.2.2. Training

The needle fragment always occupies only a small region in B-scan image compared to the background, which leads the network having a strong bias towards the background. In order to avoid the learning progress trapping into the local minima, the dice coefficient based objective function is used to define our subject function. This will increase the weight of the foreground during the training phase. The dice coefficient of the two binary images can be represented as [25]:
= 2 i n p i g i i n p 2 + i n g 2
where the predicted binary segmentation image p i P , the ground truth binary volume g i G and n indicates the amount of pixels. The gradient can be calculated to obtain the gradient with respect to the j-th pixel of the prediction.
p j = 2 ( g j ( i n p i 2 + i n g i 2 ) 2 p j ( i n p i g i ) ( i n p i 2 + i n g i 2 ) 2 )
After the soft-max operator, we obtain a map of probability for the needle and the background. The pixel with a probability of more than 0.5 will be treated as the needle part.

3. Experiments and Results

3.1. Experimental Setup and Evaluation Metrics

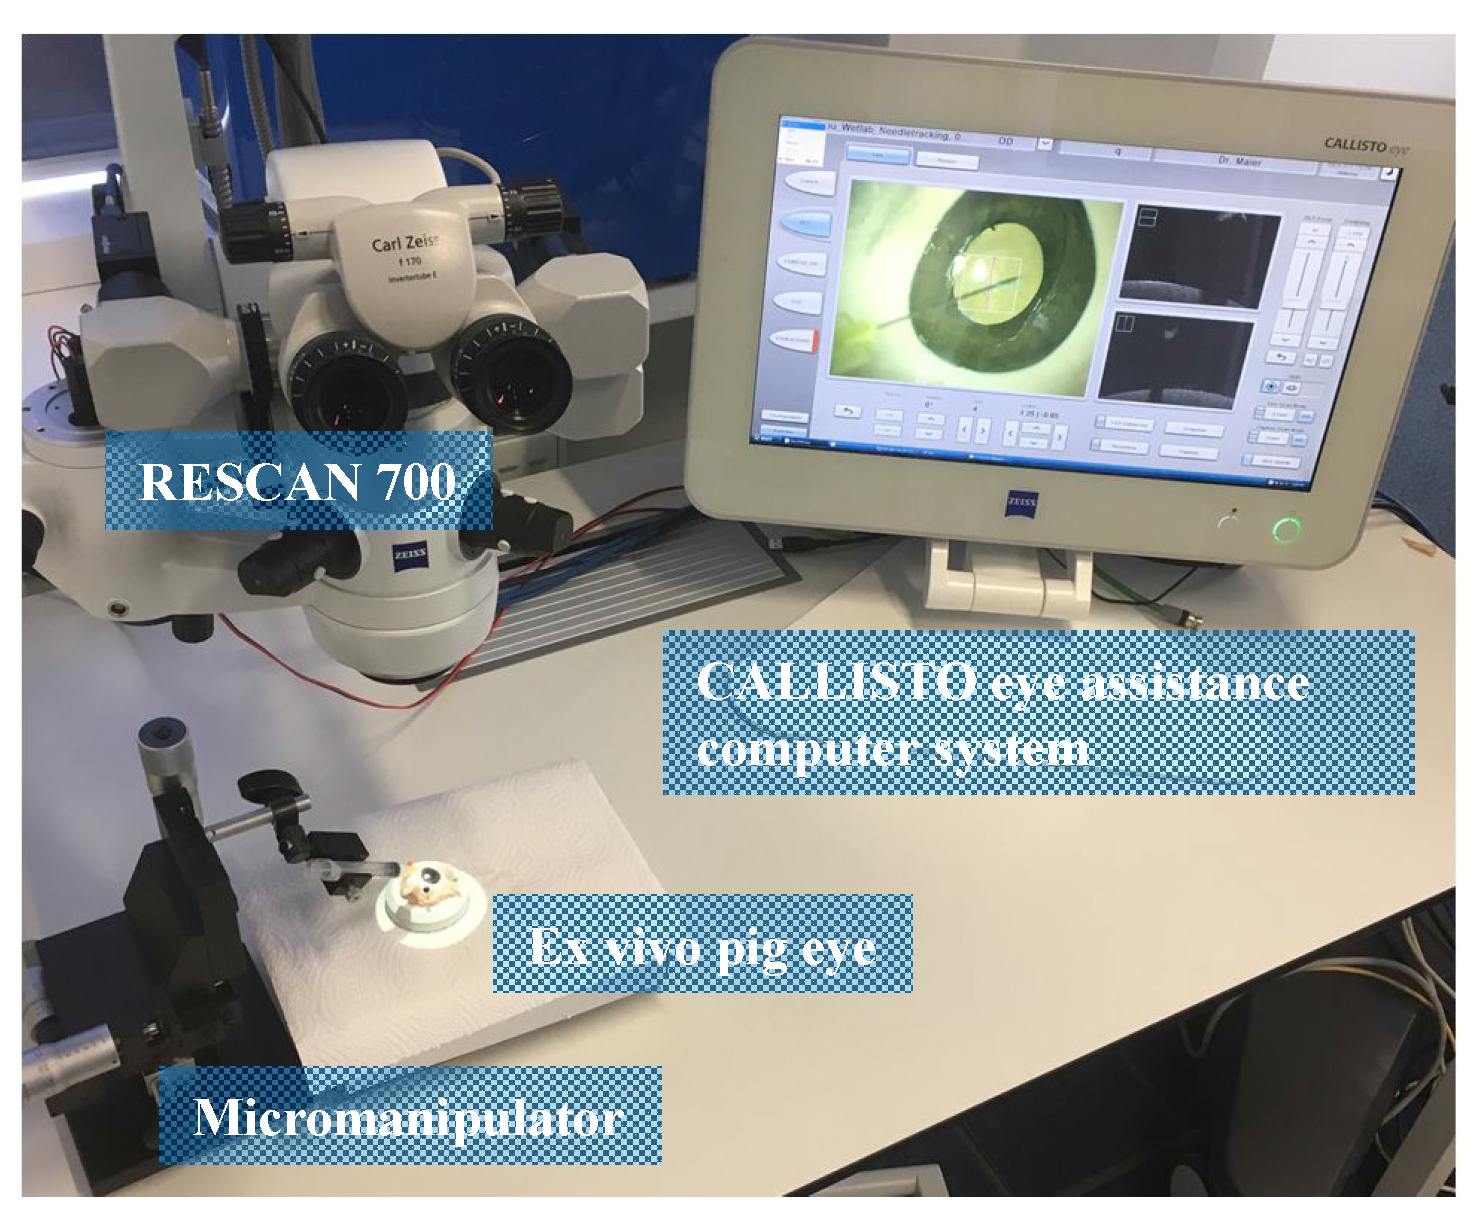
The experiments were carried out on ex-vivo pig eyes. A micro-manipulator was used to grip the needle. The CALLISTO eye assistance computer system was established to show the microscopic image and display preview of OCT scans (see Figure 5). A foot pedal connected to the RESCAN700 was settled to relocate the scan area. We captured the needle with different poses and positions in OCT scan area on ex-vivo pig eyes. The OCT cube with resolution of 512 × 128 × 1024 voxels and a corresponding imaging spatial area of 3 × 3 × 2 millimeters, 60 OCT cubes with 7680 B-scan images were manually segmented and marked the needle pixels as the ground truth data set.
Both of the aforementioned methods were implemented on a Intel(R) Xeon(R) CPU E5-2620 v3 2.40 GHz with a GeForce GTX 980 Ti and memory of 64 GB running Ubuntu 16.04 operating system. The MF based method was implemented with OpenCV 2.4 in C++. The FCN based method used Caffe [26] framework to design network with python and the rest image processing parts were implemented also with OpenCV 2.4 in C++. We used four metrics to evaluate the performance of two methods. Let n p be the number of needle pixels in prediction, and n p be the number of needle pixels in prediction correctly. The details of the four metrics are described as follow: (1) pixel error number can be false positive (FP) needle pixels and false negative (FN) needle pixels in predicted result; (2) pixel accuracy rate equals n p / n p ; (3) The average bounding box absence rate indicates the degree of missing needle segment in B-scan image; (4) The width error of bounding box influences the further needle dimension analysis.

3.2. Results

Among 60 OCT cubes, 40 OCT cubes with 5120 images are applied to training the proposed network, while the rest 20 OCT cubes are used to verify the CNN network meanwhile giving a comparison with the MF based method. The needle in each cube has different pose and position, but all B-scan image sequences follow a pattern of no needle appearance to needle appearance since the needle appearance is always continuous. In order to make the segmentation result of each cube comparable, we mapped all indexes of B-scan images in one cube into three piecewise intervals with the increasing index, (1) no needle above the tissue, (2) needle appearance, and (3) needle above the tissue but out of OCT image range thus reflection exists. All indexes of B-scan images were mapped such that 0–25% is the first interval, 25–75% is the second interval and 75–100% is the third interval. Therefore, in case in an OCT cube the index for the first needle appearance image (taken from the ground truth) is at 50 and the index for needle end image is at 100, the currently evaluated image has an index of 60, and its metrics information will be at 25 % + ( 60 50 ) / ( 100 50 ) = 45 % . The metrics for this image are then sorted into buckets of 2 % and the values are averaged over other images’ metrics value in the given bucket.
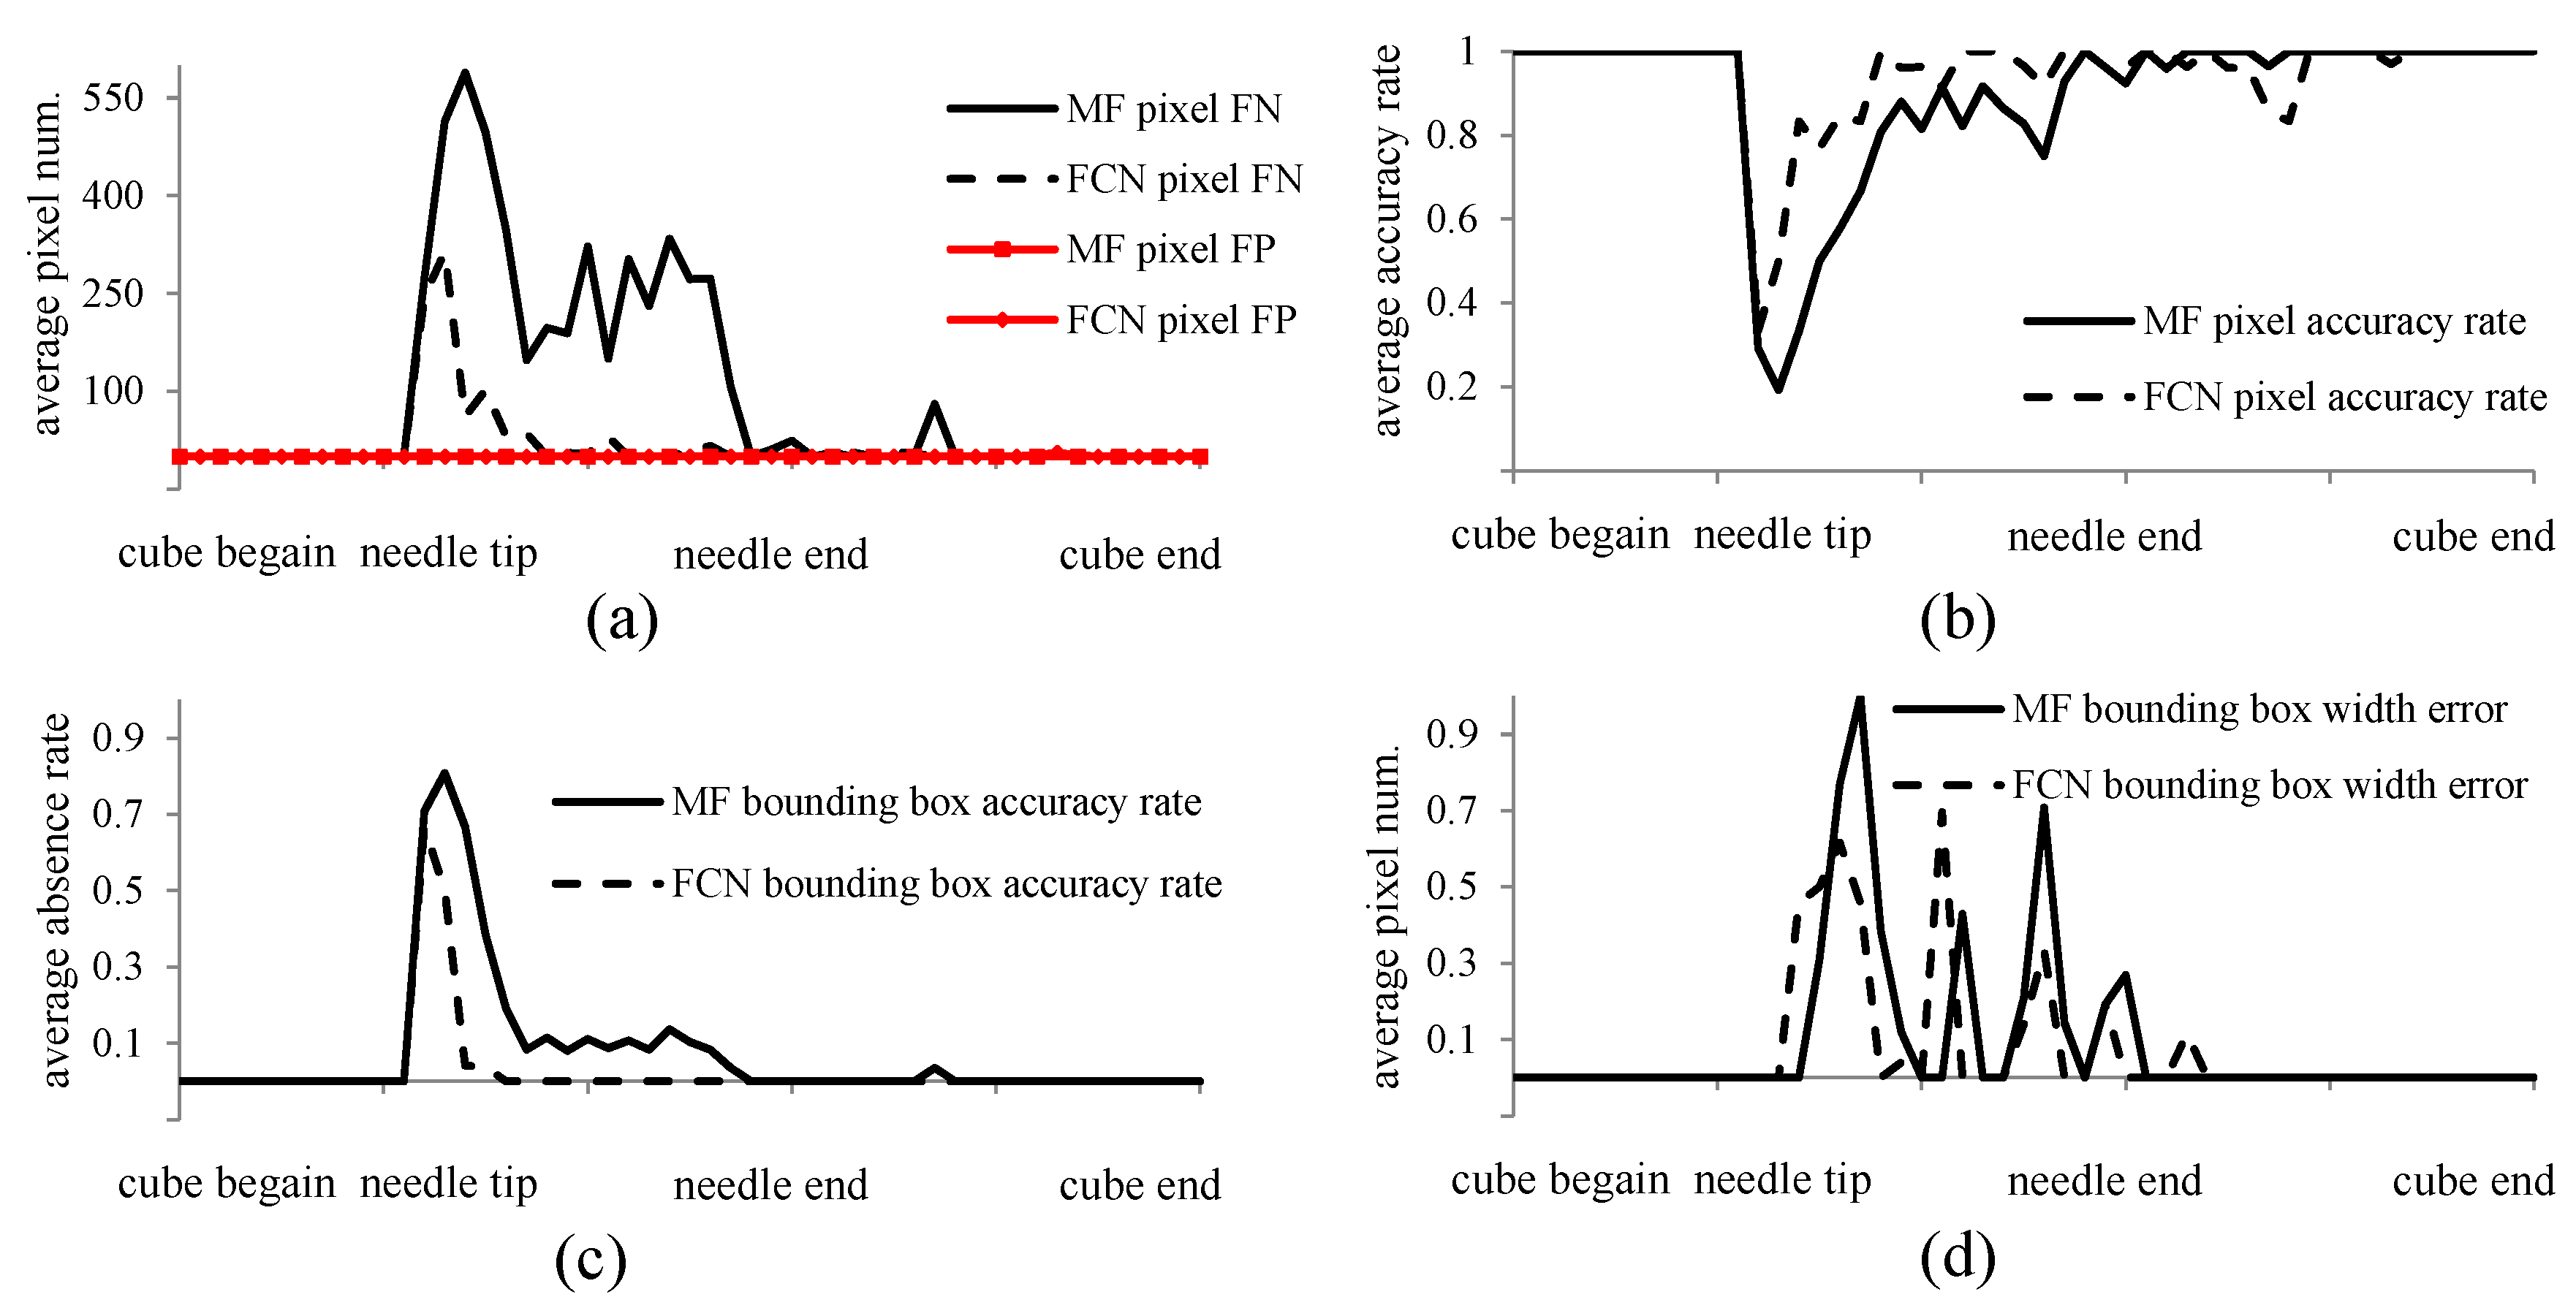
The evaluation of two methods under four metrics is shown in Figure 6. Figure 6a shows the comparison of FN and FP for the average needle pixel number using two methods. The average pixel number of FP for MF and FCN is almost equal to 0 which means that few background pixels are classified as needle points. For the performance of average pixel number for FN, both methods have problems with recognition at the beginning of the needle. This artifact is probably caused by unclear shadow of the small needle tip segmentation. However, the FCN performs better than the MF which indicates fewer needle pixels are incorrectly classified to the background. The overall average FN pixel number for two methods are 187.2 and 34.1, respectively. Especially, the FCN can almost segment all of the needle pixels for the needle body part. Figure 6b shows the accuracy rate of needle pixel for two methods, which further indicates that the beginning of needle tip part has a low accuracy rate with 0.19 and 0.33 for MF and FCN, respectively. Both methods give an acceptable accuracy rate during the needle body, while FCN has a better accuracy rate. The comparison of detection accuracy rate for bounding box is shown in Figure 6c. The rate of missing bounding boxes for MF method is quite dramatic in the beginning with around 80 % , but rapidly drops to a steady 10 % until around the middle. Starting from the middle, almost all bounding boxes are calculated correctly. The FCN method has a similar pattern with better results. It has 66.6 % of missing bounding box rate at most for the beginning of needle tip and almost none of missing bounding box detection for the needle body part. Figure 6d gives the average width error of bounding box detection in the same level that the maximum of average width error is under 1 pixel.
We also analyze the performance results of two methods with each processing stage per B-scan image (see Table 1 and Table 2). The FCN method has a 121.83 ms average inference time while the MF method has a shorter inference time of 25.6 ms, indicating that MF method performs better for time sensitive purpose usage on the current platform. The variance of FCN method is lower than MF method as the number of operations is always the same in FCN method, revealing that the FCN method is more robust to the dataset and more general to the application.

4. Discussion

This study modified and improved two methods based on the previous work to tackle the challenges for needle segmentation in OCT images: the MF method and the FCN method. The MF based method mainly relies on the needle shadow feature which is hand-crafted by researchers. The FCN method learns the features by itself which is more efficient and less time-consuming as it avoids the cumbersome hand designing phase. The evaluation of two methods is performed with 60 OCT cubes using 7680 B-scan images captured on ex-vivo pig eyes. The experimental results show that FCN method has a better segmentation performance in terms of four evaluation metrics than the MF method. Specifically, the overall average FN needle pixel number is 187.2, and 34.1; the average needle pixel accuracy rate is 90.0 % , and 94.7 % ; the average bounding box accuracy rate is 92.5 % , and 97.6 % and average pixels error for bounding box is 0.09, and 0.07; for the MF method and FCN method, respectively. Although this study is not targeting on obtaining the highest performance by tunning the FCN network, Our results elucidate that deep learning method indeed generates a powerful model on our small dataset. A future direction is indicated to try different deep learning methods and record more training data. Regarding the runtime, the average inference time of the MF method is four times shorter than FCN method, that is 25.6 ms, and 121.83 ms, respectively. The MF method is a good choice when real-time information is required. The inference time of FCN method can also be improved using parallel programme on more advanced GPU platform. It is possible to get a balance between efficiency and complexity by fusing these two methods together. It is also worth to note that the variance of total inference time for FCN method is lower than MF method for the number of operations in FCN remaining the same in different input images.
Although both methods achieve an average needle pixel accuracy rate above 90.0 % , they have problems on segmenting the needle tips, especially for the very beginning part. A potential reason is that the tiny needle segments in B-scan, the image noise as well as the shadows caused by light diffraction principle can be easily mixed with each other. There is a clear improvement from FCN method on the performance for the needle body part, showing almost perfect segmentation results. This also indicates that our future work should focus on improving the needle segmentation performance on the tiny needle tips.

5. Conclusions

We studied the first step of obtaining the needle point cloud for needle pose and position estimation: the needle segmentation in OCT images. We proposed two methods: a conventional needle segmentation method based on morphological features and a fully convolutional neural networks method. These are two typical machine learning methods in image segmentation, manually feature designing based method (MF method) and automatically feature learning based method (FCN method). We analyzed our evaluation results based on the segmentation performance and runtime requirement. Two important insights from our experiments are that the deep learning method generates the discriminative model very well and conventional machine learning method can achieve real-time performance very easily. We believe that our work and insights will be highly helpful and can be referenced as a fundamental work for future needle segmentation research in OCT images. It is also worth to note that the FCN method can segment not only the surgical tools and but also the retinal tissue, which provides additional information to guide the positioning of the surgical tools, such as an alarm warning on the distance between the tool and underlying retinal tissue.
In future, we would like to collect more data and apply the state-of-the-art deep learning model on them. Moreover, we will build up a specific tiny needle tip recognition model in order to overcome the shortness in current performance. A future design can integrate two methods to speed up the processing with better performance. The conventional method could detect the indexes of B-scan images with needle preliminarily in a short time, and then the deep learning is used to segment these B-scan images accurately.

Acknowledgments

Part of the research leading to these results has received funding from the European Union Research and Innovation Programme Horizon 2020 (H2020/2014–2020) under grant agreement No. 720270 (Human Brain Project), and also supported by the German Research Foundation (DFG) and the Technical University of Munich (TUM) in the framework of the Open Access Publishing Program. The authors would like to thank Carl Zeiss Meditec AG. for providing the opportunity to use their ophthalmic imaging devices and Simon Schlegl for part of code contributions.

Author Contributions

M.Z. proposed the idea, designed the experiments and wrote the paper; H.R. performed the experiments; A.E. provided OCT imaging devices and experimental suggestions; G.C. and K.H. provided computation hardware support and suggestions; M.M. and C.P.L. gave the surgical knowledge and experience; A.K. gave the helpful feedback and supported the research. M.A.N. provided experimental materials and designed the experiments.

Conflicts of Interest

The authors declare no conflict of interest.

References

  1. World Health Organization (WHO). Towards Universal Eye Health: A Global Action Plan 2014 to 2019 Report; WHO: Geneva, Switzerland, 2013. [Google Scholar]
  2. Rizzo, S.; Patelli, F.; Chow, D. Vitreo-Retinal Surgery: Progress III; Springer: New York, NY, USA, 2008. [Google Scholar]
  3. Nakano, T.; Sugita, N.; Ueta, T.; Tamaki, Y.; Mitsuishi, M. A parallel robot to assist vitreoretinal surgery. Int. J. Comput. Assist. Radiol. Surg. 2009, 4, 517–526. [Google Scholar] [CrossRef] [PubMed]
  4. Wei, W.; Goldman, R.; Simaan, N.; Fine, H.; Chang, S. Design and theoretical evaluation of micro-surgical manipulators for orbital manipulation and intraocular dexterity. In Proceedings of the 2007 IEEE International Conference on Robotics and Automation, Roma, Italy, 10–14 April 2007; pp. 3389–3395. [Google Scholar]
  5. Bynoe, L.A.; Hutchins, R.K.; Lazarus, H.S.; Friedberg, M.A. Retinal endovascular surgery for central retinal vein occlusion: Initial experience of four surgeons. Retina 2005, 25, 625–632. [Google Scholar] [CrossRef] [PubMed]
  6. Li, Y.; Chen, C.; Huang, X.; Huang, J. Instrument tracking via online learning in retinal microsurgery. In Proceedings of the International Conference on Medical Image Computing and Computer-Assisted Intervention, Boston, MA, USA, 14–18 September 2014; Springer: Cham, Switzerland, 2014; pp. 464–471. [Google Scholar]
  7. Rieke, N.; Tan, D.J.; Alsheakhali, M.; Tombari, F.; di San Filippo, C.A.; Belagiannis, V.; Eslami, A.; Navab, N. Surgical tool tracking and pose estimation in retinal microsurgery. In Proceedings of the International Conference on Medical Image Computing and Computer-Assisted Intervention, Munich, Germany, 5–9 October 2015; Springer: Cham, Switzerland, 2015; pp. 266–273. [Google Scholar]
  8. Sznitman, R.; Ali, K.; Richa, R.; Taylor, R.H.; Hager, G.D.; Fua, P. Data-driven visual tracking in retinal microsurgery. In Proceedings of the International Conference on Medical Image Computing and Computer-Assisted Intervention, Nice, France, 1–5 October 2012; Springer: Berlin, Germany; New York, NY, USA, 2012; pp. 568–575. [Google Scholar]
  9. Kwoh, Y.S.; Hou, J.; Jonckheere, E.A.; Hayati, S. A robot with improved absolute positioning accuracy for CT guided stereotactic brain surgery. IEEE Trans. Biomed. Eng. 1988, 35, 153–160. [Google Scholar] [CrossRef] [PubMed]
  10. McDannold, N.; Clement, G.; Black, P.; Jolesz, F.; Hynynen, K. Transcranial MRI-guided focused ultrasound surgery of brain tumors: Initial findings in three patients. Neurosurgery 2010, 66, 323. [Google Scholar] [CrossRef] [PubMed]
  11. McVeigh, E.R.; Guttman, M.A.; Lederman, R.J.; Li, M.; Kocaturk, O.; Hunt, T.; Kozlov, S.; Horvath, K.A. Real-time interactive MRI-guided cardiac surgery: Aortic valve replacement using a direct apical approach. Magn. Reson. Med. 2006, 56, 958–964. [Google Scholar] [CrossRef] [PubMed]
  12. Vrooijink, G.J.; Abayazid, M.; Misra, S. Real-time three-dimensional flexible needle tracking using two-dimensional ultrasound. In Proceedings of the 2013 IEEE International Conference on Robotics and Automation (ICRA), Karlsruhe, Germany, 6–10 May 2013; pp. 1688–1693. [Google Scholar]
  13. Yasui, K.; Kanazawa, S.; Sano, Y.; Fujiwara, T.; Kagawa, S.; Mimura, H.; Dendo, S.; Mukai, T.; Fujiwara, H.; Iguchi, T.; et al. Thoracic Tumors Treated with CT-guided Radiofrequency Ablation: Initial Experience 1. Radiology 2004, 231, 850–857. [Google Scholar] [CrossRef] [PubMed]
  14. Lam, T.T.; Miller, P.; Howard, S.; Nork, T.M. Validation of a Rabbit Model of Choroidal Neovascularization Induced by a Subretinal Injection of FGF-LPS. Investig. Ophthalmol. Vis. Sci. 2014, 55, 1204. [Google Scholar]
  15. Huang, D.; Swanson, E.A.; Lin, C.P.; Schuman, J.S.; Stinson, W.G.; Chang, W.; Hee, M.R.; Flotte, T.; Gregory, K.; Puliafito, C.A.; et al. Optical coherence tomography. Science 1991, 254, 1178. [Google Scholar] [CrossRef]
  16. Ehlers, J.P.; Srivastava, S.K.; Feiler, D.; Noonan, A.I.; Rollins, A.M.; Tao, Y.K. Integrative advances for OCT-guided ophthalmic surgery and intraoperative OCT: Microscope integration, surgical instrumentation, and heads-up display surgeon feedback. PLoS One 2014, 9, e105224. [Google Scholar] [CrossRef] [PubMed]
  17. Ehlers, J.P.; Tao, Y.K.; Srivastava, S.K. The Value of Intraoperative OCT Imaging in Vitreoretinal Surgery. Curr. Opin. Ophthalmol. 2014, 25, 221. [Google Scholar] [CrossRef] [PubMed]
  18. Adebar, T.K.; Fletcher, A.E.; Okamura, A.M. 3-D ultrasound-guided robotic needle steering in biological tissue. IEEE Trans. Biomed. Eng. 2014, 61, 2899–2910. [Google Scholar] [CrossRef] [PubMed]
  19. Viehland, C.; Keller, B.; Carrasco-Zevallos, O.M.; Nankivil, D.; Shen, L.; Mangalesh, S.; Viet, D.T.; Kuo, A.N.; Toth, C.A.; Izatt, J.A. Enhanced volumetric visualization for real time 4D intraoperative ophthalmic swept-source OCT. Biomed. Opt. Express 2016, 7, 1815–1829. [Google Scholar] [CrossRef] [PubMed]
  20. Zhang, K.; Kang, J.U. Real-time 4D signal processing and visualization using graphics processing unit on a regular nonlinear-k Fourier-domain OCT system. Opt. Express 2010, 18, 11772–11784. [Google Scholar] [CrossRef] [PubMed]
  21. El-Haddad, M.T.; Ehlers, J.P.; Srivastava, S.K.; Tao, Y.K. Automated real-time instrument tracking for microscope-integrated intraoperative OCT imaging of ophthalmic surgical maneuvers. Proceedings of SPIE BiOS. International Society for Optics and Photonics, San Francisco, CA, USA, 7 February 2015; p. 930707. [Google Scholar]
  22. Roodaki, H.; Filippatos, K.; Eslami, A.; Navab, N. Introducing augmented reality to optical coherence tomography in ophthalmic microsurgery. In Proceedings of the 2015 IEEE International Symposium on Mixed and Augmented Reality (ISMAR), Fukuoka, Japan, 29 September–3 October 2015; pp. 1–6. [Google Scholar]
  23. Long, J.; Shelhamer, E.; Darrell, T. Fully convolutional networks for semantic segmentation. In Proceedings of the IEEE Conference on Computer Vision and Pattern Recognition, Boston, MA, USA, 7–12 June 2015; pp. 3431–3440. [Google Scholar]
  24. Ahlers, C.; Simader, C.; Geitzenauer, W.; Stock, G.; Stetson, P.; Dastmalchi, S.; Schmidt-Erfurth, U. Automatic segmentation in three-dimensional analysis of fibrovascular pigmentepithelial detachment using high-definition optical coherence tomography. Br. J. Ophthalmol. 2008, 92, 197–203. [Google Scholar] [CrossRef] [PubMed]
  25. Milletari, F.; Navab, N.; Ahmadi, S.A. V-net: Fully convolutional neural networks for volumetric medical image segmentation. In Proceedings of the 2016 Fourth International Conference on 3D Vision (3DV), Stanford, CA, USA, 25–28 October 2016; pp. 565–571. [Google Scholar]
  26. Jia, Y.; Shelhamer, E.; Donahue, J.; Karayev, S.; Long, J.; Girshick, R.; Guadarrama, S.; Darrell, T. Caffe: Convolutional Architecture for Fast Feature Embedding. arXiv, 2014; arXiv:1408.5093. [Google Scholar]
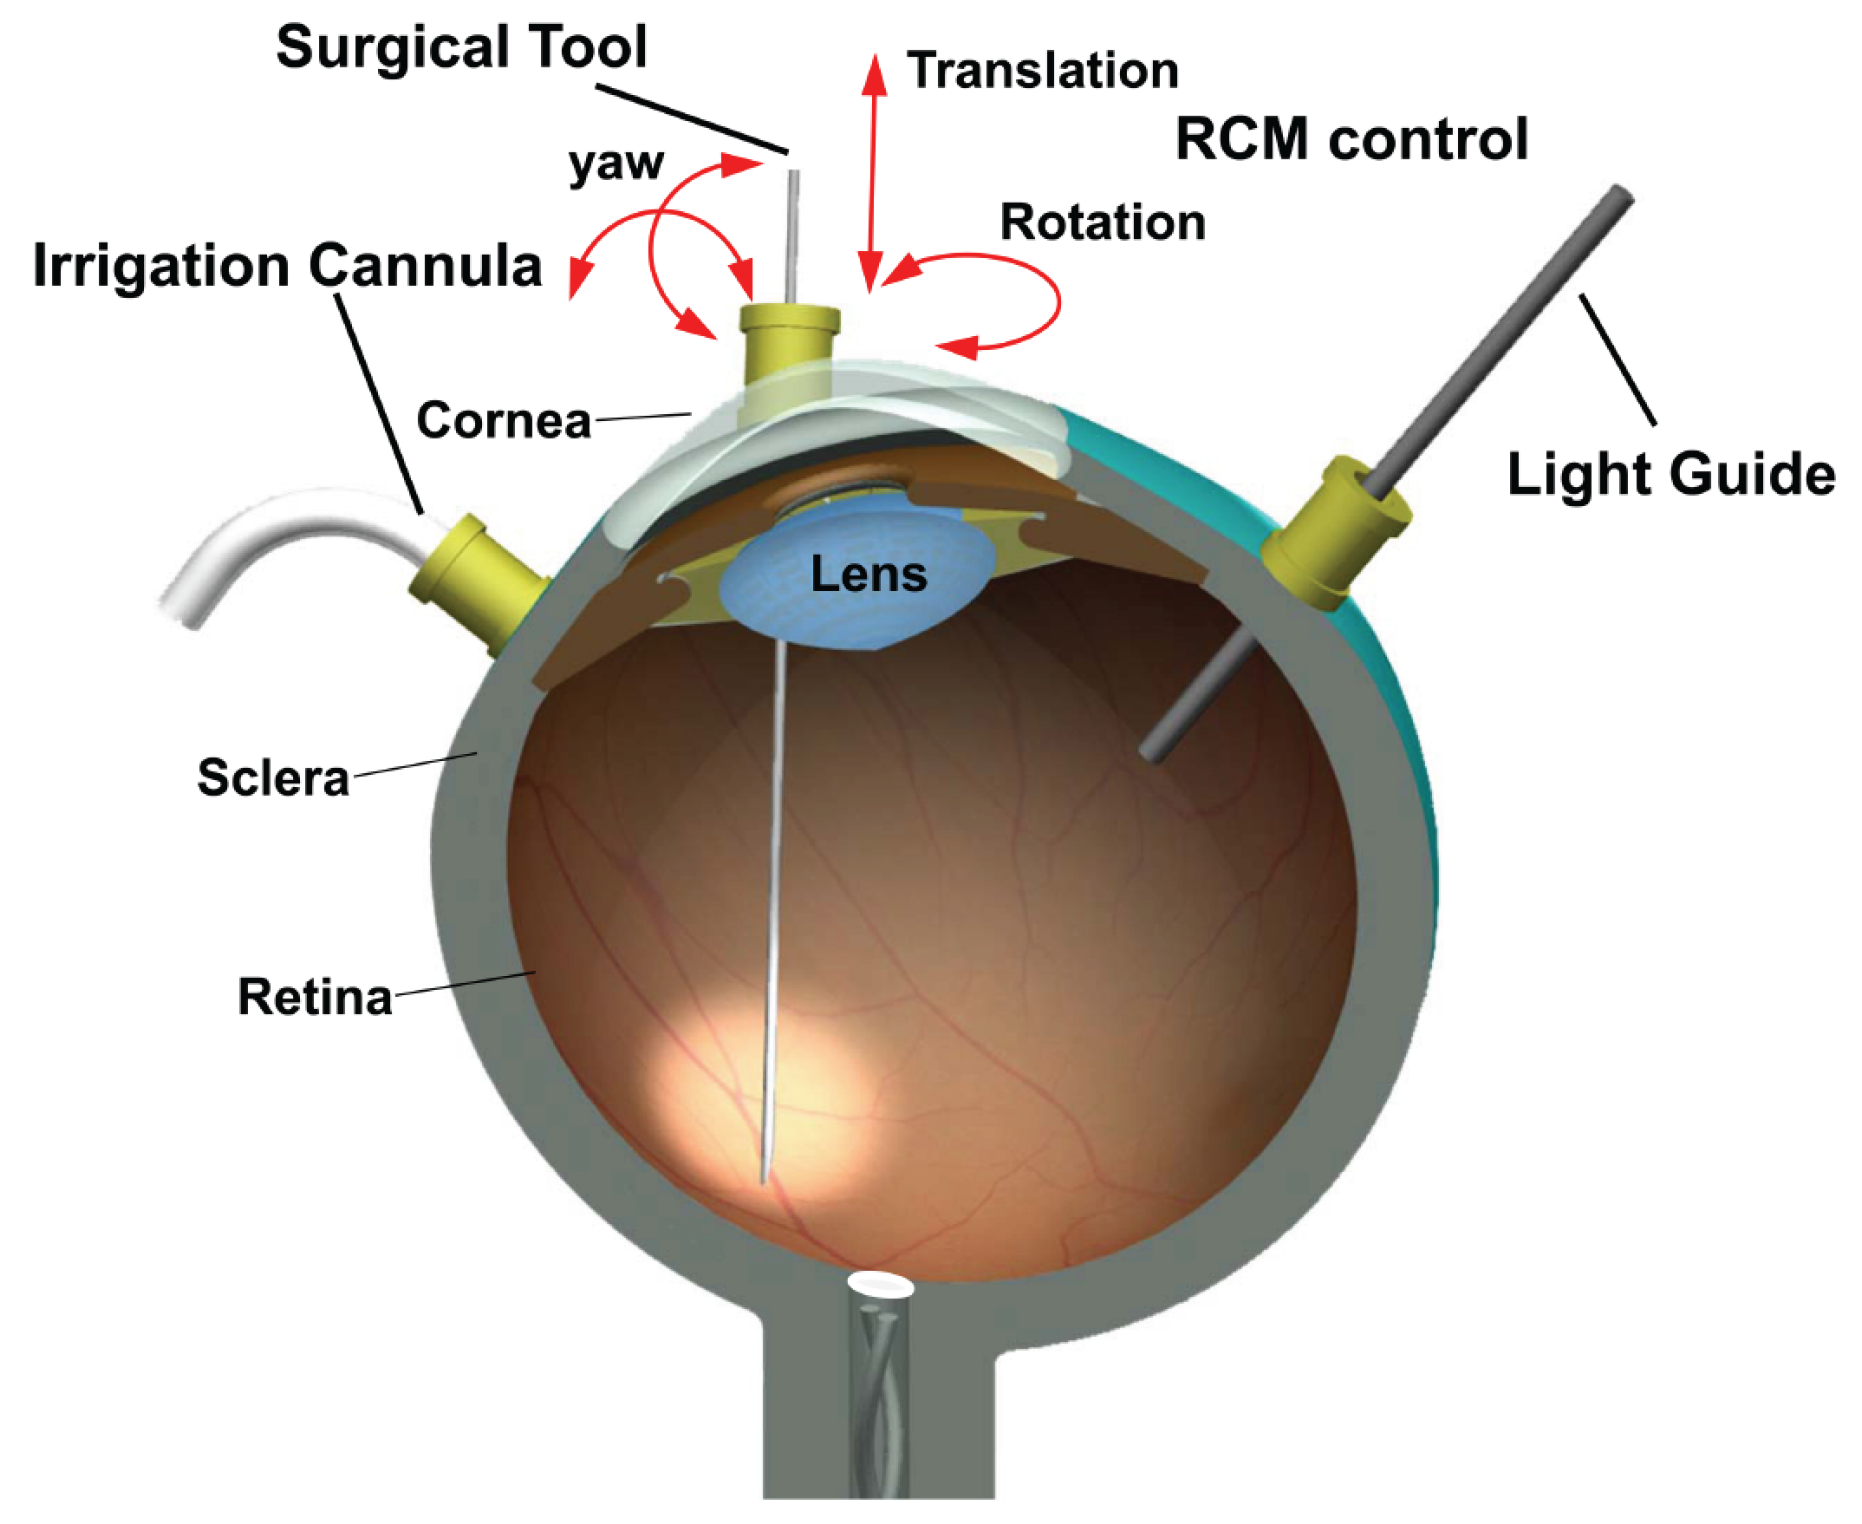
Figure 1. Description of a conventional ophthalmic microsurgery.
Applsci 07 00748 g001
Figure 2. The schematic diagram of needle segmentation in an Optical Coherence Tomography (OCT) cube. (a) The needle in OCT cube; (b) The microscopic image of the needle with ex-vivo pig eyes (the white box indicates the OCT scan area); (c) The output of B-scan sequence; (d) The needle (yellow) and background (gray) segmentation point cloud.
Applsci 07 00748 g002
Figure 3. The different patterns of needle seen in OCT B-scan (The needle fragments are labeled with yellow bounding box). Form (a) is the needle tip without clear shadow. Since this part of the object is too small, the result of light diffraction leads to unclear shadow on the background. (b) shows the needle tip with clear shadow. In this form the needle is downwards-beveled that can be seen as a single fragment piece in the OCT B-scan. In form (c) the needle body has clear shadow. In forms (d,e) several needle tip fragments with clear shadows can be seen here the needle is upwards-beveled; (f) shows the needle refraction fragment in this form the needle is out of OCT image range with a clear refraction in B-scan image.
Applsci 07 00748 g003
Figure 4. The architecture of full convolution neural networks (FCN) based needle segmentation method.
Applsci 07 00748 g004
Figure 5. The experimental setup of ophthalmic microsurgery on ex-vivo pig eyes. The micro-manipulator is designed to grasp the syringe and place the needle close to the eye tissue. The CALLISTO eye assistance computer system is set up to display the en-face microscopic image and cross sectional images of OCT cube.
Applsci 07 00748 g005
Figure 6. The accuracy performance of FCN and MF based methods. (a) Comparison of false negative (FN) and false positive (FP) for the average number needle pixels using two methods; (b) Comparison of average accuracy rate of needle pixels using two methods; (c) Comparison of average absence rate of bounding box using two methods; (d) Comparison of average pixels error for width of bounding box using two methods.
Applsci 07 00748 g006
Table 1. MF method inference time.
StageMean (ms)Variance (ms)
Loading0.710.10
Filtering7.872.22
Detection17.0220.55
Total25.622.6
Table 2. FCN method inference time.
StageMean (ms)Variance (ms)
Loading0.720.11
CNN97.464.67
Fusion6.630.38
Total121.834.91