1. Introduction
Artificial neural networks (ANN), computational modelling tools, have found wide acceptance in many disciplines due to their adaptability to complex real world problems.
ANNs have demonstrated their ability to model non-linear physics systems [
1], involving complex physical behaviors, and were applied to the analysis of remotely sensed images with promising results. Some examples of applications are: retrieval of soil moisture and agricultural variables from microwave radiometry [
2], estimation of snow water equivalent and snow water depth from microwave images [
3], retrieval of leaf area index (LAI) and other biophysical variables from the MEdium Resolution Imaging Spectrometer (MERIS) and MODerate-resolution Imaging Spectroradiometer (MODIS) instruments [
4], estimation of chlorophyll from MERIS [
5], retrieval of volcanic ash and sulphur dioxide from hyperspectral data [
6]. ANNs are also used, with good results, for rainfall prediction involving other geophysical data [
7,
8].
Since an earthquake usually acts in a nonlinear way, the neural network algorithm can be an appropriate method for damage estimation purposes since it demonstrated to be a good non-linear approximator [
9]. Recently, ANNs have been applied to detect damaged buildings, following an earthquake, by using high spatial resolution optical images acquired after the seismic event [
10]. A neural network based-approach is being implemented to assess the status of buildings after earthquake excitation, predicting the displacement at different floors considering the wave energy propagating only into the ground floor [
11].
By using change features from satellite images, accurate and reliable damage mapping can be obtained, exploiting both optical and radar sensors [
12,
13,
14]. In Romaniello et al., 2016, an unsupervised algorithm for damage classification purposes has been developed [
14].
Currently, quantitative estimation of earthquake damage level as a continuous function, using an ANN, has not yet been exploited and the present study represents a first attempt at applying an ANN to both optical high resolution Sentinel-2 and Synthetic Aperture Radar (SAR) remote sensing data for collapse ratio modelling. To the best of our knowledge, the methodology based on ANN has not been utilized in modelling earthquake damage assessment.
In the present study, two different neural networks using different Earth Observation (EO) datasets have been realized in order to model, as a continuous function, building damage. The first neural network (NN) experiment used, as input, only features obtained from optical data, whilst the second one (in a data fusion approach) also the features obtained from SAR images. NDI, KLD and MI features from optical data, and ICD and KLD from SAR data were used. Regarding the SAR data, KLD and MI parameters are very suitable features that can contribute to damage estimation [
15]; the ICD demonstrated itself a very good damage proxy [
13,
16]. Concerning the optical data, the most significant performances are related to the NDI, KLD [
17], and MI indexes [
18]. These features show very good sensitivity to the collapse ratio.
The case study is the Central Italy strong earthquake, which took place on August 2016. On 24 August 2016 at 1:36 UTC, a M6.0 earthquake occurred in the Apennines of Central (hereafter Amatrice earthquake) Italy at depth 8 km, over a NNW-SSE striking, WSW dipping normal fault [
19], destroying the closest towns to the epicenter—Amatrice, Accumoli and Arquata del Tronto—and causing near 300 fatalities. This earthquake revealed the importance of a rapid earthquake damage assessment, right after a seismic event, which can address the civil protection interventions towards the most affected areas. This work allowed to quantitatively evaluate the performance of NNs in terms of CR retrieval accuracy and generalization capability.
2. Neural Network Approach and Employed Features
ANNs are based on the concept of the single artificial neuron, the ‘Perceptron’, introduced by [
20] to solve problems in the area of character recognition [
21]. Using supervised learning, with the Error-Correction Learning (ECL) rule for network weights adjustment, those networks can learn to map from one data space to another using examples [
22]. One of the most common and reliable learning techniques is the back-propagation (BP) algorithm [
23]. BP consists of two phases: in the feedforward pass, an input vector is presented to the network and propagated forward to the output; in the back-propagation phase, the network output is compared to a desired output; network weights are then adjusted in accordance with an ECL rule [
23,
24,
25]. Cross validation can be used to detect when over-fitting starts during supervised training of a neural network; training is then stopped before convergence to avoid over-fitting (early stopping). Early stopping using cross validation was done by splitting the training data into a training set, a cross-validation set, and a test set, and then training the networks only using the training set and evaluating the per-example error on the test set on a sample basis after a defined number of epochs. Finally, training was stopped when the error—the difference between neural network output and target—on the cross validation set was higher than the previous error value [
26].
The performance of a trained ANN is generally assessed by computing the root mean square error (RMSE) between expected values and activation values at the output nodes or, in the case of classification, a percentage of correctly classified examples of the validation set. At the time our study was carried out, the ground truth was unavailable for Amatrice earthquake, so a visual inspection using high resolution images has been adopted.
From studies of past literature and development activities performed in a European research project (APhoRISM,
www.aphorism-project.eu), we identified and employed a set of features that demonstrated a good sensitivity to damage at object scale. Regarding optical data, we used the NDI, KLD and MI change indexes. As far as SAR data is concerned, we considered the KLD and ICD parameters. Note that all change indexes have been calculated at object scale, i.e., by considering polygons that refer to city blocks. These latter have been extracted through the free geo-database of the Open Street Map project.
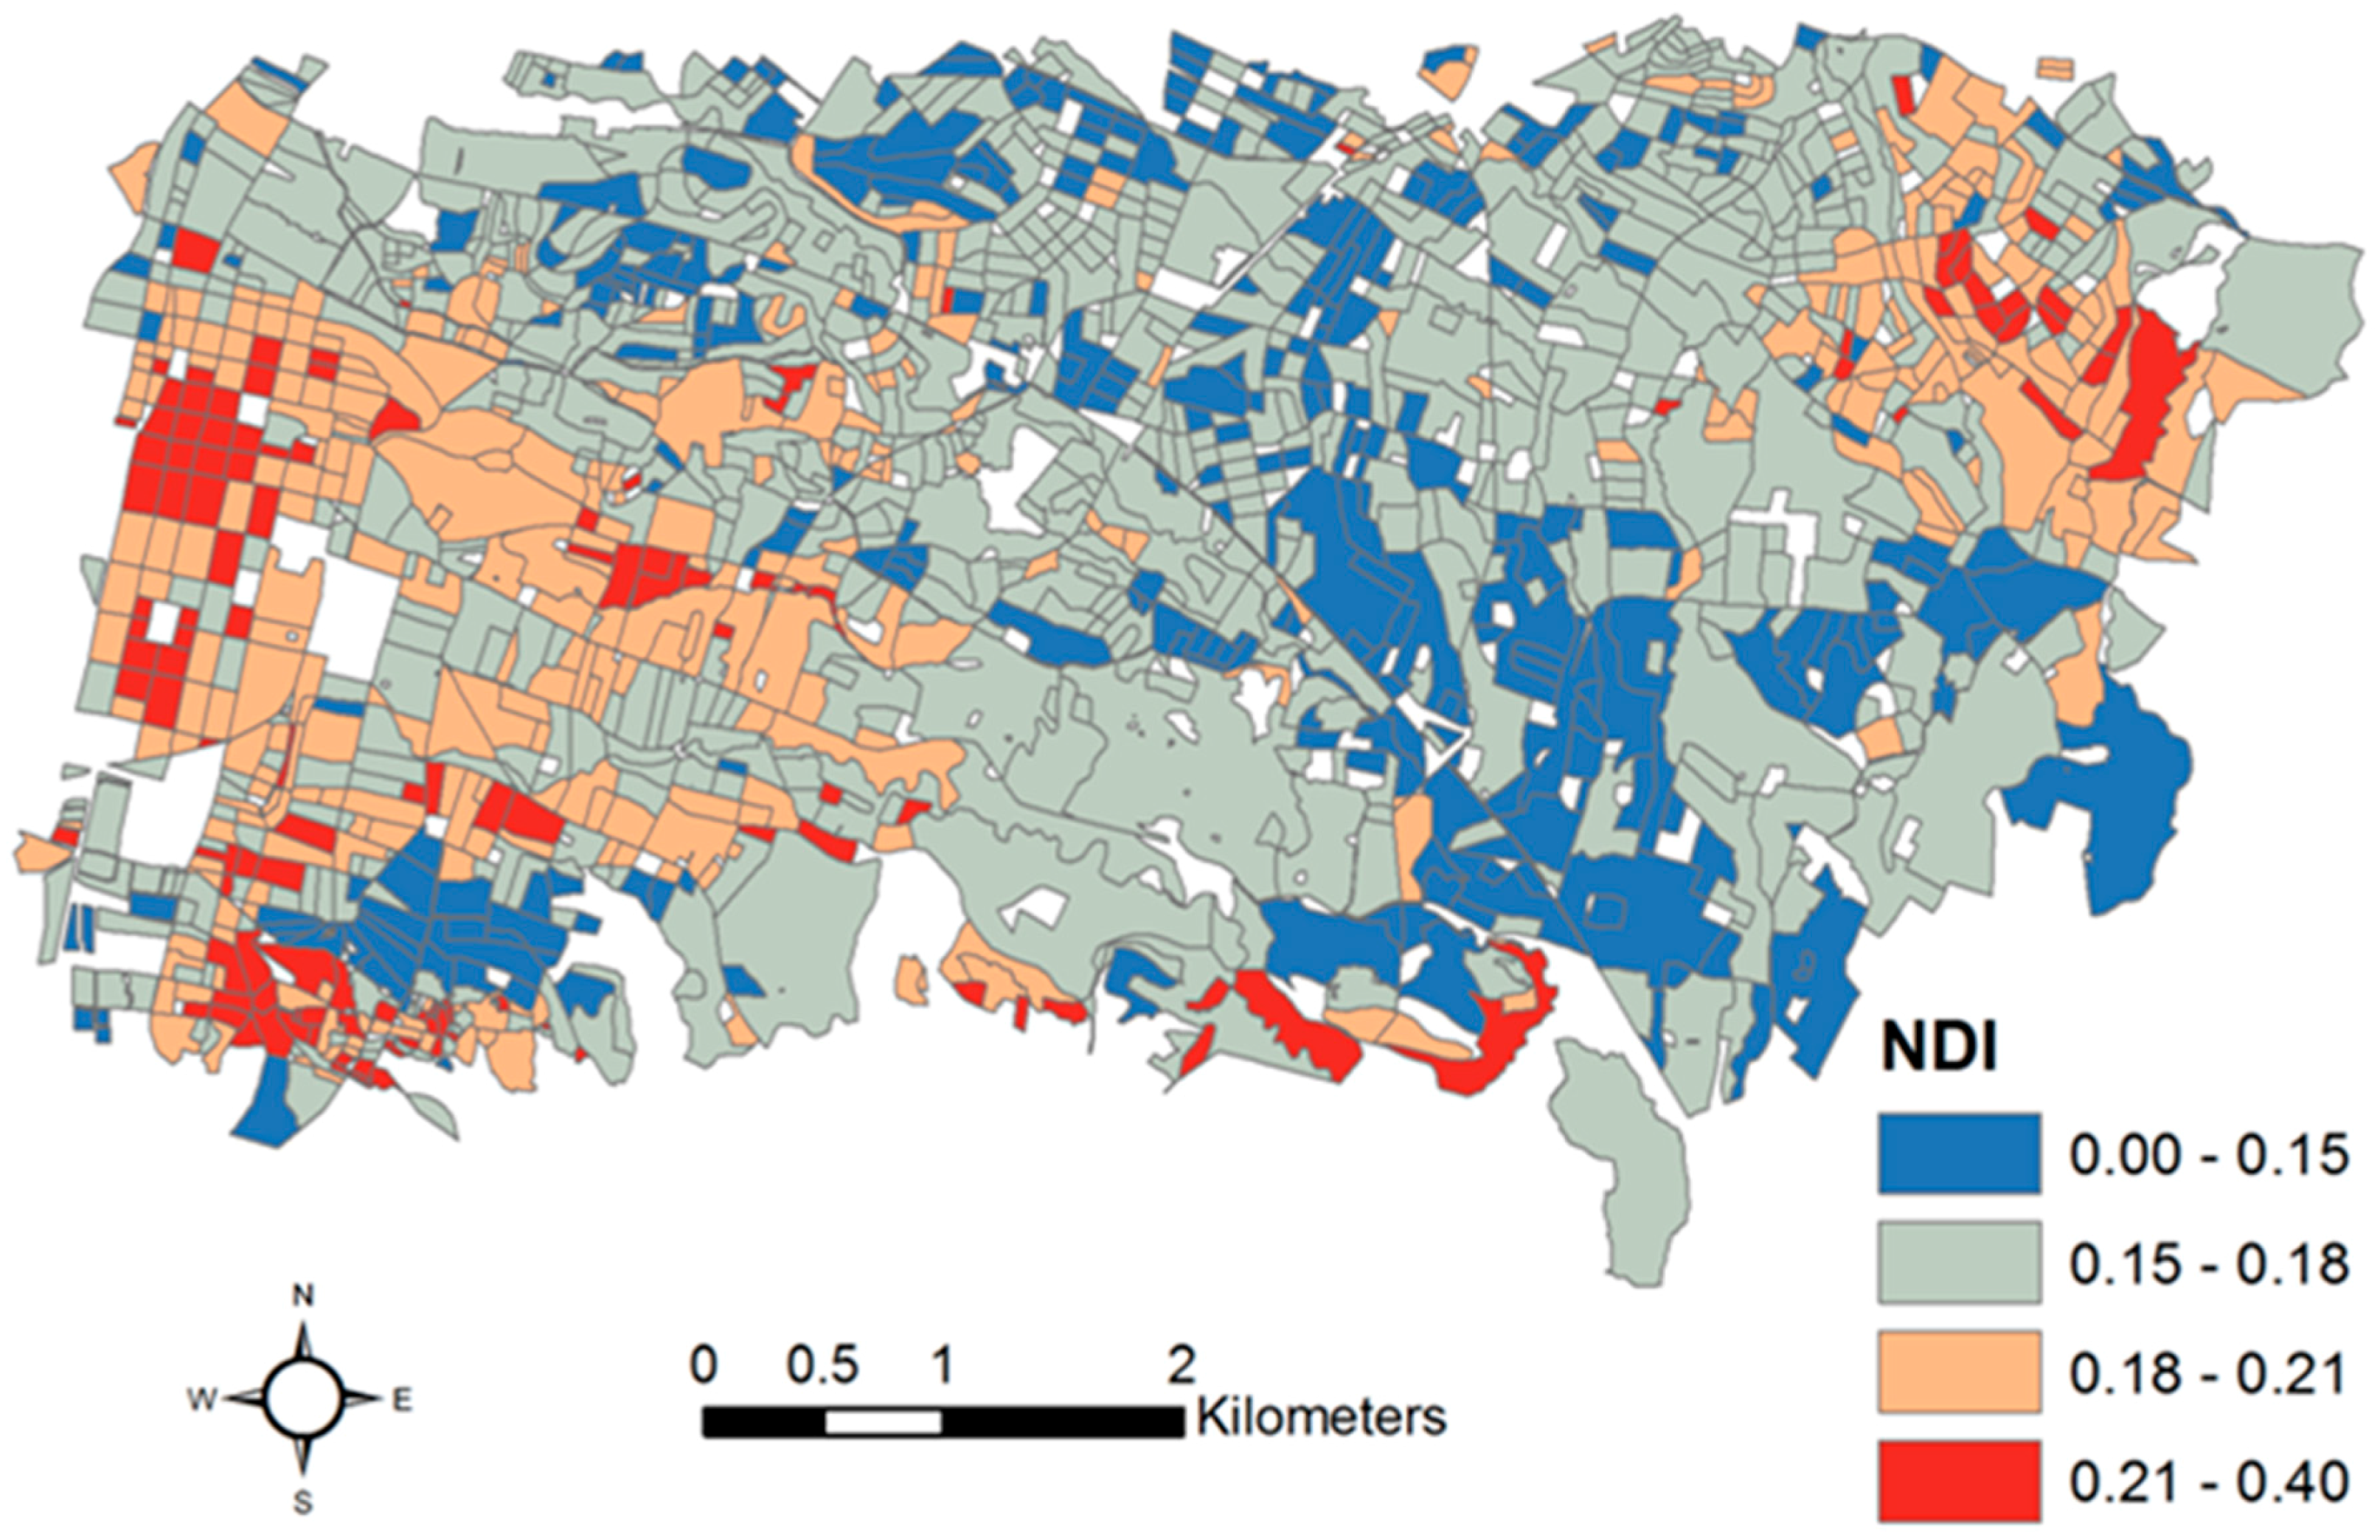
The NDI parameter is defined as
where
PREi and
POSTi indicate the mean values of intensity, respectively for pre- and post-seismic images, associated to
i-th polygon (see also Figure 2 as example). The intensity values are obtained averaging the Top of Atmosphere (TOA) Red-Green-Blue (RGB) reflectance and corrected by applying the Flat Field procedure for atmospheric correction [
27].
The MI index measures the correlation loss between pre- and post-seismic images (see Equation (2)).
where
ri2 is the correlation between the pre- and post-seismic pixels within each polygon. Correlation is obtained from intensity and backscattering values for optical and SAR data, rescpectively.
MI is inversely proportional to the damage grade.
The KLD parameter is defined as
where
PREi and
POSTi are the same parameters in the Equation (1), and
Var(
PREi) and
Var(
POSTi) are their variances within the
i-th polygon. The
KLD parameter has the same behavior of NDI: KLD increasing values correspond to increasing damage level. The ICD parameter is calculated on the base of the Pearson Correlation coefficient (
ρi) estimated on the pre-seismic SAR image pair (
ICpre) and on the co-seismic SAR image pair (
ICcos). From these two intermediate outputs, we can compute the ICD
3. Dataset and NN Training
The training case study was the Mw 7.0 earthquake that hit Haiti on 12 January 2010. The epicenter was located about 25 km west–southwest of Port-au-Prince city. The disastrous shock caused the collapse of a huge number of buildings and widespread damage.
Table 1 describes satellite dataset used which consists of GeoEye-1 optical images (one pre- and one post-seismic), and three TerraSAR-X SAR images (two pre- and one post-seismic).
Optical images inputs, both for pre- and post-, consisted of TOA reflectances at 2 m spatial resolution for RGB spectral bands; starting from these reflectances, the intensity values are derived (as described in
Section 2).
As regards SAR data, intensity images have been obtained by multi-looking 3 × 3 m TerraSAR-X applying a re-sampling at 10 × 10 m.
The computation of change indexes based on EO imagery has been performed at object scale by considering a set of polygons, extracted from the open source Open Street Map (OSM) geo-database over Port-au-Prince. A total of 1513 polygons corresponding to city blocks of the affected areas have been considered. All the features (NDI, KLD, MI and ICD) are grouped in a unique dataset necessary for the Neural Network approach.
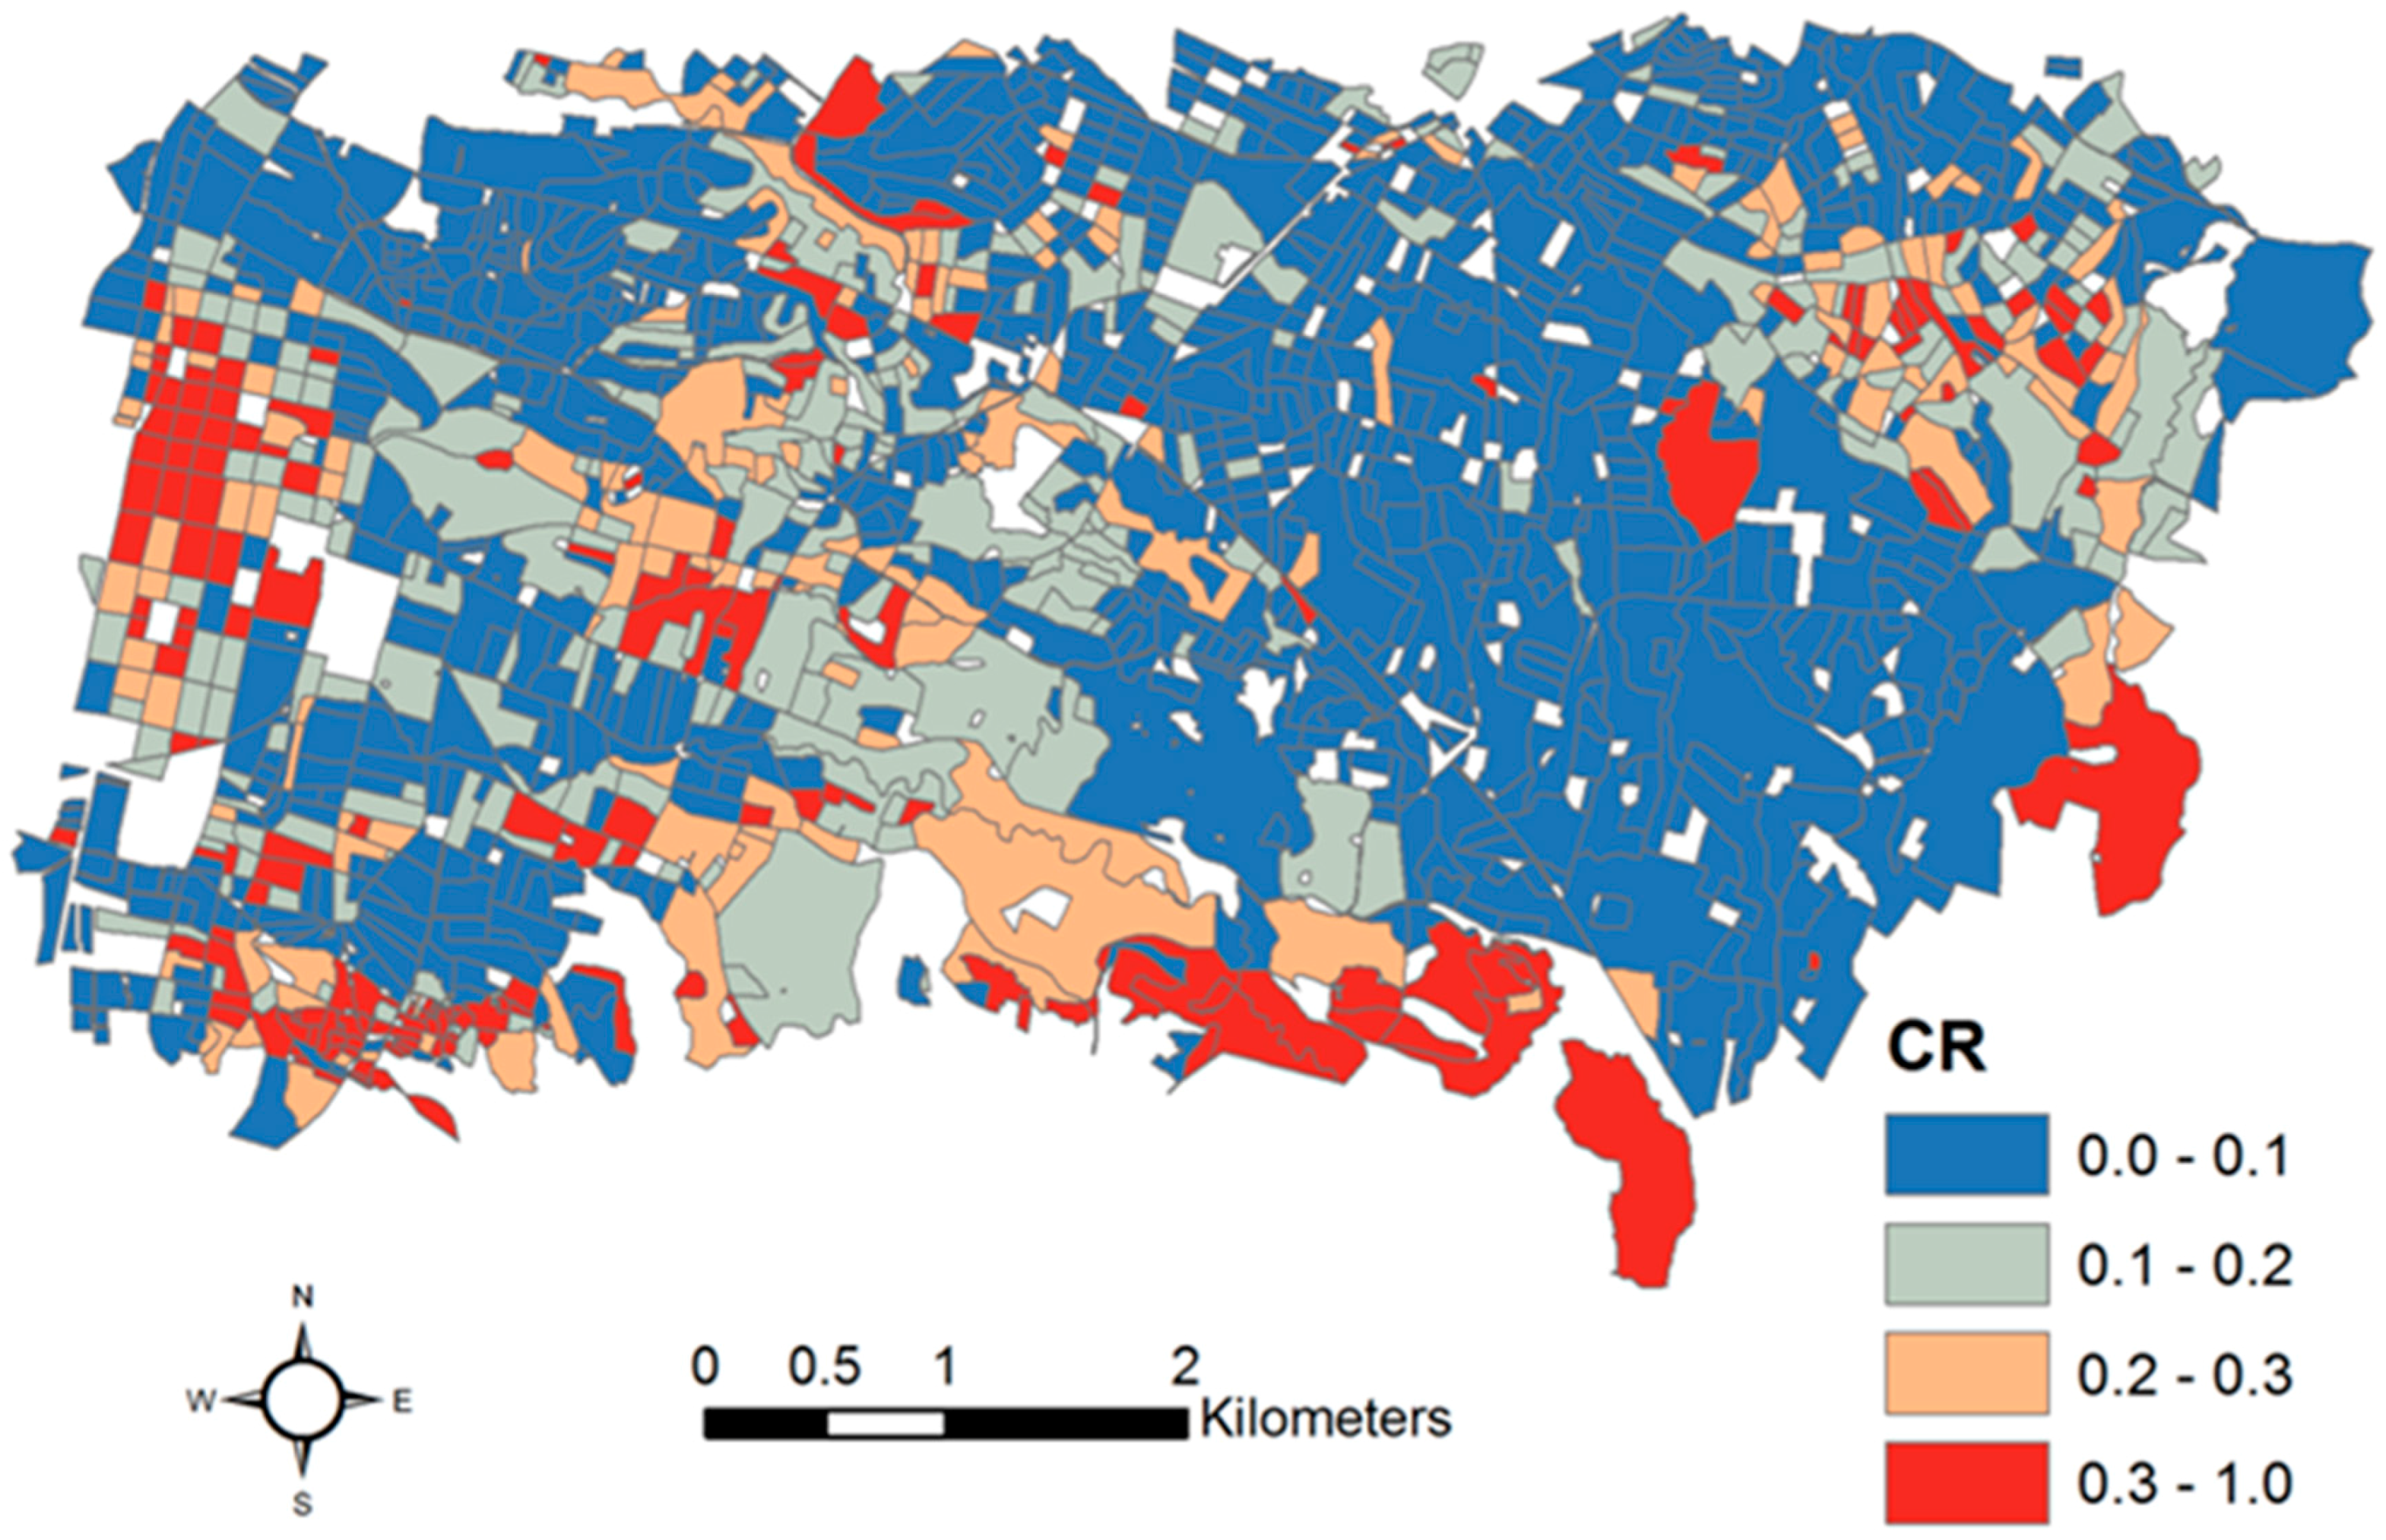
In addition to satellite data, a Ground Truth (GT) survey for Port-au-Prince town, expressed in terms of collapse ratio (CR), has been used (see
Figure 1). The CR has been calculated by using GT information collected during a post-earthquake survey and available from the JRC (Joint Research Center) database, and considering the same polygons (city blocks) used for the satellite features calculation.
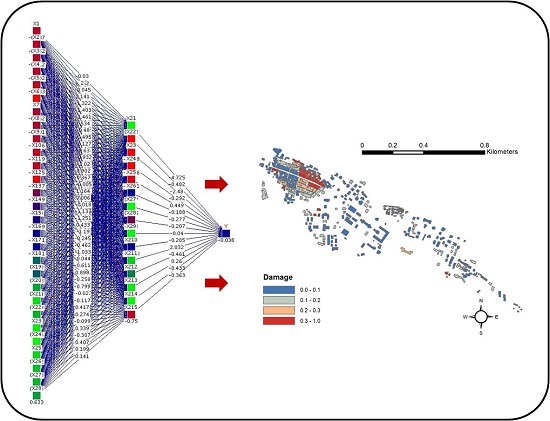
In this work, Back-Propagation Neural Network (BPNN) has been used [
23]. The BPNN to model CR was implemented using, as input, the features extracted from satellite images (see previous section, e.g., NDI in
Figure 2), and CR values as target output. The 1513 samples used for NN training were split in Training, Cross Validation, and Test datasets of 65, 20 and 15%, respectively.
A first network topology (Exp 1) consisted of only optical features as input (NDI, KLD and MI), five hidden layers with variable number of neurons [5–10–20–10–5], and one output, the CR. Furthermore, in order to perform a data fusion exercise, a different neural network using five inputs was adopted (Exp 2), adding to the optical features also the SAR ones, i.e., IC and KLD.
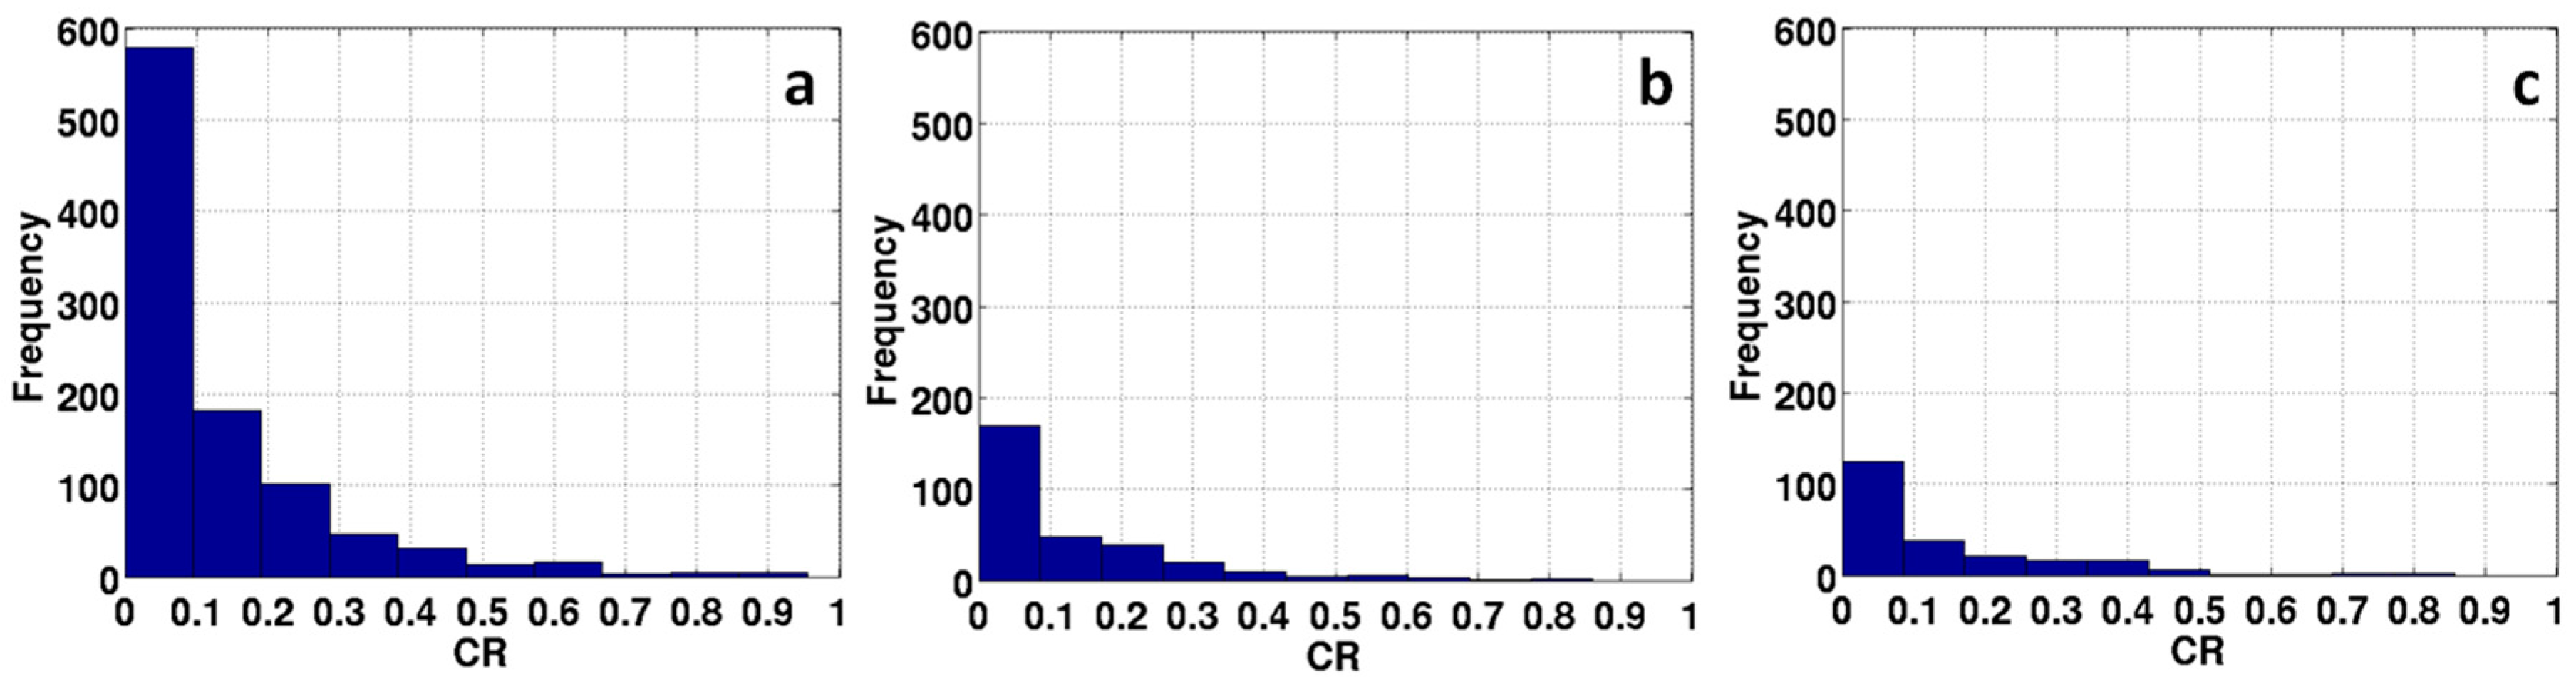
Figure 3 shows the statistical distributions for CR, train (a), cross-validation (b) and test (c) sets used during NN training phase. Despite of histograms put in evidence that values higher than 0.5 are statistically not well represented, we can consider the dataset a good training ensemble, because it covers the entire range of values.
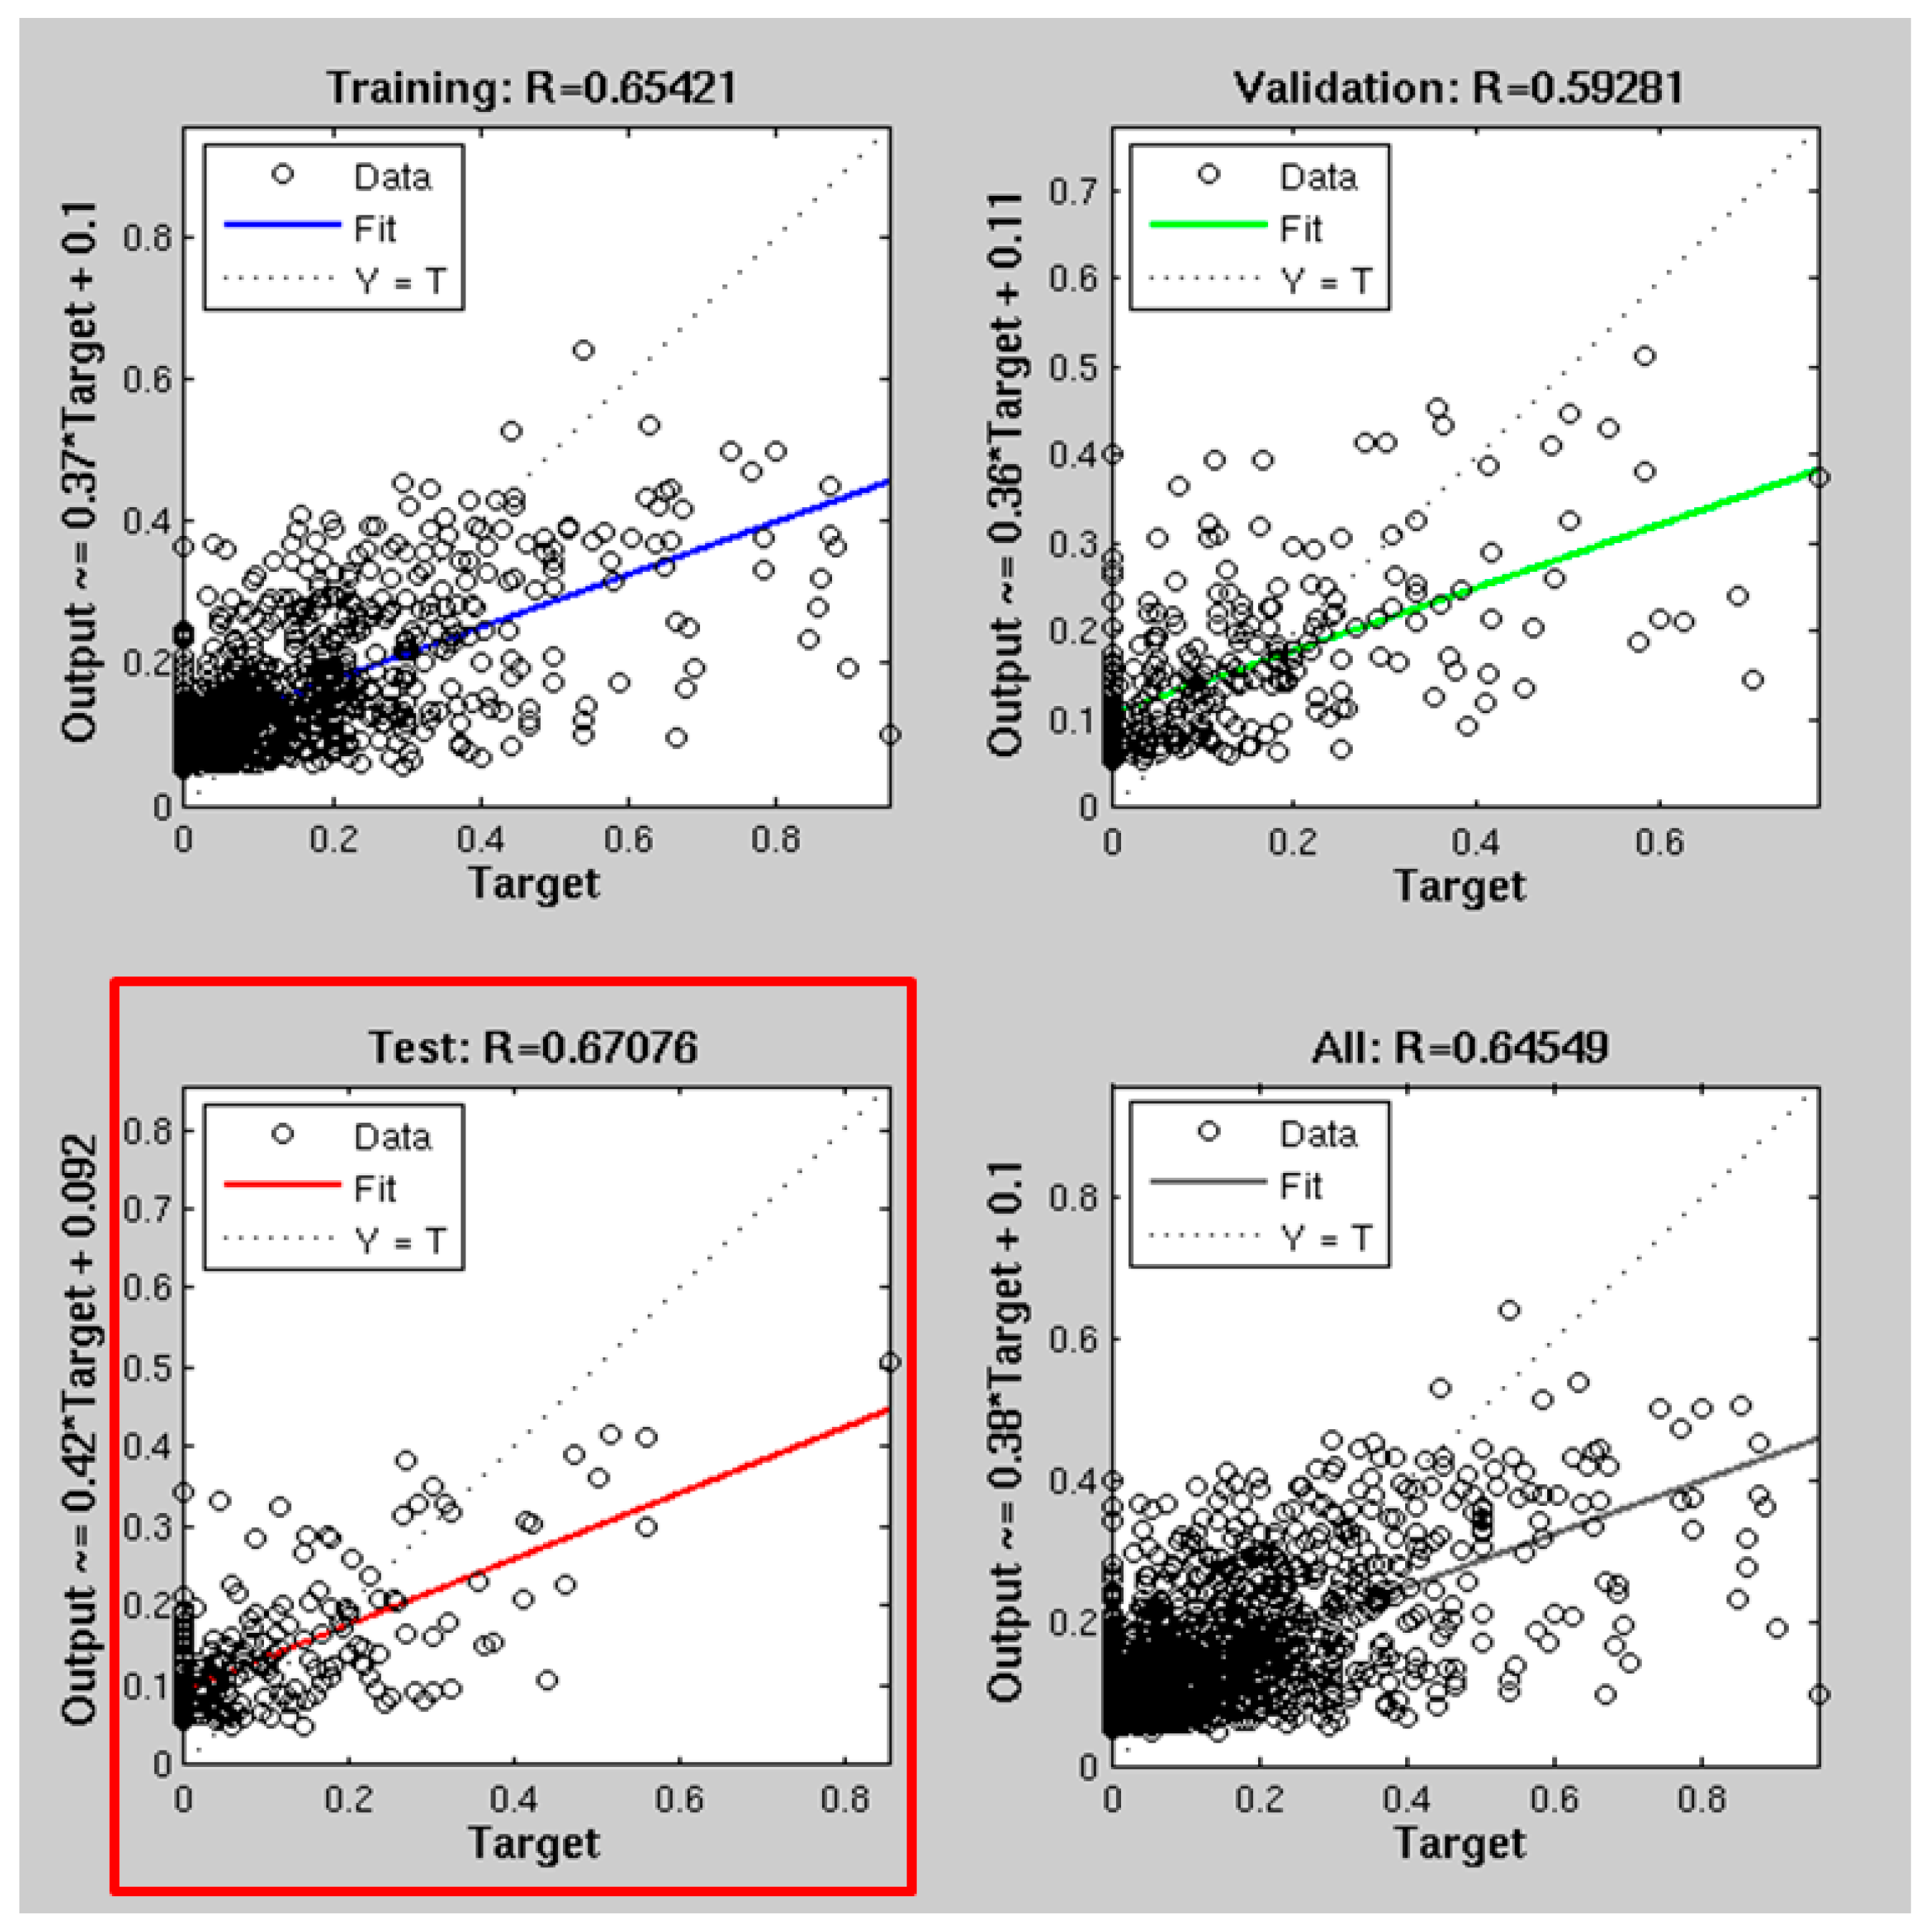
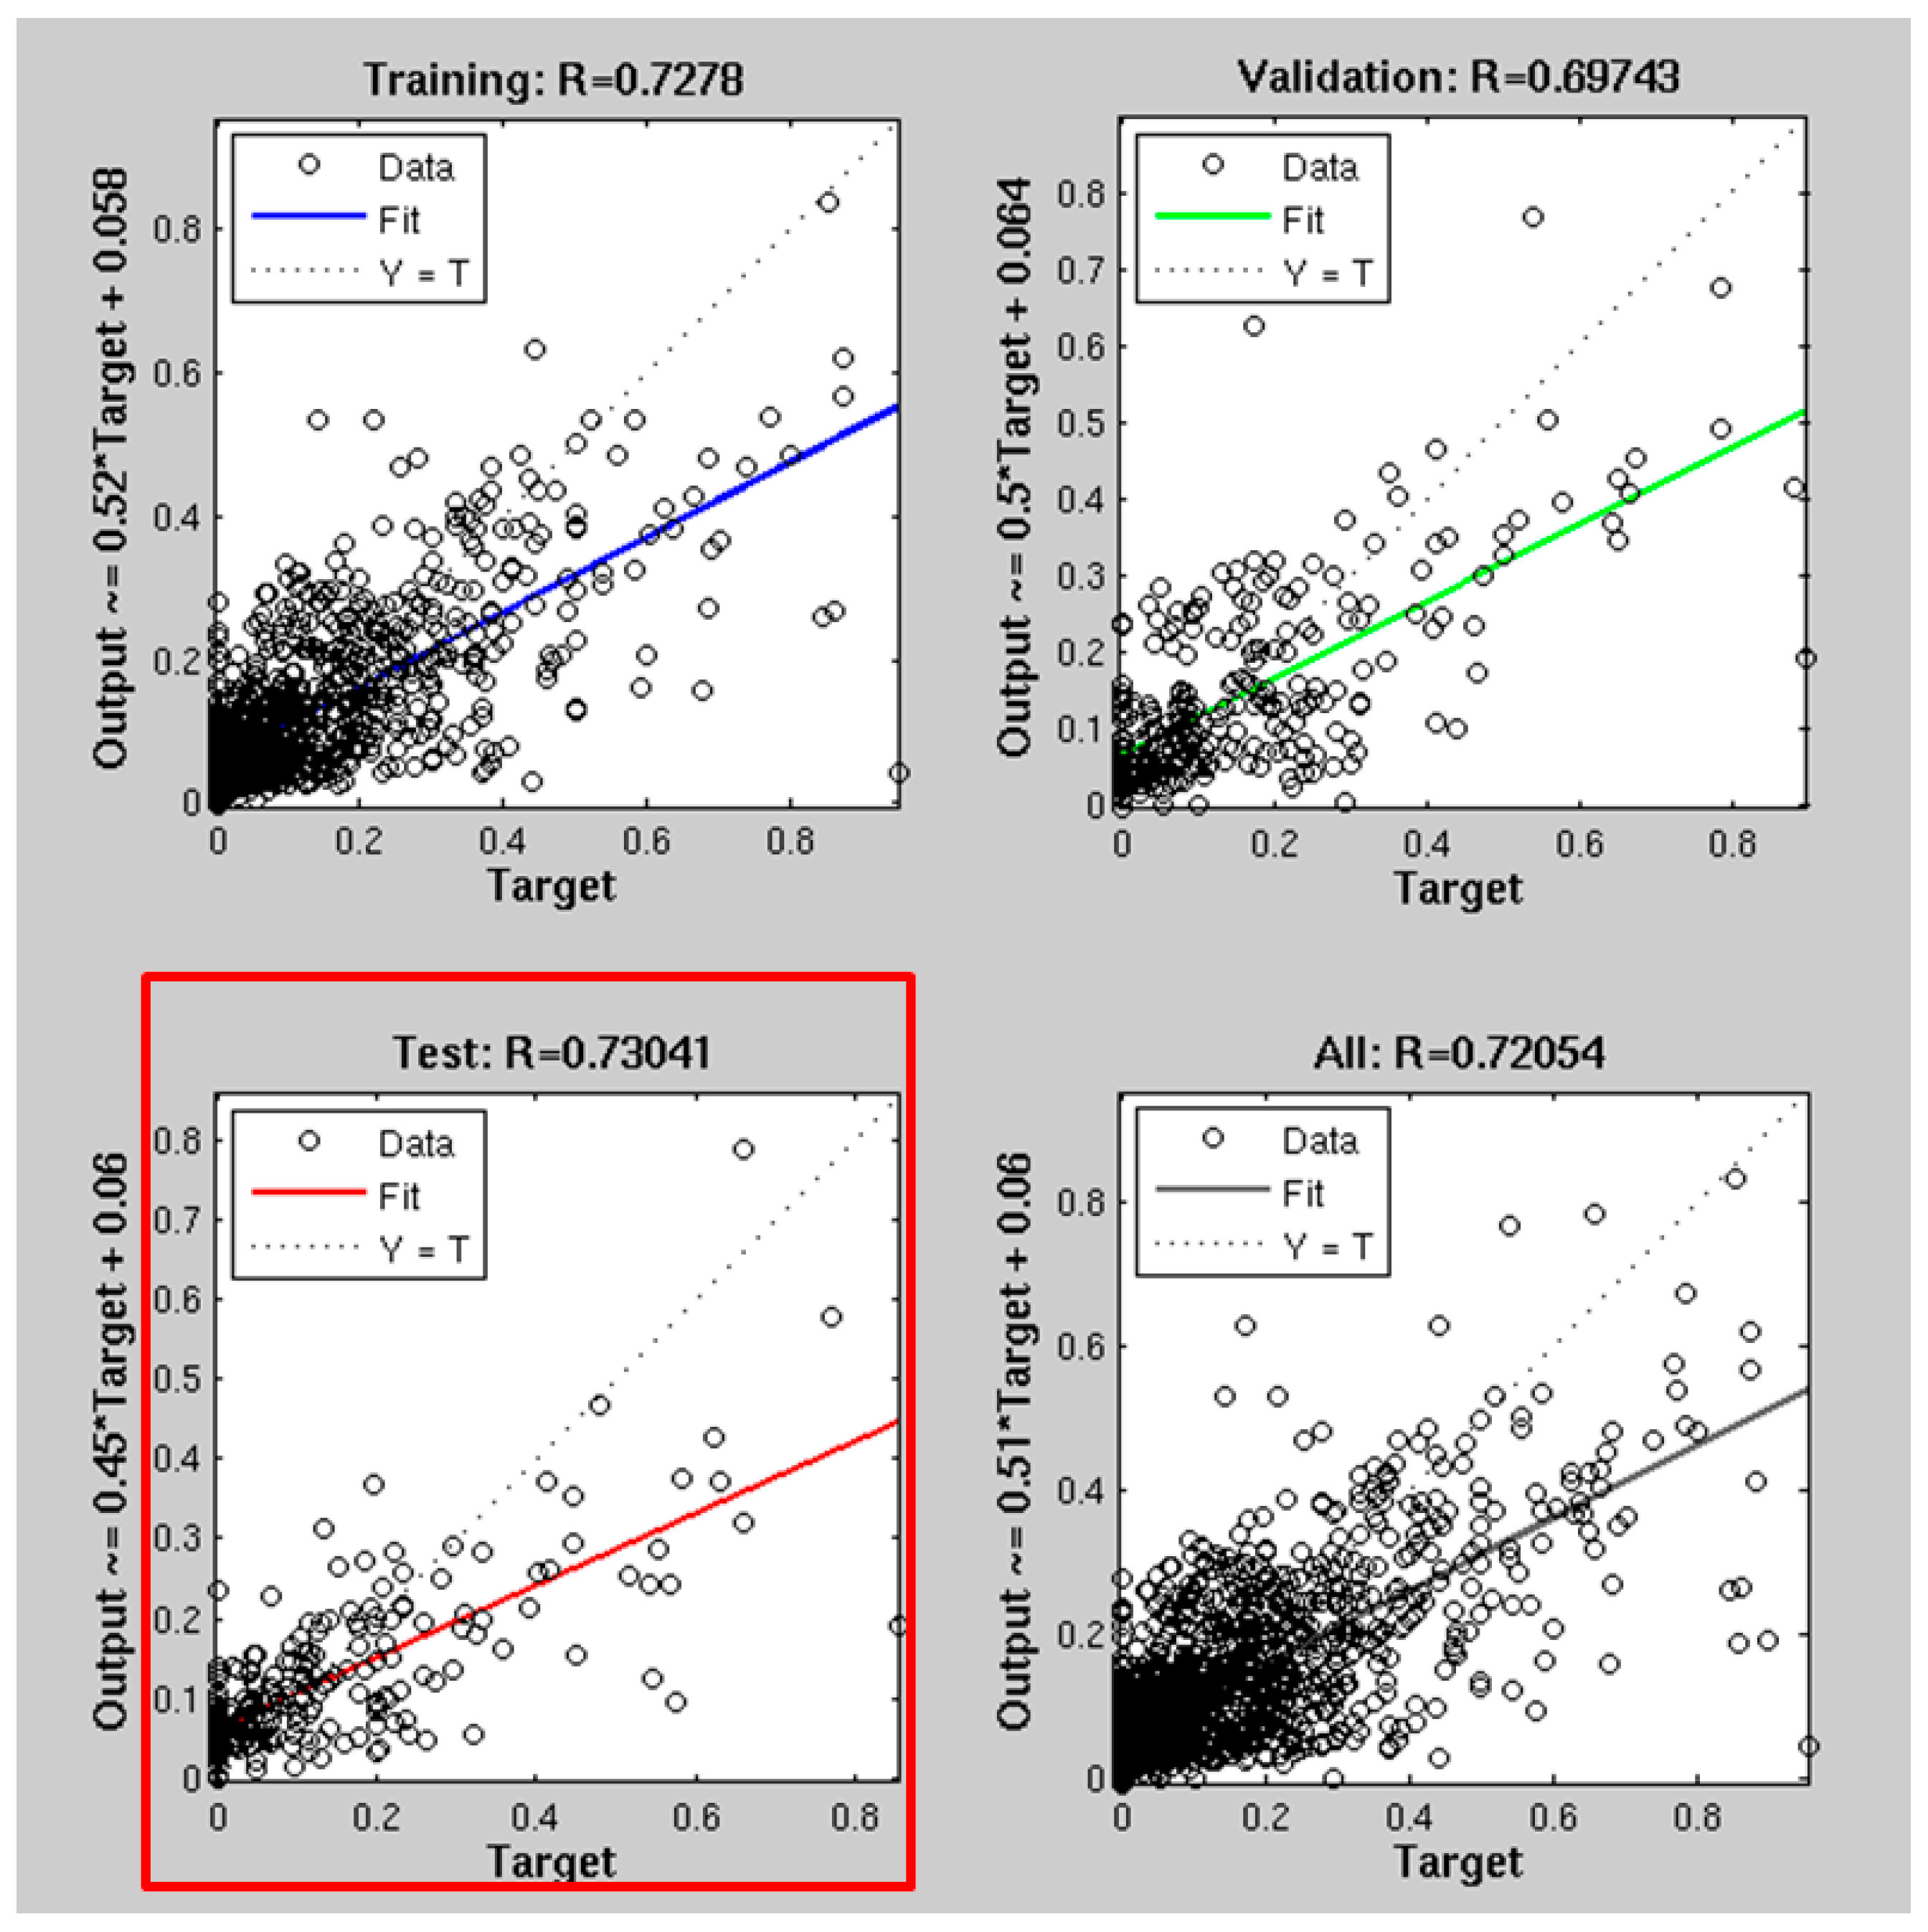
Results of NNs training phase for Exp 1 and Exp 2 are depicted in
Figure 4 and
Figure 5, respectively. As regard the network using only optical features, the regression coefficient obtained applying the network to the test dataset is 0.67 (
Figure 4), whilst NN using both and optical features obtains 0.73 (
Figure 5). In this phase, it seems that using more features improves the NN retrieval accuracy.
4. Application of the Trained NN and Results for the Central Italy Case Study
In order to evaluate the performance of NNs in terms of retrieval accuracy and generalization capability, they were applied to the Amatrice earthquake. The goal is also to evaluate NN capability for modelling the building collapse ratio. The satellite dataset is made up of two Sentinel-2 optical images (1 pre- and 2 post-seismic), three COSMO-Sky SAR images (2 pre- and 1 post-seismic), and a building footprint layer extracted by the Open Street Map service (see
Table 2 for EO data characteristics). Both optical and SAR data have a 10 m spatial resolution.
The Amatrice footprint layer extracted from OSM, which is at a single building scale, was modified to obtain polygons surrounding more than one building. In this way, there are more pixels associated to each polygon leading a better estimation of change features over the polygon itself. The resulting layer consists of 112 polygons.
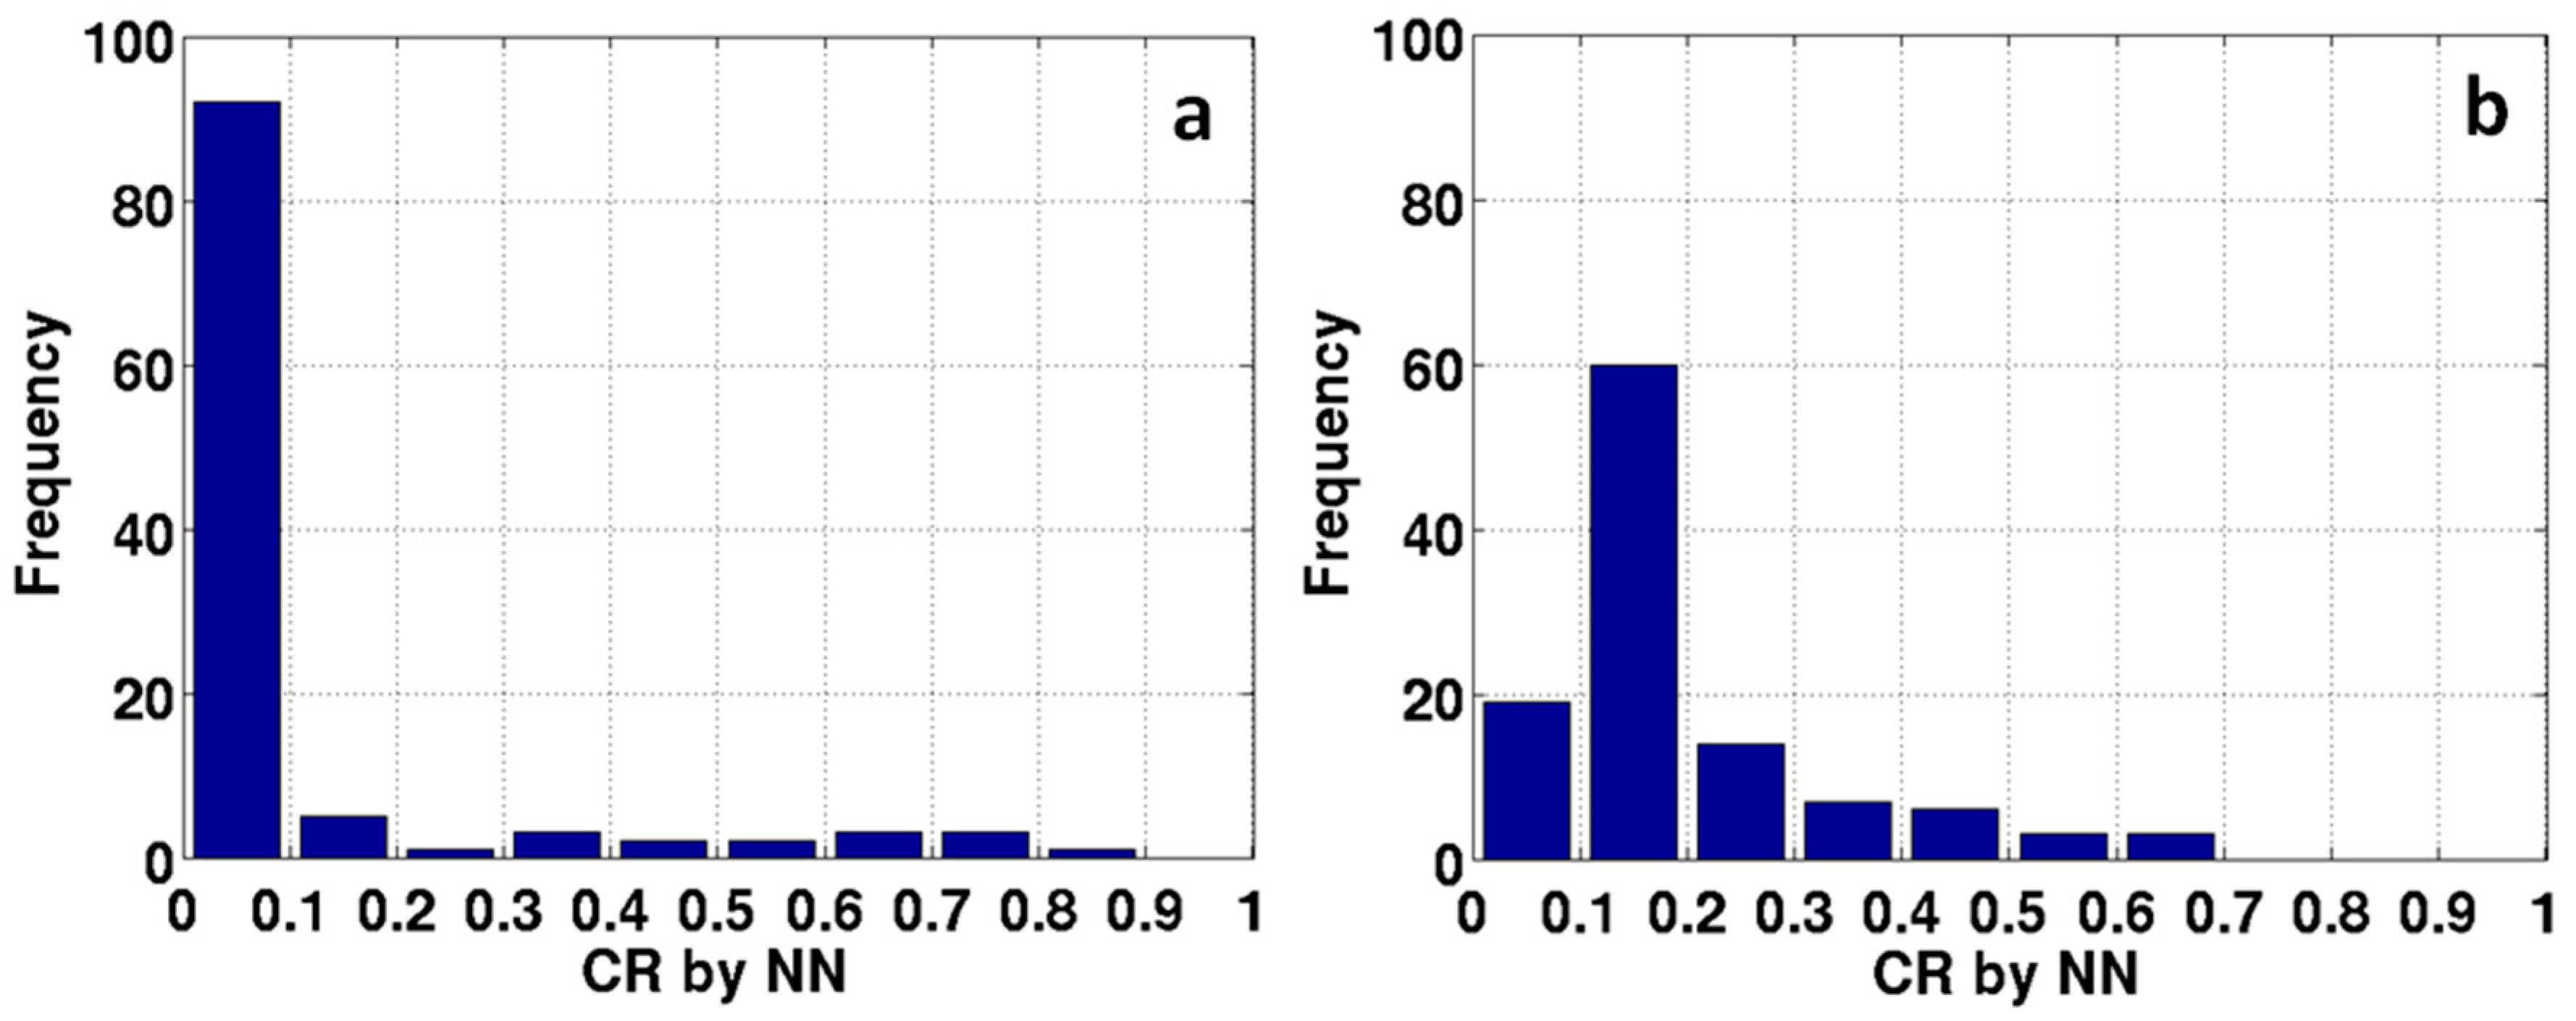
In the
Figure 6, histograms for the CR obtained by the NN approach, Exp 1 (a) and Exp 2 (b), are depicted.
The histogram comparison shows that Exp 1 estimates most of polygons with a CR less than 0.1 (92 polygons, 82% of total), which means no damage. Five polygons present a CR between 0.1 and 0.2 and just one between 0.2 and 0.3. Only about 13% of polygons have a CR higher than 0.3, which spans from medium damaging to total collapsing. Specifically, three polygons with CR between 0.3 and 0.4, four between 0.4 and 0.6, six between 0.6 and 0.8, and only one higher than 0.8, indicating total collapse.
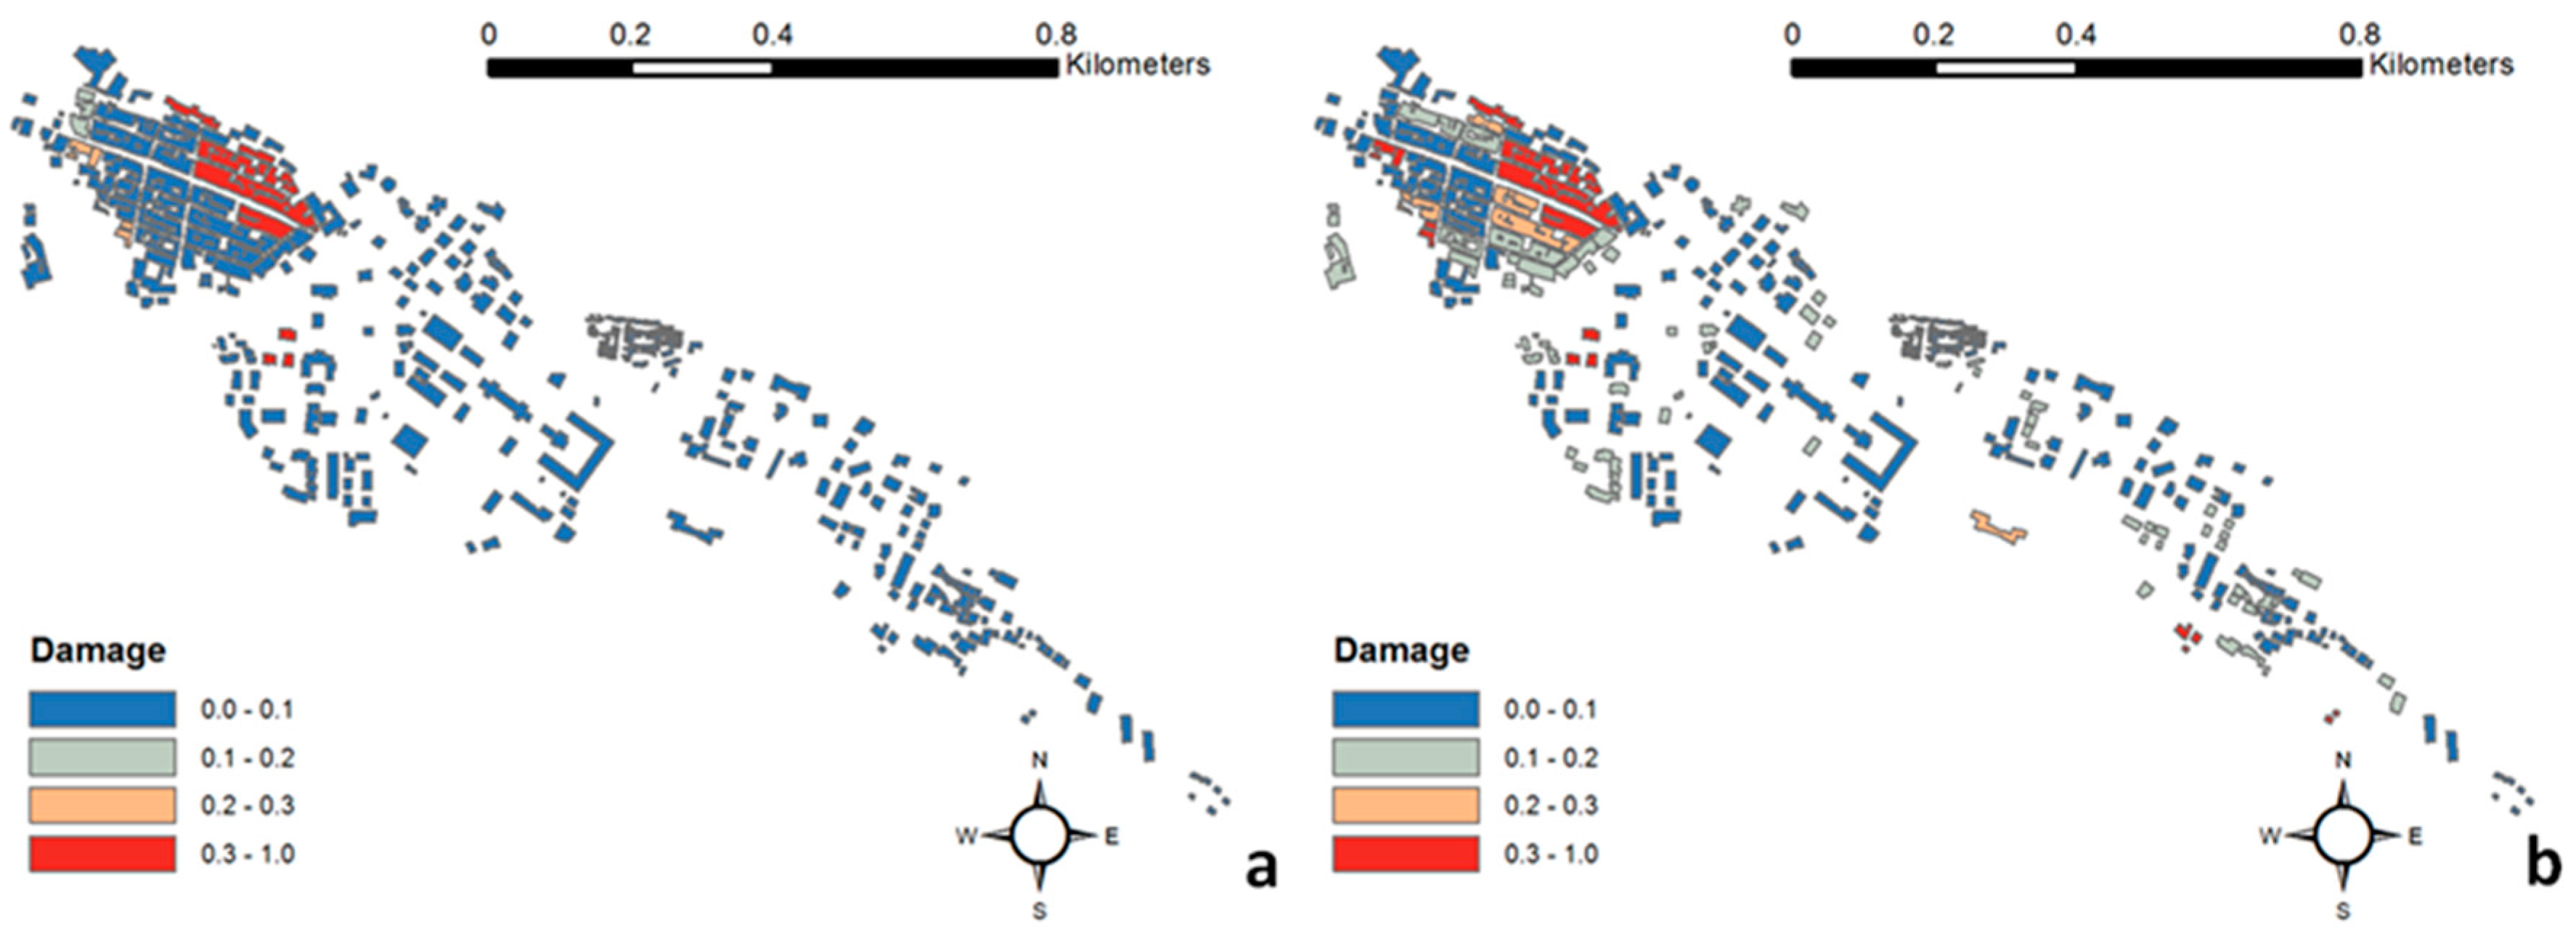
The location of polygons is well shown in
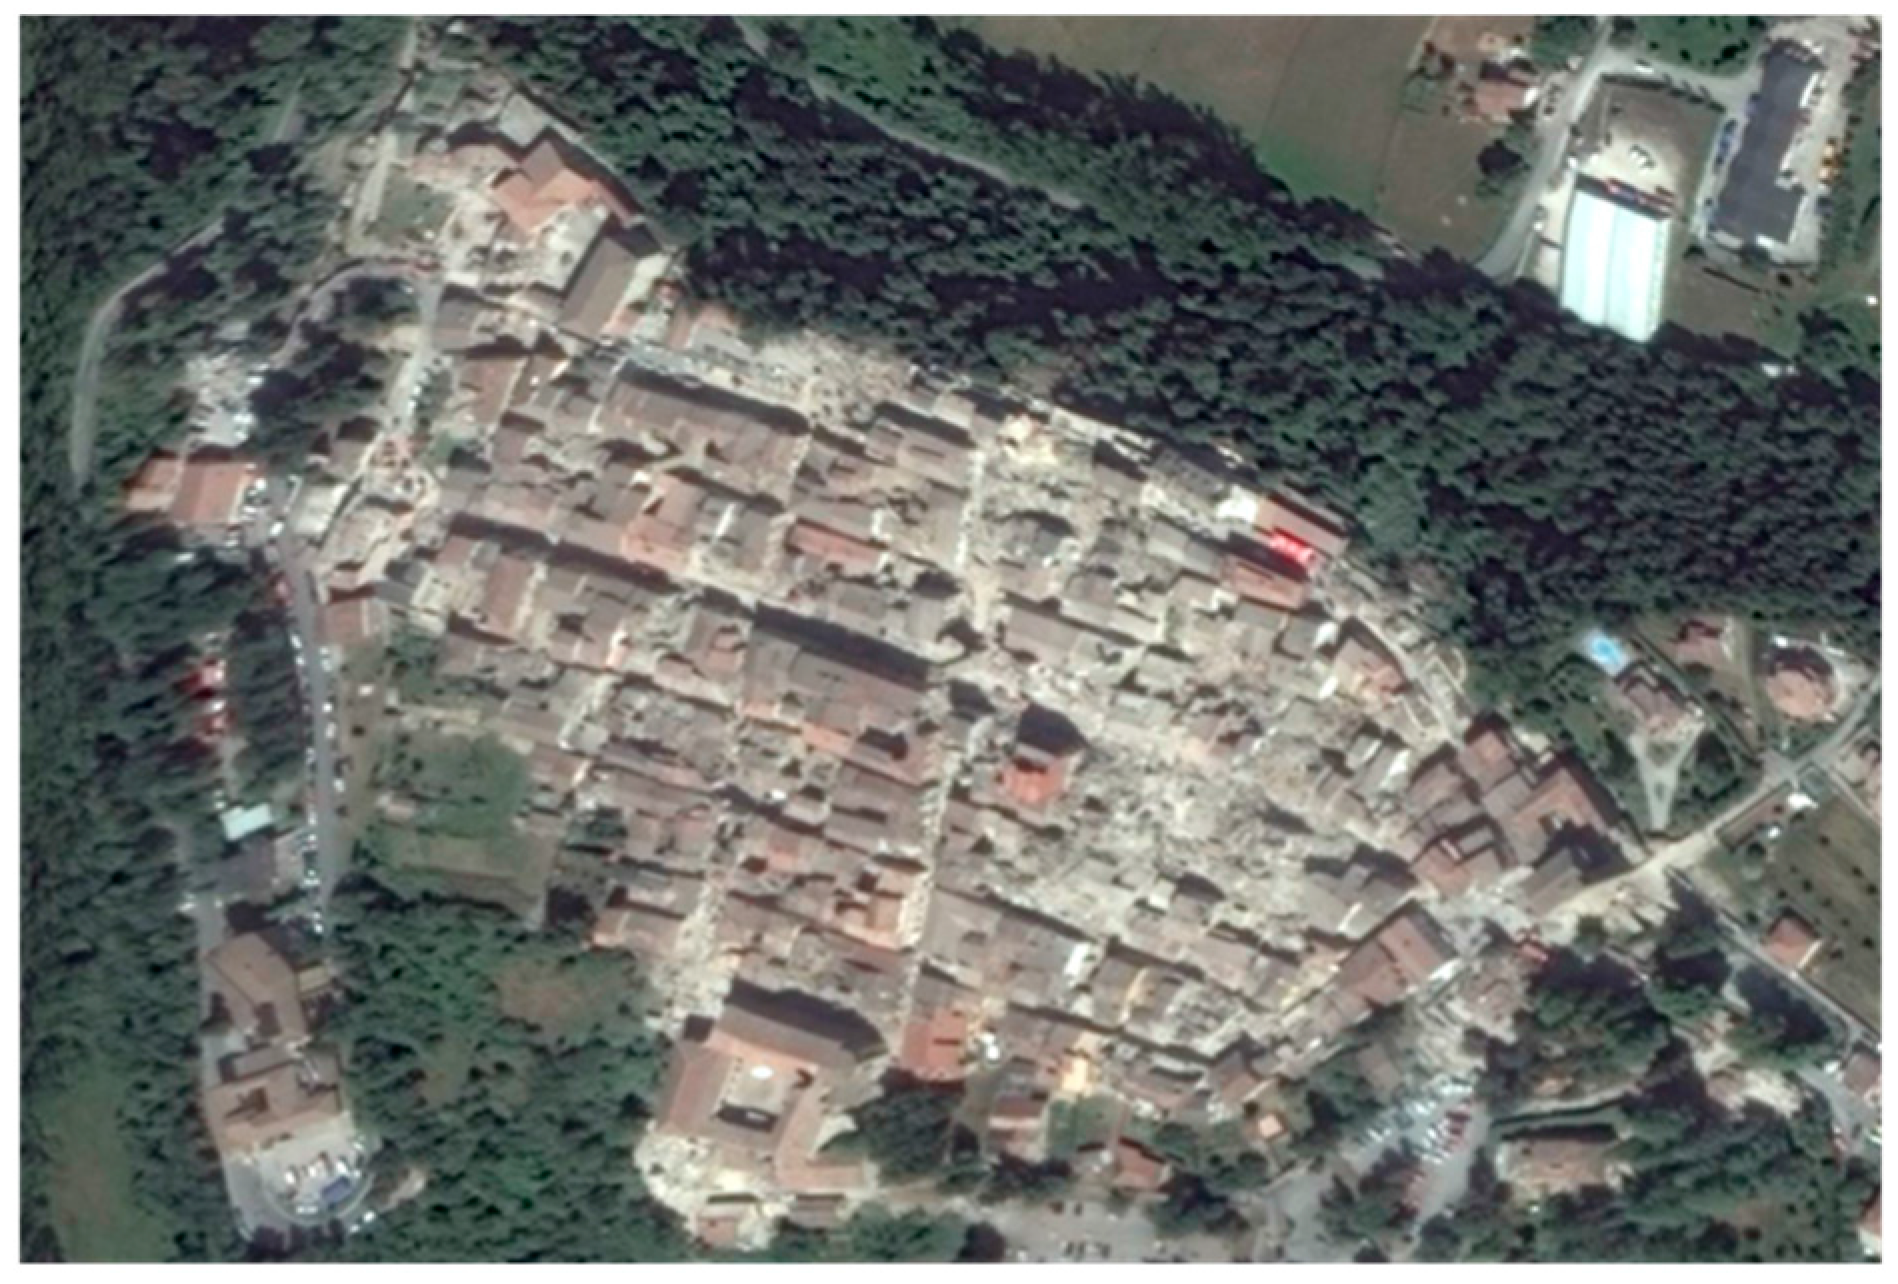
Figure 7a, which describes the damage CR maps obtained analyzing post 24 August 2016. The map indicates that the severe damage is mainly retrieved in the northeast part of the Amatrice (red blocks), although information from Civil Protection confirms that collapses involved the whole historical center. This is confirmed by looking at an optical very high resolution (VHR) image (
Figure 8) acquired after the Amatrice seismic event.
The fusion of optical and SAR features significantly changes this distribution (
Figure 7b), where occurrences of CR less than 0.1 (blue blocks) drastically decrease with respect to the Exp 1 (19 polygons, only 17% of total). About 54% of polygons show a CR between 0.1 and 0.2 (grey blocks), indicating light damage. Looking at map in
Figure 7b, these light damages lie partially in the historical center, but most of them are located in the southeast part of the city.
Considering only the historical center and the comparison with the VHR image (
Figure 8), we suppose that Exp 2, involving SAR features, is more sensitive to light/medium damage level. Indeed, 14 polygons present a CR between 0.2 and 0.3, which indicate a medium damage level. We also notice that these polygons are located in the southeast part of the historical city center, an area involving severe damage as confirmed by the VHR image depicted in
Figure 8. Considering CR higher than 0.3, polygons retrieved by Exp 2 increase by about 27% (19 respects of previous 14 of Exp 1).
The NN employed for the data fusion approach (
Figure 7b), better identifies the severely damaged areas in the historical center, also where Exp 1 underestimated the collapses. At the same time, it seems to overestimate the damage in other areas, especially outside of the historical center. Indeed, Exp 2 indicates zones characterized by building collapses also in the southeast and partially in the northwest (
Figure 7b). In this sense, the Exp 2 seems to provide a more realistic damage distribution: at first glance the NN regression model using the fusion approach gives the best results better identifying areas affected by collapses, whereas the Exp 1 seems to underestimate them.
5. Conclusions
The present work shows that neural networks, once they have been trained, can be used to rapidly retrieve building collapse ratios from optical and SAR remote sensed data. The implemented ANNs modelled the collapse ratio with quite high accuracy when applied to the post Amatrice earthquake independent dataset. High values of CR (more than 0.5) were retrieved over the historical center that are in agreement with a damage assessment observed by optical VHR imagery. The fusion of optical and SAR derived parameters seem to give a more reliable result using only optical data, even though it probably underestimates the occurrences of collapse ratios higher than 0.5, due mainly to a minor statistical characterization of values during the ANN training phase (only 3%).
Considering that the technique is independent of different types of input data, both for radiometric characteristics and spatial resolution, our work has demonstrated that ANNs are powerful tools able to estimate damaged areas, and they are important in near real time monitoring activities, owing to their fast application.
When looking at using an ANN approach in near real time monitoring, special care has to be taken during the training phase. This is because the neural network needs to be fed and trained continuously also during its operating phase in order to keep phenomena knowledge updated and retrieval performance accurate at the operating stage.
Another aspect is related to the input data characteristics, such as the spatial resolution, which can limit the neural network retrieval accuracy. In this case, a possible improvement could be the use of VHR satellite data, which could provide information at a building scale.
Future work will consider earthquake surveys in order get ground truth datasets to make a quantitative assessment of ANN performance. It will also consider extending the analysis to other areas affected by 2016 Central Italy seismic sequence. Furthermore, because the described approach needs both pre- and post-earthquake images, and in many cases a pre-earthquake image is not available or not up to date, a future goal will be the application of Neural Network approaches only using post-earthquake remote sensed images, available in near real time.


