Experimental Study on Mechanical Behavior of Shear Connectors of Square Concrete Filled Steel Tube


1
College of Architecture and Civil Engineering, Beijing University of Technology, Beijing 100124, China
2
Faculty of Civil Engineering and Geosciences, Delft University of Technology, Delft 2628 CN, The Netherlands
*
Author to whom correspondence should be addressed.
Appl. Sci. 2017, 7(8), 818; https://doi.org/10.3390/app7080818
Submission received: 17 July 2017
/
Revised: 31 July 2017
/
Accepted: 3 August 2017
/
Published: 10 August 2017
Abstract
:In order to quantitatively evaluate the shear-bearing capacity of shear connectors of square concrete filled steel tube (CFST), push-out tests on 14 square CFSTs with shear connectors have been carried out. Among the 14 CFSTs, there are 13 specimens with steel plate connectors and one specimen with steel bar connectors. The following factors are investigated to figure out their influences on the performance of CFSTs, which are the width to thickness ratio of steel tube, thickness of steel plate, length of steel plate, strength of concrete, welding condition of steel plate, number of steel plate layer and interlayer spacing. The test results show that the ultimate bearing capacity and the elastic stiffness increase with decreasing width to thickness ratio of the steel tube, and increasing thickness and length of the steel plate. With increasing concrete strength, the ultimate bearing capacity also increases. However, the welding condition has no effect on the ultimate bearing capacity. The ultimate bearing capacity of the CFST with double-layer steel plate is greater than that with single-layer steel plate. The ultimate bearing capacity of steel bar type shear connector is 87% greater than that of the steel plate type shear connector, and the steel bar specimen shows good ductility. A formula for calculating the shear-bearing capacity of shear connectors has been developed, and the calculated shear-bearing capacities are in good agreement with the test data.
1. Introduction
In common structural designs, concrete filled steel tube (CFST) members have been widely used as piles, building columns and bridge piers. This is due to the advantages of the composite members, such as high strength, good ductility, high energy absorption capacity, and ease of construction. The CFST members’ behavior has been investigated extensively since the 1960s. Song and Kwon [1] performed an experimental study on the behavior of square CFST stub columns with different diameter to thickness ratios (D/t). The test results showed that the composite columns had high ductility as well as high strength due to the mutual confinement between the steel plates. Han [2] studied the effect of the constraining factor and width to thickness ratio of a steel tube on the compressive load capacity of concrete filled rectangular hollow section (CFRHS) and the ductility of the steel tube. Georgios et al. [3] studied the behavior of the composite CFST columns with various concrete strengths and wall thicknesses. The results showed that for high-strength CFST columns, the peak load was achieved for small shortening (3.0 mm), whereas for normal concrete the ultimate load was gained with large displacement. By performing tests on the circular CFSTs, Han [4] investigated the effect of compaction method of concrete on the strength of the circular CFST. The results showed that using denser compacted concrete, the ultimate strength of the CFST was higher.
In the design of a CFST structure, the steel beam-CFST column is a common joint type. The vertical load of steel beams is transmitted through the beam-column joints to CFST columns. Usually, steel beams are connected directly with the outer steel tube of the CFST columns, and vertical loads are transmitted from the steel tube to the core concrete through the bonding between the steel tube and concrete. In the past few decades, numerous studies have been conducted to investigate the bond strength between the steel tube and concrete in CFST columns. Roeder et al. [5] conducted push-out tests on circular CFST columns, where the in-filled concrete was of moderate shrinkage or little shrinkage. The test results showed that the concrete shrinkage had a negative effect on the bonding in the CFST columns. Chang et al. [6] tested the bond behavior in CFST columns with expansive concrete. The results showed that expansive concrete was effective in improving the short term bond strength of the CFST columns. Aly et al. [7] investigated the effect of concrete age on the push-out resistance of CFST columns. The results showed that the age of the normal strength concrete caused a small reduction in the push-out resistance. A statistical analysis conducted by Tao et al. [8] indicated that the bond strength decreases with increasing height to diameter ratio (L/D) up to about three times. On the other hand, for circular columns with L/D > 3 and for rectangular columns, the effect of L/D ratio on the bond strength was not clear.
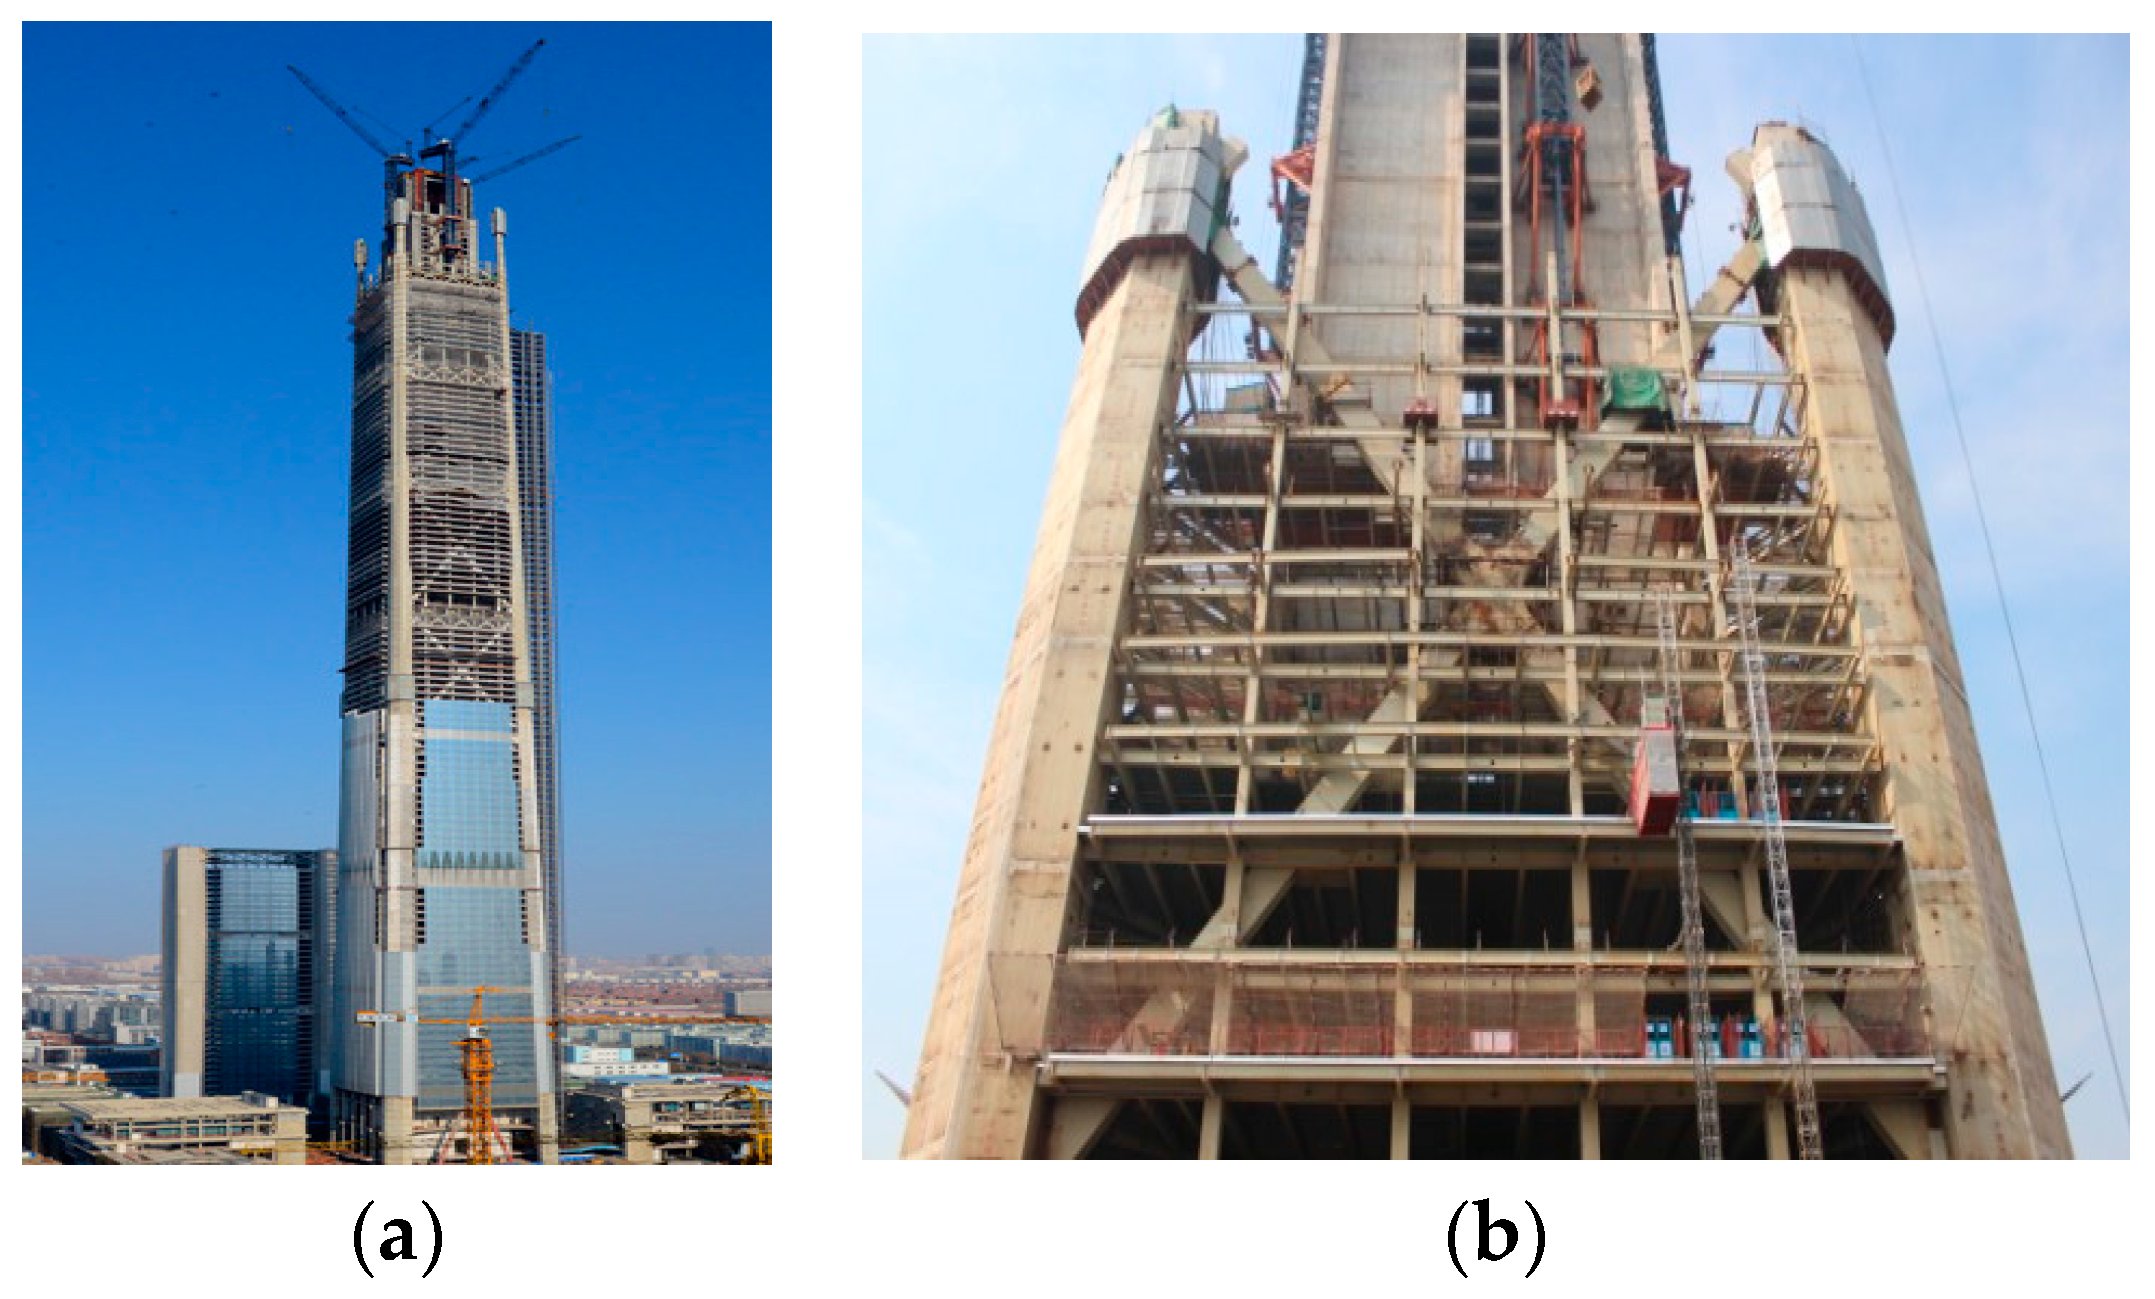
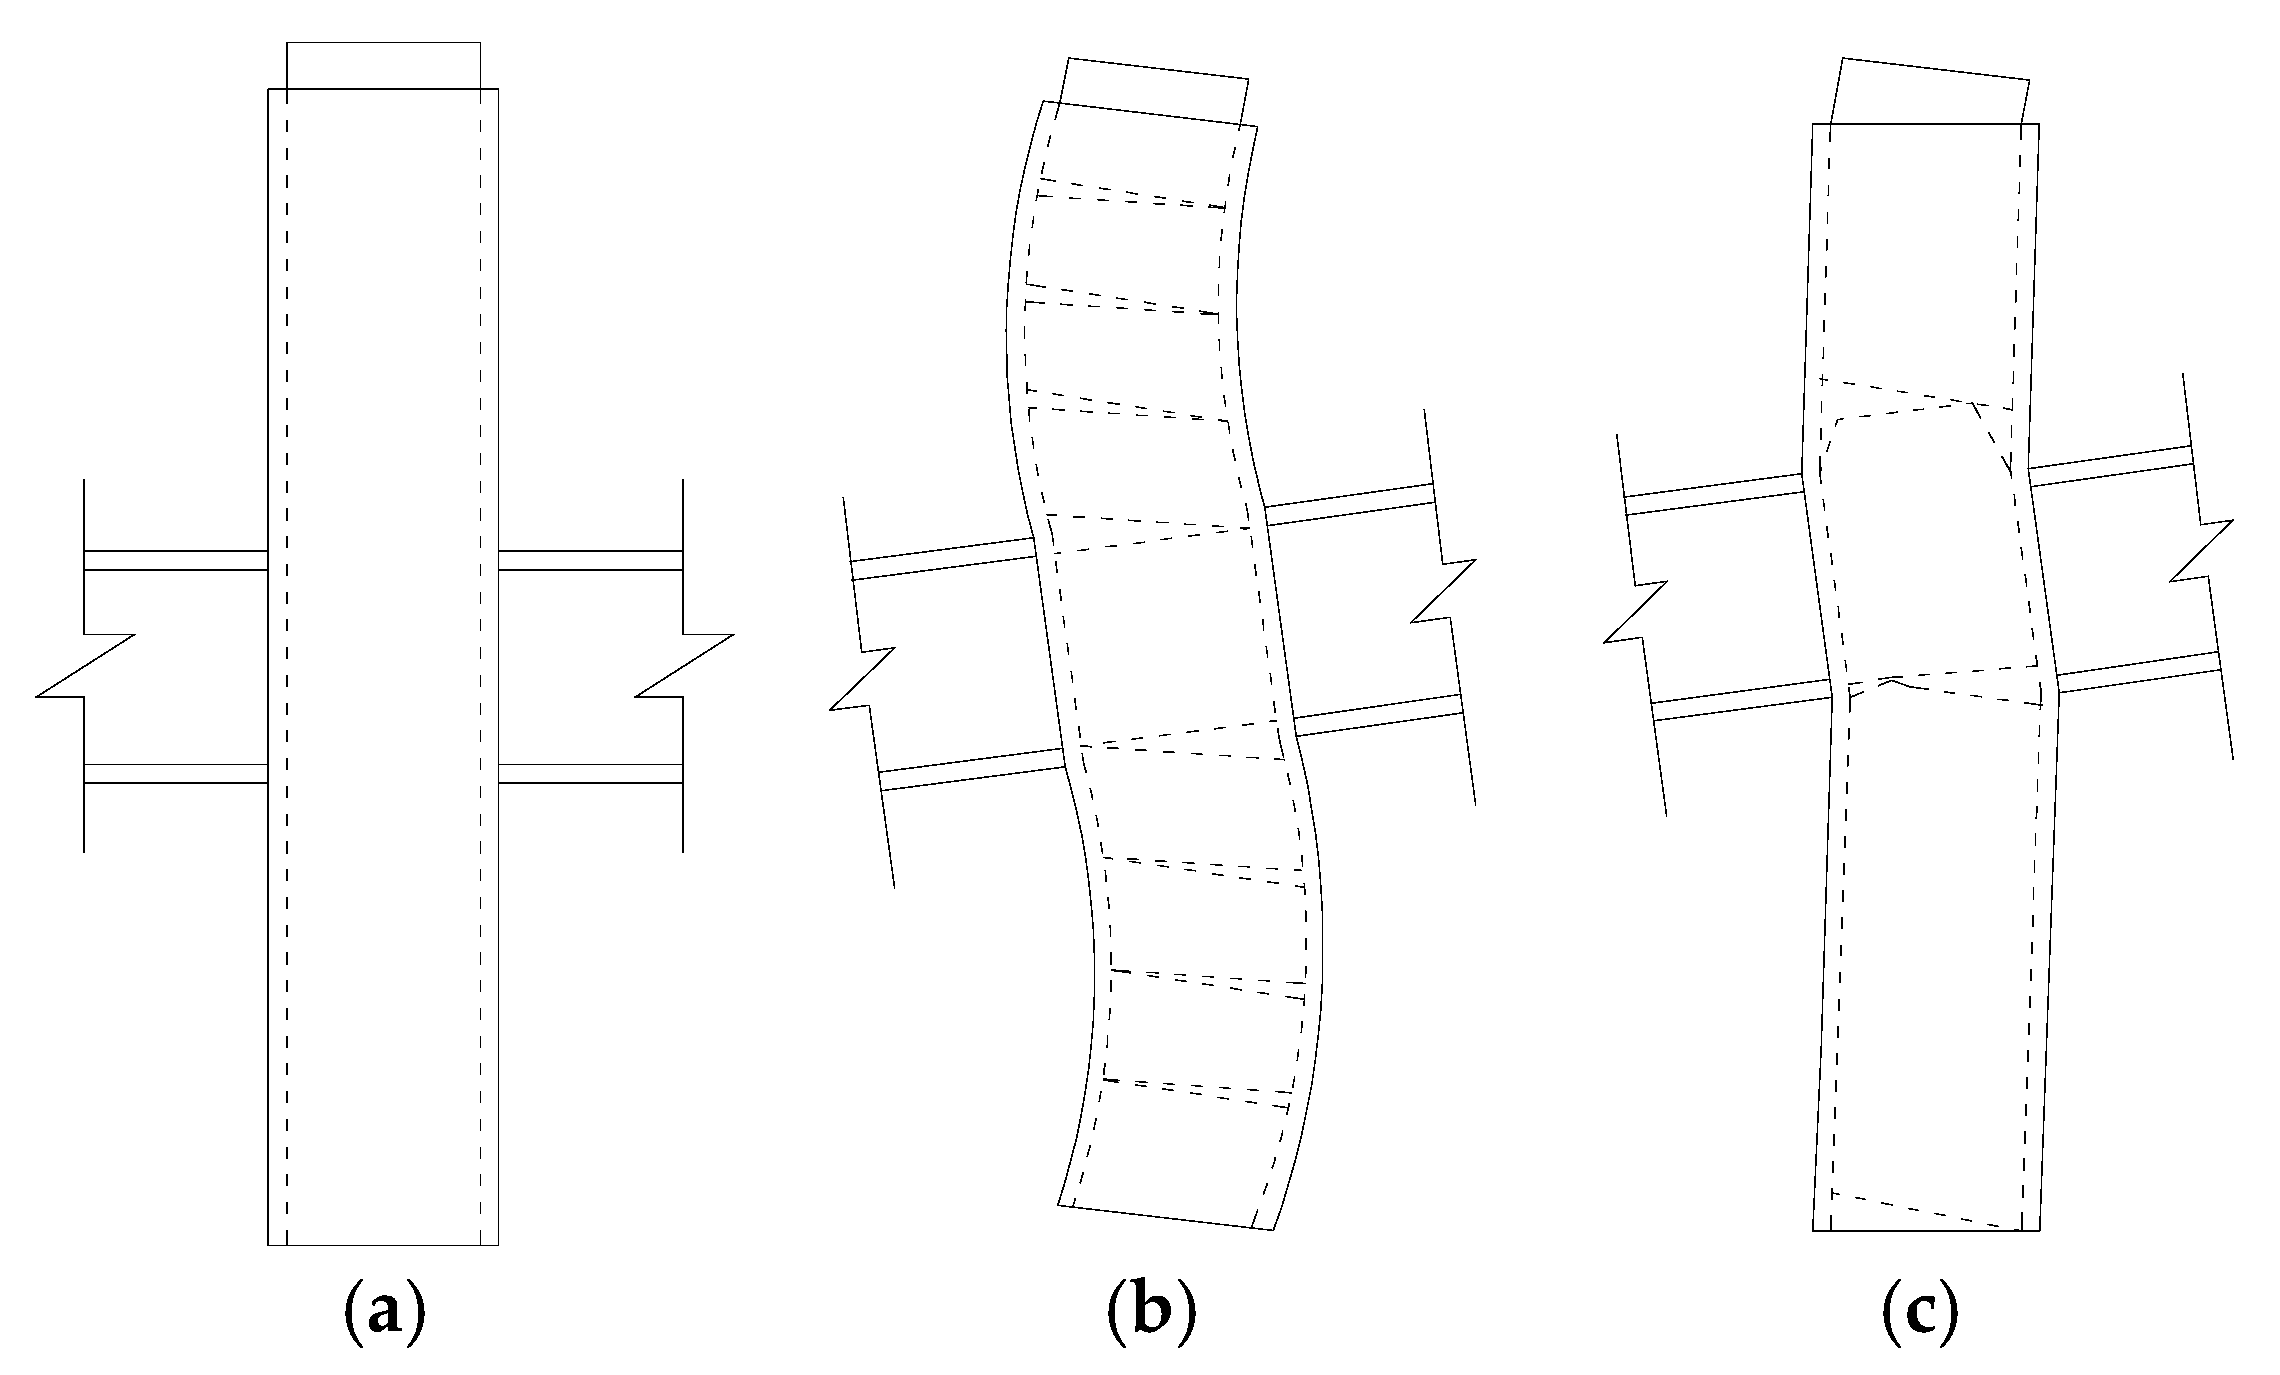
Further, in a CFST structure with braces or an ultra high-rise CFST structure, as shown in Figure 1, it is not reliable to transmit the vertical load of the beam-column joints by the bonding between the steel tube and core concrete. The steel tube and core concrete cannot work together. When the bonding between the steel tube and concrete is not reliable, the column deformations shown in Figure 2 may occur, which is not acceptable in the design of a CFST structure.
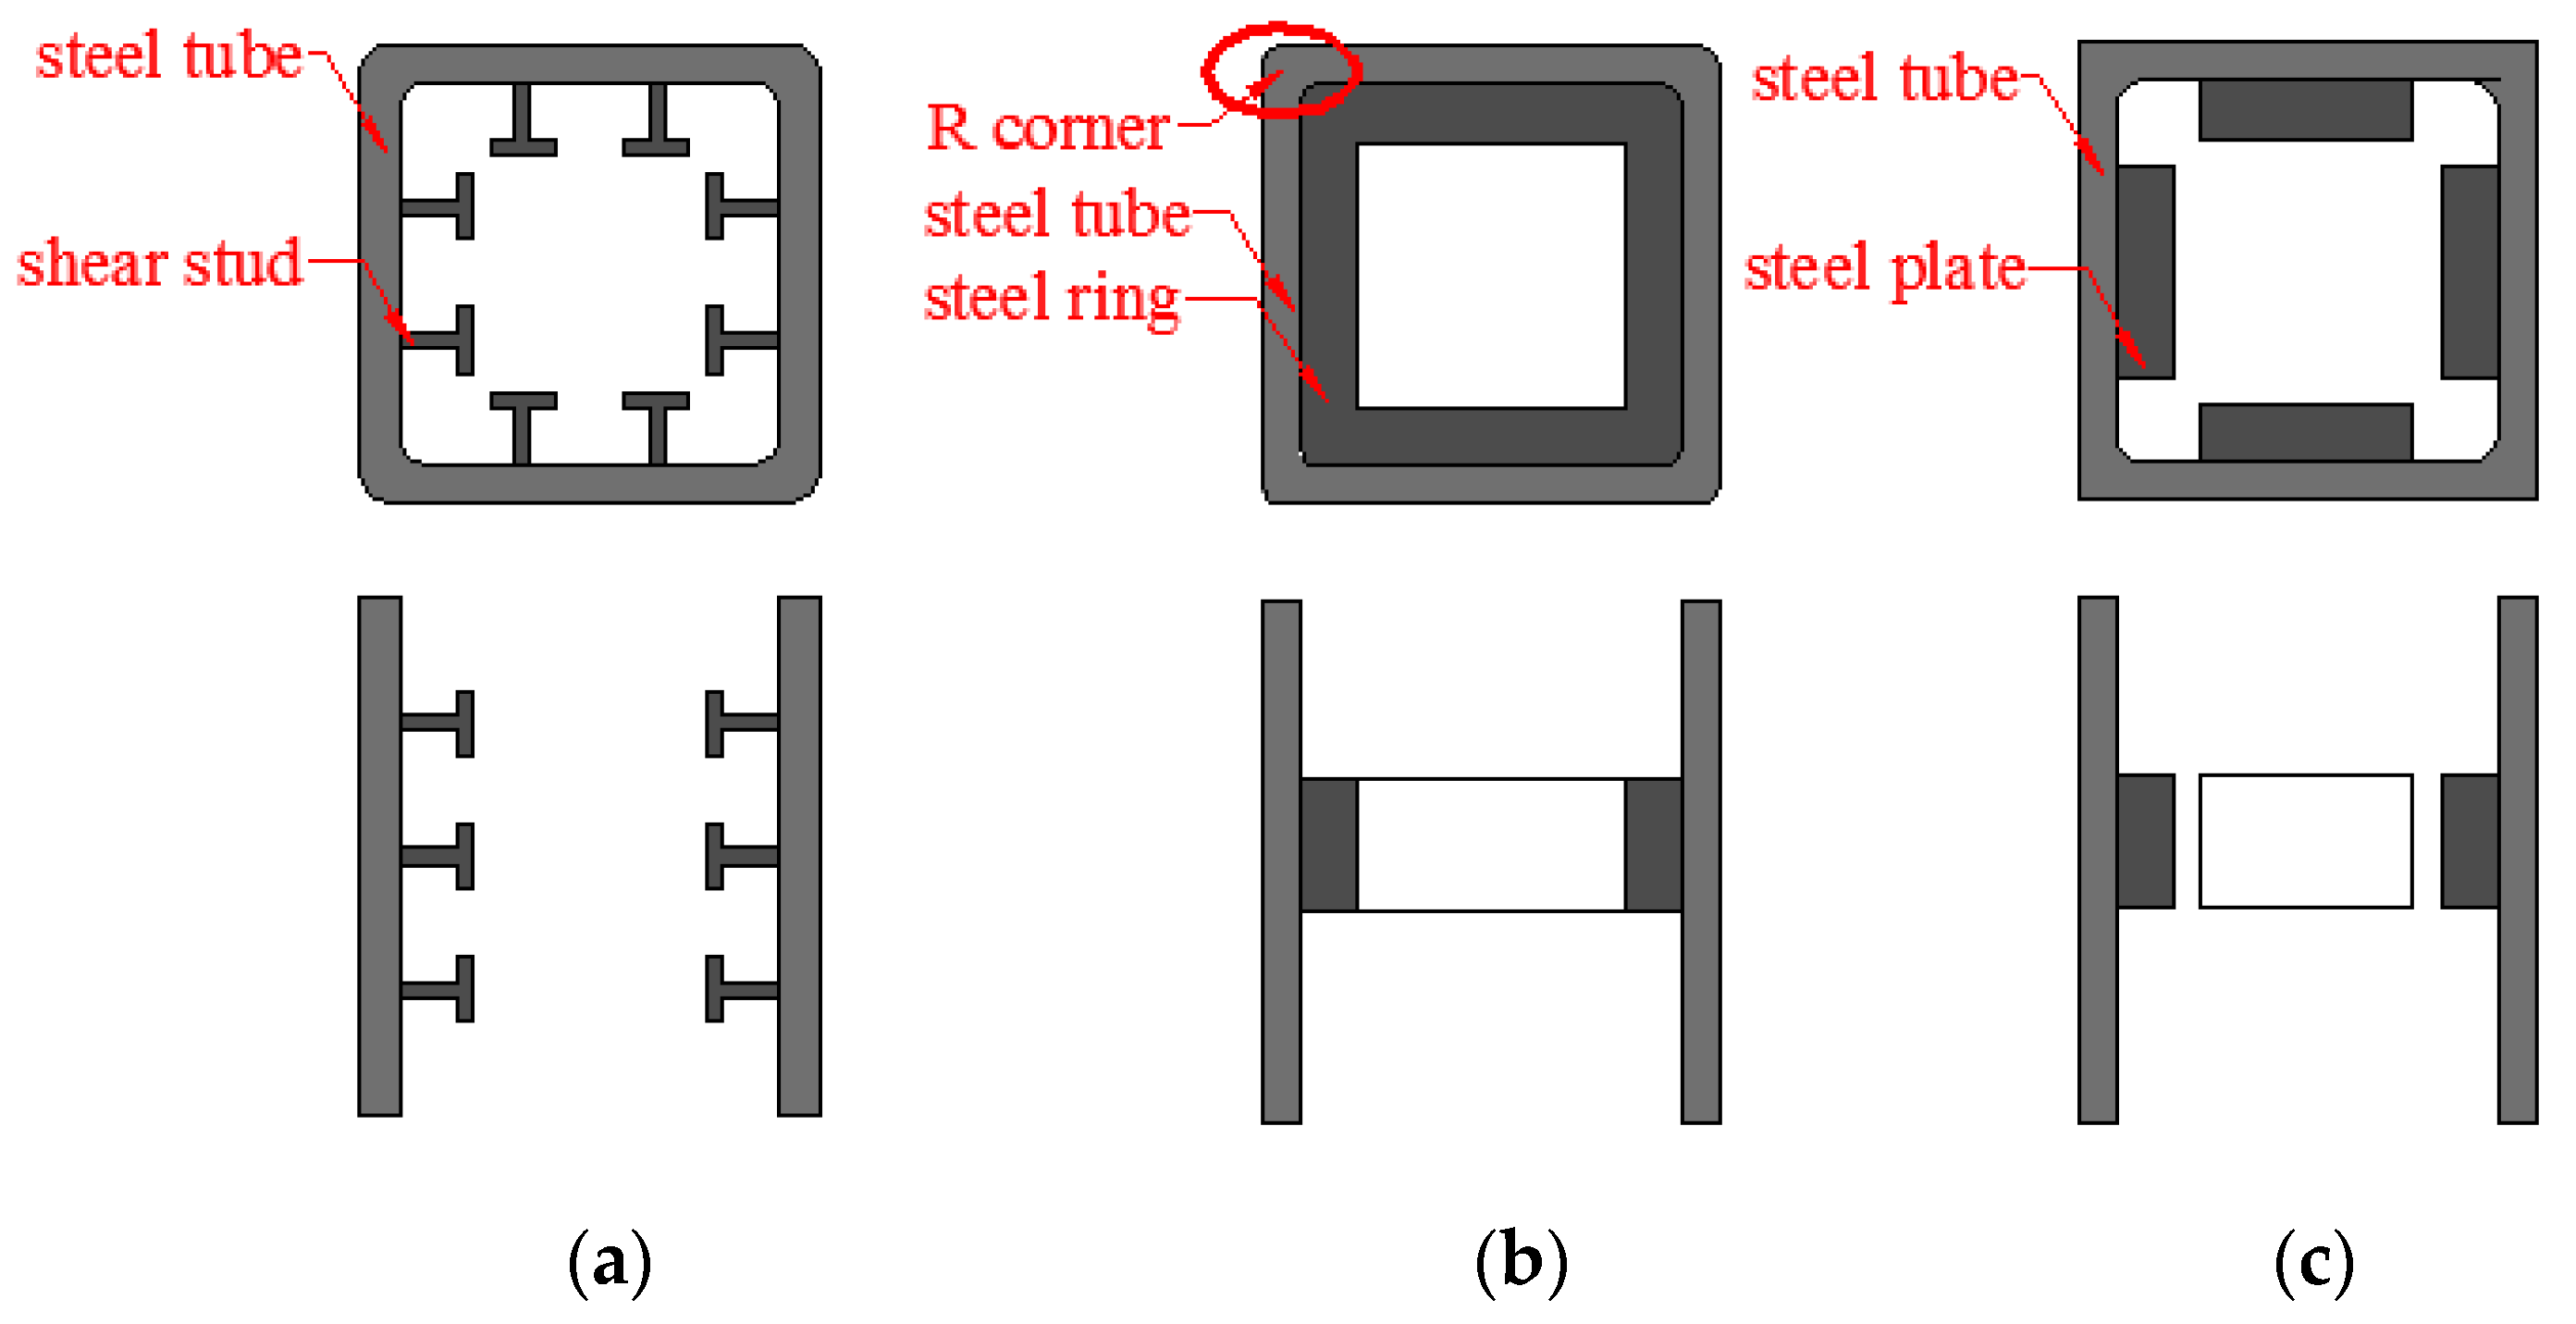
In order to guarantee the reliable transmission of the vertical load of the beam-column joints, the shear connectors are usually applied to the inner wall of the steel tube to ensure the co-working performance of the steel tube and concrete. Among the various forms of shear connectors, the shear studs are widely used as the shear connectors, as shown in Figure 3a. There are many tests to investigate the bonding performance in CFST columns with studs in the inner steel tube wall. Shakir-Khalil [9] carried out a series of push-out tests with different types of shear connector, and the results indicated that the ultimate push-out load was a function of the interface type, shape and size of the cross-section, led to a better understanding of the load transfer mechanism in beam-column connections in the composite construction. Li An et al. [10] presented push-out tests of studs in normal and high strength concretes. The results showed that the concrete compressive strength significantly affected the strength of the stud connections. Pil-Goo Lee and Chang-Su Shim [11,12] investigated the static and fatigue behaviors of large shear studs up to 30 mm diameter, which were beyond the limits of the current design codes. Weichen Xue [13] conducted push-out tests on the shear studs in order to investigate the factors that affect stud behavior. The shear stud mechanism was studied, a new expression of stud load-slip relationship was proposed, and a model for calculating the shear stud bearing capacity was developed.
‘Specification for design and construction of concrete filled steel tubular structures’ [14] recommends the use of steel rings, as shown in Figure 3b, or steel diaphragms as shear connectors. To ensure the quality of the core concrete, the width is limited to less than D0/15 and 50 mm, whichever is smaller. ‘Recommendations for Design and Construction of Concrete Filled Steel Tubular Structures’ [15] recommends the steel rings to be used as shear connectors. Steel rings have been proved to be effective in enhancing the bond behavior according to the earlier studies. Tao et al. [16] conducted push-out tests on the circular and square CFST specimens. The experimental results showed that welding internal ring(s) onto the inner surface was more effective than welding shear studs in enhancing the bond behavior. Lai [17] tested the CFST columns of various dimensions, which were installed with rings. The results showed that the rings caused the axial load-carrying capacity and stiffness to increase, and the strength degradation rate to decrease.
Up to present, the studies on the steel rings have been mainly focused on the circular CFST columns. However, for the square CFST column, it is difficult to weld the whole steel ring to the square tube because of the R corner, which is caused by the production process (for instance, cold-formed or hot-rolling), as shown in Figure 3b. In order to simplify the construction work, instead of the steel ring, the steel plates can be used as the shear connectors, as shown in Figure 3c. Therefore, in this study, the push-out tests on the square CFST with steel plates have been carried out. The test variables are the width to thickness (B/t) ratio of steel tube, thickness of steel plate, length of steel plate, strength of concrete, welding condition of steel plates and number of shear plates layer and their spacing. The effects of these test variables on the shear strength have been quantitatively analyzed, and a formula for calculating the shear-bearing capacity has been developed.
2. Specimen Design and Test Scheme
2.1. Specimen Design
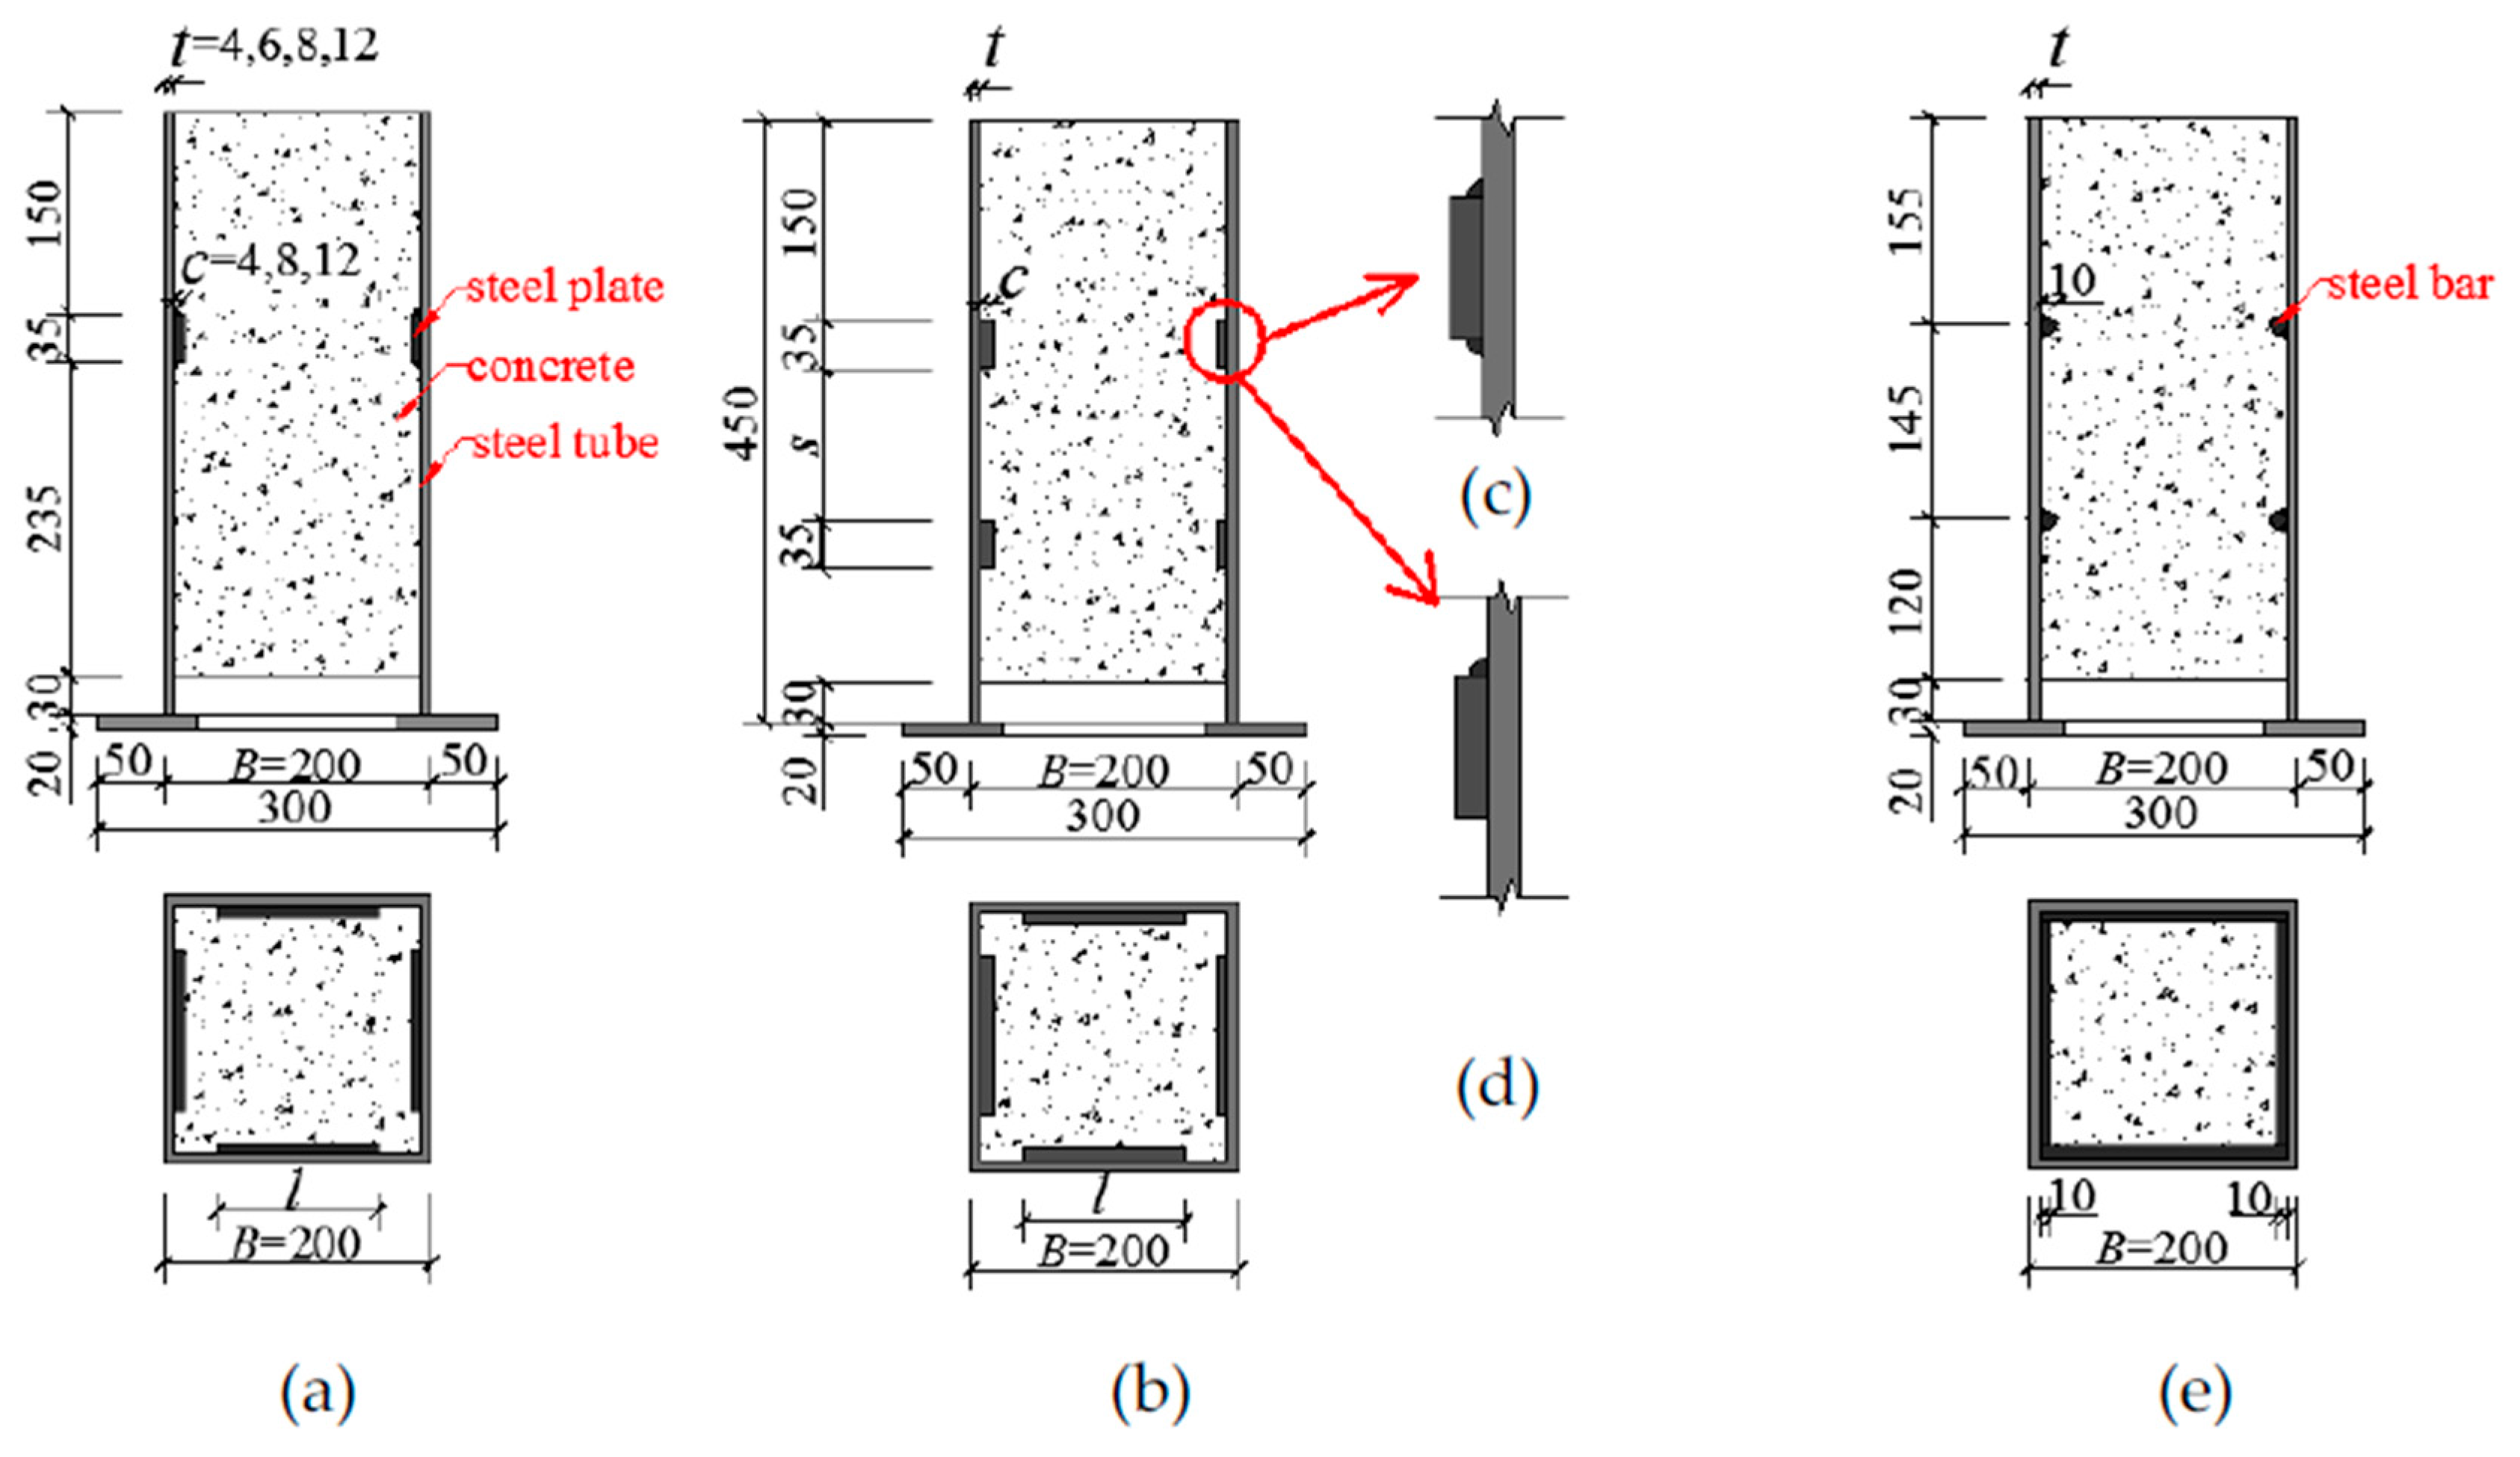
A total of 14 square concrete-filled steel tubes (CFSTs) with identical outer diameter of 200 mm have been designed and tested, as shown in Figure 4. The section size is a 1/3 scale model for CFST columns in high-rise buildings. In low-rise buildings, such as two or three stories buildings, the specimens can be considered as a full-scale model. At the bottom 30 mm of the specimens, it was not filled with concrete. This is to ensure that during the test, the push-out is smooth. The design parameters of the tests include the wall thickness of steel tube: t = 4, 6, 8, 14 mm (width to thickness ratio: B/t = 50.0, 33.3, 25.0, 14.3); thickness of steel plate: c = 4, 8, 12 mm; length of steel plate: l = 80, 120, 150 mm; number of steel plate layer: single-layer (Figure 4a), double-layer (Figure 4b); welding condition of steel plate: double-sided welding (Figure 4c), single-sided welding (Figure 4d), and the interlayer spacing: s = 100, 150, 200 mm; types of shear connectors: steel plate, steel bar (Figure 4e); and strength of concrete: C30, C40. The details of all the specimens are shown in Table 1. Taking ‘P8-14-150-120’ to explain the name of the specimens. ‘P8’ refers to the thickness of the steel plate c = 8 mm, ‘14’ refers to the thickness of the steel tube t = 14 mm, ‘150’ refers to the interlayer spacing of the steel plate s = 150 mm, and ‘120’ refers to the length of the steel plate l = 120 mm.
2.2. Materials Properties
2.2.1. Concrete
The strength grades of the concrete are C30 and C40 in the Chinese code [18] (i.e., the nominal cubic compressive strengths are 30 MPa and 40 MPa, respectively). In the Chinese code, instead of the cylinder tests, the cubic tests with the cube size 150 mm × 150 mm × 150 mm are used for grading concrete. The mix proportions of the concrete are shown in Table 2. The cylinder compressive strength of concrete fc′ can be calculated based on Equation (1) [18]. The mechanical properties of the concrete are summarized in Table 3.
In the evaluation of the concrete strength, for the square CFST column, the confining effect provided by the square steel tube has not been taken into consideration, as recommended by the reference [15].
2.2.2. Steel
The grades of the steel tube and the steel plate used in the test are both Q345. The width-to-thickness (B/t) ratio of the steel tubes are 50.0, 33.3, 25 and 14.3. The limit of the B/t in the JB 138 [19] can be calculated as follows:
According to Equation (2), the design limit of B/t for Q345 steel tube is 50. All the test specimens are within the limit of the deign code. In different codes, there are different requirements for the limit of the width to thickness ratio. And the range for the limits of the B/t is smaller in other codes, such as Eurocode 4 [20], the limit of B/t ratio in Eurocode 4 is stricter.
The grade of the reinforcing bars used in the test is HRB335. A series of tests have been conducted on coupons taken from the steel tube and steel plate (steel bar) to measure the material properties, where the tensile coupons were extracted from flat surfaces. The measured mechanical properties are shown in Table 4, where fy is the yield strength, fu is the ultimate strength, and δ is the elongation.
2.3. Test Scheme
2.3.1. Loading Scheme
A press machine of 3000 kN capacity has been used to apply the axial compression to the test specimens. The test set-up used to conduct the push-out tests is shown in Figure 5. A square loading plate with a cross-sectional area slightly smaller than that of the inner diameter of steel tube has been used to apply the axial compression to the concrete. A 50 mm thick square loading plate has been used. This is to ensure that the square steel plate has enough stiffness. During the push-out tests, the compression force has been applied to the inner concrete only through the square loading plate, while an end plate has been placed at the bottom to support the test specimen. The mechanism of the loading tests is uniaxial loading, and all the specimens have been tested under a loading rate of 2 kN/s. The load classification control has been used before the slippage reaches 2 mm, and each load increment is 10 kN. When the slippage reaches 2 mm, the displacement control has been used, and each displacement increment is 0.5 mm. When the slippage reaches about 20 mm, the loading stops.
2.3.2. Arrangement of Measurements
A total of three displacement meters have been installed to measure the slippage between the steel tube and the core concrete, as shown in Figure 5. A hole has been opened at the 20 mm thick baseplate on the bottom of steel tube, to enable the displacement meter to measure the bottom surface displacement of the concrete through the hole. Two displacement meters have been installed on the left and right sides of the loading plate to measure the displacements between the end plates. The longitudinal strain gauges have been installed in the lateral height direction of the steel tube to measure the strain at the corresponding points.
3. Test Results and Theoretical Analysis
3.1. Failure Mode
For the relatively small width to thickness ratio of the steel tube specimens (i.e., B/t = 14.3, 25, 33.3), the failure mode is shear damage of the core concrete, and there is no significant deformation of the steel tube. This is “Failure Mode A” shown in Figure 6a. There is also shear failure in the core concrete of the steel tube specimens with a relatively large width to thickness ratio (i.e., B/t = 50). On the other hand, Specimen P8-4-150-120 with the width to thickness ratio of 50 has a slight local buckling (2–3 mm) on the surface of the steel tube. This is “Failure Mode B” shown in Figure 6b, and the photo of Specimen P8-4-150-120 is shown in Figure 6c. In Figure 6c, two local buckling are observed, which are highlighted in the red circle. One local buckling is at the upper steel tube, and another one is at the lower steel tube. According to the observation during the test, the local buckling at the lower steel tube occurred earlier than the one at the upper steel tube. This is because the axial stress of the lower steel tube is higher than the upper steel tube. However, since the local buckling is slight, hence, from the photos, it is not obvious. In Figure 6d, the black area inside the red circle is the scratch area of the steel tube after the test, which is caused by the friction between the steel tube and the concrete during the test. As shown in Figure 6d, the scratch is mainly concentrated in the corner of the steel tube. This is because the restraint effect in the angular region of the steel tube is stronger in the square CFST. This is consistent with the conclusion of the study on the confined effect in concrete-filled steel tube [15]. After the completion of the test, the steel tube has been cut open so as to observe the side of the core concrete. From the observation, there is significant shear failure in the concrete at the top of steel plate, while there are no significant damages to the rest of the concrete or the steel plates, as shown in Figure 6e,f. Usually, for the shear connectors inside a CFST tube, there is shear failure of the concrete or the shear failure of the shear connector. Based on the observation of the failure, it can be seen that for the steel plate shear connectors type used in this experiment, the failure mode is the shear failure of the concrete.
3.2. Load-Displacement Relationships and Parametrical Study
The test results of the ultimate bearing capacity of the specimens are shown in Table 4. The load-displacement curves of the specimens are shown in Figure 7. The parametrical studies are as follows.
3.2.1. Width to Thickness Ratio of Steel Tube
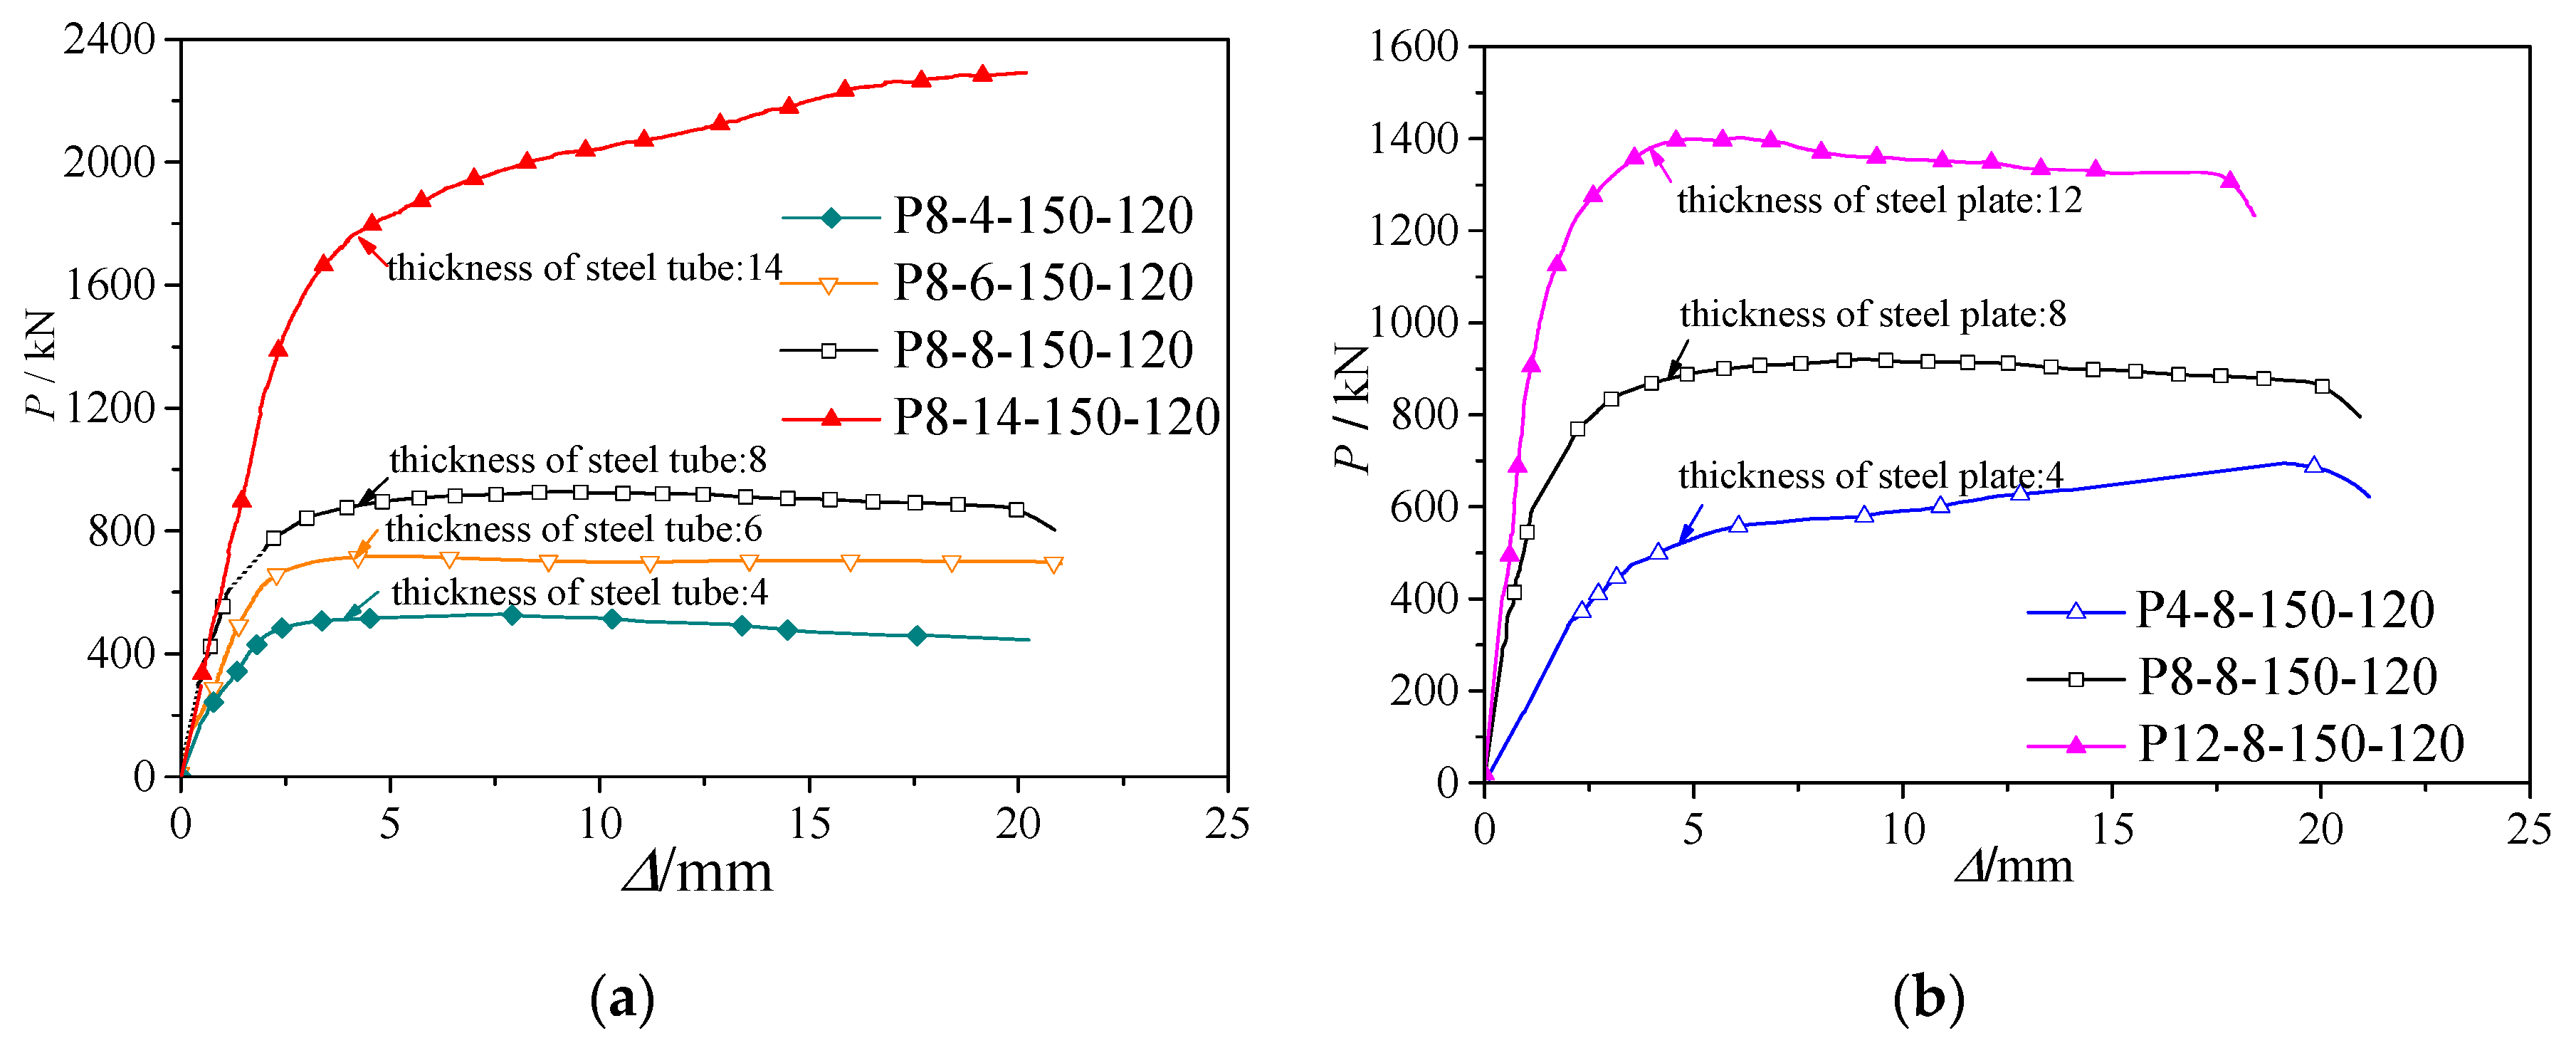
The load-displacement curves of different width to thickness ratios of the specimens are shown in Figure 7a. The width to thickness ratios of Specimens P8-4-150-120, P8-6-150-120, P8-8-150-120, P8-14-150-120 are 50, 33.3, 25 and 14.3, respectively. The ultimate bearing capacities of these four specimens are 527.9 kN, 709.3 kN, 921.0 kN, 2284.0 kN, respectively. Comparing them with that of specimen P8-4-150-120, the ultimate bearing capacities have increased by 34.4%, 74.5% and 332.7%, respectively. Hence, both the ultimate bearing capacity and the initial stiffness increase with decreasing width to thickness ratio of the steel tube. This is due to the increasing restraint ability of the steel tube to the core concrete as the width to thickness ratio of the steel tube decreases.
3.2.2. Thickness of Steel Plate
The load-displacement curves of different thicknesses of the steel plate of the specimens are shown in Figure 7b. The thicknesses of the steel plate of Specimens P4-8-150-120, P8-8-150-120, P12-8-150-120 are 4 mm, 8 mm and 12 mm, respectively. The ultimate bearing capacities are 694.5 kN, 921.0 kN and 1401.6 kN, respectively. The ultimate bearing capacities of Specimens P8-8-150-120, P12-8-150-120 are 32.6%, 101.8% greater than that of Specimen P4-8-150-120, respectively. It can be seen that both the ultimate bearing capacity and the initial stiffness increase with the increasing thickness of the steel plate. This is due to the increase in the contact area of the steel plate and concrete (projection area) as the thickness of the steel plate increases. Therefore, the ultimate bearing capacity and the initial stiffness can be increased effectively.
3.2.3. Length of Steel Plate
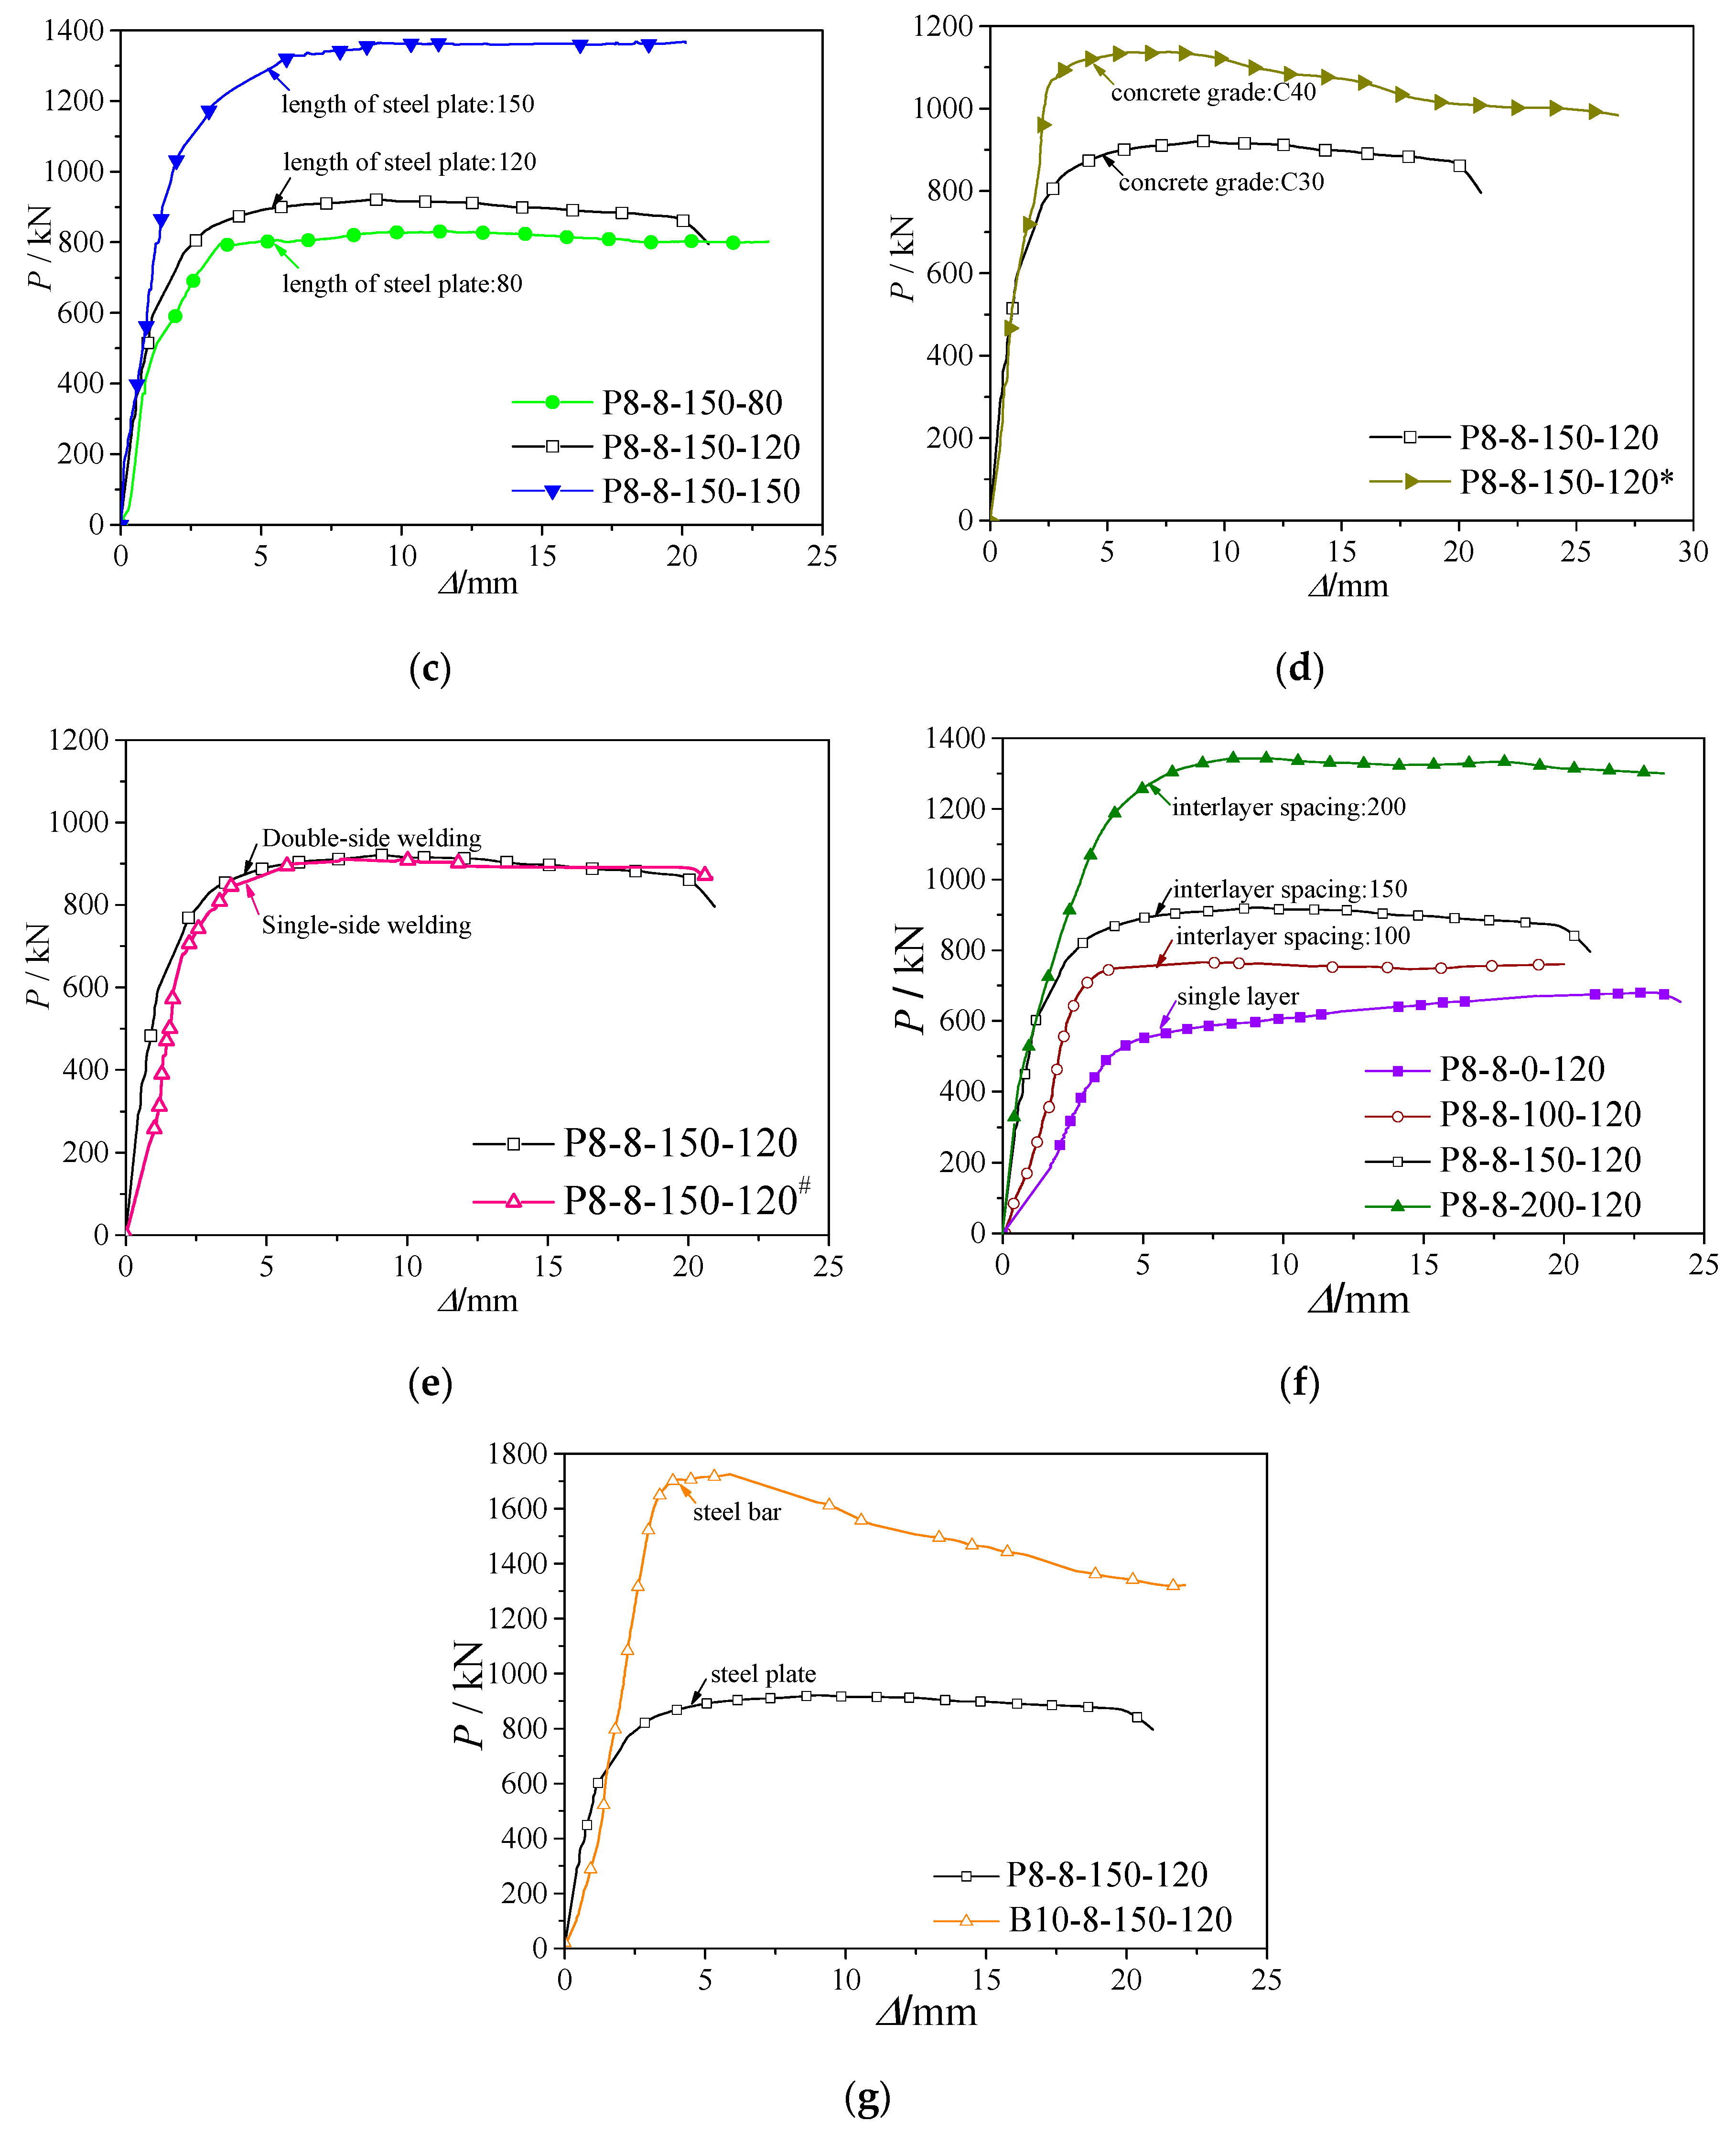
The load-displacement curves of different lengths of steel plate are shown in Figure 7c. The ultimate bearing capacities of Specimen P8-8-150-80, P8-8-150-120, P8-8-150-150 are 833.0 kN, 921.0 kN, 1379.5 kN, respectively. Comparing with that of Specimen P8-8-150-80, the ultimate bearing capacities of Specimens P8-8-150-120, P8-8-150-150 increase by 13% and 66%, respectively. The ultimate bearing capacity and the initial stiffness increases with increasing length of the steel plate. This is due to the increase in the contact area of steel plate and concrete. And as mentioned in Section 3.1, the scratch is mainly concentrated in the corner of the steel tube, which indicates the restraint ability of the steel tube to the core concrete at the corner is much stronger. Further, the restraint ability is stronger as the length of the steel plate increases. Therefore, the ultimate bearing capacity and the initial stiffness can be increased effectively.
3.2.4. Concrete Strength
The load-displacement curves of the specimens filled with Grade C30 and C40 concretes are shown in Figure 7d. As shown in Figure 7d, the ultimate bearing capacities of Specimens P8-8-150-120, P8-8-150-120* are 921.0 kN, 1131.8 kN, respectively. Comparing with that of Specimen P8-8-150-120, the ultimate bearing capacity of Specimen P8-8-150-120* increases by 1.21 times. Further, it can be seen that the ultimate bearing capacity increases with increasing concrete strength.
3.2.5. Welding Condition of Steel Plate
The load-displacement curves of different welding conditions of the steel plate are shown in Figure 7e. Specimen P8-8-150-120# is single-sided welding, and Specimen P8-8-150-120 is double-sided welding. As shown in Table 4, the ultimate bearing capacities of the two specimens are 914.4 kN and 921.0 kN, respectively. There is practically no difference between the ultimate bearing capacities of the two specimens. Limited in this study, the welding condition has no effect on the ultimate bearing capacity. Hence, if the specimens are designed to have no shear failure on the steel plate or no local bucking on the steel tube, single-sided welding can be used in real-life engineering projects, which reduces the construction tasks.
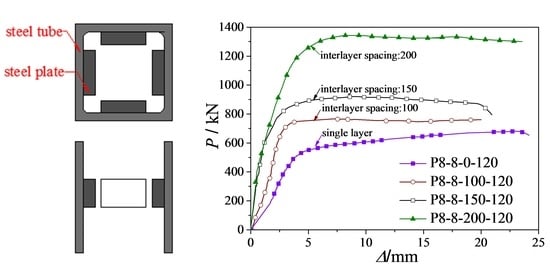
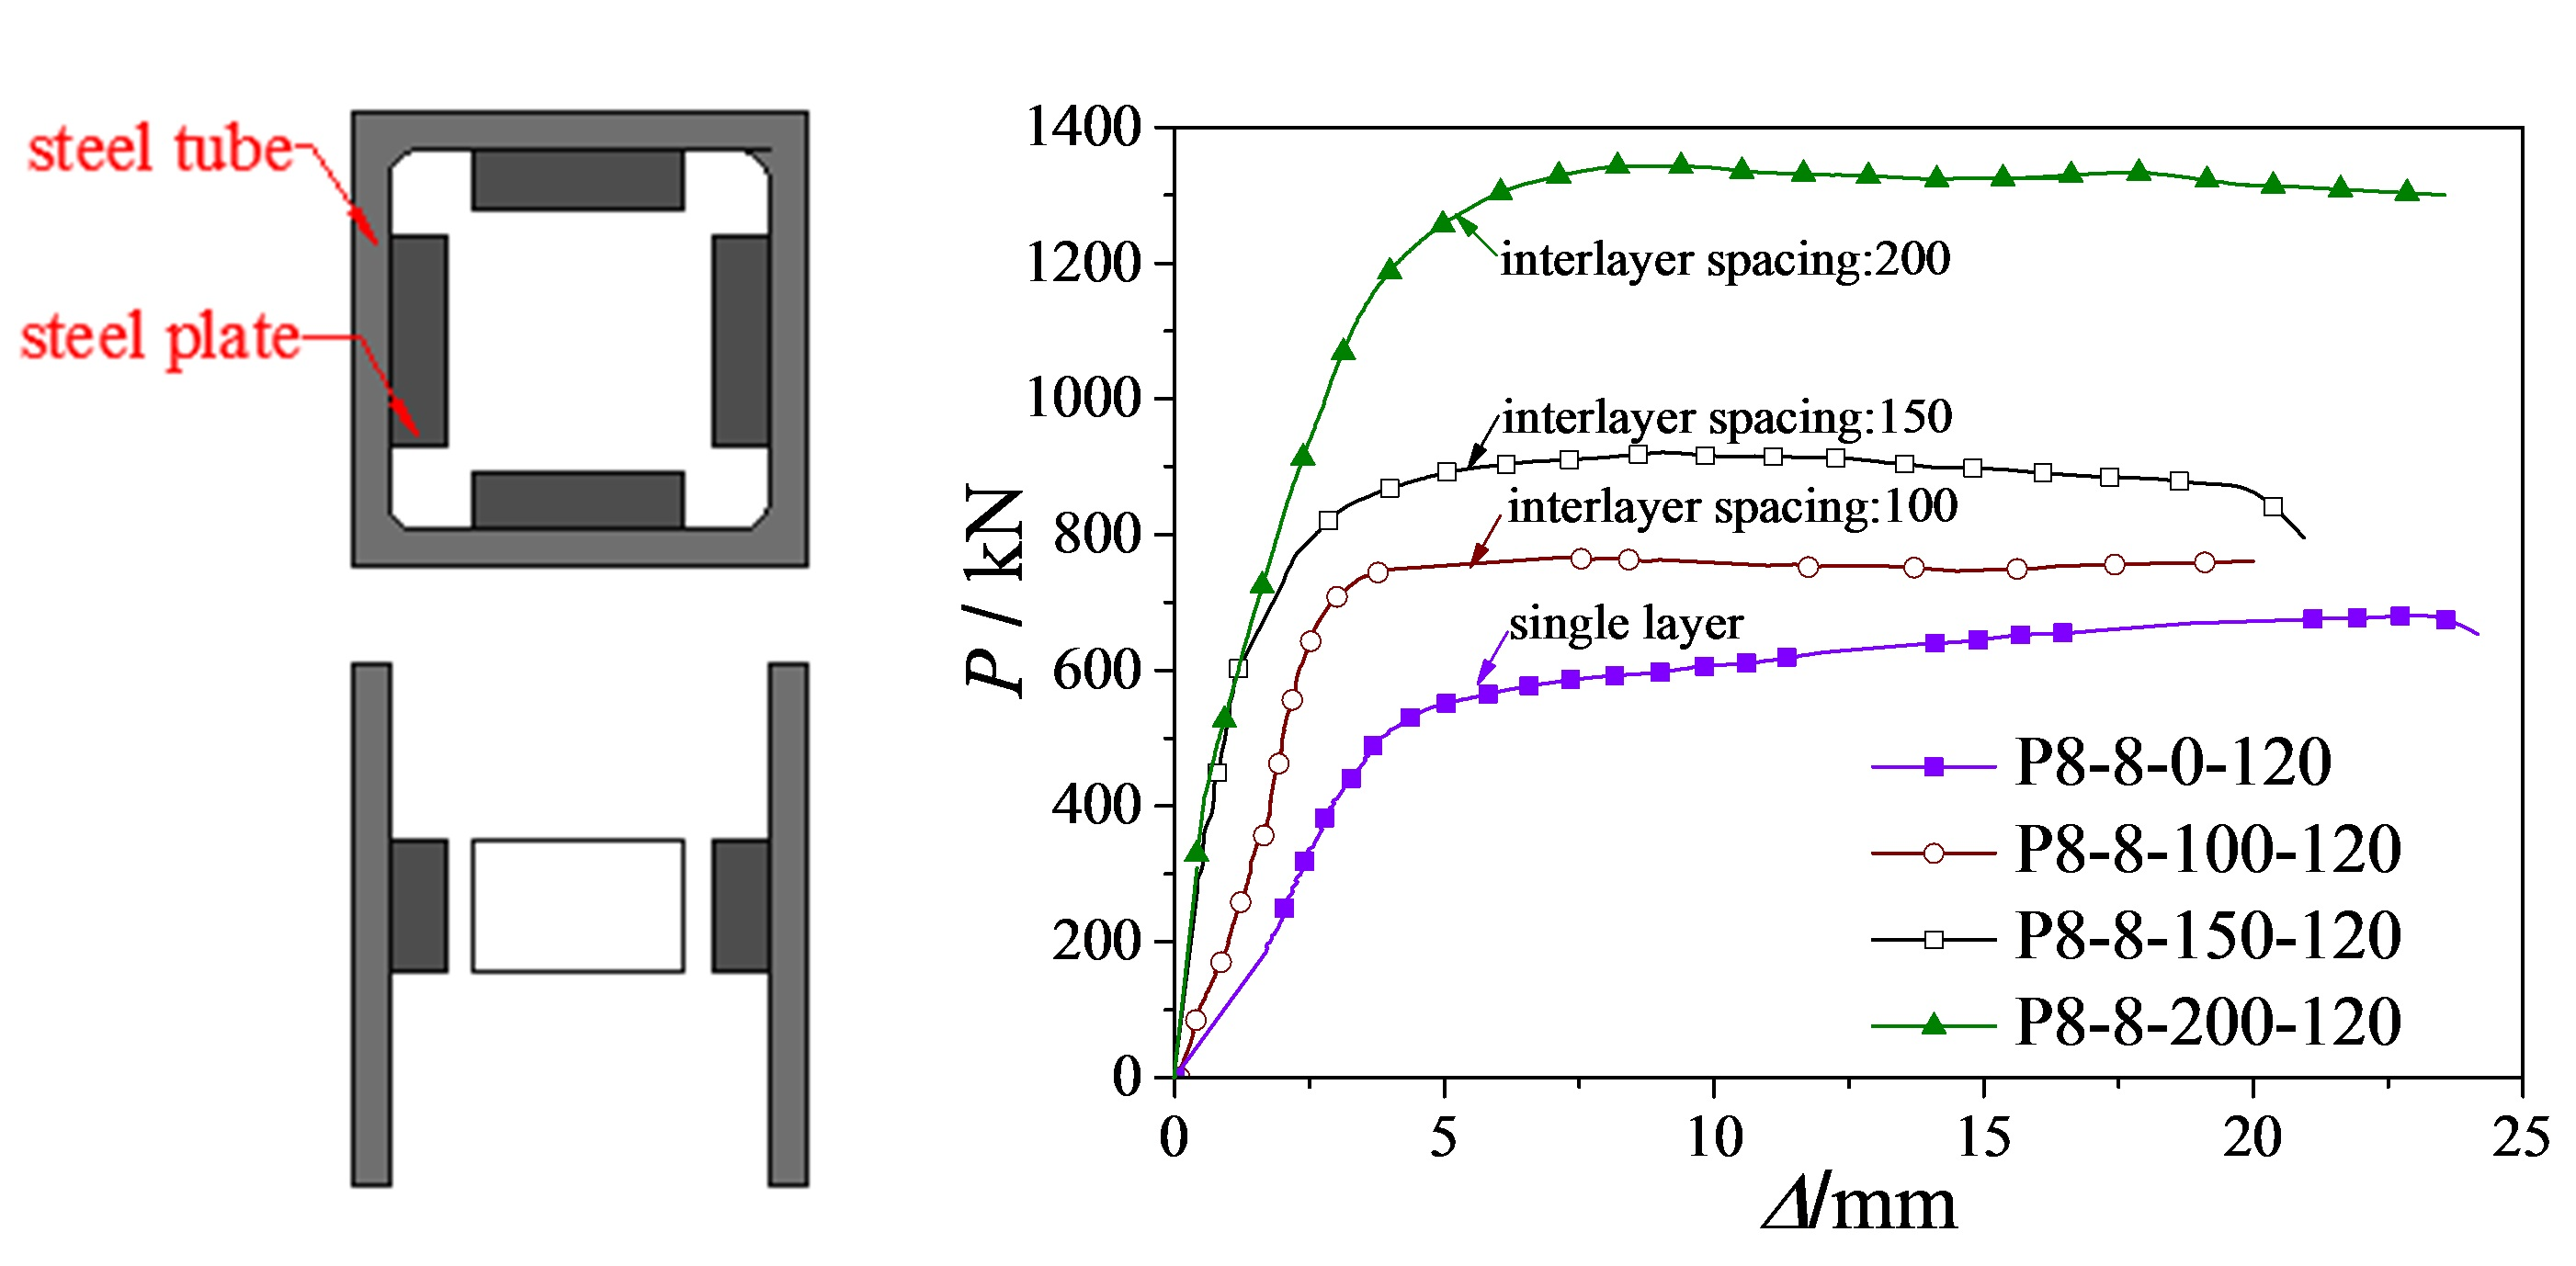
3.2.6. Number of Steel Plate Layer and Interlayer Spacing
The load-displacement curves of different number of layers and their interlayer spacing are shown in Figure 7f. In the figure, Specimen P8-8-0-120 is a single-layer steel plate, other specimens are double-layer steel plates. The interlayer spacings between the steel plates, s, are 100, 150, and 200 mm. The heights of the steel plates, h, are 35 mm for all the specimens. Hence, the s/h ratios for these three specimens are 2.86, 4.29 and 5.71. As shown in the Figure 7f, the bearing capacities of the double-layer steel plate specimens are higher than that of the single-layer steel plate specimen. Further, there is a correlation between the increase in the bearing capacity and the interlayer spacing (or s/h ratio). The ultimate bearing capacities of Specimens P8-8-100-120, P8-8-150-120, P8-8-200-120 are 1.13, 1.36, 1.98 times higher than that of the single-layer steel plate specimen. It can be seen that the bigger the interlayer spacing of steel plates, the higher the bearing capacity. When the interlayer spacing is 100 mm, the bearing capacity of the double-layer steel plate specimen is only slightly higher than that of the single-layer steel plate specimen. This result is similar to that of reference [21], which is for circular concrete-filled steel tubular specimens. This is because the two steel plates affect each other. Hence, the plates are unable to exert the maximum capacity of each layer. When the interlayer spacing is 200 mm, the bearing capacity of the double-layer steel plate specimen is 1.98 times higher than that of the single-layer steel plate specimen. This is an indication that the interaction between the two steel plates is minimal under this interlayer spacing (or s/h ratio). This result is consistent with that of the study [22], which is for a circular concrete filled steel tube. Therefore, in order to ensure each steel plate can exert its maximum effect, the design spacing to the height ratio of the steel plate should be smaller than 5.7.
Figure 8 shows the relationship between the enhancement coefficient β and the s/h ratio of the steel plate. In the figure, the black dots are the test data; the solid line is the fitting curve. According to the test, the equation for the fitting curve is β = 0.2969s/h + 0.2145, however, this equation is complicated. The simplified equation β = 0.30s/h + 0.22 has been developed, which will be more applicable for the design. Equation (3) can be used to calculate the enhancement coefficient β of double-layer steel plates.
3.2.7. Types of Shear Connectors
The load-displacement curves of different types of shear connectors are shown in Figure 7g. In the figure, Specimen P8-8-150-120 is a steel plate, and Specimen B10-8-150-174 is a steel bar. The ultimate bearing capacities of Specimens P8-8-150-120 and B10-8-150-174 are 921.0 kN and 1725.5 kN, respectively. The ultimate bearing capacity of Specimen B10-8-150-174 is 1.87 times higher than that of Specimen P8-8-150-120. It can be seen that with the same amount of steel, the bearing capacity of the steel bars with the same number of layers increases significantly. In a construction site, steel bars are easier to draw and process. Hence, they can be used in engineering design. However, after reaching the ultimate bearing capacity, the capacity of the steel bar specimen drops faster than that of the steel plate specimen.
3.3. Strain Analysis
Figure 9a shows the strain characteristics of Specimen P8-8-0-120 and Figure 9b shows the strain distribution along the height of Specimen P8-8-0-120. The longitudinal strain gauges have been installed at 100 mm and 250 mm from the top of the specimen to measure the strains at the measuring points. The vertical axis of the strain distributions in Figure 9b corresponds to the height of the steel tube, and the dotted line markings correspond to the upper and lower strain gauges of Specimen P8-8-0-120, respectively. The horizontal axis is the corresponding strain value. The eight solid lines in Figure 9b have been selected for different stress states from the initial to the subsequent loadings.
As shown in Figure 9, the strain at 250 mm from the top of Specimen P8-8-0-120 is approximately 2~5 times bigger than that at 100 mm from the top of Specimen P8-8-0-120. This is because at the upper strain gauge, the vertical load acting on the core concrete has been transmitted to the steel tube only through the bonding between steel tube and the core concrete, and the bonding is small. On the other hand, at the lower strain gauge, the load of the specimen has been transmitted from the core concrete to the steel tube through the steel plate. This is an indication that the steel plate can effectively transmit the load between the steel tube and the core concrete, thereby improving the performance of the steel tube and concrete.
4. Calculation of the Ultimate Bearing Capacity
The test results show that the specimens fail because of the shear failure of the conrete and the stress state is shown in Figure 10. ’Recommendations for Design and Construction of Concrete Filled Steel Tubular Structures’ [15] gives the Equation (4) to calculate the ultimate bearing capacity.
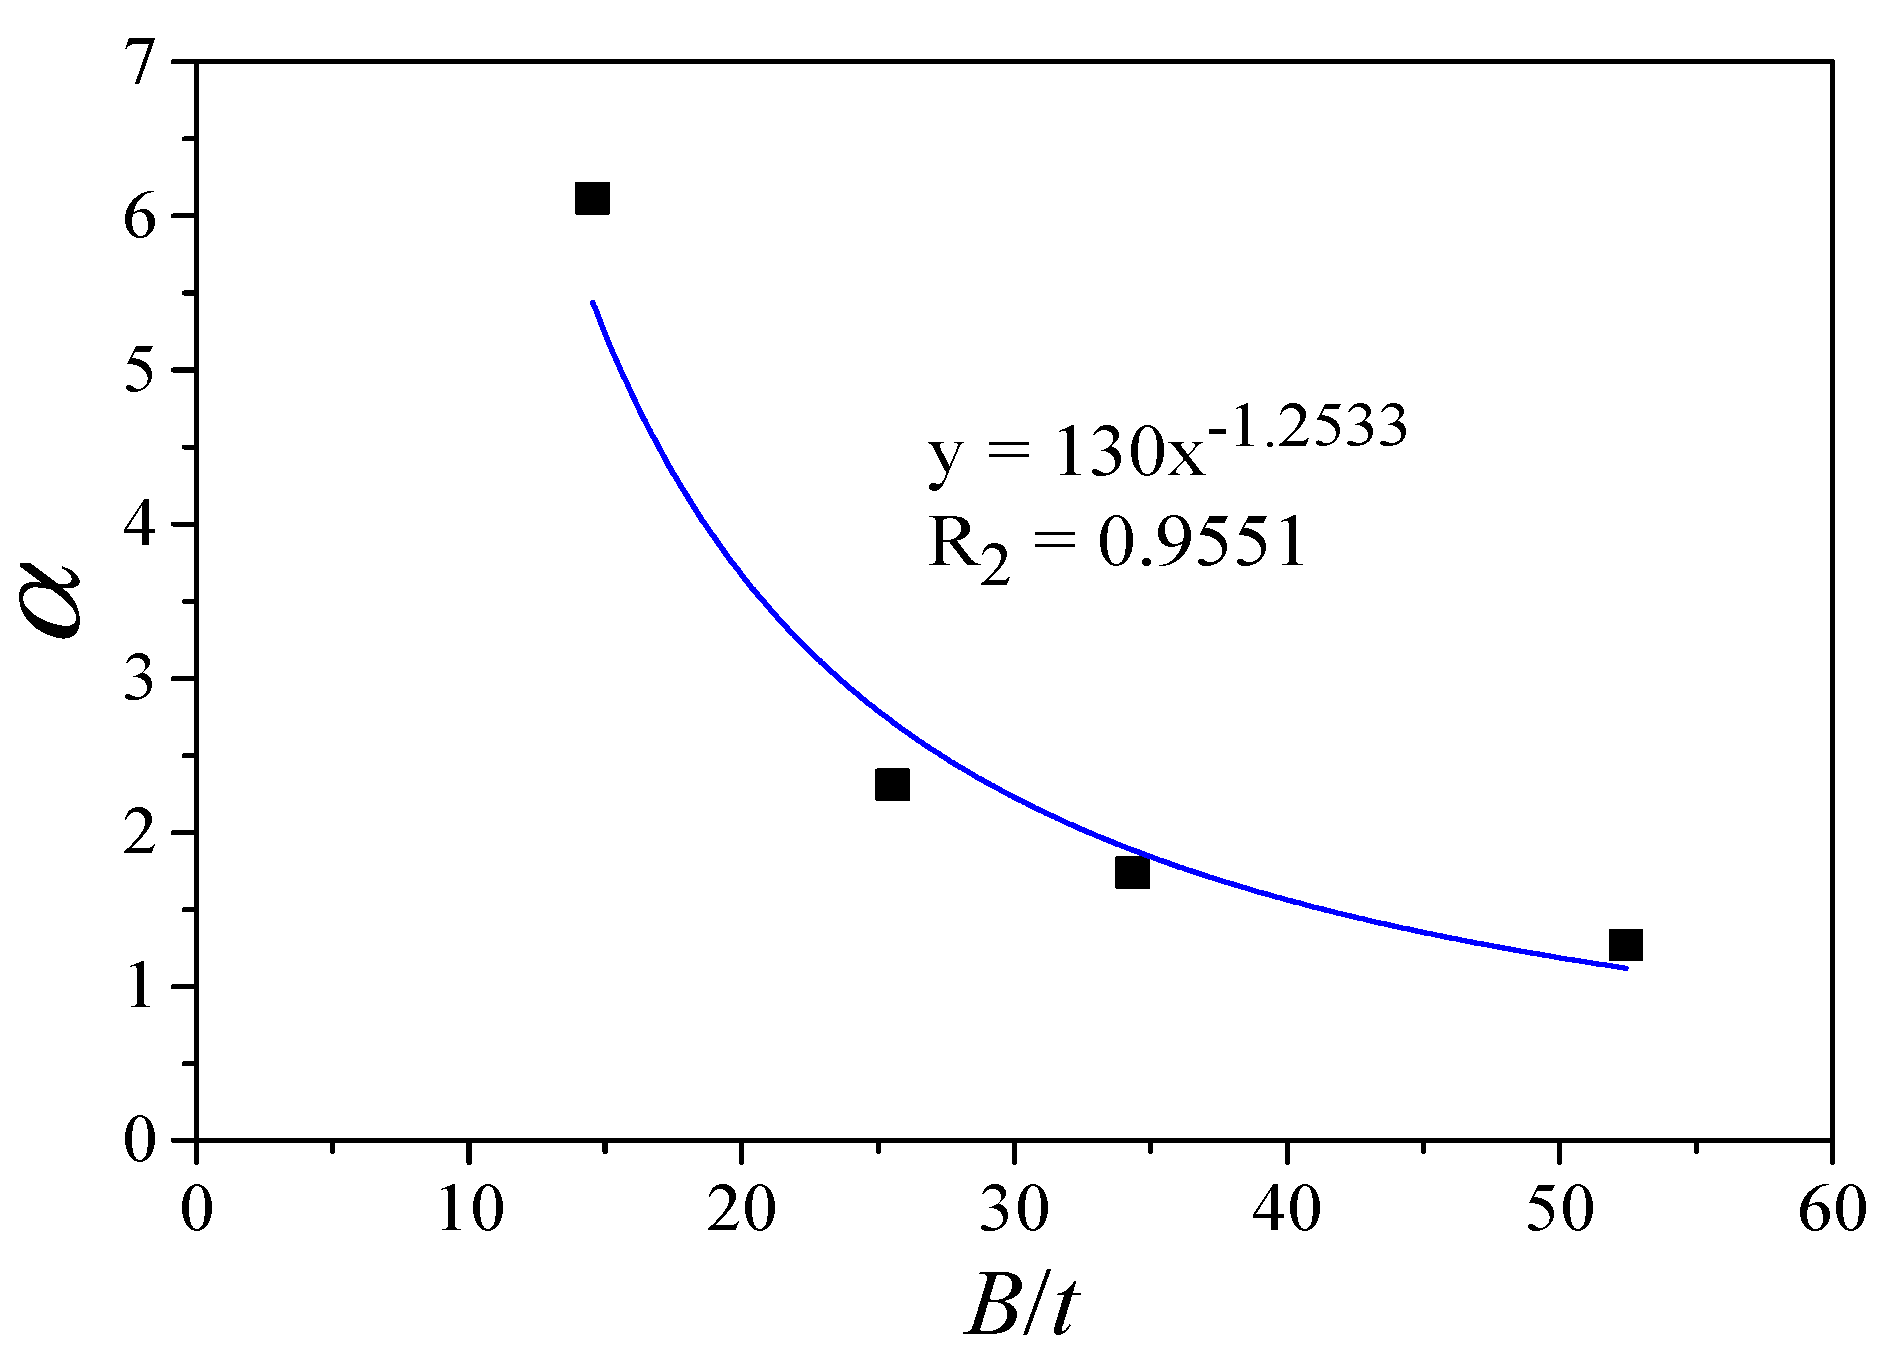
In Equation (4), the width-to-thickness ratio (B/t) is not taken into consideration because in reference 15, rather than steel plates, the diaphragms are adopted as the shear connectors. When using diaphragms, the confinement caused by the diaphragms is very strong, so that the B/t effect can be omitted. However, when using steel plates as the shear connectors, the B/t effect should not be omitted. Hence, considering the B/t effect, the coefficient α corresponding to the B/t ratio has been proposed, and the following Equation (5) can be obtained.
Equation (6) has been developed for calculating the ultimate bearing capacity of double-layer shear connectors.
where Pu is the ultimate bearing capacity; Ac is the cross-sectional area of the core concrete; Ab is the projection area of the steel plate as shown in Figure 10; and fc′ is the concrete strength. α is the influential factor for the width to thickness ratio of the steel tube, as given by Figure 11; In Figure 11, the black dots are the test data; the solid curve is the fitting curve; β is the influential factor for the s/h raito of steel plates, as given in Equation (3) and Figure 8.
The comparison of the calculated ultimate bearing capacities and the test data is shown in Table 5. It can be seen that the calculated capacities are in good agreement with the test datas. The average test data to calculated values ratio is 1.068. For some specimens, the value of Pu.exp/Pu.cal is relative higher, especially for specimens P12-8-150-120 and P8-8-150-150, the values are 15.3% and 22.3%. For specimen P12-8-150-120, the steel plate is thicker, and for specimen P8-8-150-150, the steel plate is longer. Hence, for both specimens, the confinement caused by the steel plate is stronger than other specimens. According to reference [15], the confinement to the concrete is not considered in the calculation, hence, the calculation will slightly underestimate the experimental results. In other words, the values of Pu.exp/Pu.cal becomes higher. However, these calculated capacities are in conservative side, therefore, the developed formula for calculating the ultimate bearing capacity can be used in engineering design.
5. Conclusions
Through the push-out tests of 14 square CFSTs with shear connectors, limited in this study, the main conclusions are:
- (1)
- The steel plate can effectively transmit the load between the steel tube and core concrete, and improve the co-working performance of the steel tube and concrete.
- (2)
- Comparing with single-layer steel plate specimens, the ultimate bearing capacities of the double-layer steel plate specimens are greater, and the increase has a good correlation with the spacing to height ratio s/h ratio. Further, the bigger the s/h ratio of steel plates, the greater the bearing capacity. Therefore, the s/h ratio of the steel plate must be less than 5.9 in engineering design.
- (3)
- The width to thickness ratio of the steel tube, the thickness the length of the steel plate all have significant effects on the ultimate bearing capacity and initial stiffness. The ultimate bearing capacity and the elastic stiffness increase with decreasing width to thickness ratio of the steel tube, and increasing thickness and length of the steel plate.
- (4)
- The concrete strength has a significant effect on the ultimate bearing capacity. Further, with concrete of greater strength, the ultimate bearing capacity is also greater.
- (5)
- The welding condition of the steel plate has no effect on the ultimate bearing capacity. Hence, if the shear connectors are designed to have no shear failure on the steel plate or no local bucking on the steel tube, single-sided welding can be used in real-life engineering projects, which reduces the construction tasks.
- (6)
- In the case of the same amount of steel, the bearing capacity of the steel bar specimen with the same number of layers is 87% greater than that of the steel plate specimen. However, the descending part of the steel bar specimen is steeper than that of the steel plate specimen after reaching the ultimate bearing capacity.
- (7)
- The calculation method is proposed for the ultimate bearing capacity, and the calculated capacities are in good agreement with the test data.
Acknowledgments
This work was supported by a National Natural Science Foundation of China grant funded by the Chinese government. (No. 51408017). The support is greatly appreciated. Also, the suggestions on the design of the specimens from Prof. Kawano in Kyushu University in Japan are highly appreciated.
Author Contributions
Qiyun Qiao designed the tests and analyzed the data; Wenwen Zhang performed the tests, analyzed the data and prepared the manuscript; Zhiwei Qian proposed the topic of this study, analyzed the data and prepared the manuscript; Wanlin Cao and Wenchao Liu participated in the tests and analyzed the data.
Conflicts of Interest
The authors declare that there is no conflict of interests regarding the publication of this paper.
References
- Song, J.Y.; Kwon, Y.B. Structural behavior of concrete-filled steel box sections. In International Conference Report on Composite Construction-Conventional and Innovative; IABSE: Zurich, Switzerland, 1997; pp. 795–801. [Google Scholar]
- Han, L.H. Tests on stub columns of concrete-filled RHS sections. J. Constr. Steel Res. 2002, 58, 353–372. [Google Scholar] [CrossRef]
- Giakoumelisa, G.; Lam, D. Axial capacity of circular concrete-filled tube Columns. J. Constr. Steel Res. 2004, 60, 1049–1068. [Google Scholar] [CrossRef]
- Han, L.H. The influence of concrete compaction on the strength of concrete filled steel tubes. Int. J. Adv. Struct. Eng. 2000, 3, 131–137. [Google Scholar] [CrossRef]
- Roeder, C.W.; Cameron, B.; Brown, C.B. Composite action in concrete filled tubes. J. Struct. Eng. ASCE 1999, 125, 477–484. [Google Scholar] [CrossRef]
- Chang, X.; Huang, C.K.; Jiang, D.C.; Song, Y.C. Push-out test of pre-stressing concrete filled circular steel tube columns by means of expansive cement. Constr. Build. Mater. 2009, 23, 491–497. [Google Scholar]
- Aly, T.; Elchalakani, M.; Thayalan, P.; Patnaikuni, I. Incremental collapse threshold for push-out resistance of circular concrete filled steel tubular columns. J. Constr. Steel Res. 2010, 66, 11–18. [Google Scholar] [CrossRef]
- Uy, B.; Tao, Z.; Han, L.H. Bond strength between the steel tube and concrete in concrete-filled steel columns. In Proceedings of the Inaugural Annual Conference of the Institute for Infrastructure Engineering, Sydney, Australia, 22–23 November 2012. [Google Scholar]
- Shakir-Khalil, H. Push out strength of concrete-filled steel hollow sections. Struct. Eng. 1993, 71, 230–243. [Google Scholar]
- An, L.; Cederwall, K. Push-out Tests on Studs in High Strength and Normal Strength Concrete. J. Constr. Steel Res. 1996, 36, 15–29. [Google Scholar] [CrossRef]
- Shim, C.S.; Lee, P.G.; Yoon, T.Y. Static behavior of large stud shear connectors. Eng. Struct. 2004, 26, 1853–1860. [Google Scholar] [CrossRef]
- Pil-Goo, L.; Chang-Su, S.; Sung-Pil, C. Static and fatigue behavior of large stud shear connectors for steel-concrete composite bridge. J. Constr. Steel Res. 2005, 61, 1270–1285. [Google Scholar]
- Xue, W.; Ding, M.; Wang, H.; Luo, Z. Static behavior and theoretical model of stud shear connectors. J. Bridge Eng. ASCE 2008, 13, 623–634. [Google Scholar] [CrossRef]
- CECS 28-1990: Specification for Design and Construction of Concrete Filled Steel Tubular Structures; China Planning Press: Beijing, China, 1992.
- Recommendations for Design and Construction of Concrete Filled Steel Tubular Structures; Architecture Institute of Japan: Tokyo, Japan, 2008.
- Tao, Z.; Song, T.Y.; Uy, B.; Han, L.H. Bond behavior in concrete-filled steel tubes. J. Constr. Steel Res. 2016, 120, 81–93. [Google Scholar] [CrossRef]
- Lai, M.H.; Ho, J.C.M. Confinement effect of ring-confined concrete-filled-steel-tube columns under uni-axial load. Eng. Struct. 2014, 67, 123–141. [Google Scholar] [CrossRef]
- China Ministry of Construction (CMC). Code for Design of Concrete Structures (GB50010-2010); China Ministry of Construction: Beijing, China, 2010. (In Chinese)
- China Ministry of Construction (CMC). Code for Design of Composite Structure (JB 138-2012); China Ministry of Construction: Beijing, China, 2012. (In Chinese)
- Eurocode 4: Design of Composite Steel and Concrete Structures, Part 1.1: General Rules and Rules for Buildings (Together with United Kingdom National Application Document); Draft for Development Preliminary European Standard (DD ENV); British Standards Institution: London, UK, 1994.
- Miyao, T.; Nakamura, N.; Sugiyama, T. Evaluation of bearing strength of backing rings for concrete filled tube. J. Archit. Build. Sci. 1997, 4, 51–56. [Google Scholar] [CrossRef]
- Xue, L.; Cai, S. Experimental study of shear connector of the concrete-filled steel tube. Build. Sci. 1998, 14, 13–21. (In Chinese) [Google Scholar]
Figure 1.
Tianjin 117 super high rise building. (a) Tianjin 117 under construction; (b) Brace in Tianjin 117 building.
Figure 1.
Tianjin 117 super high rise building. (a) Tianjin 117 under construction; (b) Brace in Tianjin 117 building.

Figure 2.
Deformation and slippage of concrete filled steel tube (CFST) column when bonding is not reliable. (a) Axial deformation; (b) Bending deformation; (c) Shear deformation.
Figure 2.
Deformation and slippage of concrete filled steel tube (CFST) column when bonding is not reliable. (a) Axial deformation; (b) Bending deformation; (c) Shear deformation.

Figure 3.
Types of shear connectors. (a) Shear studs; (b) Steel rings; (c) Steel plate.

Figure 4.
Details and dimensions of specimens. (a) Single-layer; (b) Double-layer; (c) Double-sided welding; (d) Single-sided welding; (e) Steel bar.
Figure 4.
Details and dimensions of specimens. (a) Single-layer; (b) Double-layer; (c) Double-sided welding; (d) Single-sided welding; (e) Steel bar.

Figure 5.
Schematic diagram of test set-up.
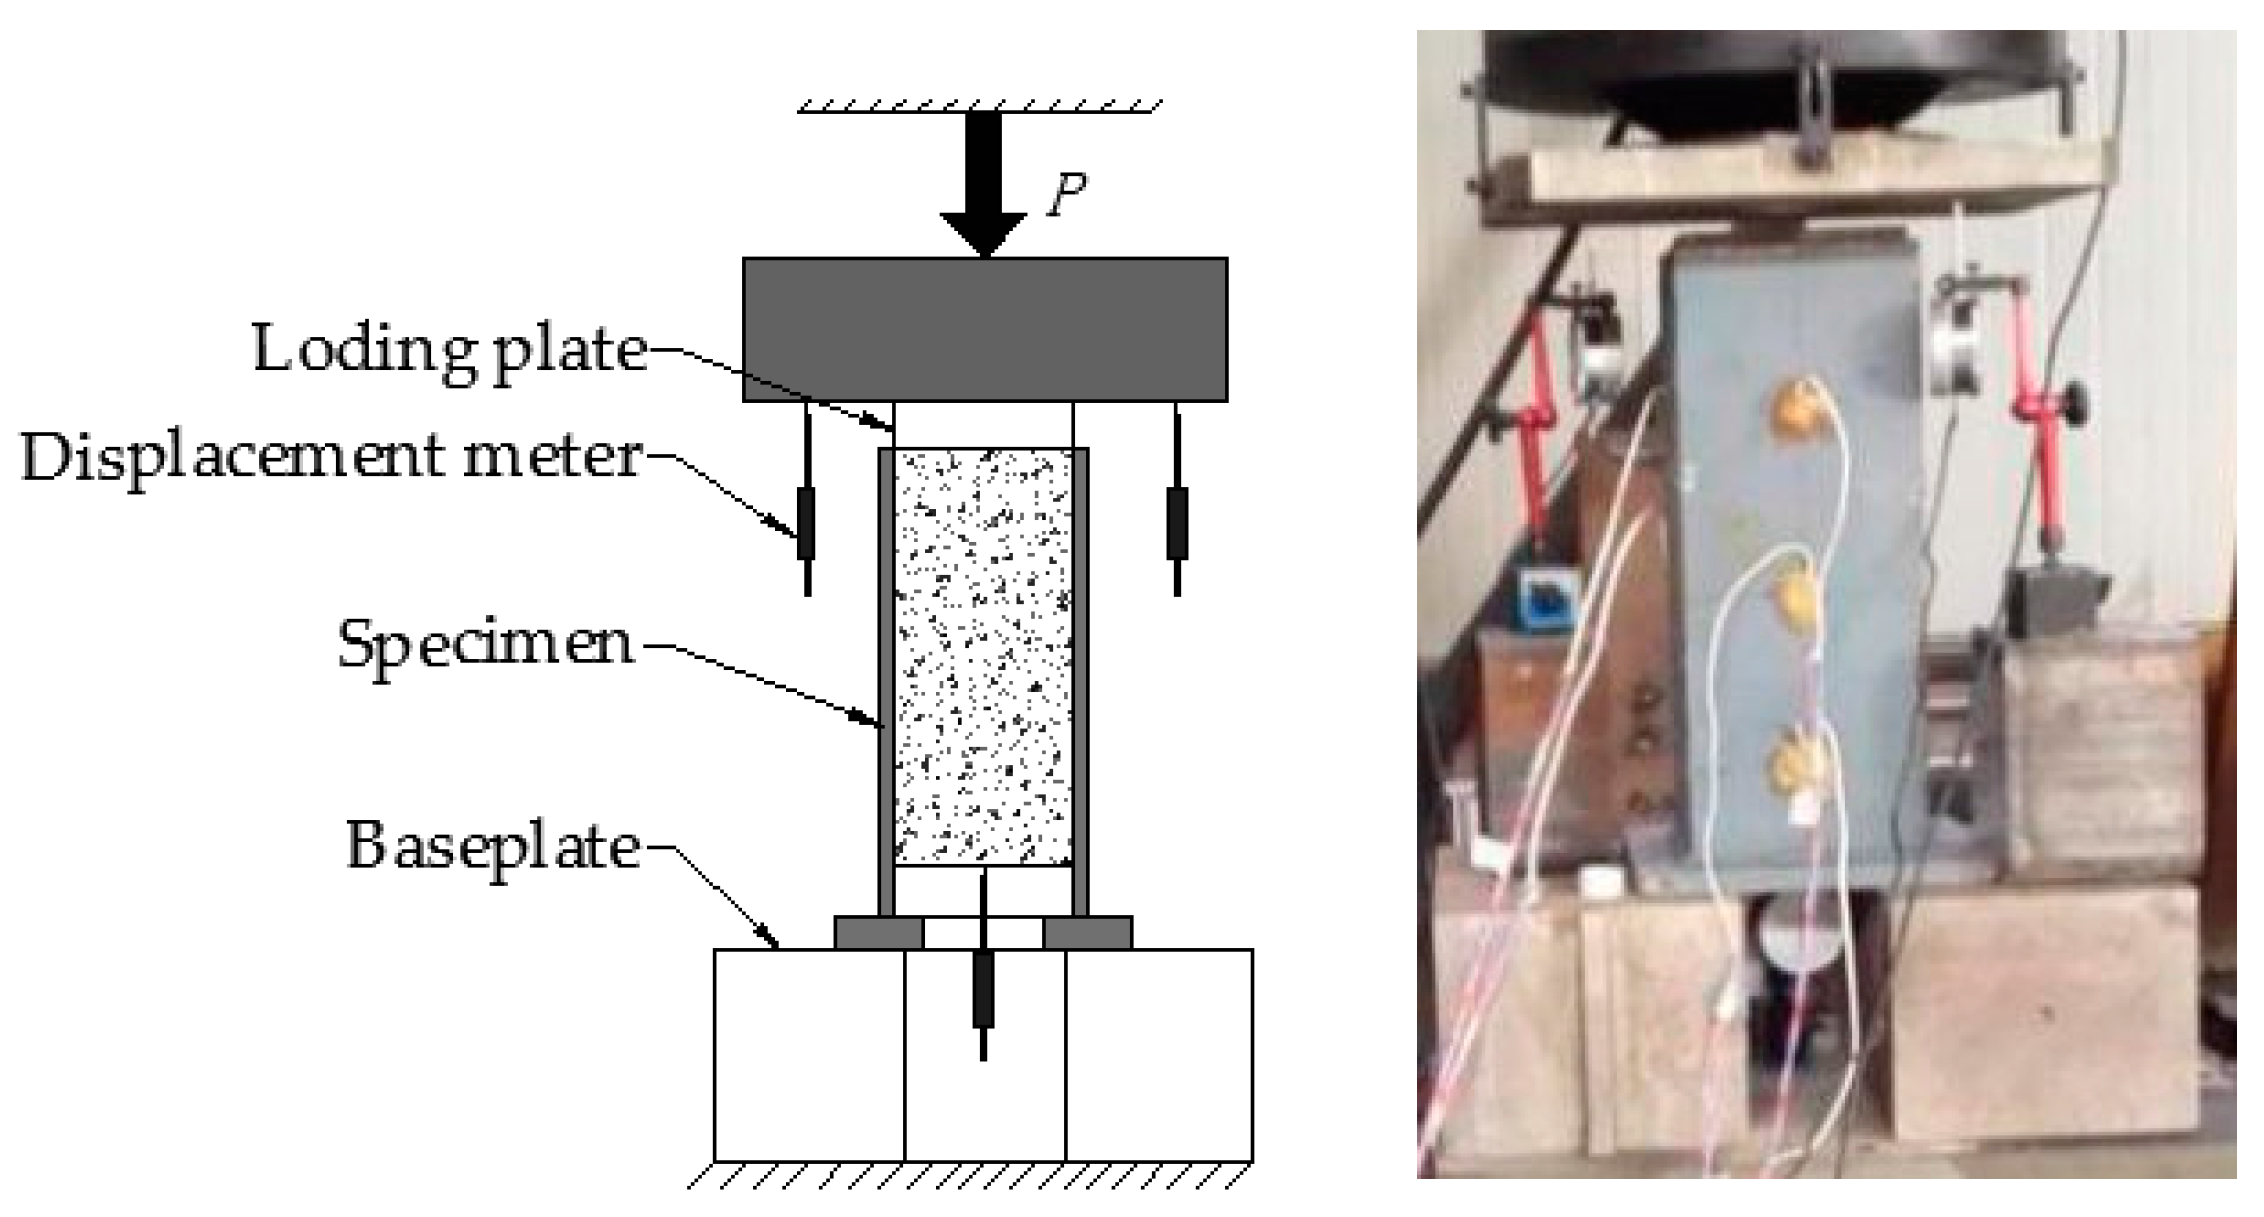
Figure 6.
Failure models of specimens. (a) Failure Mode A; (b) Failure Mode B; (c) Slight local buckling (d) The scratch of inner wall; (e) Shear failure of core concrete; (f) Steel plate.
Figure 6.
Failure models of specimens. (a) Failure Mode A; (b) Failure Mode B; (c) Slight local buckling (d) The scratch of inner wall; (e) Shear failure of core concrete; (f) Steel plate.
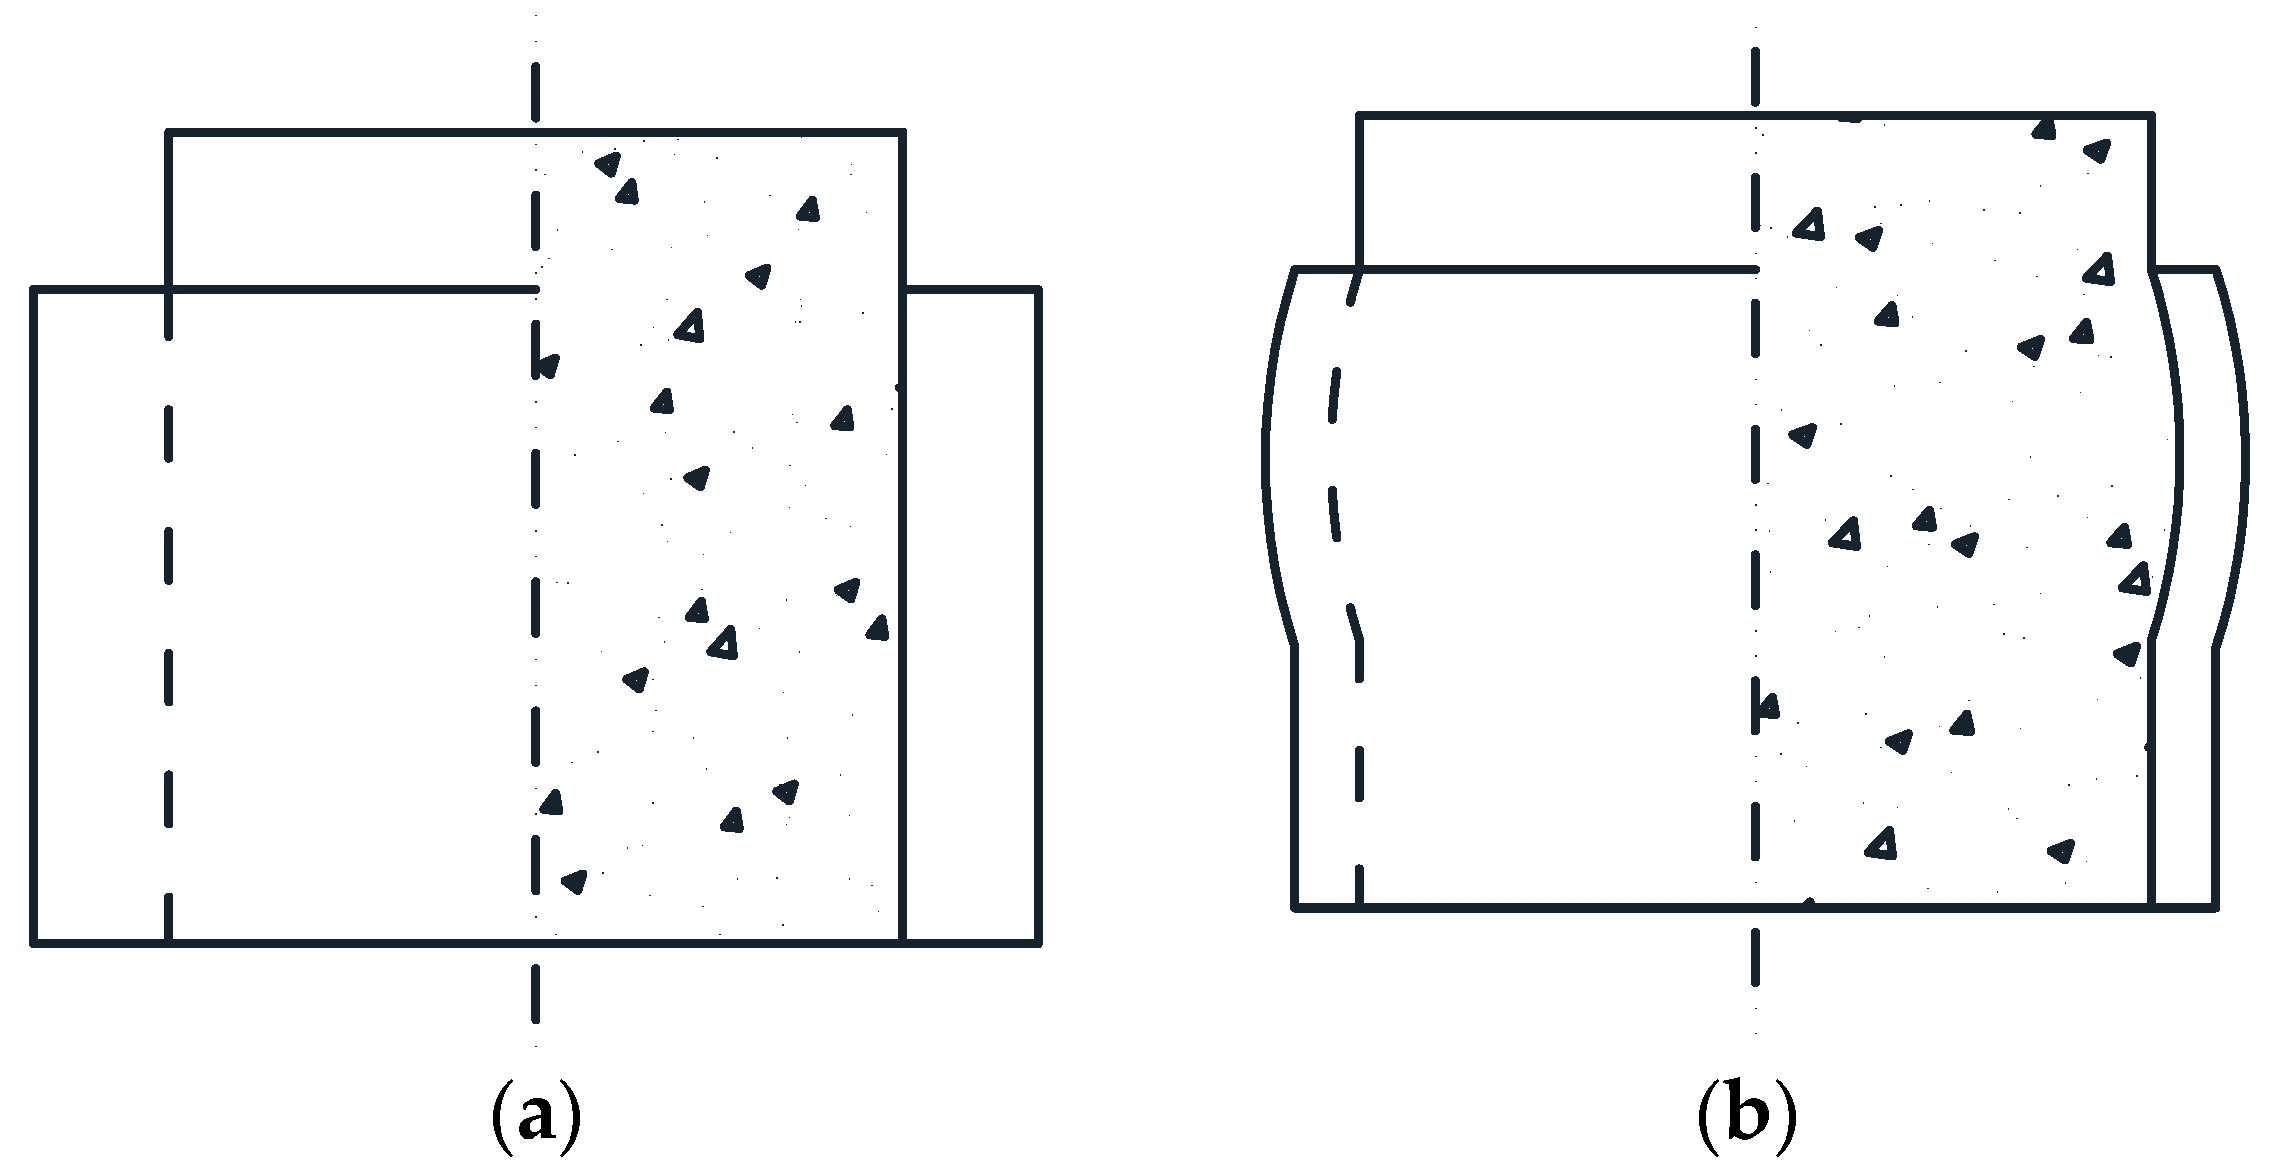
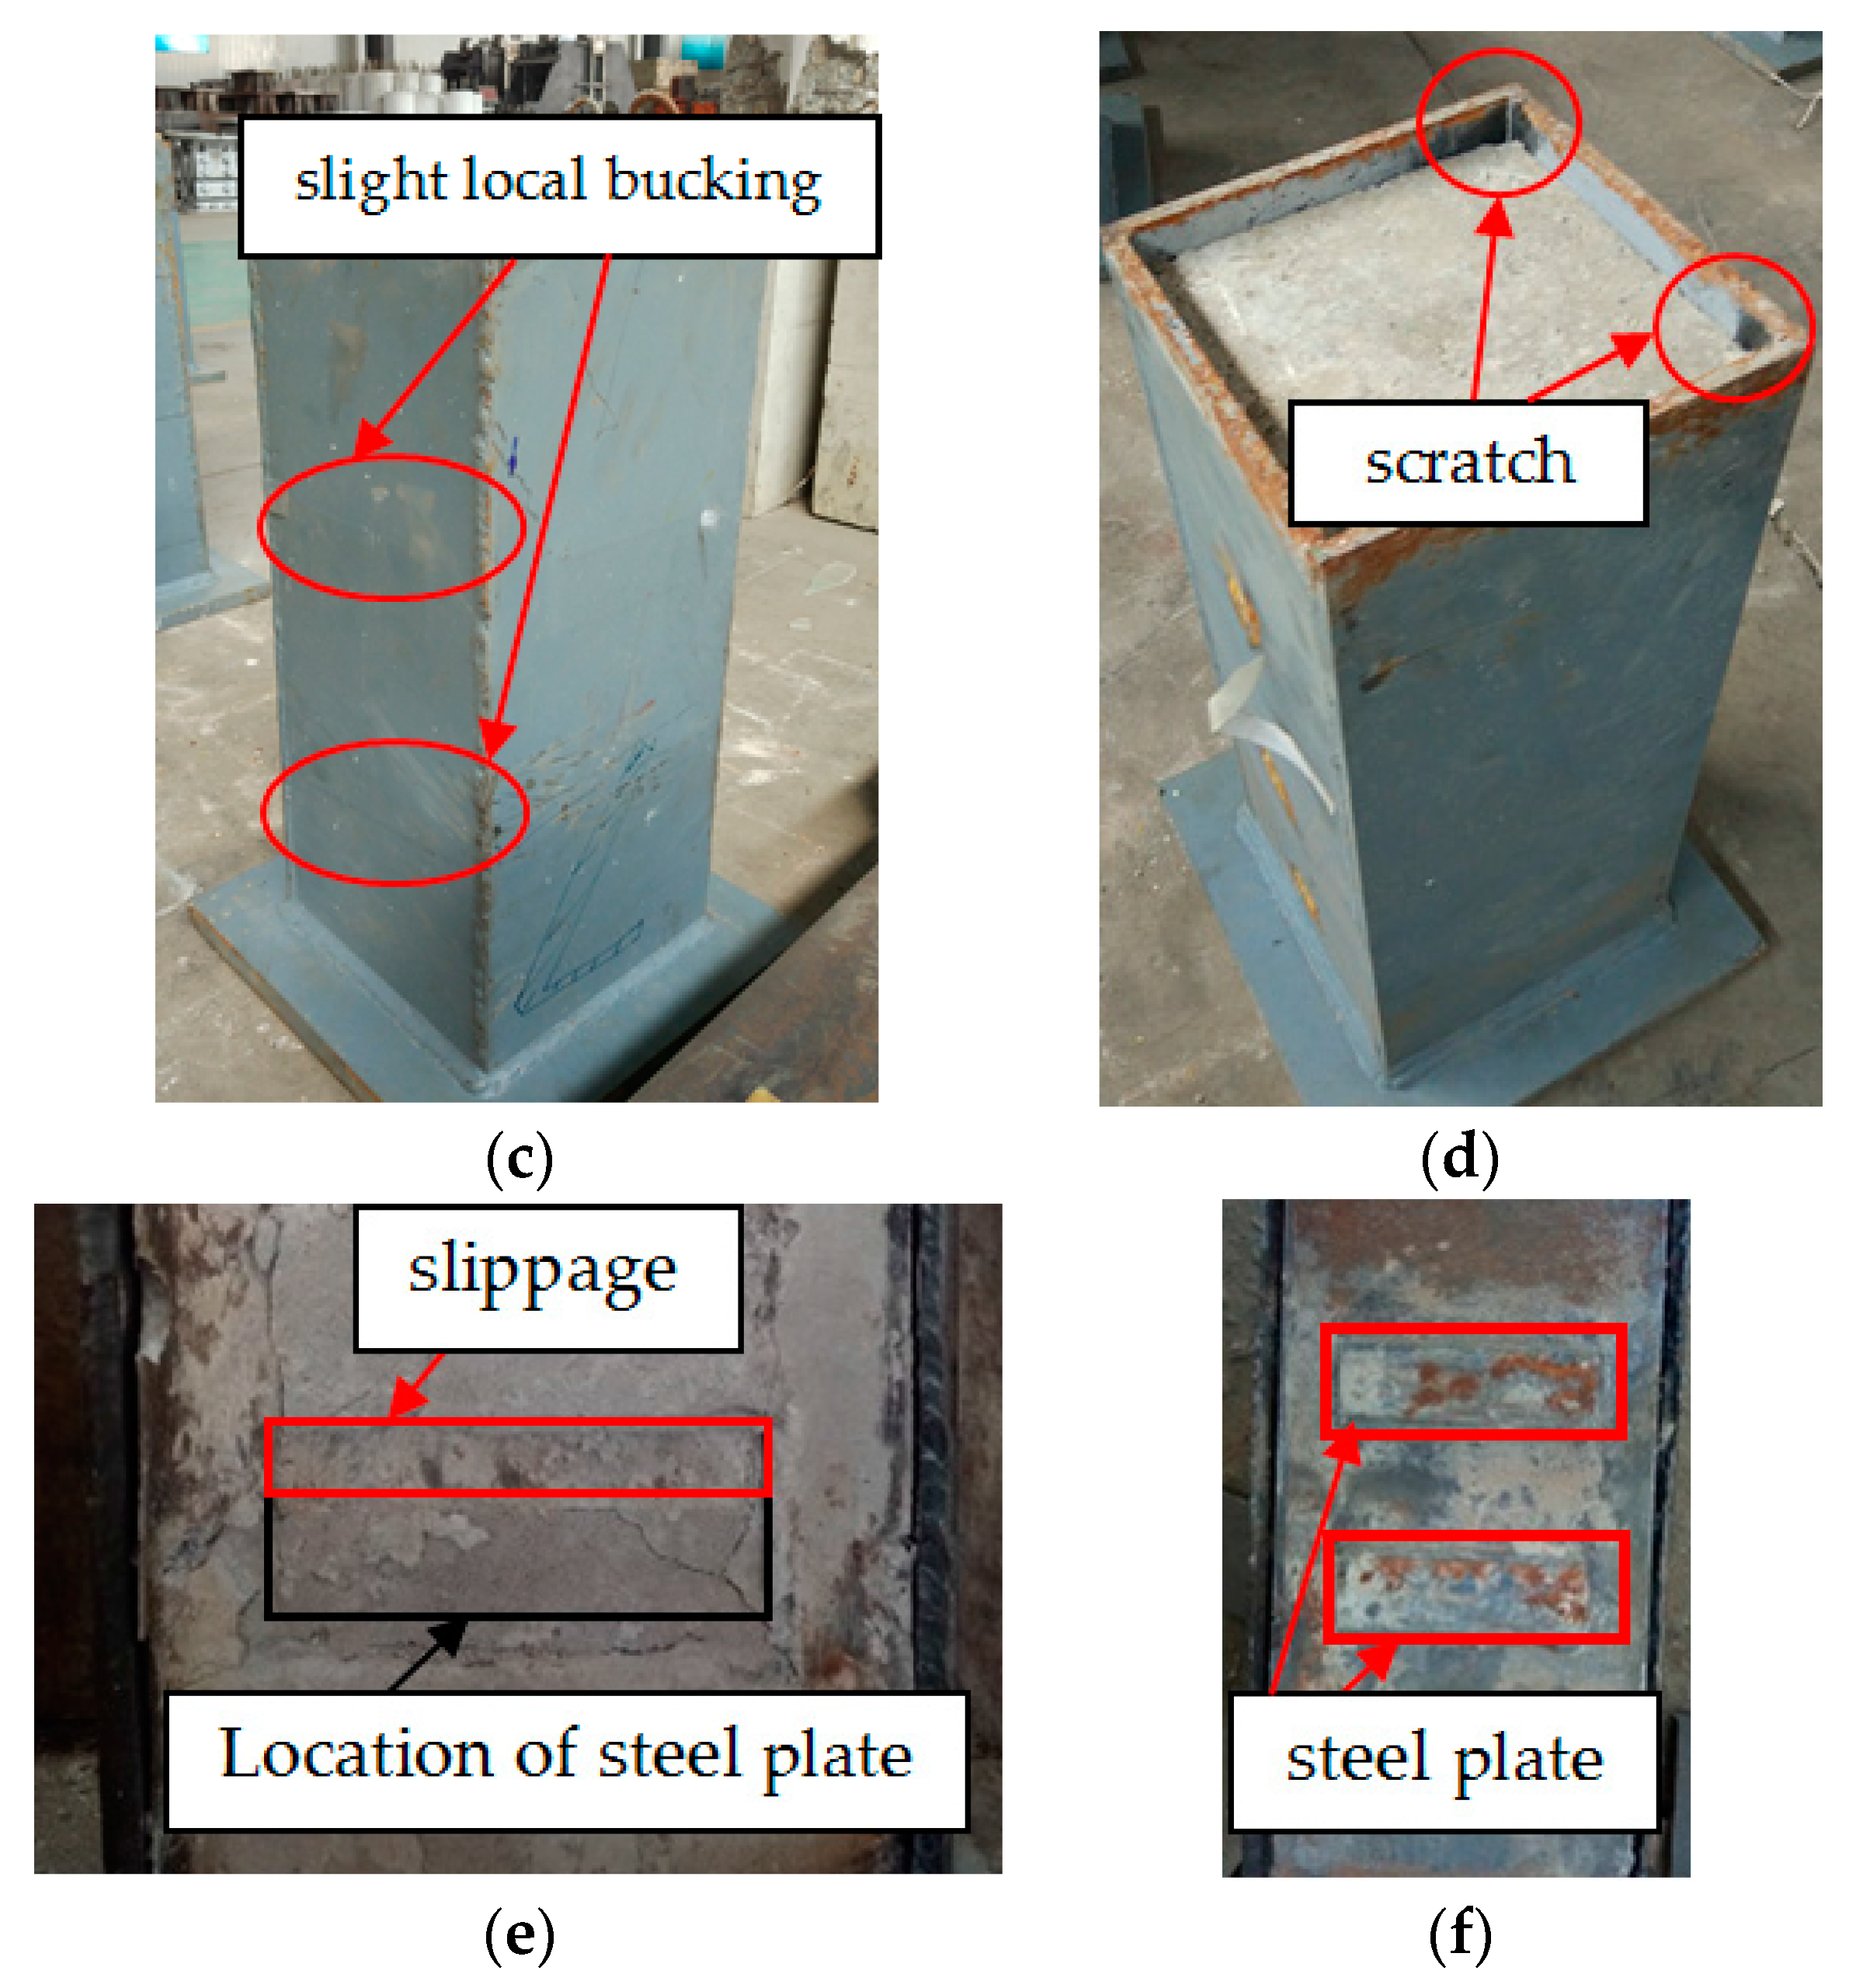
Figure 7.
The load-displacement curves. (a) Effect of width to thickness ratio of steel tube; (b) Effect of thickness of steel plate; (c) Effect of length of steel plate; (d) Effect of concrete strength; (e) Effect of welding condition; (f) Effect of interlayer spacing; (g) Effect of type of shear connectors.


Figure 8.
The relationship between β and s/h.
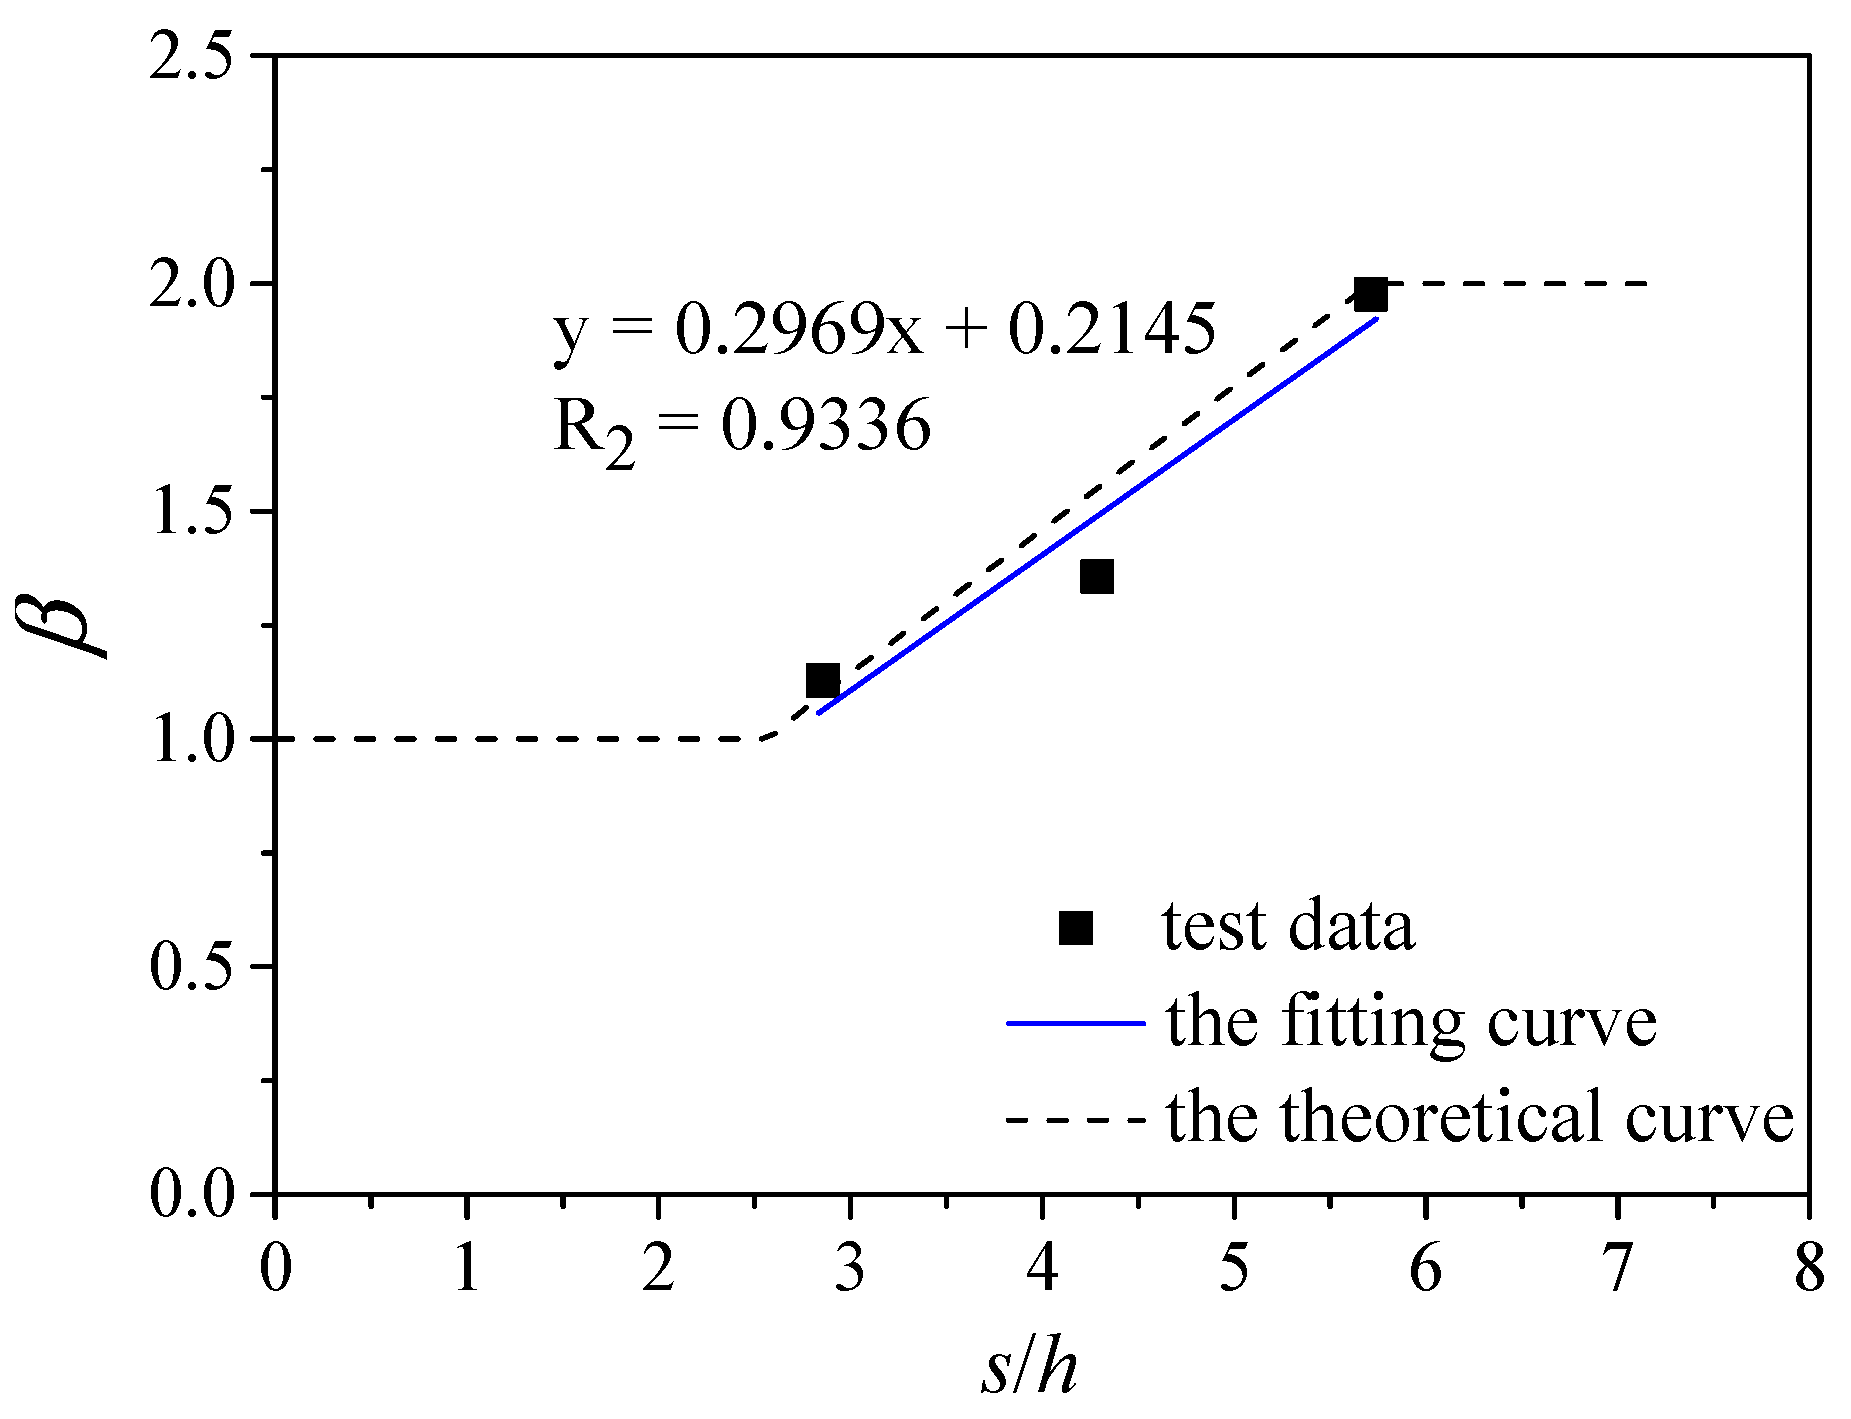
Figure 9.
Strain characteristics of specimen P8-8-0-120. (a) Load-strain curves; (b) Strain distribution.
Figure 9.
Strain characteristics of specimen P8-8-0-120. (a) Load-strain curves; (b) Strain distribution.
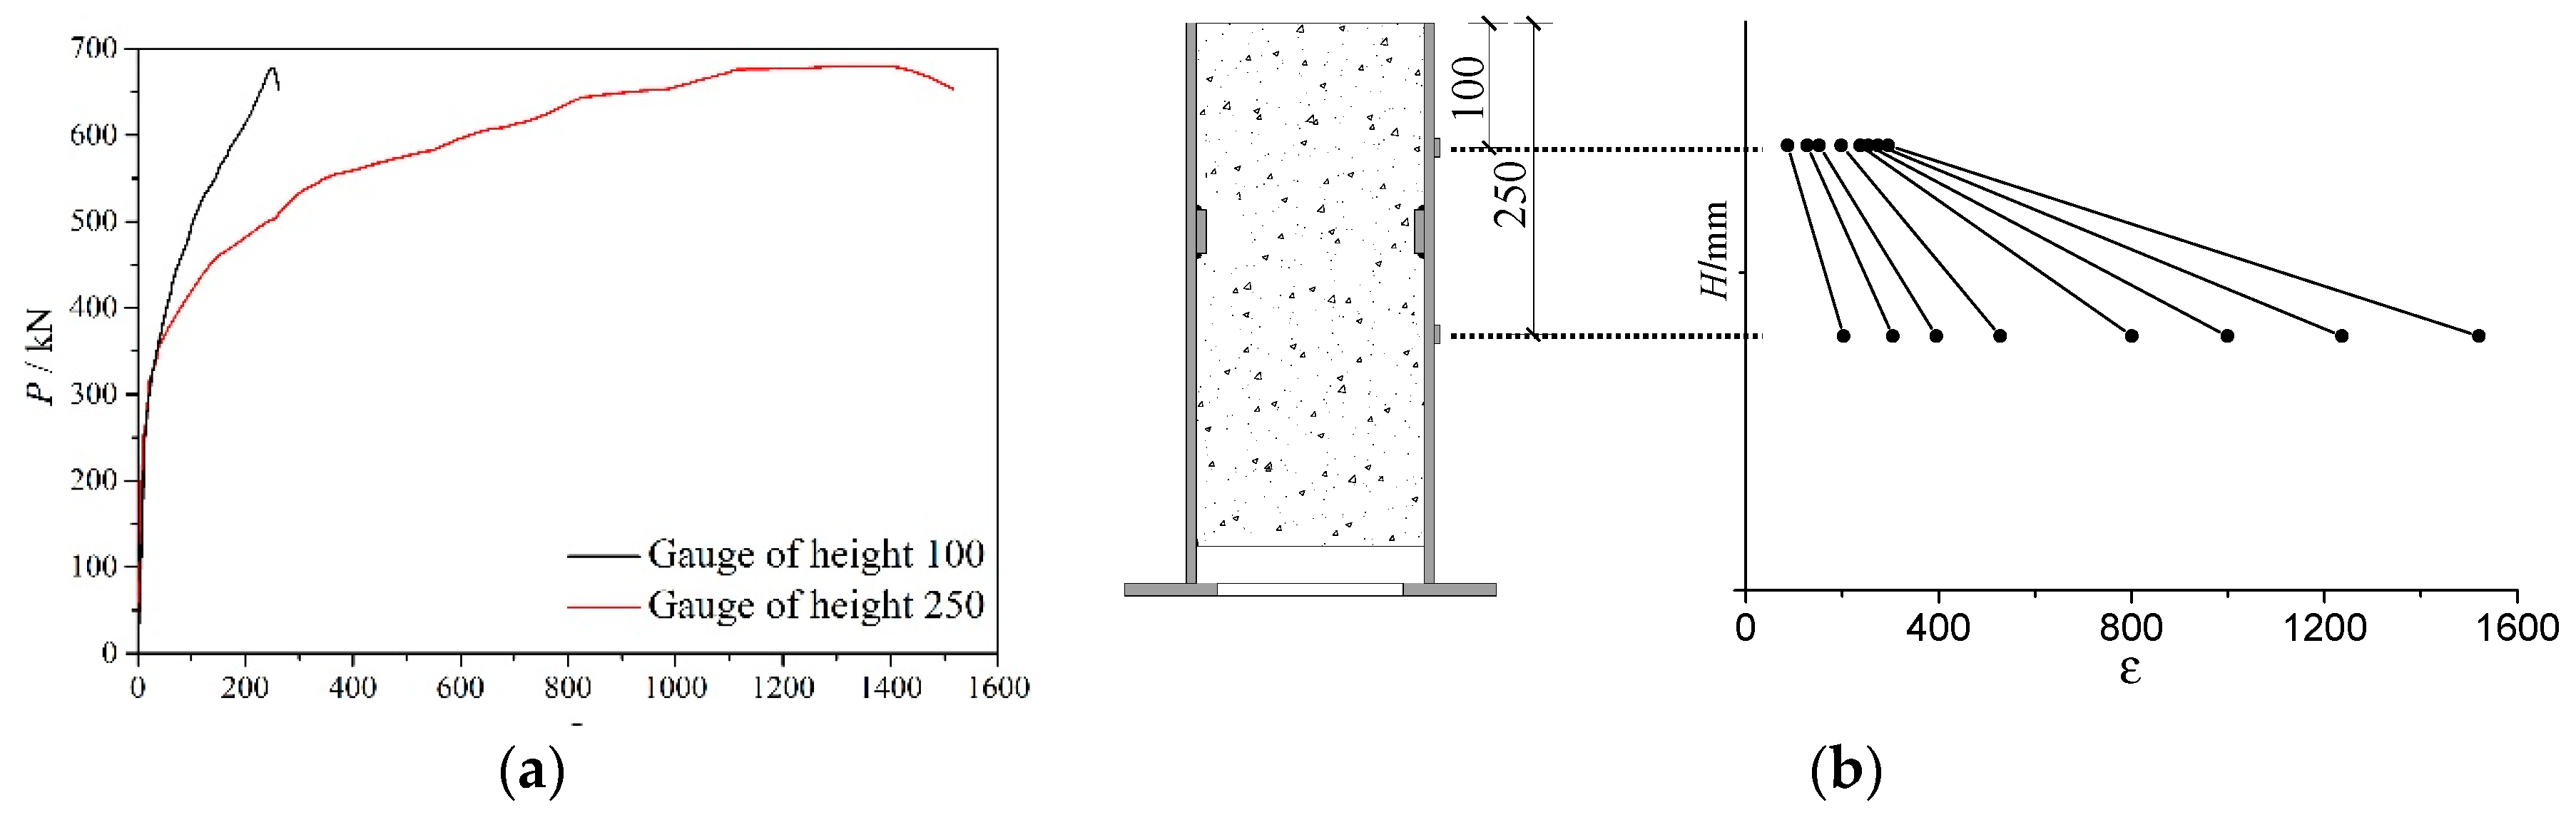
Figure 10.
Stress state of shear connector.
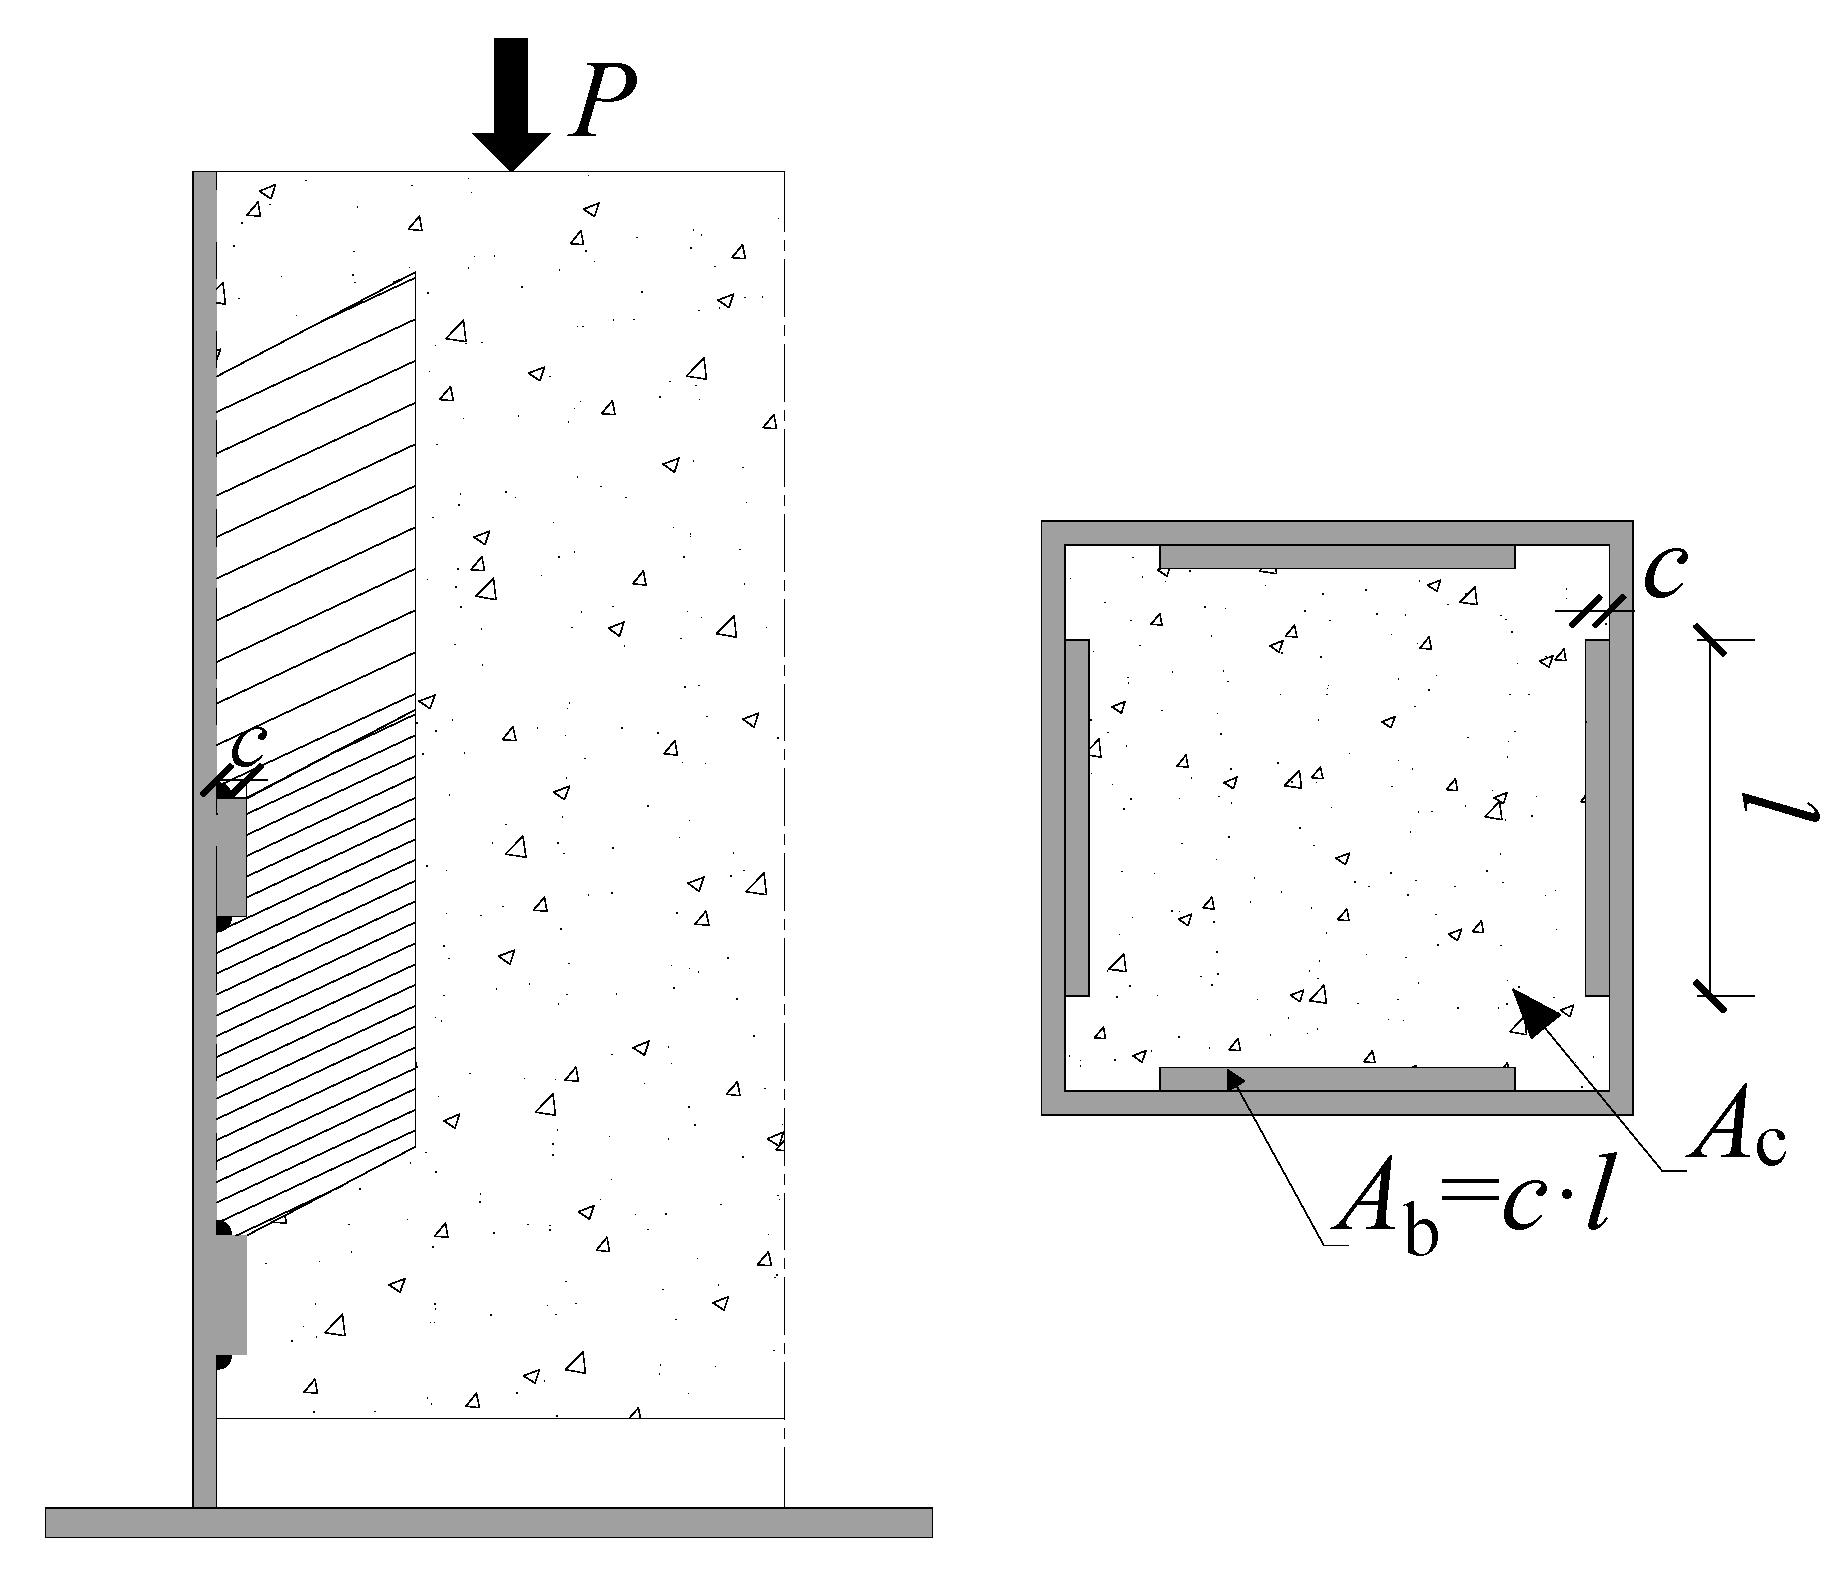
Figure 11.
Influence factor α of width to thickness ratio.

Table 1.
Parameters of square CFST specimens.
| Specimen | t mm | B/t | c mm | s mm | l mm | Concrete Grade | Shear Connector Type |
|---|---|---|---|---|---|---|---|
| P8-8-0-120 | 8 | 25 | 8 | single layer | 120 | C30 | steel plate |
| P8-4-150-120 | 4 | 50 | 8 | 150 | 120 | C30 | steel plate |
| P8-6-150-120 | 6 | 33.3 | 8 | 150 | 120 | C30 | steel plate |
| P8-8-150-120 | 8 | 25 | 8 | 150 | 120 | C30 | steel plate |
| P8-14-150-120 | 14 | 14.3 | 8 | 150 | 120 | C30 | steel plate |
| P4-8-150-120 | 8 | 25 | 4 | 150 | 120 | C30 | steel plate |
| P12-8-150-120 | 8 | 25 | 12 | 150 | 120 | C30 | steel plate |
| P8-8-100-120 | 8 | 25 | 8 | 100 | 120 | C30 | steel plate |
| P8-8-200-120 | 8 | 25 | 8 | 200 | 120 | C30 | steel plate |
| P8-8-150-120# | 8 | 25 | 8 | 150 | 120 | C30 | steel plate |
| P8-8-150-80 | 8 | 25 | 8 | 150 | 80 | C30 | steel plate |
| P8-8-150-150 | 8 | 25 | 8 | 150 | 150 | C30 | steel plate |
| P8-8-150-120* | 8 | 25 | 8 | 150 | 120 | C40 | steel plate |
| B10-8-150-174 | 8 | 25 | 10 | 150 | 174 | C30 | steel bar |
Note: symbol # indicates single-sided welding, others were double-sided welding; symbol * indicates the infill concrete grade was C40, others were C30.
Table 2.
Mix proportion of concrete.
| Concrete Grade | Water (kg/m3) | Cement (kg/m3) | Fine Aggregates (kg/m3) | Coarse Aggregates (kg/m3) |
|---|---|---|---|---|
| C30 | 185 | 325 | 660 | 1220 |
| C40 | 185 | 420 | 570 | 1270 |
Table 3.
Mechanical properties of concrete.
| Concrete Grade | Cubic Compression Strength fcu150 (MPa) | Cylinder Compression Strength fc′ (MPa) | Young’s Modulus (N/mm2) |
|---|---|---|---|
| C30 | 33.0 | 25.0 | 3.00 × 10⁴ |
| C40 | 40.1 | 30.5 | 3.25 × 10⁴ |
Table 4.
Mechanical properties of steel.
| Steel Type | fy (N/mm2) | fu (N/mm2) | δ (%) |
|---|---|---|---|
| Q345, 4 mm | 390 | 521 | 27.6 |
| Q345, 6 mm | 362 | 495 | 26.8 |
| Q345, 8 mm | 381 | 516 | 27.1 |
| Q345, 12 mm | 355 | 530 | 27.5 |
| Q345, 14 mm | 368 | 509 | 27.2 |
| HRB335, steel bar | 389 | 502 | 23.4 |
Table 5.
Failure mode and comparison of calculated ultimate bearing capacities and test data.
| Specimen | Pu.exp (kN) | Pu.cal (kN) | Pu.exp/Pu.cal | Failure Mode |
|---|---|---|---|---|
| P8-8-0-120 | 680.2 | 674.9 | 1.008 | A |
| P8-4-150-120 | 527.9 | 505.4 | 1.044 | A, B |
| P8-6-150-120 | 709.3 | 679.1 | 1.044 | A |
| P8-8-150-120 | 921.0 | 913.8 | 1.008 | A |
| P8-14-150-120 | 2284.0 | 2186.8 | 1.044 | A |
| P4-8-150-120 | 694.5 | 615.5 | 1.128 | A |
| P12-8-150-120 | 1401.6 | 1215.4 | 1.153 | A |
| P8-8-100-120 | 766.0 | 742.4 | 1.032 | A |
| P8-8-200-120 | 1342.9 | 1349.8 | 0.995 | A |
| P8-8-150-120# | 1050.5 | - | - | A |
| P8-8-150-80 | 833.0 | 746.1 | 1.116 | A |
| P8-8-150-150 | 1250.0 | 1021.7 | 1.223 | A |
| P8-8-150-120* | 1137.3 | 1114.9 | 1.020 | A |
| B10-8-150-174 | 1725.5 | - | - | A |
| the mean value: | 1.068 | |||
Note: symbol # indicates single-sided welding, others were double-sided welding; symbol * indicates the infill concrete grade was C40, others were C30.
© 2017 by the authors. Licensee MDPI, Basel, Switzerland. This article is an open access article distributed under the terms and conditions of the Creative Commons Attribution (CC BY) license (http://creativecommons.org/licenses/by/4.0/).
Share and Cite
MDPI and ACS Style
Qiao, Q.; Zhang, W.; Qian, Z.; Cao, W.; Liu, W. Experimental Study on Mechanical Behavior of Shear Connectors of Square Concrete Filled Steel Tube. Appl. Sci. 2017, 7, 818. https://doi.org/10.3390/app7080818
AMA Style
Qiao Q, Zhang W, Qian Z, Cao W, Liu W. Experimental Study on Mechanical Behavior of Shear Connectors of Square Concrete Filled Steel Tube. Applied Sciences. 2017; 7(8):818. https://doi.org/10.3390/app7080818
Chicago/Turabian StyleQiao, Qiyun, Wenwen Zhang, Zhiwei Qian, Wanlin Cao, and Wenchao Liu. 2017. "Experimental Study on Mechanical Behavior of Shear Connectors of Square Concrete Filled Steel Tube" Applied Sciences 7, no. 8: 818. https://doi.org/10.3390/app7080818
Note that from the first issue of 2016, this journal uses article numbers instead of page numbers. See further details here.