Article

Size Characterisation Method and Detection Enhancement of Plasmonic Nanoparticles in a Pump–Probe System

by
Rafael Fuentes-Domínguez
1,*,
Richard J. Smith
1,
Fernando Pérez-Cota
1,
Leonel Marques
1,
Ovidio Peña-Rodríguez
2 and
Matt Clark
1
1
Optics and Photonics Group, University of Nottingham, University Park, Nottingham NG7 2RD, UK
2
Instituto de Fusión Nuclear, Universidad Politécnica de Madrid, C/ José Gutiérrez Abascal 2, E-28006 Madrid, Spain
*
Author to whom correspondence should be addressed.
Appl. Sci. 2017, 7(8), 819; https://doi.org/10.3390/app7080819
Submission received: 5 July 2017 / Revised: 3 August 2017 / Accepted: 7 August 2017 / Published: 10 August 2017
(This article belongs to the Special Issue Laser Interaction with Plasmonic Nanostructures)

Abstract

:
The optical resonance of metal nanoparticles can be used to enhance the generation and detection of their main vibrational mode. In this work, we show that this method allows the accurate characterisation of the particle’s size because the vibrational frequency of plasmonic nanoparticles only depends on their mechanical properties. Moreover, by a careful selection of the particle size and/or probe laser wavelength, the detected signal can be increased by a large factor (∼9 for the particles used in this work) under the same illumination conditions. Finally, we show experimentally that particles of different sizes inside the point spread function can be observed due to the differences in their vibrational states, which could provide a feasible route to super-resolution.

1. Introduction

The physical and optical properties of nanoparticles have been heavily studied in the last few decades. This interest stems from their specific behaviour that depends on the particle size and shape and is very different from that of the bulk material. The optical scattering properties of nanoparticles have been well-known since the development of Mie theory [1] and, more recently, the stability of numerical solutions has allowed reliable calculations on spherical structures [2,3]. Additionally, the mechanical properties have been investigated, firstly by Raman scattering [4,5,6] and later by means of pump–probe techniques [7,8,9,10,11,12,13].
Nanoparticles can work as sources of ultrasounds when a short optical pulse (pump laser) is used to thermally excite them producing GHz acoustic waves [14,15]. The vibrational response of a nanoparticle can be detected in the time domain by measuring the changes in the scattered light. To access the very high frequency range of the vibrations of these small particles, the scattering is detected using pulsed lasers in a pump–probe configuration [16,17]. Both the generation and detection processes can be enhanced by matching the pump and probe wavelengths with the optical resonances of these nanoparticles. This approach may open a new method for cell imaging, where the acoustic transducers are placed inside the sample [18]. This configuration allows the generation of spherical acoustic waves probing the sample in all directions, unlike the currently used thin-film opto-acoustic transducers [19,20,21], which only produces waves orthogonal to the surface. Moreover, nanoparticles generate higher ultrasonic spatial frequencies, which could increase the lateral resolution.
However, the attenuation of acoustic waves in the GHz range is large, so it is crucial to maximise signal levels by optimising the generated wave amplitude and detection sensitivity without increasing the power density of the lasers. This improves the signal-to-noise ratio, decreases the time of the data acquisition and avoids damaging biological samples.
One popular method of detecting a signal is to choose a probe wavelength near the plasmon edge around 530 nm where the scattering is sensitive to the change in the dielectric function caused by the free electrons’ contribution [22,23]. However, the signal received from the backscattered light in this regime is poor due to the low level of backscatter which results in a low signal-to-noise ratio and the need to increase the acquisition time (Section 2.3).
By choosing the probe laser away from the plasmon edge in the red or near infrared (>700 nm) region, another modulation mechanism may be accessed. Here, the scattering cross-section is a strong function of wavelength and size and by choosing a particle size/wavelength combination, where the change in scattering cross-section vs. particle size is high, it is possible to enhance the optical detection of the particles’ vibrational modes.
In this work, we describe the theoretical basis of the generation and detection, the optical and mechanical modelling of the nanoparticles, the sample fabrication, the experimental results and the optimisation of the optical detection. A scan of a sample containing particles with different sizes shows the existence of multiple frequencies inside the point spread function, which could allow identification of single particles with ultra-high resolution.

2. Design

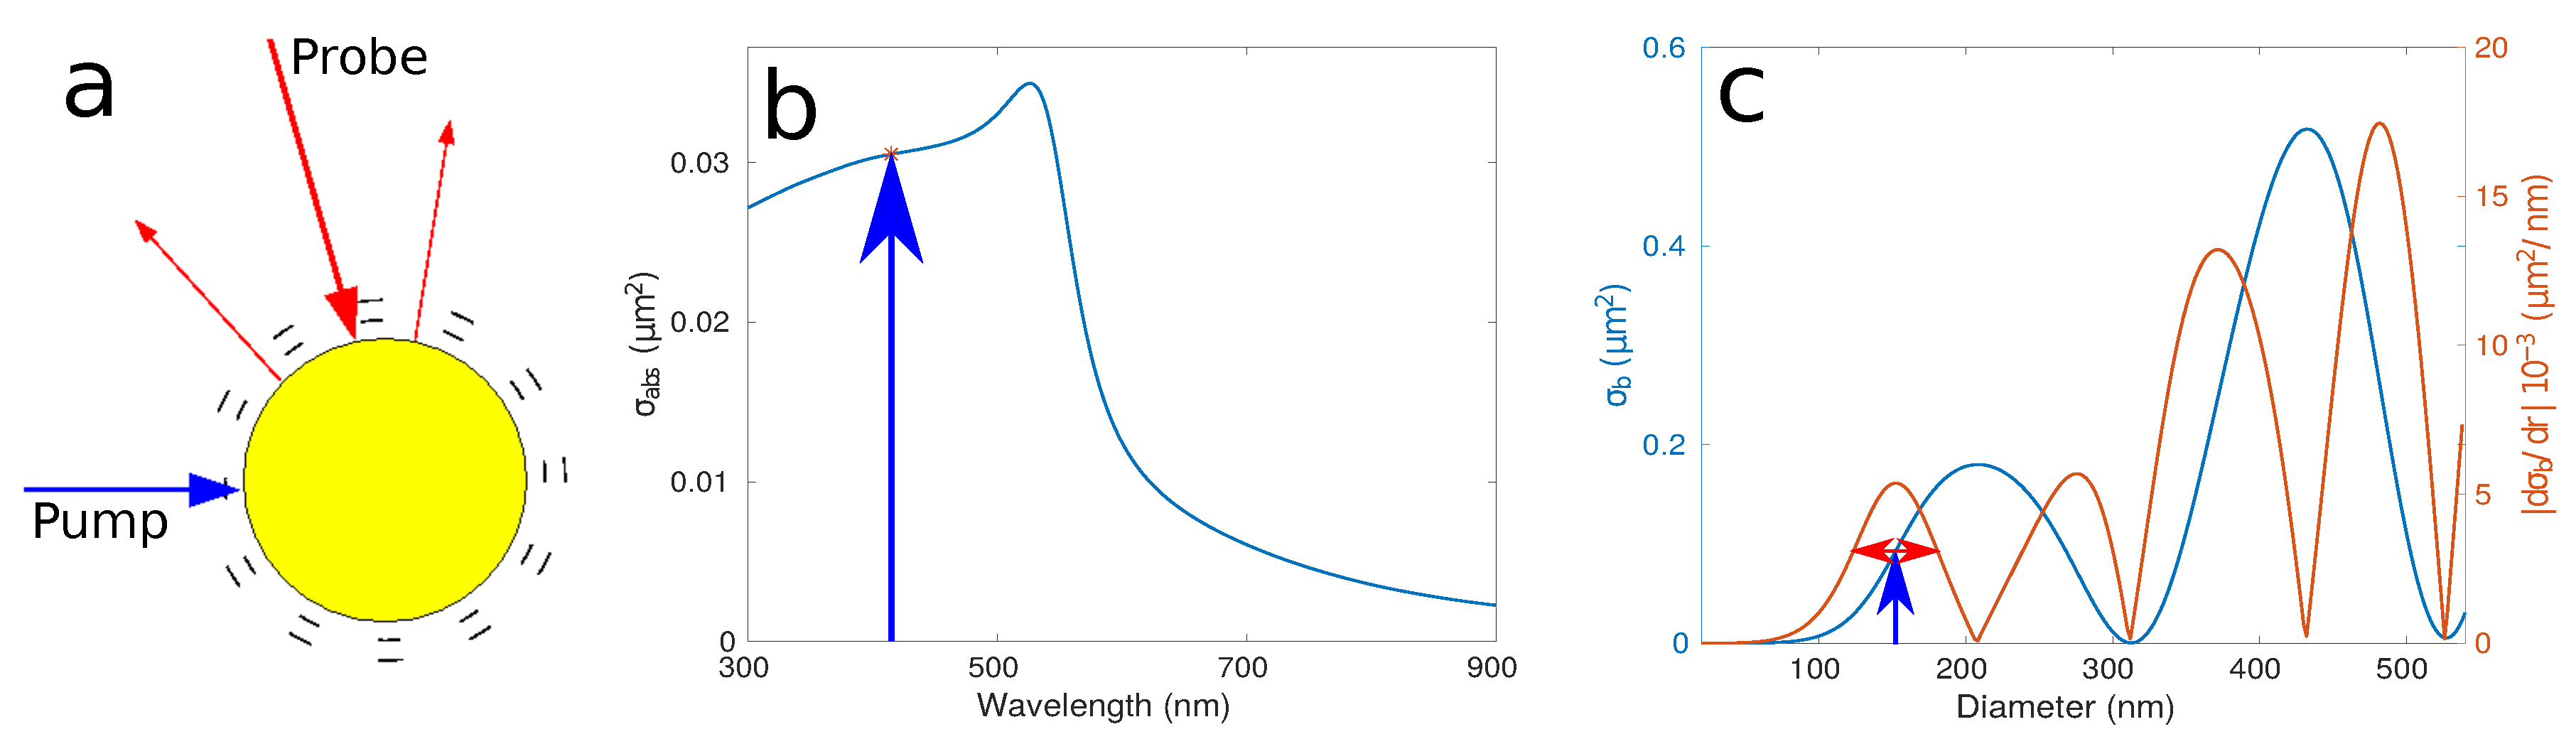
A schematic representation of the pump–probe experiment is shown in Figure 1a. The optical design of the nanoparticles is such that they strongly absorb at one wavelength of light ( λ p u m p , Figure 1b), making them efficient thermoelastic generators of elastic waves and have a strongly modulated scattering cross-section at a second wavelength ( λ p r o b e ) when the device vibrates (Figure 1c). Consequently, elastic waves are generated when the particle is illuminated with a short (ps) pulse of light at λ p u m p and illumination with a second pulse of light at λ p r o b e detects the changes in the reflected/transmitted light intensity produced by the (instantaneous) change in size (caused by mechanical vibration). Section 2.1 contains a detailed optical model that provides the means to choose the most suitable material and size of the particle to match the surrounding media and probe laser wavelength, λ p r o b e .
In our experiment, the pump laser wavelength was dictated by the tuning range of the lasers and the need to operate without damage or significant absorption in the surrounding media. A wavelength of 415 nm was chosen because it is strongly absorbed by all the different sizes of gold nanoparticles used but not by the surrounding media (air and water), and this region is away from the plasmon edge so it is not affected by small changes in the particle size, ensuring that the generation efficiency is the same for all of the particle sizes used in this paper.
The probe laser wavelength was chosen in the near infrared (NIR) region (700–850 nm) because of the low absorption (Figure 1b) and high sensitivity for 150–200 nm particle sizes (Figure 2). This region shows high signal-to-noise ratio for backscattered light unlike the plasmon edge where the DC is nearly 0 (Figure 2a–d).

2.1. Optical Design and Modelling

The optical response of metal nanoparticles can be modelled by the calculation of the scattering, radar backscattering, extinction and absorption cross-sections obtained from a Mie model (Equations (1)–(4)) [3,24]:
σ s c a = 2 π r 2 x 2 n = 1 ( 2 n + 1 ) ( | a n | 2 + | b n | 2 )
σ b a c k = π r 2 x 2 n = 1 ( 2 n + 1 ) ( - 1 ) n ( a n - b n ) 2
σ e x t = 2 π r 2 x 2 n = 1 ( 2 n + 1 ) R e { a n + b n }
σ a b s = σ e x t - σ a b s
The particle is characterized by the size parameter x = 2 π n m r / λ and the relative refractive index m = n / n m , where λ is the wavelength of the incident wave in vacuum, r is the particle radius and n m and n are the refractive index of the medium and the particle, respectively. The expressions for a n and b n are shown below:
a n = [ H n a ( m x ) / m + n / x ] ψ n ( x ) - ψ n - 1 ( x ) [ H n a ( m x ) + n / x ] ζ n ( x ) - ζ n - 1 ( x )
b n = [ m H n b ( m x ) + n / x ] ψ n ( x ) - ψ n - 1 ( x ) [ m H n b ( m x ) + n / x ] ζ n ( x ) - ζ n - 1 ( x )
where ψ and ζ are the Riccati–Bessel functions defined, for instance, in Kai and Massoli et al. [25] and the determinants H n a and H n b , defined in Peña et al. [3]

2.2. Principles of Optical Generation

The principle of excitation is based on the well-known phenomenon of thermal excitation. The light absorbed by the particle results in rapid heating and a subsequent stress that excites vibrations in the particle. In general, the particle heating is not uniform but our particles are small compared with the optical wavelength and the contribution to the thermalisation of the hot electrons that are initially excited means that it is reasonable to assume uniform heating. In the case of larger particles, these assumptions might not be valid.
To maximise the efficiency of generation, the particle needs to be a strong absorber of the pump light, which can be achieved by using an appropriate pump wavelength, particle material and, to a lesser extent, particle size. Figure 1b shows the absorption cross-section for a 150 nm gold nanoparticle as a function of wavelength. In this case, the absorption around 530 nm is strongly determined by the main plasmon resonance and largely independent of the size and the optical properties of the external media. In our set-up, the pump wavelength was fixed at 415 nm, which provided good absorption for all particle sizes and was not strongly absorbed by the surrounding media.

2.3. Principles of Optical Detection

The scattering cross-section can be (with the right combination of materials, size and wavelength) a sensitive function of particle size. Thus, when the particle vibrates, there will be a change in the scattering cross-section and the intensity of the scattered light will be modulated by the vibration, which constitutes the principle of detection in our work. Other factors, like the change in temperature of the particle/surrounding media/substrate, the photo-elastic effect and the very short-lived electronic contribution from the hot electrons, can affect the particle scattering, but we have neglected them. The temperature change results in a slowly varying thermal background in our signals, which is removed by signal processing, and the photo-elastic effect is thought to only provide a small contribution to the signal received (as this effect in gold is small [26,27]) and the short-lived electronic effects are tied up in a “co-incidence peak”, which is removed alongside the thermal decay. In this paper, we define the optical sensitivity as the change in scattered light over a 1 nm change in the radius of the particle. This shows the change in reflected/transmitted light during the vibration of the particle.
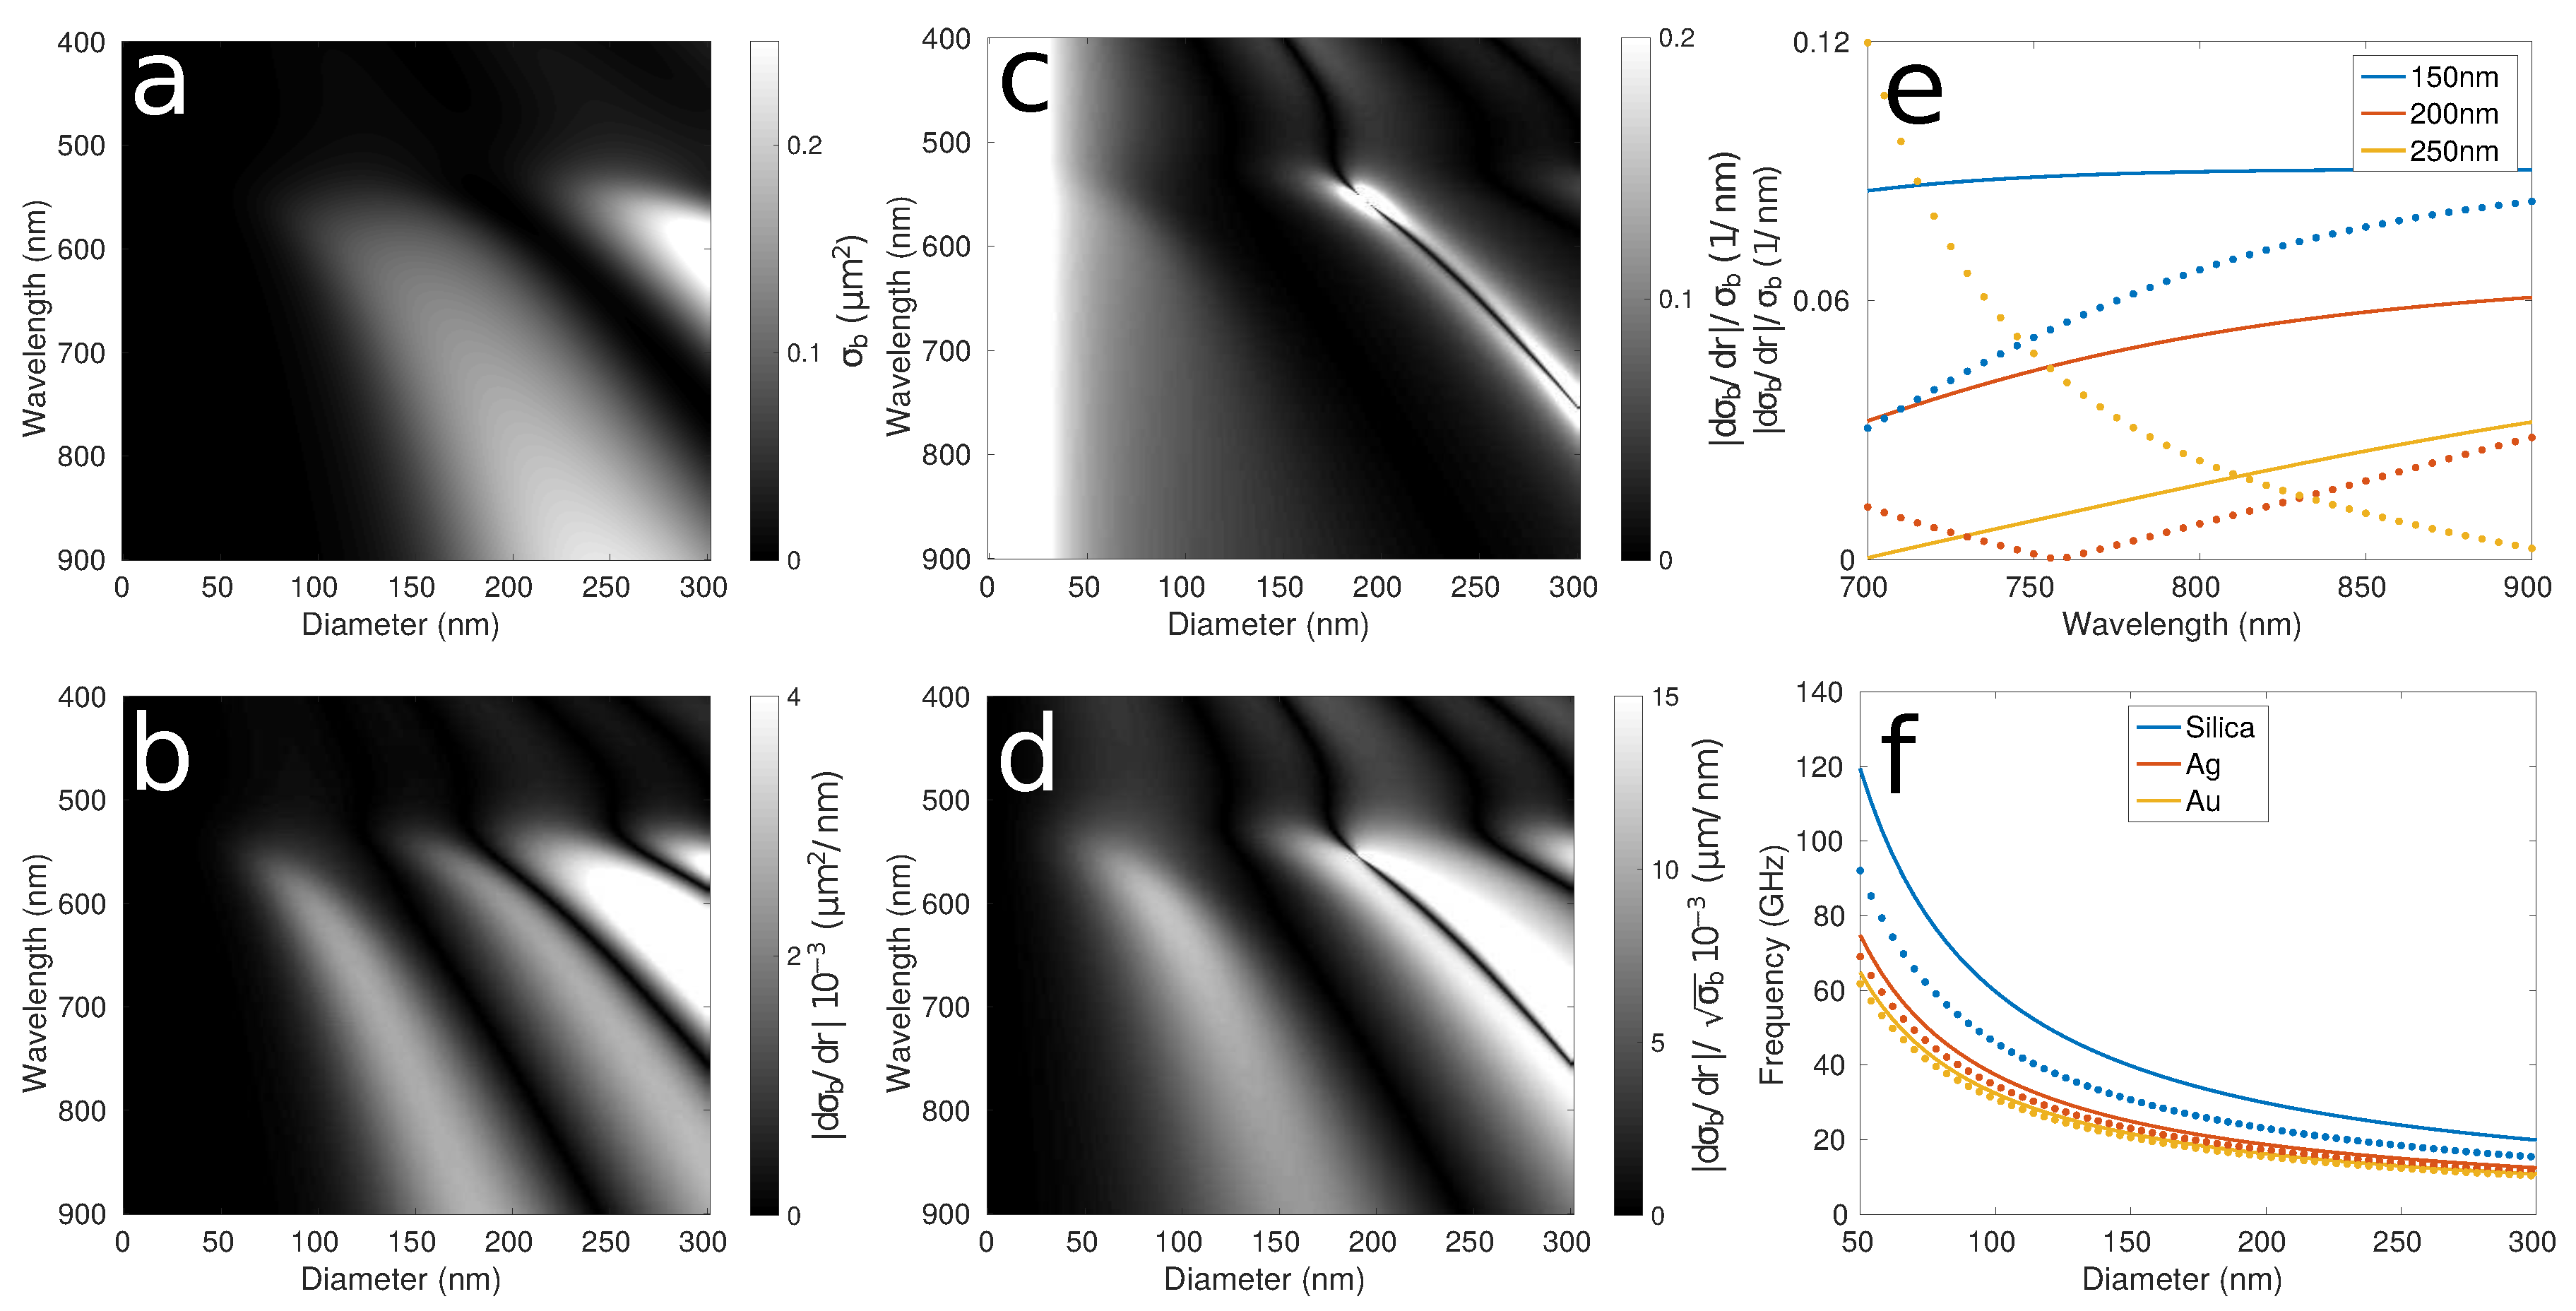
Figure 2 shows the theoretical optical response as a function of the probe laser wavelength for gold nanoparticles of different sizes immersed in water, as given by the Mie model. The area studied in this work corresponds to a region where the probe laser wavelength is in the near infrared (>700 nm) and the particle size between 150–250 nm. Figure 2a is the radar backscattering cross-section, where a 220 nm nanoparticle exhibits the strongest scattering. Figure 2b is the optical sensitivity where 160 and 220 nm nanoparticles show high and low values over the wavelength range, respectively. Figure 2c is the modulation depth, defined as the optical sensitivity divided by the radar backscattering cross-section, which shows a region with high response for a nanoparticle smaller than 100 nm. This region is very high as the DC is nearly 0. Therefore, although this appears to be the best place to operate, the extremely low light return means that the signal-to-noise ratio (SNR) will be poor. Figure 2d shows the sensitivity with respect to SNR and here a particle with size ∼150 nm is optimal.
Figure 2e shows the modulation depth for the three sizes of gold nanoparticles measured in this paper (150, 200 and 250 nm) as a function of the probe laser wavelength (the range of our setup) in air (lines) and water (dots) surrounding media. The chosen media for the study of the optical response of plasmonic nanoparticles is water where the optical response follows different tendencies for the three sizes in the available probe wavelength range. It is clear from there that the size of the particle, the probe laser wavelength and the surrounding media have a significant impact on the optical response. For example, the optical response of a 250 nm gold nanoparticle will increase a factor of ∼6 when the probe wavelength is tuned from 850 to 700 nm.

2.4. Mechanical Design and Modelling

The vibration frequency is a function of the material properties, the particle size and, to a lesser extent, the surrounding media. We have assumed that only the main breathing mode of vibration is excited. This is justified because the particle is small and uniformly heated on a time scale that is short compared with the period of vibration. Moreover, we do not expect to detect the presence of higher order modes of vibration, and they would be heavily damped compared with the breathing mode.
The acoustic properties of a nanosphere can be described in terms of vibrations of a homogeneous elastic body embedded in an infinite homogeneous medium [12,13,28]. This macroscopic model is valid for particles with diameter larger than a few nanometers where continuum mechanics and bulk elastic constants can be used [29,30]. The complex radial frequency modes, ω n ˜ ( R ) = ξ n ν L ( s ) / R , depend on ν L ( s ) , the longitudinal sound velocity of the sphere; R, the radius of the sphere; and ξ n , the eigenvalues, given by Equation (7) [31]:
ξ n cot ( ξ n ) = 1 - ξ n 2 ( 1 + i ξ n / α ) / η ξ n 2 - 4 α 2 γ 2 ( 1 - 1 / η β 2 ) ( 1 + i ξ n / α )
where the parameters are defined by:
α = ν L ( m ) / ν L ( s ) ; β = ν T ( m ) / ν T ( s )
γ = ν T ( m ) / ν L ( m ) ; η = ρ ( m ) / ρ ( s )
where ρ ( m ) ( s ) and ν L , T ( m ) ( s ) are the density and the longitudinal (L) or transverse (T) sound velocity of the medium (m) and sphere (s).
Voisin et al. have assumed a weak coupling between the sphere and the medium ( I m ( ξ n ) R e ( ξ n ) ) and weak damping [28]. Therefore, the radial mode frequencies, ω n , can be related to the real part of ξ n ( R e ( ξ n ) ( n + 1 ) π ) and the damping of the sphere modes, γ n , is proportional to the imaginary part of ξ n ( I m ( ξ n ) η α ). Hence, the main breathing mode frequency ( n = 0 ) of a nanosphere and the damping between it and the medium are expressed in Equations (9) and (10), respectively:
f n = R e ( ξ n ) ν L ( s ) 2 π R ( n + 1 ) ν L ( s ) 2 R
γ n = I m ( ξ n ) ν L ( s ) R ρ ( m ) ρ ( s ) ν L ( m ) R
Figure 2f shows the theoretical main breathing mode frequency in air (lines) and water (dots) as a function of size for a nanoparticle made of silica, silver and gold. It can be seen there that, for all the materials, the frequency generated is inversely proportional to the particle size. It can be seen also that a faster material (in terms of the longitudinal speed of sound), like silica, generates higher frequencies than a slower material like silver or gold. Furthermore, the breathing mode frequency for a gold particle will be slightly damped in a water surrounding media (<1 GHz).

3. Sample Preparation

An electrostatic layer-by-layer self-assembly process was used [32] to bond the gold nanoparticles to the substrate, allowing to measure the same sample in an air and water surrounding media. A clean glass substrate was washed and dried with nitrogen. A thin gold film, ∼30 nm, was coated on half of the substrate (this is used to set the correct overlapping of pump and probe beams). On the other half, a 2 mg/mL poly (allylamine hydrochloride) (PAH) (Mw 58,000) solution was prepared in water and coated onto the glass substrate for 20 min. The sample was re-washed with water and dried with nitrogen. The gold nanoparticles solution (diluted in water 1/500, v:v) was drop-coated and allowed to set overnight. The prepared sample was placed into a sealed gasket cell and filled with deionized water. All chemicals and the gold nanoparticles used in this sample preparation were purchased from Sigma-Aldrich. The nanoparticles were used as received with no surface modification or washing step involved. The polydispersity index (PDI) was less than 20% for the gold nanoparticles (values provided by the manufacturers).

4. Experimental Setup

The experiment is based on a dual laser asynchronous optical sampling (ASOPs) system [16,17]. It controls two femtosecond pulsed lasers (∼100 fs pulse width) with a repetition rate of 80 MHz and allows the delay between the pulses to be set and swept from 0 to 12.5 ns every 100 μ s (10 kHz). The wavelength of the probe laser is tunable from 700 to 850 nm. The sample is scanned by moving electromechanical stages with a minimum step motion of 100 nm. Typically, 30,000 averages per point are taken during scanning, which takes around 9 s to acquire. The system uses a maximum of 2 mW average power in the probe and 1 mW in the pump measured at the sample corresponding to pulse energies of 25 and 10 pJ and peak powers of 250 and 100 W, respectively. The response of the transducer is detected by monitoring the low frequency (<30 MHz) intensity variation of the probe light on a photo-detector, which is captured and averaged on a digital oscilloscope (DSO). With this arrangement, a signal detected at delay of T on the DSO corresponds to a real delay between the laser pulses of T/8000 and a frequency measured on the DSO of f s c o p e corresponds to a real frequency of 8000 f s c o p e .

5. Results

5.1. Optical Response

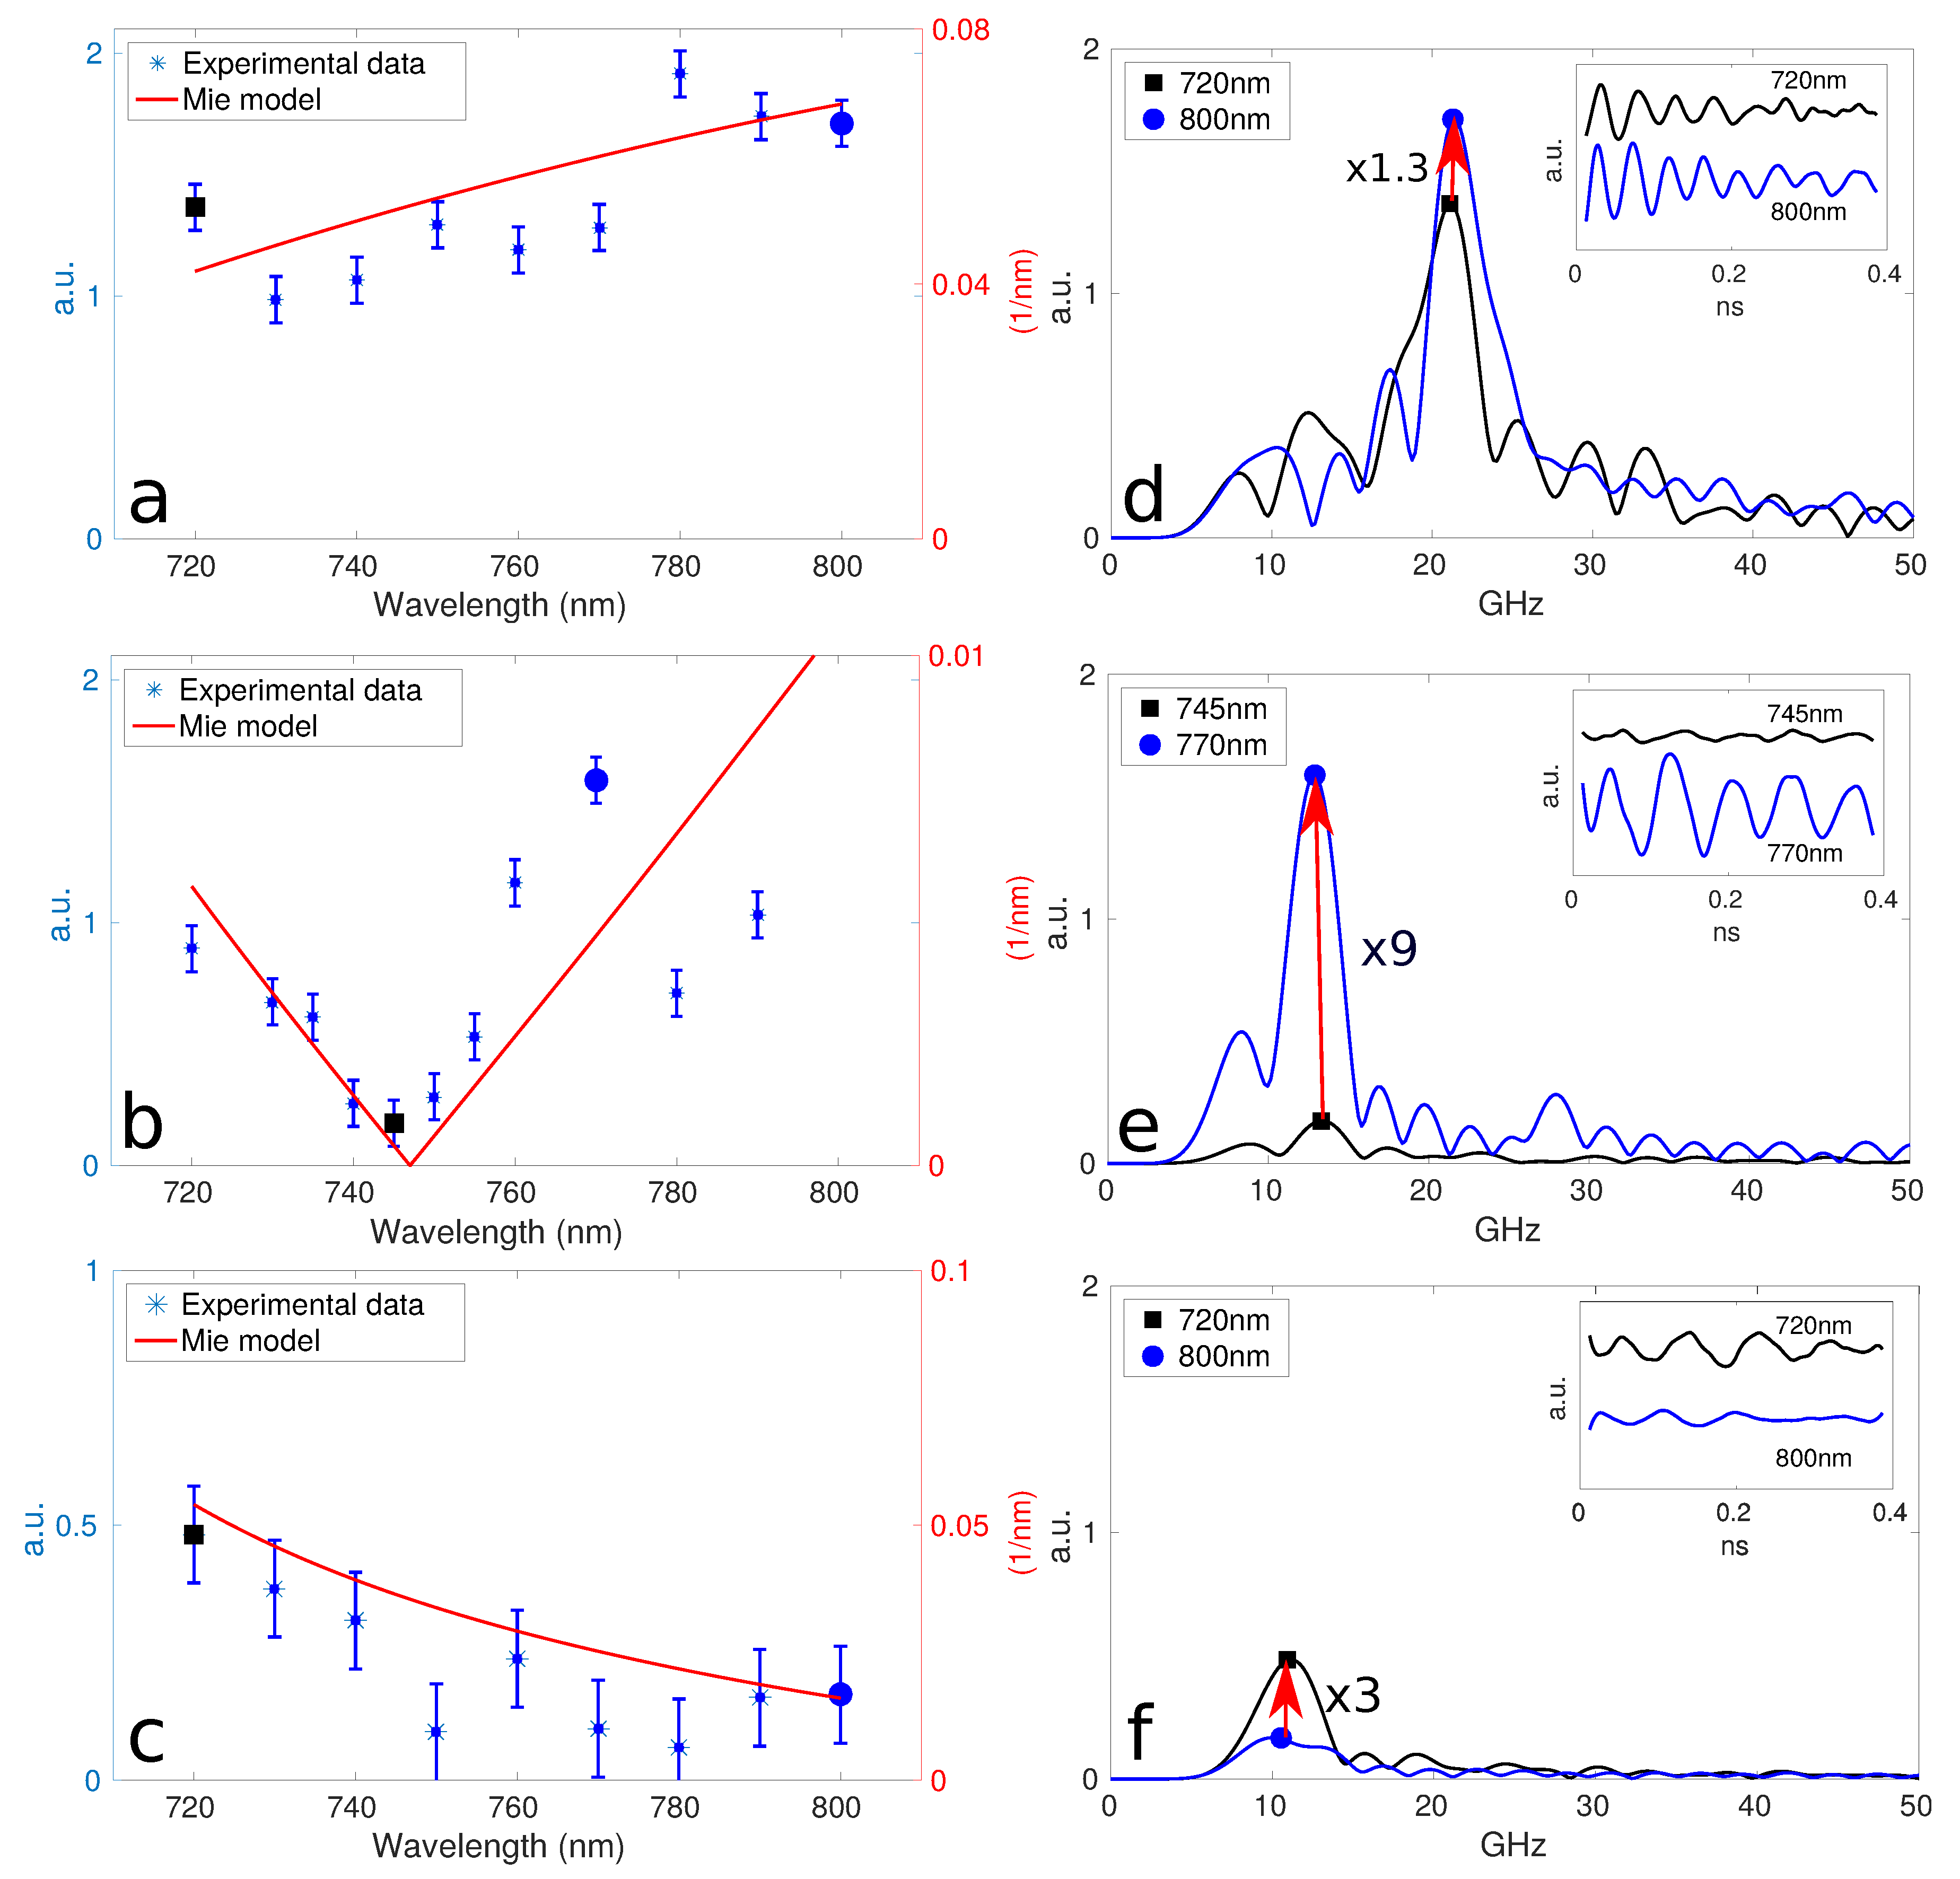
The optical response of plasmonic nanoparticles was studied by the backscattered signal from the center of gold nanoparticles, by comparing the modulation of the backscattering cross-section when the probe wavelength is changed. This was performed by measuring 150, 200 and 250 nm gold nanoparticles immersed in water because their optical response shows different behaviours unlike air surrounding media (Figure 2e). The range of the probe wavelength is from 720 to 800 nm, which is sufficient to cover the region of special interest, the drop in the optical response at ∼750 nm wavelength for a 200 nm gold particle.
The acquisition data procedure for each probe wavelength is the same to avoid any phenomena that may affect the particle backscattering. The input laser powers are set to the same value. The overlapping of both lasers are checked on a thin gold film coated on the same sample cover-slip. The region of interest is realigned to compensate any movements of the particle over time caused by changes in the laboratory conditions. The error bars are the standard deviation of the optical response of a gold nanoparticle surrounded by water for a fixed probe laser wavelength following the same scan procedure several times. The optical response of the three sizes, shown in Figure 3, matches the theoretical modulation depth (optical sensitivity over the radar backscattering cross-section) given by Mie theory. The optical response of a 150 nm particle increases a factor of ∼1.3 when the probe wavelength is tuned from 720 to 800 nm (Figure 3a,d). On the other hand, the same tunable range produces a decrease in a factor of ∼3 in the optical response of a 250 nm particle (Figure 3c,f). Finally, the maximum enhancement in our experimental data, a factor of ∼9, is given by a 200 nm particle when the probe wavelength is tuned from 745 to 770 nm (Figure 3b,e).
This enhanced response provides a way to improve the detection of the different main vibrational modes by choosing the right probe wavelength based on Mie theory without increasing the laser power. Moreover, it might be possible to suppress the signal from certain particles by careful choice of the wavelength. The discrepancies between the experimental data and the theory might be related to the extra reflections produced by the cover-slip or the effect of the electrostatic layer-by-layer self-assembly process, which bonds the particle to the substrate.

5.2. Mechanical Response

In this section, the mechanical response of plasmonic nanoparticles was investigated detecting the forward scattering as this setup is simpler, less susceptible to alignment errors, and it gives higher to signal-to-noise ratio with fewer averages because the optical throughput is higher. As the time to acquire an image is much longer than the previous section where the same points were compared, air surrounding media is used to avoid any defects such as the formation of air bubbles inside the gasket cell.
The mechanical response of plasmonic nanoparticles was investigated using three different sizes of gold nanoparticles: 150, 200 and 250 nm (samples S1–S3, respectively). Their theoretical breathing mode frequencies are 21.6, 16.2 and 12.9 GHz, respectively. However, this will vary depending on the actual size of the particle, allowing size characterisation.
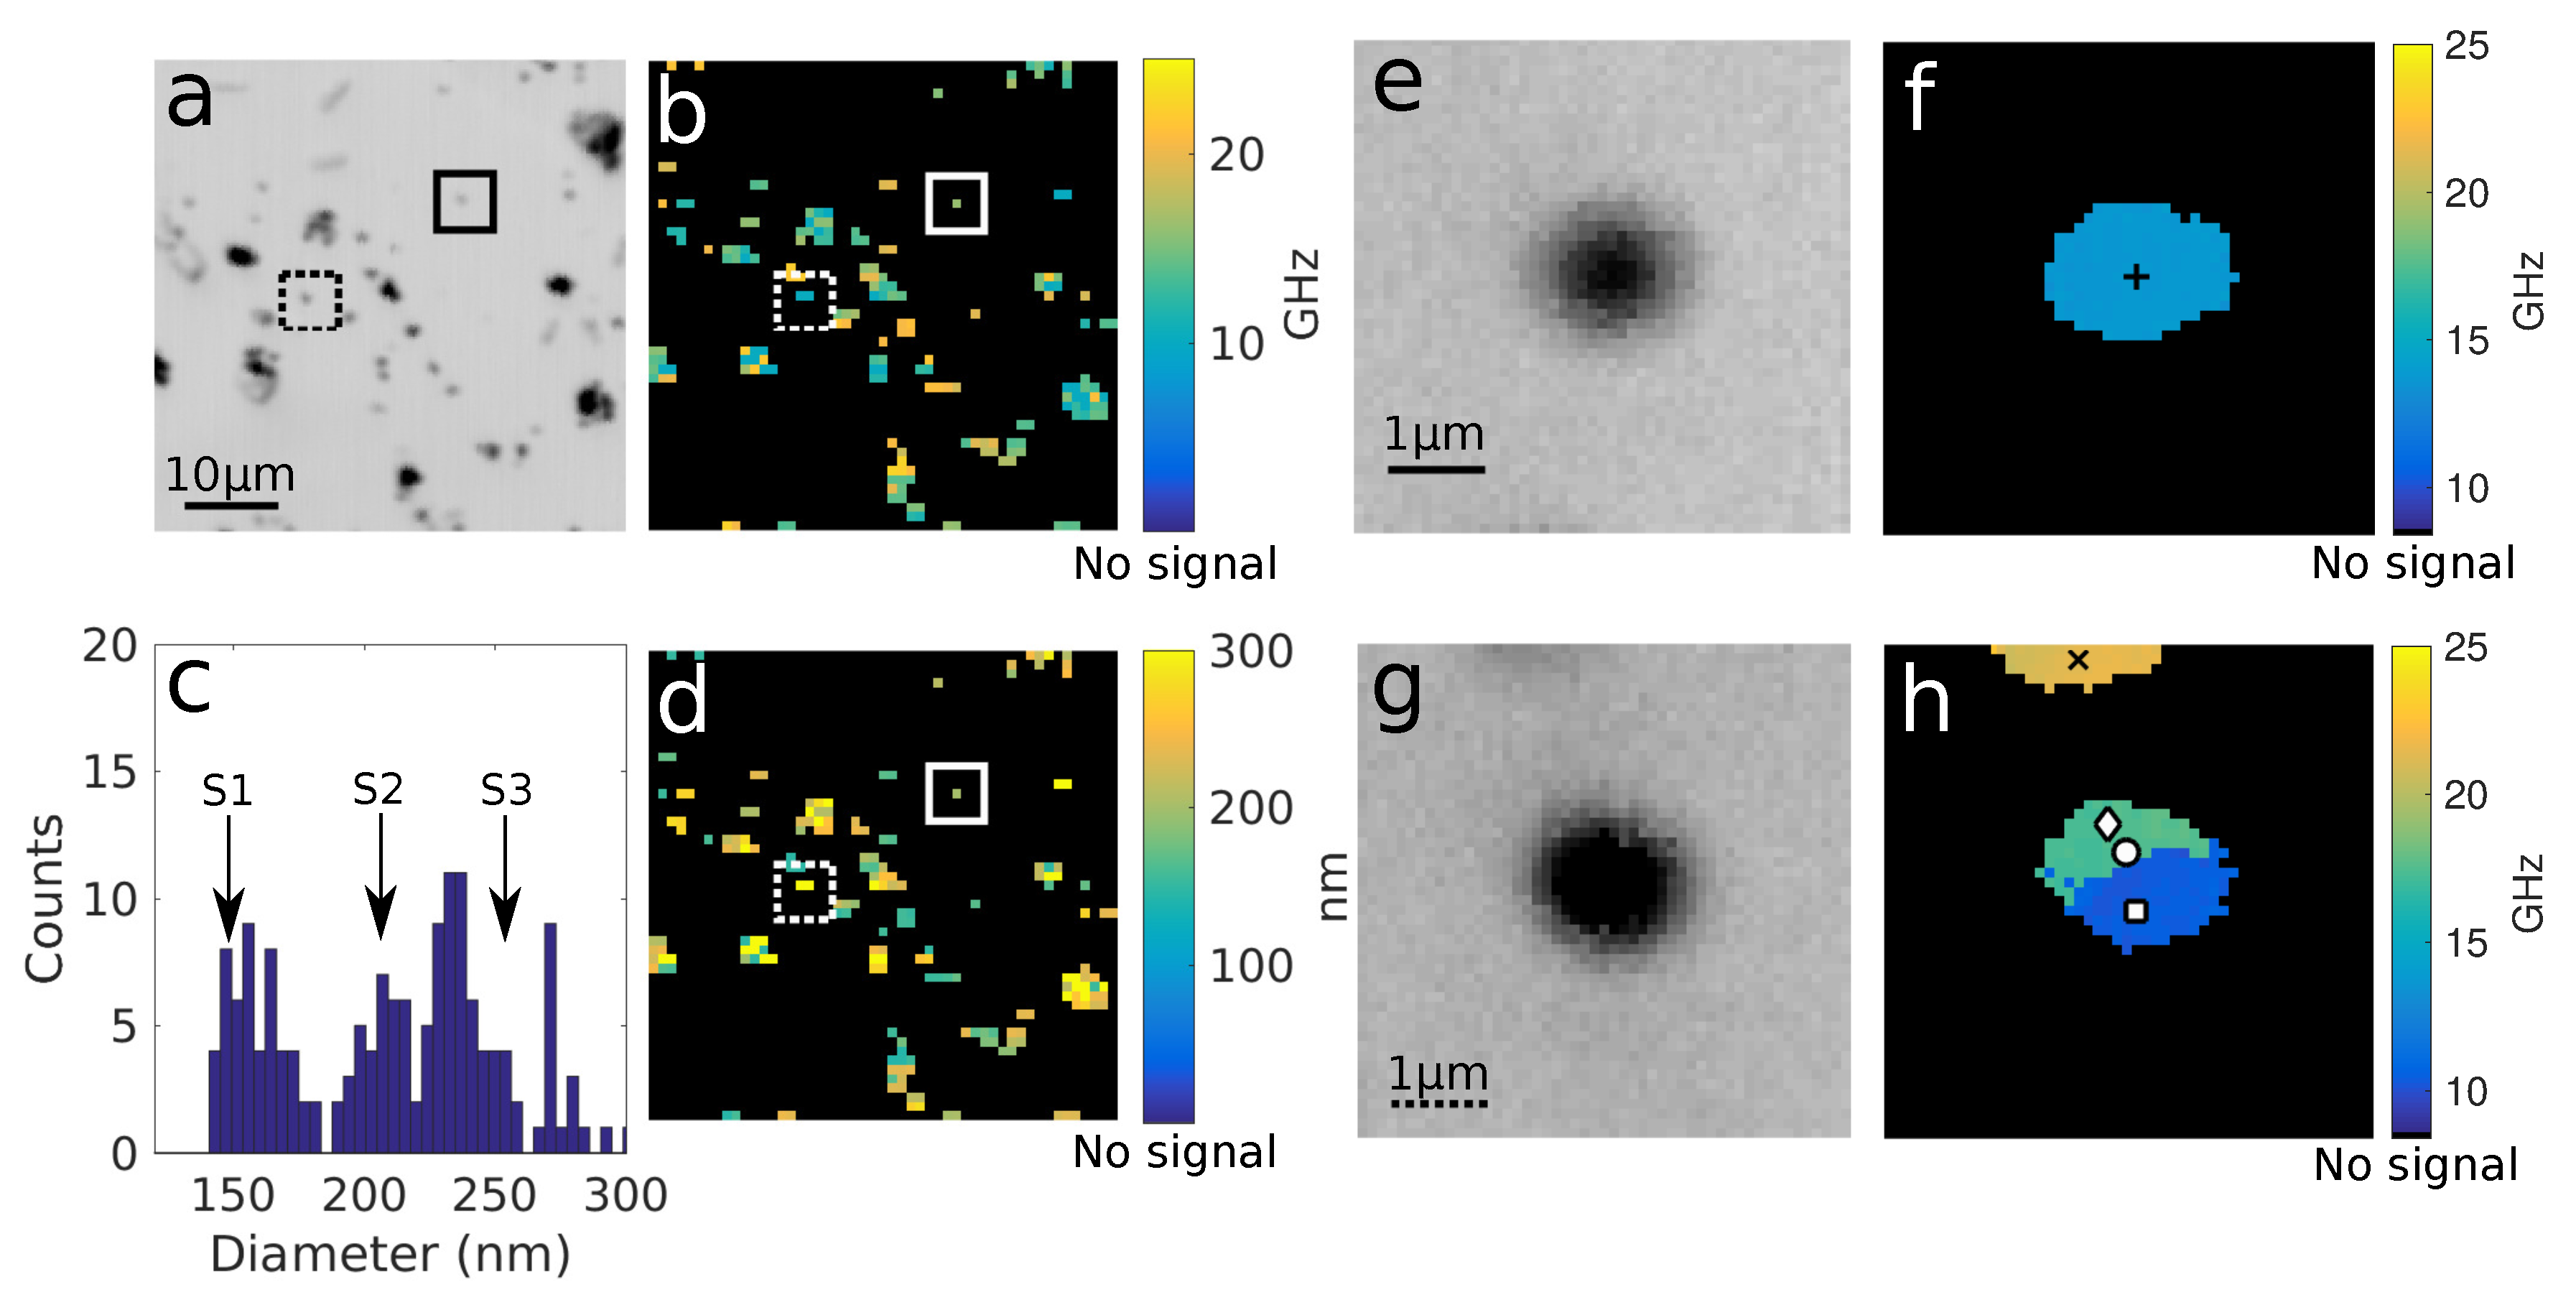
Figure 4 shows the experimental data taken from a sample containing a mixture of gold nanoparticles of different sizes. The sample is scanned over an area of 50 × 50 μ m 2 with a step size of 1 μ m (the same size as the spot of the pump laser). In this case, the probe laser wavelength is 780 nm where their optical response shows similar behaviour. The optical picture of the scanned sample shows several nanoparticles with different apparent sizes (Figure 4a). After signal processing, the breathing mode frequency for each particle is obtained, as shown in Figure 4b. Each frequency can be related to the actual size of the particle (Equation (9)), giving a study of the population of sizes (Figure 4c) or an ultrasonic picture in nm (Figure 4d).
Our experimental setup allows us to scan specific area with finer step size, marked as the solid and dashed square areas in Figure 4. These scanned areas are 5 × 5 μ m 2 with 100 nm step size. Both optical pictures show a single dip in intensity and shape (Figure 4e,g); however, the ultrasonic pictures given by the pump–probe system are slightly different. Figure 4f shows a single frequency where we can assume that there is a single gold nanoparticle with size ∼250 nm. On the other hand, Figure 4h shows three different frequencies. The highest frequency is given by the top particle (∼150 nm) that is only just visible in the optical picture. The other two frequency components are given by the middle blob. This means that two particles might be present inside the same point spread function. This will be discussed in more detail in Section 5.3. Changing the size provides a way to generate different vibrational frequencies. Additionally, this might be a useful technique to characterise the size of plasmonic nanoparticles because their vibrational modes only depend on the mechanical properties of the nanostructures (Section 2.4). However, multilayered nanostructures such as core–shell nanoparticles cannot be characterised by such a simple approach, as there are complex boundary conditions that depend on the core, shell, medium and particle fabrication parameters [33].

5.3. Particle Resolution

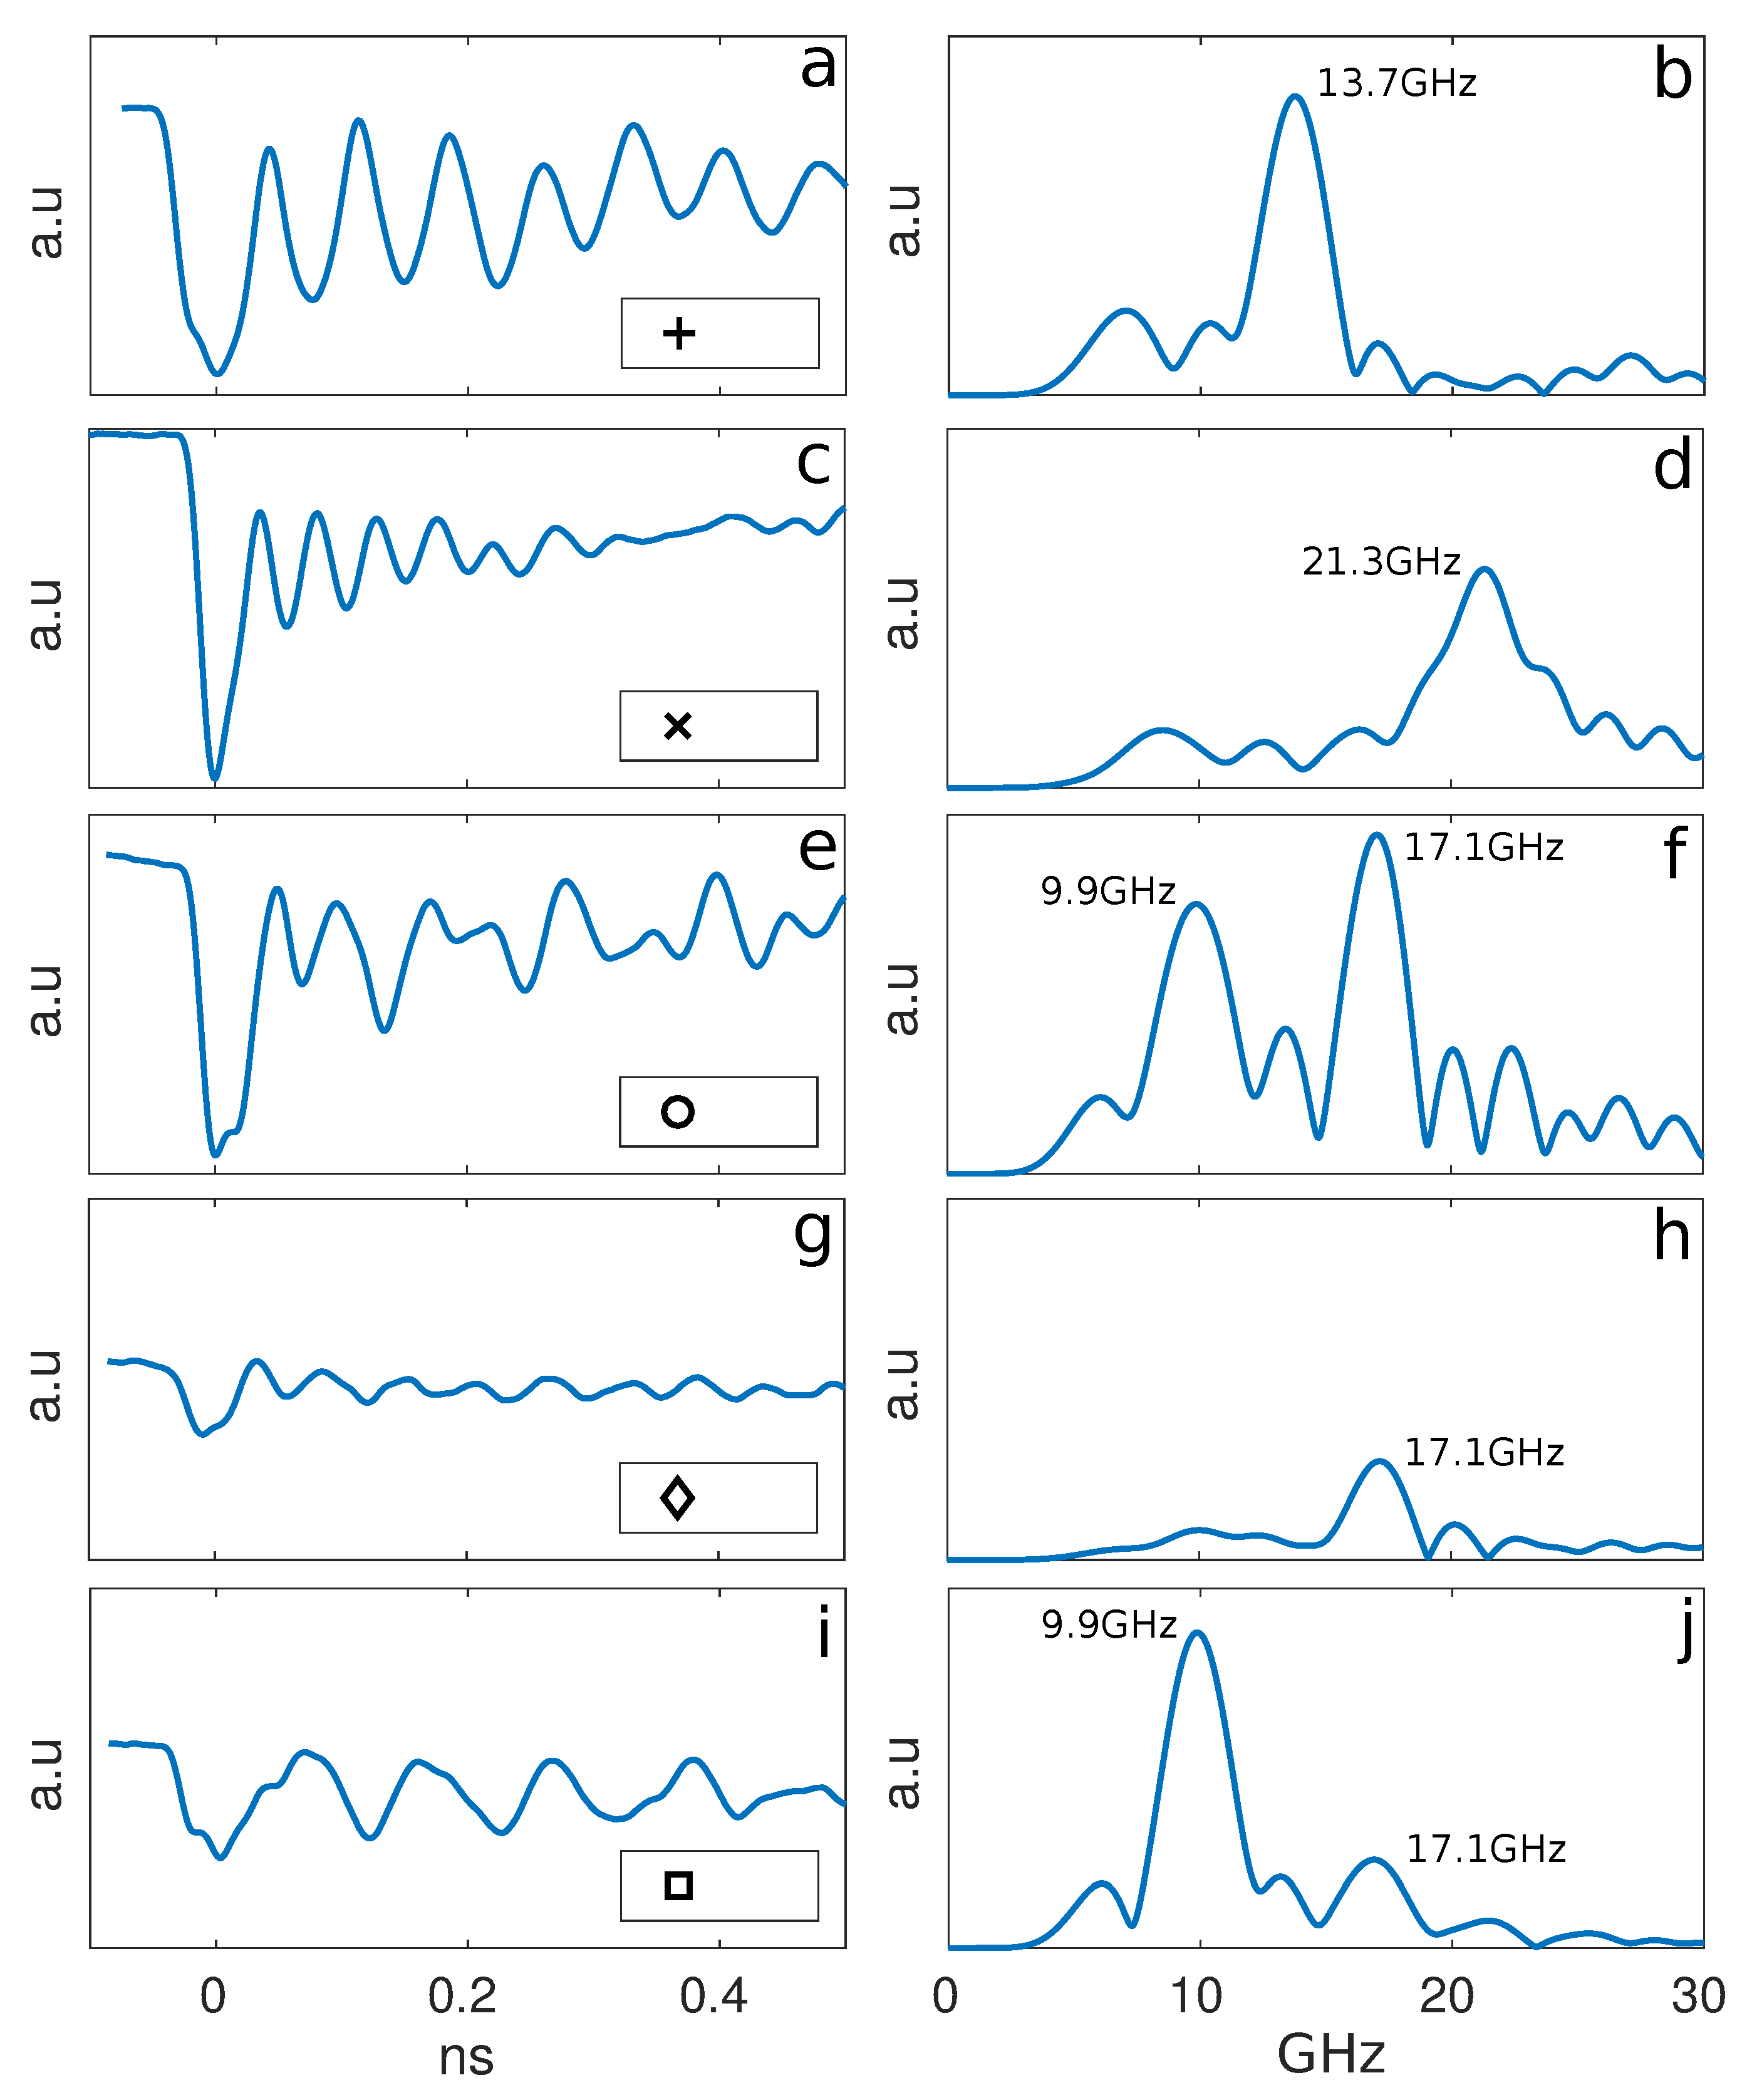
Example experimental traces from the two finer scans (100 nm step size) from Section 5.2 (marked points) are shown in Figure 5. A single frequency component is presented when there is a single nanoparticle. There are no low frequency components (2–7 GHz), which would be expected if a few particles were in contact (considered as dumbbells) [34]. Figure 5b,d show 13.7 GHz and 21.3 GHz component given by ∼250 nm and ∼150 nm single gold nanoparticles, respectively.
On the other hand, if several particles are present in the same point spread function, the signals show various frequency components, due to the different sizes of the nanoparticles. Two frequency components are shown in Figure 5f: 9.9 GHz and 17.1 GHz, respectively, from the center of the middle blob in Figure 4h. This indicates that there are two nanoparticles with different sizes: either in contact (dumbbell) or separated. We suppose that they are separated because the low frequency component might match a ∼300 nm size particle. This is confirmed when one of the frequency components decays moving towards the edges of the blob; therefore, two independent particles with ∼300 nm and ∼200 nm particles are presented in our scanned area. The described behaviour shows a method to characterise sub-optical size nanoparticles (Section 5.2), and it might allow high-resolution detection of several nanoparticles inside the point spread function based on their vibrational mode frequencies and their localisation if we find the centroid for the amplitude maps at each particle frequency.

6. Conclusions

In summary, we have demonstrated that we can enhance the optical response of metal nanoparticles in a pump–probe configuration system by carefully selecting either the size of the particle or the probe laser wavelength, which provides a method for optimising the signal amplitude without increasing the laser power. The choice of position of maximum sensitivity is halfway between the optical return minimum and maximum. The size of the nanoparticles can be determined from their vibrational frequency alone because it only depends on the size and mechanical properties of the particle and is completely independent of the optical scattering. We can also distinguish different vibrational modes inside a point spread function and relate the frequencies to the size of the particles. Moreover, a careful choice of the probe wavelength allows to “turn off” the response of specific particles. Optimising the generation and detection capabilities of nanoparticles might open up the possibility to use nanoparticles as sources/detectors of ultrasounds for cell imaging, allowing a considerable enhancement of the lateral resolution or mass-loading sensors where the main vibrational mode is shifted due to the change of the medium mechanical properties [35].

Acknowledgments

This work was supported by the Engineering and Physical Sciences Research Council (Grant No. EP/K021877/1) (EPSRC).

Author Contributions

Rafael Fuentes-Domínguez, Richard J. Smith and Matt Clark conceived and designed the experiments; Rafael Fuentes-Domínguez performed the experiments and wrote the paper; Leonel Marques made the samples; Fernando Pérez-Cota and Ovidio Peña-Rodríguez participated in the paper’s revision and made many suggestions. All authors read and approved the final manuscript.

Conflicts of Interest

The authors declare no conflict of interest.

References

  1. Mie, G. Contributions on the optics of turbid media, particularly of colloidal metal solutions. Ann. Phys 1908, 25, 377–445. [Google Scholar] [CrossRef]
  2. Yang, W. Improved recursive algorithm for light scattering by a multilayered sphere. Appl. Opt. 2003, 42, 1710–1720. [Google Scholar] [CrossRef] [PubMed]
  3. Peña, O.; Pal, U. Scattering of electromagnetic radiation by a multilayered sphere. Comput. Phys. Commun. 2009, 180, 2348–2354. [Google Scholar] [CrossRef]
  4. Fujii, M.; Nagareda, T.; Hayashi, S.; Yamamoto, K. Low-frequency Raman scattering from small silver particles embedded in SiO2 thin films. Phys. Rev. B 1991, 44, 6243. [Google Scholar] [CrossRef]
  5. Portales, H.; Saviot, L.; Duval, E.; Fujii, M.; Hayashi, S.; Del Fatti, N.; Vallée, F. Resonant Raman scattering by breathing modes of metal nanoparticles. J. Chem. Phys. 2001, 115, 3444–3447. [Google Scholar] [CrossRef]
  6. Tcherniega, N.; Zemskov, K.; Savranskii, V.; Kudryavtseva, A.; Olenin, A.Y.; Lisichkin, G. Experimental observation of stimulated low-frequency Raman scattering in water suspensions of silver and gold nanoparticles. Opt. Lett. 2013, 38, 824–826. [Google Scholar] [CrossRef] [PubMed]
  7. Hodak, J.H.; Martini, I.; Hartland, G.V. Observation of acoustic quantum beats in nanometer sized Au particles. J. Chem. Phys. 1998, 108, 9210–9213. [Google Scholar] [CrossRef]
  8. Hodak, J.H.; Henglein, A.; Hartland, G.V. Size dependent properties of Au particles: Coherent excitation and dephasing of acoustic vibrational modes. J. Chem. Phys. 1999, 111, 8613–8621. [Google Scholar] [CrossRef]
  9. Van Dijk, M.A.; Lippitz, M.; Orrit, M. Detection of acoustic oscillations of single gold nanospheres by time-resolved interferometry. Phys. Rev. Lett. 2005, 95, 267406. [Google Scholar] [CrossRef] [PubMed]
  10. Hartland, G.V. Coherent excitation of vibrational modes in metallic nanoparticles. Annu. Rev. Phys. Chem. 2006, 57, 403–430. [Google Scholar] [CrossRef] [PubMed]
  11. Guillet, Y.; Rossignol, C.; Audoin, B.; Calbris, G.; Ravaine, S. Optoacoustic response of a single submicronic gold particle revealed by the picosecond ultrasonics technique. Appl. Phys. Lett. 2009, 95, 61909. [Google Scholar] [CrossRef]
  12. Crut, A.; Maioli, P.; Del Fatti, N.; Vallée, F. Acoustic vibrations of metal nano-objects: Time-domain investigations. Phys. Rep. 2015, 549, 1–43. [Google Scholar] [CrossRef]
  13. Crut, A.; Maioli, P.; Del Fatti, N.; Vallée, F. Time-domain investigation of the acoustic vibrations of metal nanoparticles: Size and encapsulation effects. Ultrasonics 2015, 56, 98–108. [Google Scholar] [CrossRef] [PubMed]
  14. Perner, M.; Gresillon, S.; März, J.; Von Plessen, G.; Feldmann, J.; Porstendorfer, J.; Berg, K.J.; Berg, G. Observation of hot-electron pressure in the vibration dynamics of metal nanoparticles. Phys. Rev. Lett. 2000, 85, 792. [Google Scholar] [CrossRef] [PubMed]
  15. Voisin, C.; Del Fatti, N.; Christofilos, D.; Vallée, F. Ultrafast electron dynamics and optical nonlinearities in metal nanoparticles. J. Phys. Chem. B 2001, 105, 2264–2280. [Google Scholar] [CrossRef]
  16. Elzinga, P.A.; Lytle, F.E.; Jian, Y.; King, G.B.; Laurendeau, N.M. Pump/probe spectroscopy by asynchronous optical sampling. Appl. Spectrosc. 1987, 41, 2–4. [Google Scholar] [CrossRef]
  17. Bartels, A.; Cerna, R.; Kistner, C.; Thoma, A.; Hudert, F.; Janke, C.; Dekorsy, T. Ultrafast time-domain spectroscopy based on high-speed asynchronous optical sampling. Rev. Sci. Instrum. 2007, 78, 35107. [Google Scholar] [CrossRef] [PubMed]
  18. Aylott, J.W. Optical nanosensors-an enabling technology for intracellular measurements. Analyst 2003, 128, 309–312. [Google Scholar] [CrossRef] [PubMed]
  19. Smith, R.J.; Cota, F.P.; Marques, L.; Chen, X.; Arca, A.; Webb, K.; Aylott, J.; Somekh, M.G.; Clark, M. Optically excited nanoscale ultrasonic transducers. J. Acoust. Soc. Am. 2015, 137, 219–227. [Google Scholar] [CrossRef] [PubMed]
  20. Pérez-Cota, F.; Smith, R.J.; Moradi, E.; Marques, L.; Webb, K.F.; Clark, M. Thin-film optoacoustic transducers for subcellular Brillouin oscillation imaging of individual biological cells. Appl. Opt. 2015, 54, 8388–8398. [Google Scholar] [CrossRef] [PubMed]
  21. Pérez-Cota, F.; Smith, R.J.; Moradi, E.; Marques, L.; Webb, K.F.; Clark, M. High resolution 3D imaging of living cells with sub-optical wavelength phonons. Sci. Rep. 2016, 6, 39326. [Google Scholar] [CrossRef] [PubMed]
  22. Lerme, J.; Pellarin, M.; Cottancin, E.; Gaudry, M.; Broyer, M.; Del Fatti, N.; Vallee, F.; Voisin, C. Influence of lattice contraction on the optical properties and the electron dynamics in silver clusters. Eur. Phys. J. D-At. Mol. Opt. Plasma Phys. 2001, 17, 213–220. [Google Scholar] [CrossRef]
  23. Coronado, E.A.; Schatz, G.C. Surface plasmon broadening for arbitrary shape nanoparticles: A geometrical probability approach. J. Chem. Phys. 2003, 119, 3926–3934. [Google Scholar] [CrossRef]
  24. Bohren, C.F.; Huffman, D.R. Absorption and Scattering of Light by Small Particles; John Wiley & Sons: Hoboken, NJ, USA, 2008. [Google Scholar]
  25. Kai, L.; Massoli, P. Scattering of electromagnetic-plane waves by radially inhomogeneous spheres: A finely stratified sphere model. Appl. Opt. 1994, 33, 501–511. [Google Scholar] [CrossRef] [PubMed]
  26. Garfinkel, M.; Tiemann, J.; Engeler, W. Piezoreflectivity of the noble metals. Phys. Rev. 1966, 148, 695. [Google Scholar] [CrossRef]
  27. Wright, O.B. Ultrafast nonequilibrium stress generation in gold and silver. Phys. Rev. B 1994, 49, 9985. [Google Scholar] [CrossRef]
  28. Voisin, C.; Christofilos, D.; Del Fatti, N.; Vallée, F. Environment effect on the acoustic vibration of metal nanoparticles. Phys. B Condens. Matter 2002, 316, 89–94. [Google Scholar] [CrossRef]
  29. Juvé, V.; Crut, A.; Maioli, P.; Pellarin, M.; Broyer, M.; Del Fatti, N.; Vallée, F. Probing elasticity at the nanoscale: Terahertz acoustic vibration of small metal nanoparticles. Nano Lett. 2010, 10, 1853–1858. [Google Scholar] [CrossRef] [PubMed]
  30. Sauceda, H.E.; Mongin, D.; Maioli, P.; Crut, A.; Pellarin, M.; Fatti, N.D.; Vallée, F.; Garzón, I.L. Vibrational properties of metal nanoparticles: Atomistic simulation and comparison with time-resolved investigation. J. Phys. Chem. C 2012, 116, 25147–25156. [Google Scholar] [CrossRef]
  31. Dubrovskiy, V.; Morochnik, V. Natural vibrations of a spherical inhomogeneity in an elastic medium. Izv. Earth Phys. 1981, 17, 494–504. [Google Scholar]
  32. Ai, H.; Jones, S.A.; Lvov, Y.M. Biomedical applications of electrostatic layer-by-layer nano-assembly of polymers, enzymes, and nanoparticles. Cell Biochem. Biophys. 2003, 39, 23–43. [Google Scholar] [CrossRef]
  33. Mongin, D.; Juvé, V.; Maioli, P.; Crut, A.; Del Fatti, N.; Vallée, F.; Sànchez-Iglesias, A.; Pastoriza-Santos, I.; Liz-Marzán, L.M. Acoustic vibrations of metal-dielectric core-shell nanoparticles. Nano Lett. 2011, 11, 3016–3021. [Google Scholar] [CrossRef] [PubMed]
  34. Tchebotareva, A.L.; Van Dijk, M.A.; Ruijgrok, P.V.; Fokkema, V.; Hesselberth, M.H.; Lippitz, M.; Orrit, M. Acoustic and optical modes of single dumbbells of gold nanoparticles. ChemPhysChem 2009, 10, 111–114. [Google Scholar] [CrossRef] [PubMed]
  35. Yu, K.; Sader, J.E.; Zijlstra, P.; Hong, M.; Xu, Q.H.; Orrit, M. Probing silver deposition on single gold nanorods by their acoustic vibrations. Nano Lett. 2014, 14, 915–922. [Google Scholar] [CrossRef] [PubMed]
Figure 1. (a) schematic representation of the experiment, showing the spherical nanoparticle, the pump and probe laser beams and the vibrations; (b) the absorption cross-section for a 150 nm gold nanoparticle computed [3] with the fixed pump wavelength ( λ p u m p = 415 nm) marked; (c) backscattering cross-section (blue) and the optical sensitivity (orange) of a variable sized gold nanoparticle (0–550 nm) illuminated with a fixed probe laser wavelength ( λ p r o b e = 780 nm) in water. The first optimal size for acting as a detector is shown (∼160 nm); here, the backscattering cross-section is very sensitive to the size and, as the particle vibrates, the backscatter is modulated, additional maxima in the sensitivity are shown, but these are for increasingly large particles.
Applsci 07 00819 g001
Figure 2. (a) theoretical backscattering cross-section [24] as a function of particle diameter and probe laser wavelength using Equation (2) for a gold nanoparticle in water; (b) optical sensitivity defined as the change in scattered light over 1 nm change in the radius of the particle; (c) modulation depth (optical sensitivity divided by the backscattering cross-section); (d) the optical sensitivity with respect to the signal-to-noise ratio (SNR) assuming optical shot noise; (e) theoretical change in modulation depth per nm for a 150, 200 and 250 nm gold nanoparticles in air (lines) and water (dots), calculated by the Mie model; (f) theoretical breathing mode frequency for a nanoparticle of silica, silver (Ag) and gold (Au) in air (lines) and water (dots), calculated by the mechanical model.
Applsci 07 00819 g002
Figure 3. Measured amplitude (blue) and theoretical modulation depth (red) for: (a) 150 nm; (b) 200 nm and (c) 250 nm gold nanoparticle in water tuning the probe laser wavelength from 720 to 800 nm measuring the reflected light; (df) show the oscillation amplitudes (small box figure), their frequency spectra and the degree of enhancement for the circle and squares from a–c.
Applsci 07 00819 g003
Figure 4. Sample containing a mixture of gold nanospheres of different sizes, imaged over an area of 50 × 50 μ m 2 and two 5 × 5 μ m 2 finer scans measuring transmitted light. (a) optical picture of the big scanned area; (b) ultrasonic picture showing the frequency measured; (c) histogram with the size distribution of particles where the arrows show the expected size of nanoparticles (150, 200 and 250 nm diameter); (d) ultrasonic picture showing the size of the nanospheres using the mechanical model (Section 2.4) to convert the breathing mode into size in nm; (e,f) are the optical and acoustic pictures, respectively, of the solid square area (5 × 5 μ m 2 ); (g,h) are the optical and acoustic pictures, respectively, of the dashed square area (5 × 5 μ m 2 ).
Applsci 07 00819 g004
Figure 5. Experimental traces and their frequency spectrums, showing the main breathing mode frequencies. (a,b) example traces for the particle in Figure 4f; (c,d) example traces of the top particle for Figure 4h; (ej) example traces for the middle particle in three different locations for Figure 4h.
Applsci 07 00819 g005

