Modeling kV X-ray-Induced Coloration in Radiochromic Films

1
Department of Physics, City University of Hong Kong, Tat Chee Avenue, Kowloon Tong, Hong Kong, China
2
Faculty of Science, University of Kragujevac, Kragujevac 34000, Serbia
*
Author to whom correspondence should be addressed.
Appl. Sci. 2018, 8(1), 106; https://doi.org/10.3390/app8010106
Submission received: 28 November 2017
/
Revised: 29 December 2017
/
Accepted: 8 January 2018
/
Published: 12 January 2018
(This article belongs to the Special Issue Radiation Effects of Materials with Laser, Ion Beam and Rays)
Abstract
:Commercially available radiochromic films are primarily designed for clinical X-ray dosimetry. These films change color upon exposures to radiation as a result of solid-state polymerization (SSP). Built on a previous model developed for SSP upon exposures to ultraviolet (UV) radiation, a new model was developed in the present work for X-ray-induced coloration in Gafchromic EBT3 films. Monte Carlo simulations using the Monte Carlo N-Particle (MCNP) code were employed to model the transport and interaction of photons and the generated secondary electrons within the film active layer. The films were exposed to continuous-energy photon beams. The dose DE in the external radiation detector (i.e., ionization chamber) was determined and the realistic dose DA in the film active layer was then obtained using the calibration coefficient R (=DA/DE). The finite element method (FEM) was used to solve the classical steady-state Helmholtz equation using the multifrontal massively parallel sparse direct solver (MUMPS). An extensive grid independence test was carried out and the numerical stability of the present model was ensured. The reflected light intensity from the film surface was used to theoretically obtain the net reflective optical density of the film exposed to X-ray. Good agreement was obtained between the experimental and theoretical results of the net reflective optical density of the film. For X-ray doses >~600 cGy, due to the already formed densely cross-linked structure in the active layer of the EBT3 film so further bond formation was less likely, the reflected light intensity from the film surface increased at a relatively lower rate when compared to those for dose values <~600 cGy.
1. Introduction
Commercially available radiochromic films were designed for X-ray dosimetry [1], where coloration of the films was used to obtain the dose–response relationship. The energy transferred to the receptive parts of the monomers in a radiochromic film could lead to color changes [1] through solid-state polymerization (SSP) [2]. A model for the SSP process in Gafchromic EBT3 films was previously developed [3]. Since the model aimed at explicitly illustrating the SSP process, coloration upon exposures to ultraviolet (UV) radiation instead of X-rays was modeled to avoid the complication of the need to study the secondary electrons generated by X-ray photons. Built on that developed model [3], a new model was developed in the present work for color changes in Gafchromic EBT3 films upon exposures to X-rays. To the best of our knowledge, no theoretical models are currently available for X-ray-induced coloration in EBT3 films. In the present work, Monte Carlo simulation was employed to model the interactions of X-ray photons and the generated secondary electrons in the EBT3 film active layer using the Monte Carlo N-Particle (MCNP) code package [4]. In our Monte Carlo model, the interaction and the transport of the generated secondary electrons were implemented, and dose dispersion [5] in the film active layer was also considered. The realistic amount of energy transferred to the EBT3 film active layer was obtained through Monte Carlo simulation and determination of the calibration coefficient R (=DA/DE) [6,7], where DA was the actual dose delivered to the EBT3 film active layer and DE was the dose recorded by an external ionization chamber.
Atomic scale and macroscopic scale models were employed to model the coloration of EBT3 films, as in the previous model [3]. The classical Helmholtz equation was used to model light reflection from and transmittance through the modeled EBT3 film active layer, and the present system was solved using the finite element method (FEM) technique by employing the multifrontal massively parallel sparse direct solver (MUMPS) [8]. A grid independence test analysis was performed for different grid sizes to ensure the numerical stability of the present model. The theoretical and experimental results were compared.
2. Materials and Methods
The atomic scale model for diacetylene (DA) pentacosa-10,12-diynoate monomers [3], i.e., monomers in the EBT3 film active layer [9], was used to obtain the density changes of the EBT3 film active layer. The density of the unexposed film active layer was used to further refine the results through an inverse problem approach. As in [3], changes in the density of the monomer clusters were examined by carefully relaxing the system at the desired exposed energy and temperature (room temperature here) at a specific pressure, which correlated with the energy irradiating the films.
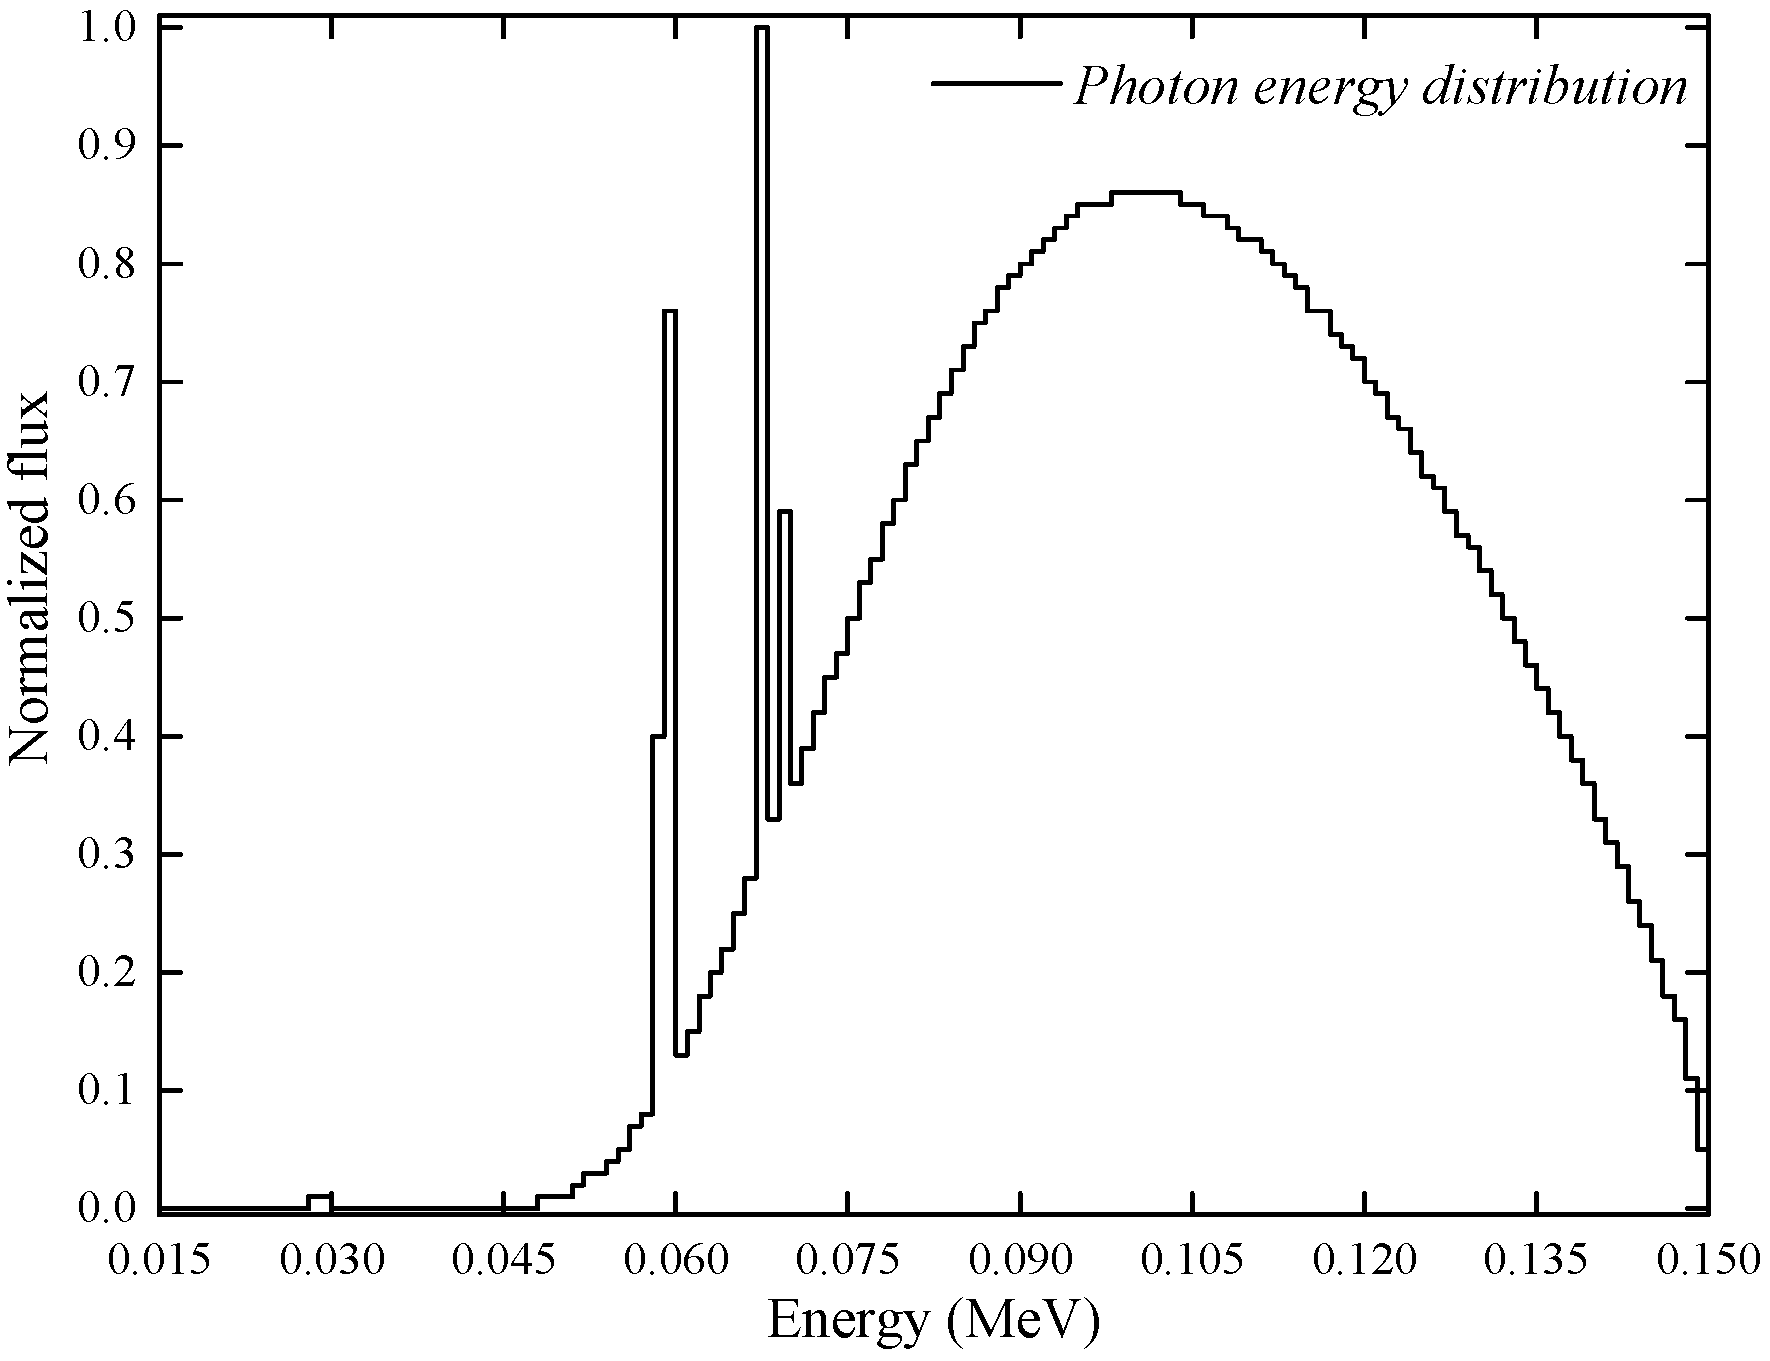
The experimental data employed in the present work for comparison with the modeled data were obtained by Chan et al. [10] who used the X-RAD 320 Irradiator (Precision X-ray (PXi), Inc., North Branford, CT, USA) at operating tube voltage of 150 kV for irradiation, with beam conditioning achieved with a filter consisting of 1.5 mm Al + 0.25 mm Cu + 0.75 mm Sn (and inherent filtration with 0.8 mm beryllium [7]), and a surface-to-target distance (STD) of 50 cm. The photon energy distribution from this beam conditioning is shown in Figure 1, which is similar to the one obtained in [7]. The administrated dose was determined by the ionization chamber (IOC) (UNIDOS® E Universal Dosemeter, PTW, Freiburg, Germany) and ranged from ~11 to 1500 cGy [10].
2.1. Monte Carlo Model
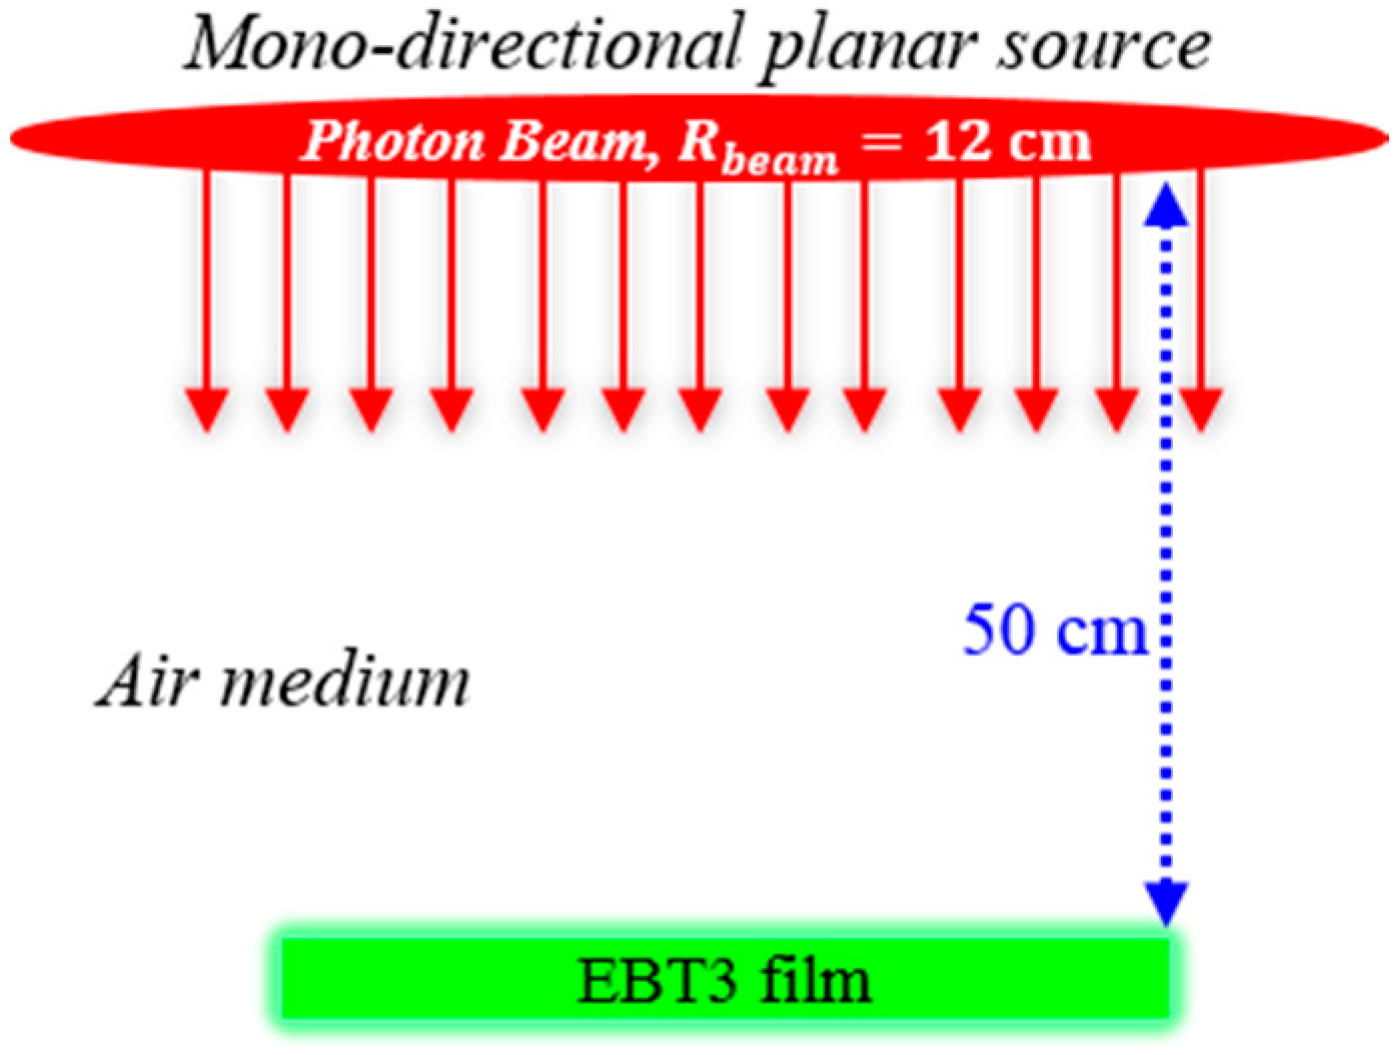
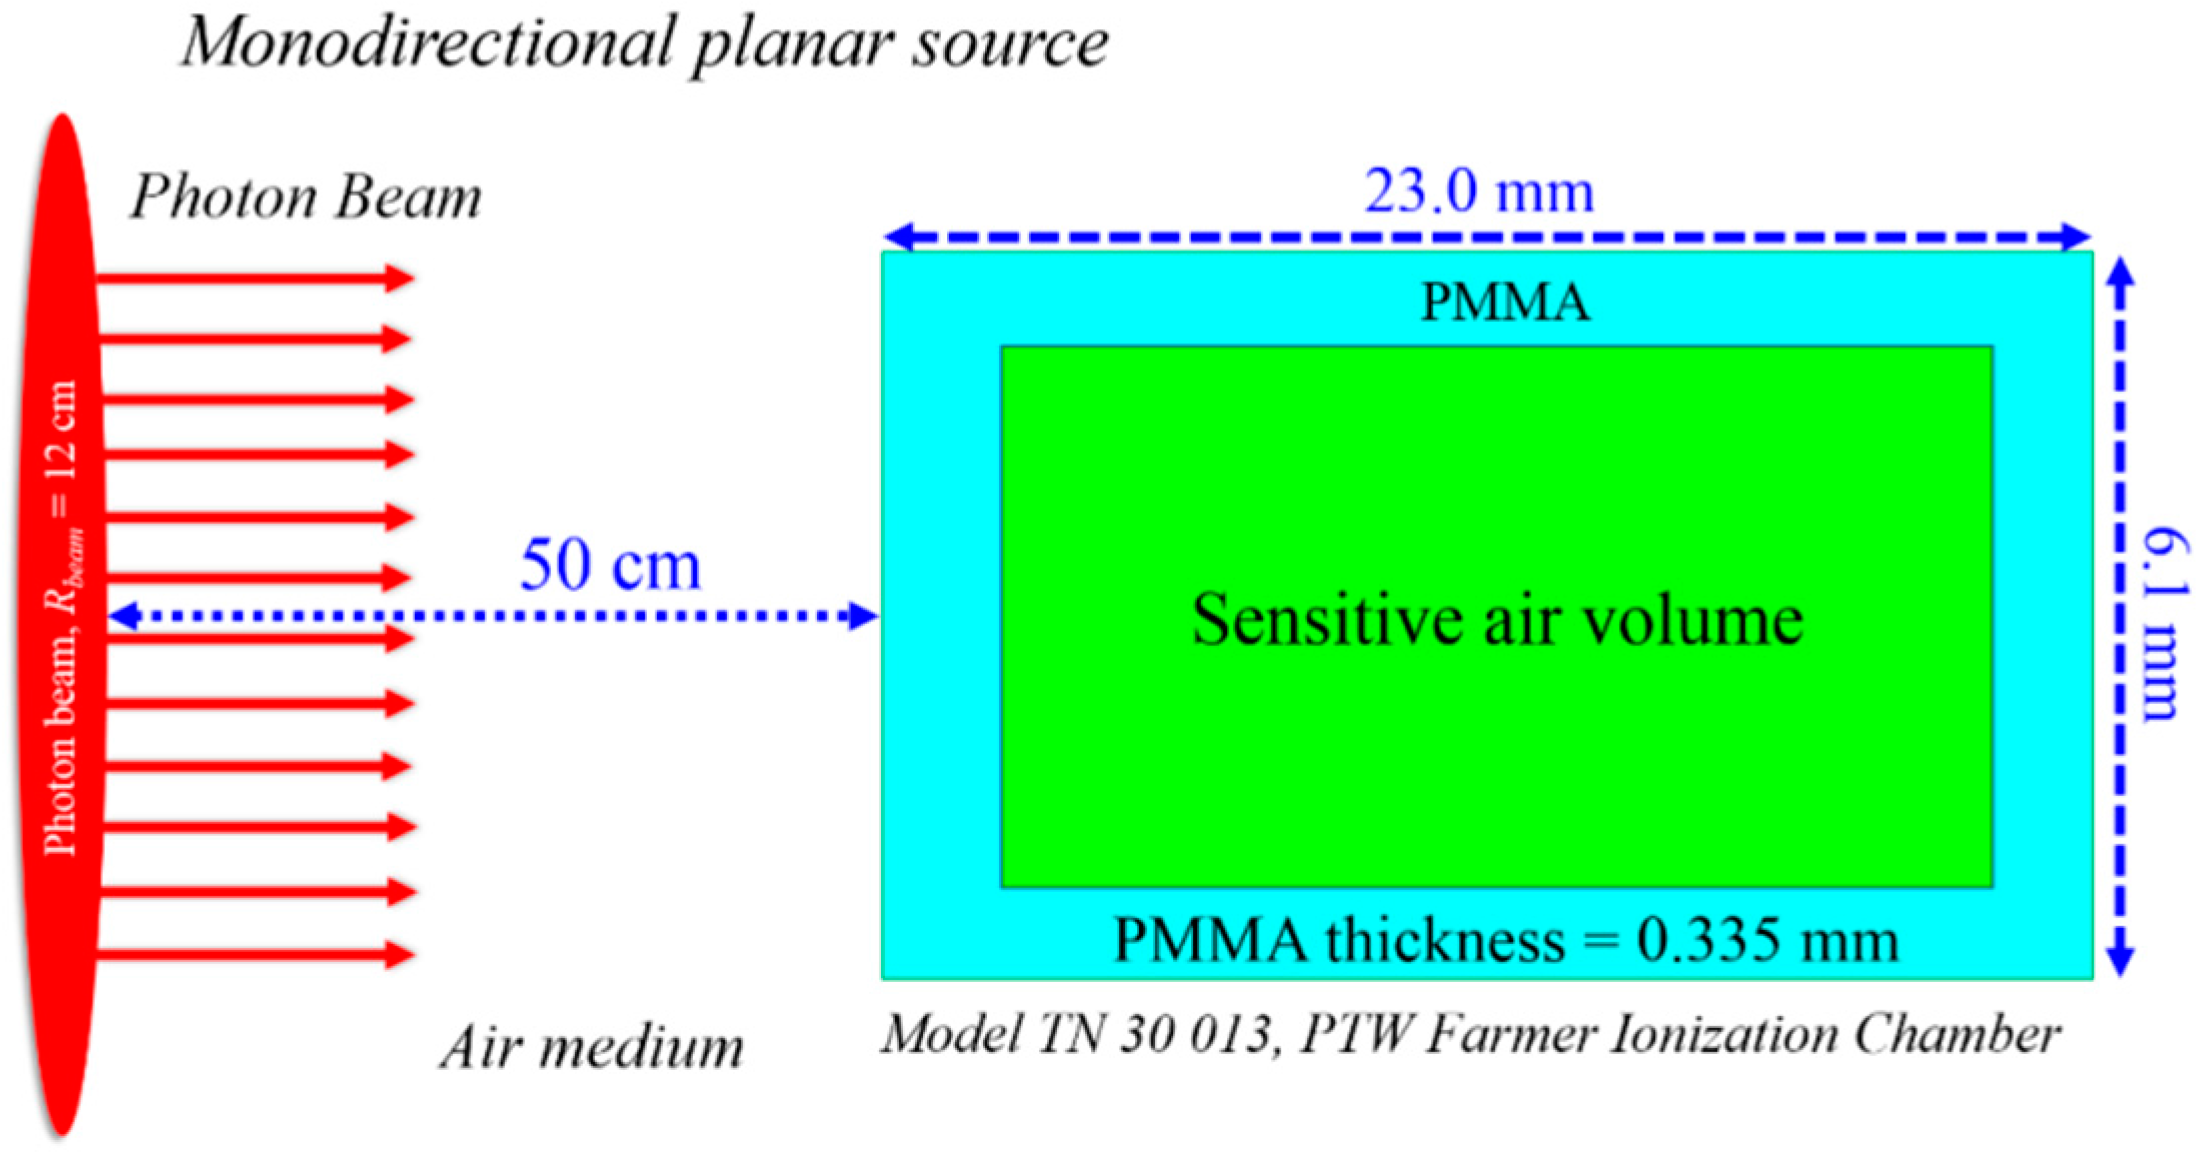
The present Monte Carlo model performed two separate tasks, namely, to model the interaction between the incident photons with (i) the EBT3 film active layer and (ii) the IOC sensitive volume. The setups for irradiating the EBT3 film and the IOC are schematically shown in Figure 2 and Figure 3, respectively. The energies deposited from photons and the generated secondary electrons were scored. The thickness of the EBT3 film active layer was 28 µm and the surface area was 1 × 1 cm2.
The photon doses absorbed in the targeted domains (i.e., EBT3 film active layer and IOC sensitive volume) were determined using the track length estimate of energy deposition (tally F6:P). The mass energy-absorption coefficients (µen(E)/ρ)m of the EBT3 film active layer and air were used to determine the absorbed photon dose (D) as
where ψ(E) was the differential photon fluence for photon energy E, and integration from minimum to maximum energies in the photon energy spectrum was needed. In the present MCNPX computations, the mass energy-absorption coefficients in the MCPLIB04 database were employed. Data for cross-sections, form factors, and fluorescence were all derived from the ENDF/B-VI.8 data library. The photon-coupled-electron transport mode was used to track the propagation of the incident photons and the generated secondary electrons in both EBT3 film active layer and IOC sensitive volume. The coupled transport mode was essential due to the dose deposited by the secondary electrons. For the pure photon transport mode, local energy deposition would be assumed for electrons at their creation sites, which was not desirable for precise determination of energy deposition in the EBT3 film active layer and IOC sensitive volume.
2.2. Finite Element Method (FEM)
Light propagation through the EBT3 film active layer was modeled using the classical steady-state Helmholtz equation as
where was the intensity, S was the source term, and D = 1/3(µα + µs), where µα and µs were absorption and reduced scattering coefficients, respectively. On further expansion, Equation (2) could be expressed as
Detailed derivation of the model was given in [3] and thus would not be repeated here. In the FEM technique, the modeled domain would be broken down into smaller sub-domains using a seamless mesh. In [3], 4-noded tetrahedron elements were used to divide the simulated EBT3 film active layer. In the present work, a grid independence test was performed for the FEM model by varying the grid size and determining the final Net ROD value at different X-ray doses. Here, the grid sizes were refined through the grid refinement factor (r) defined as
where hcoarse was the mesh or grid size before refinement, while hfine was the mesh or grid size after refinement. In practice, r should be larger than 1.3 [11], so here we chose three different average grid sizes of 7.68, 5.15, and 3.73 µm, which gave r values of ~1.49 (=7.68/5.15) and ~1.38 (=5.15/3.73). The absorption coefficients were obtained through µα = ρ × (µα)m, where µα was the absorption coefficient, (µα)m the mass-energy absorption coefficient (set to be at 100 cm2/g [3]), and ρ the density of the atomic scale system obtained from our current model for X-ray irradiation. The FEM model was tuned so that the input absorption coefficient for the small-scale atomic model could provide Net ROD values that could be compared with those obtained experimentally.
2.3. Computation Scheme
Following [3], a monoenergetic light source was used to expose the film, and the reflected light intensity was determined (schematically shown in Figure 4). The Net ROD was defined as
where unexposed and exposed were the reflected light intensities from the unexposed and exposed film to X-ray, respectively. The numerical simulations presented in this paper were executed on a supercomputer with Intel® Xeon E5-2630 v3 2.40 GHz using 32 physical cores and hyper-threaded to 64.
3. Results and Discussions
The dose DE delivered to the IOC sensitive volume by photons and the secondary electrons generated by the incident photons was determined to be 8.373 × 10⁻¹⁶ Gy/photon. The dose DA delivered to the EBT3 film active layer was determined to be 8.695 × 10⁻¹⁶ Gy/photon with an associated relative error (i.e., the statistical uncertainty) of 0.007. The administrated doses given to the EBT3 film in the experiments were calibrated using R = DA/DE = 8.695 × 10⁻¹⁶/8.373 × 10−16 = 1.038. As R was close to unity, DA and DE were not very different when the photon beam with the continuous energy distribution shown in Figure 1 was employed.
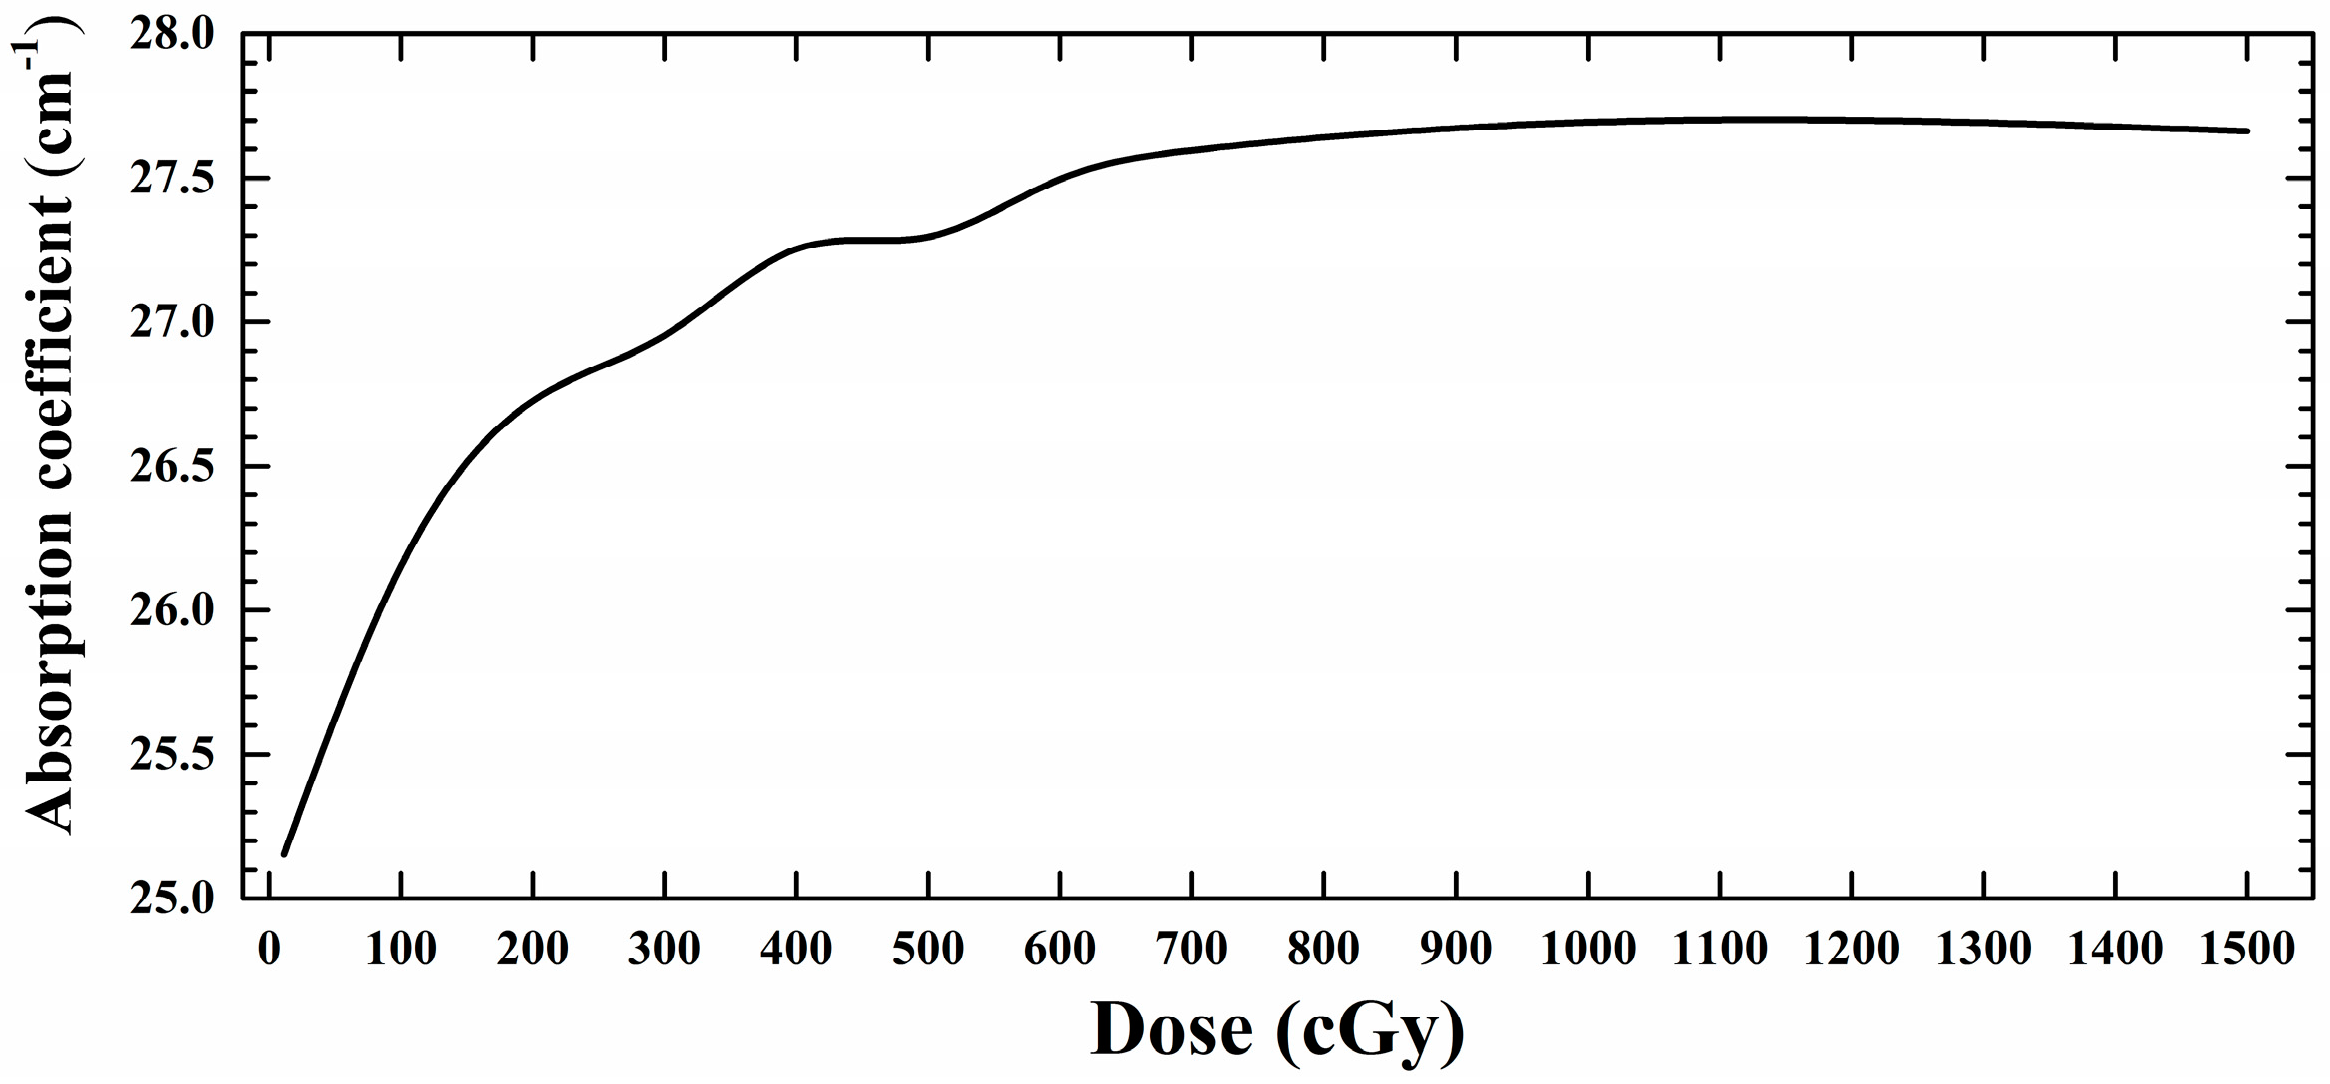
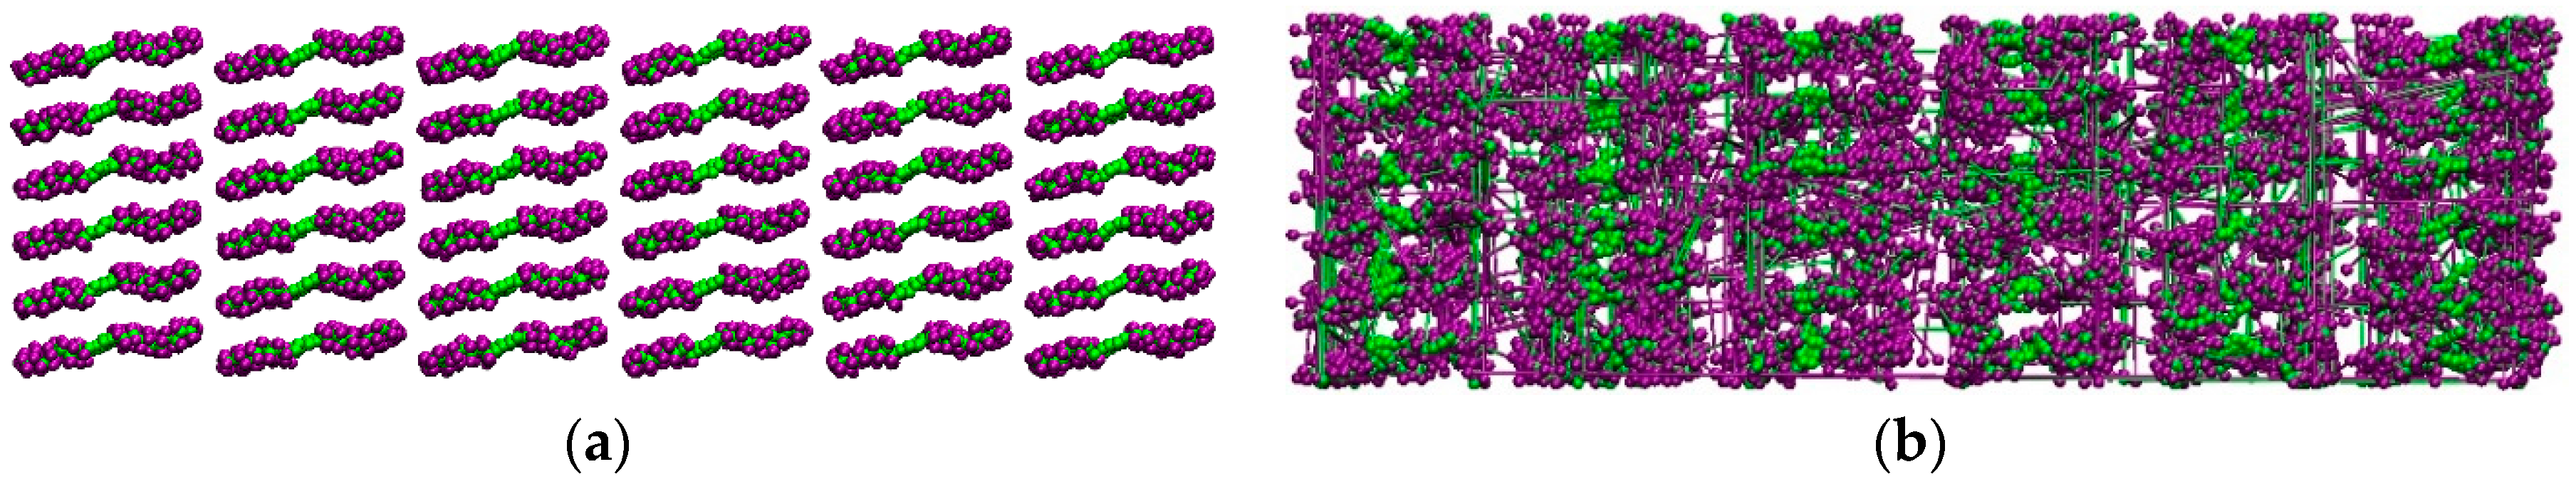
The absorption coefficient of the EBT3 film active layer at different administrated X-ray doses obtained from our model is shown in Figure 5. The absorption coefficient increased noticeably for X-ray doses <~600 cGy, but did not change significantly for larger X-ray doses. The insignificant changes in the absorption coefficient for large X-ray doses were due to the formation of a densely cross-linked structure in the exposed EBT3 film active layer, in which significantly more bonds would not form even with a further supply of energy to the monomers. For illustration purposes, snapshots from atomic configurations of the DA monomers [9] before and after the addition of energy from X-ray photons are shown in Figure 6a,b, respectively, which revealed the formation of a densely polymerized system upon exposure of EBT3 films to X-ray.
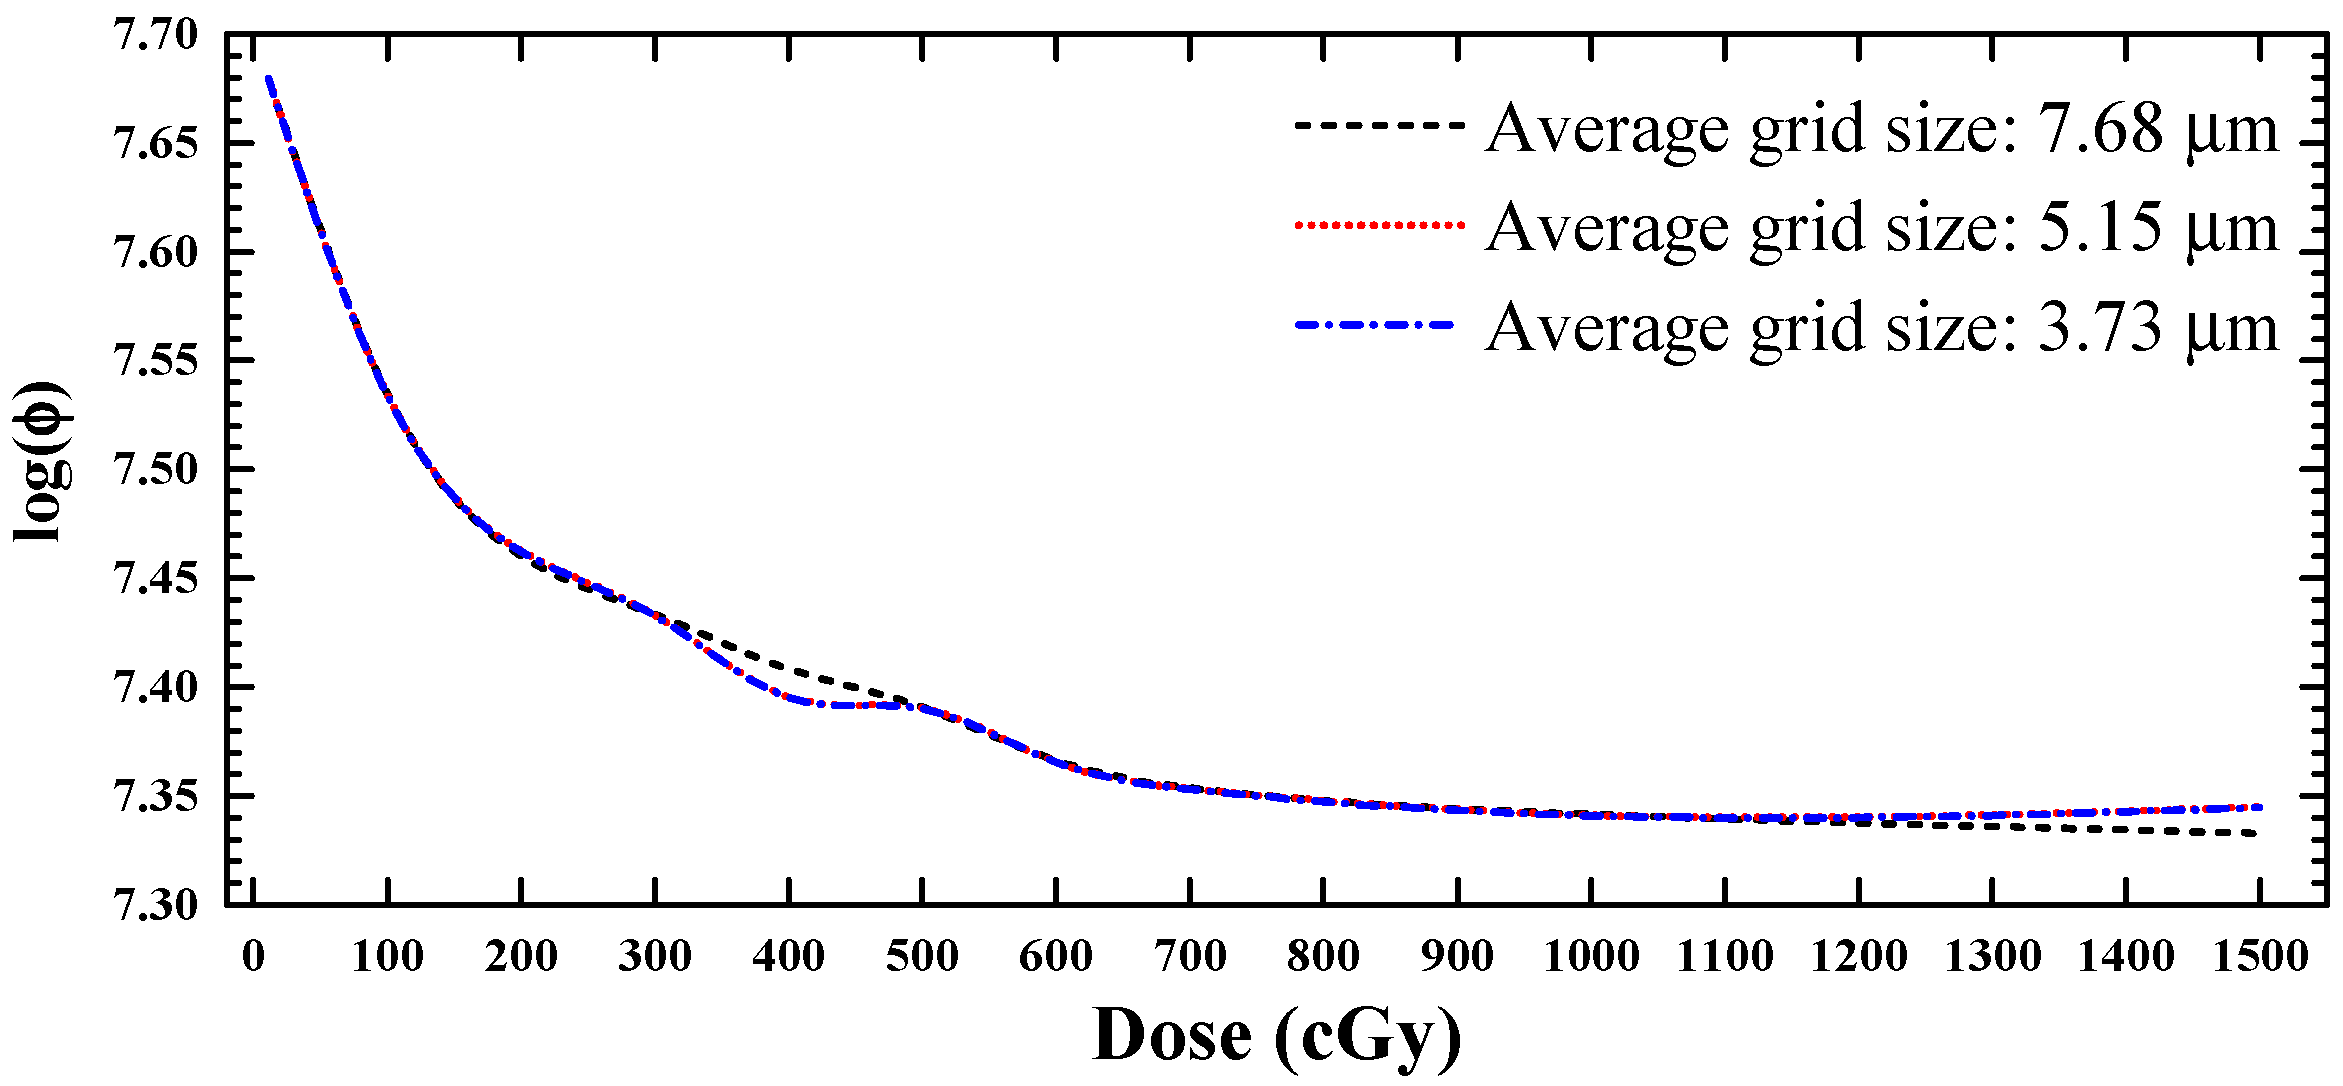
The obtained absorption coefficients were input into the FEM model and the reflected light intensities (log()) from the surface of the EBT3 film were obtained as shown in Figure 7. The reflected light intensity decreased with increasing X-ray dose absorbed by the film active layer. Similar to the film absorption coefficient (Figure 5), the reflected light intensity from the EBT3 film surface decreased noticeably for X-ray doses <~600 cGy, but did not change significantly for larger X-ray doses. The latter was explained by the insignificant changes in the absorption coefficients for larger X-ray doses as a result of formation of a densely cross-linked structure in the exposed EBT3 film active layer. Since the log() values were obtained from the FEM model, a grid independence test analysis was performed. For the three different grid sizes, namely, 7.68, 5.15, and 3.73 µm, log() did not vary significantly with the X-ray doses.
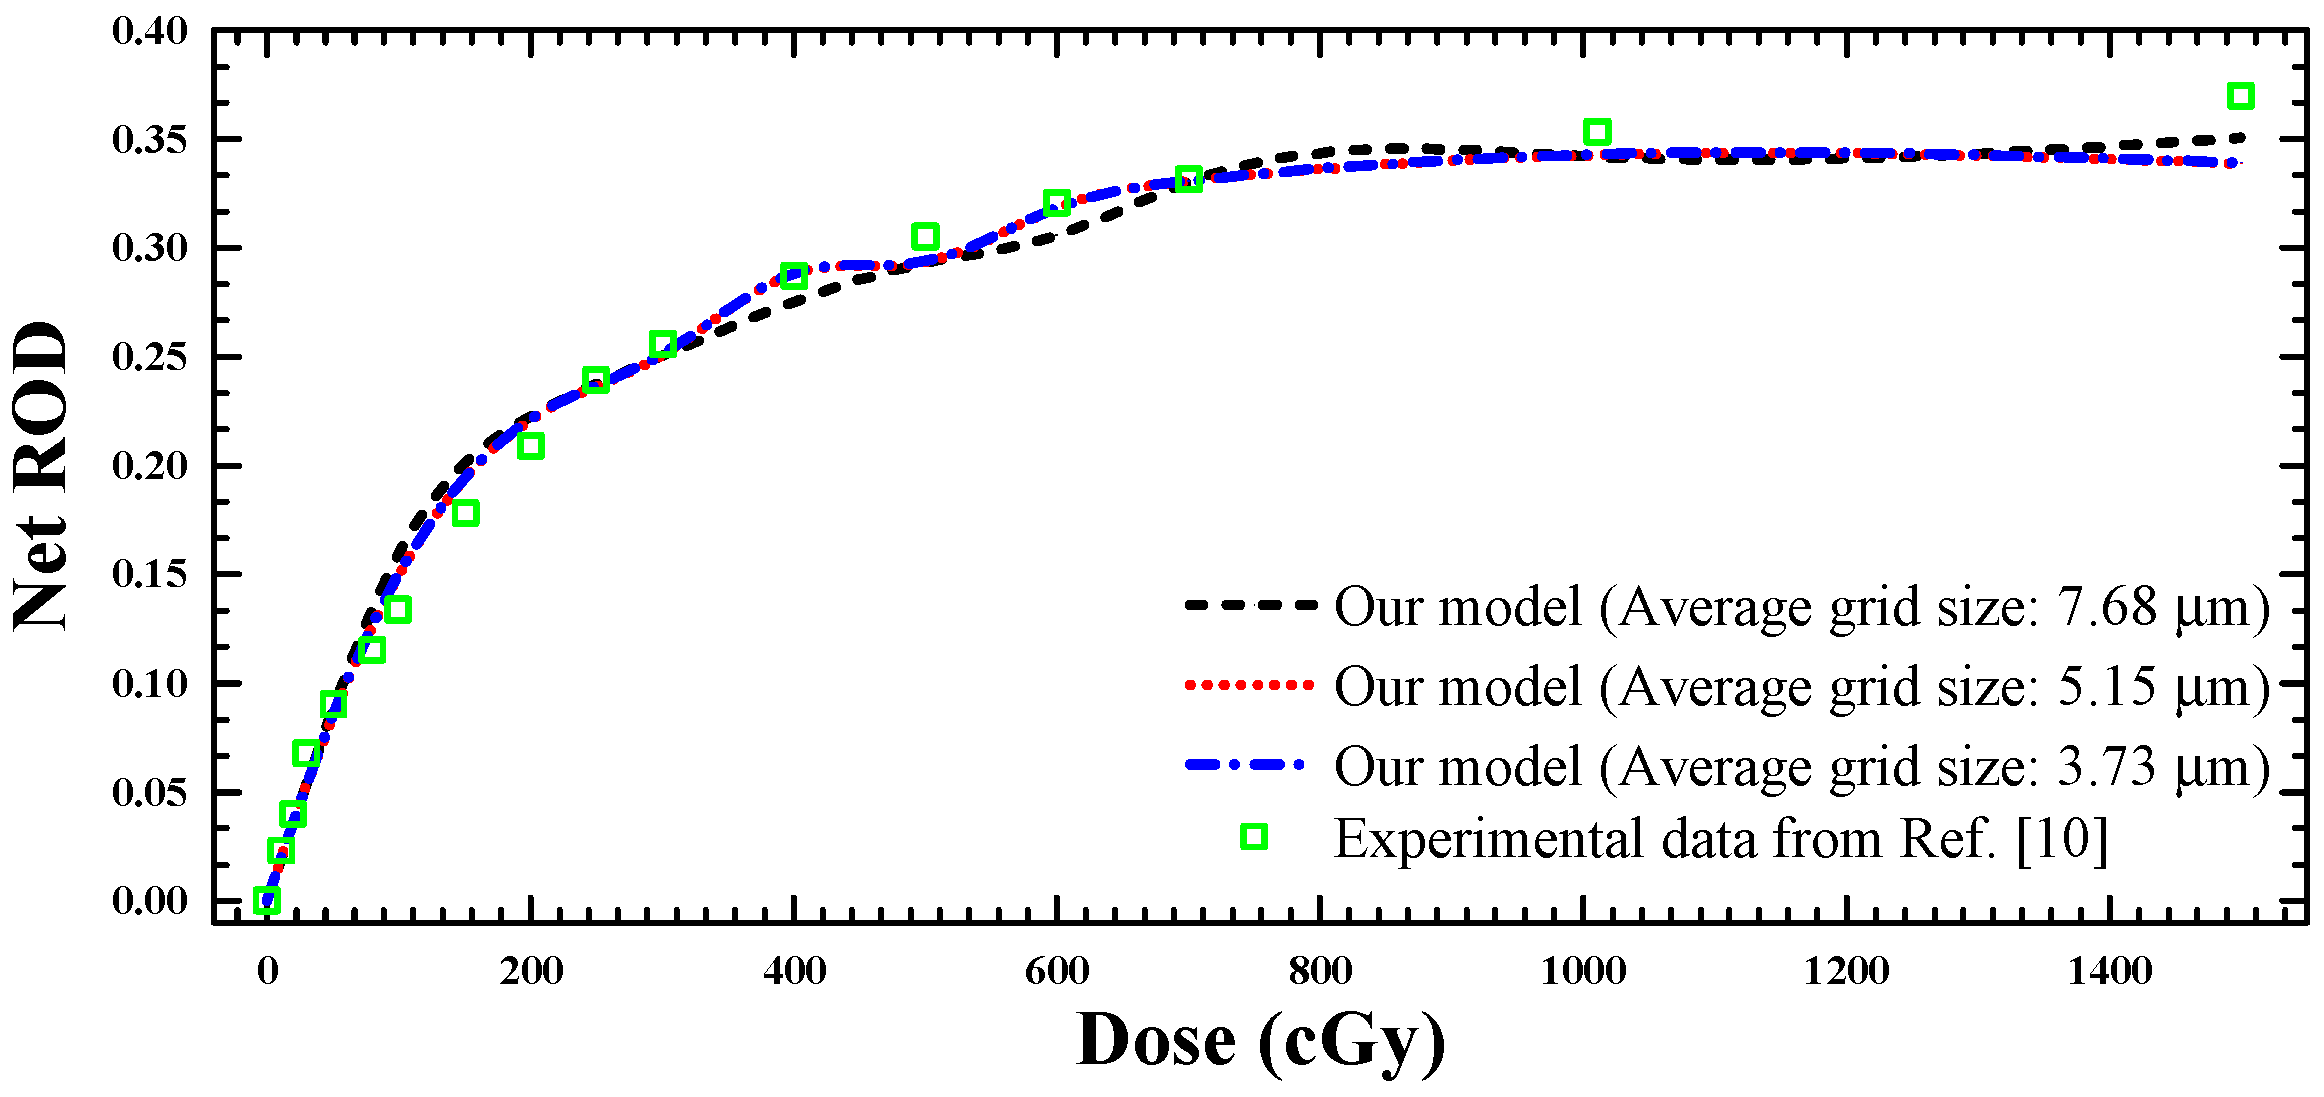
Similar to [3], the Net ROD in our model was defined as Net ROD = log(unexposed/exposed), where unexposed and exposed were reflected light intensities from the films unexposed and exposed to X-ray, respectively. The Net ROD values from the present model were scored over the entire surface of the radiochromic films. The average reflected intensity was determined as the arithmetic mean of the intensities from the elements in the modeled domain [12,13,14]. The experimental data obtained by Chan et al. [10] and the theoretical predictions are shown in Figure 8 for comparison, which showed that the theoretical predictions were very close to the experimental data. The uncertainties shown as shades around the theoretical prediction curves were introduced by the Monte Carlo model. These uncertainties represented one standard deviations obtained from the multiplication of the relative error estimated using the (F6:P) tally by the tally mean value [15]. The slope of the calibration curve in Figure 8 was larger at smaller doses and tended to saturate at larger doses. In other words, the degree of polymerization (surrogated by the Net ROD) increased at a faster rate with the dose when the dose was smaller. Increase in the X-ray dose beyond ~600 cGy did not further darken the film due to saturated polymerization, which prevented a significant additional formation of bonds. The trend agreed with the identification of increases in mechanical stresses between the monomers and the polymer units with the degree of polymerization [16]. Kim et al. [17] also remarked that the mobility of monomer chains decreased during SSP because the crystallinity increased, and the crystalline structure became more stable.
4. Conclusions
In the present work, we built on a previous model developed for SSP to develop a new model for X-ray-induced coloration in EBT3 films. The Monte Carlo method was employed to model the transport of photons and the generated secondary electrons within the film active layer. The calibration coefficient R was used to determine the exact amount of energy deposited in the film active layer. A good agreement between the theoretically determined Net ROD with those obtained experimentally was obtained. In general, the slope of the calibration curve was larger at smaller doses and tended to saturate at doses beyond ~600 cGy. The experimental uncertainties could also be contributed by oxygenation, UV contamination, and variation in film coloration with time. These uncertainties were not simulated by the Monte Carlo method and therefore might lead to discrepancies between the data obtained theoretically and experimentally.
Acknowledgments
We acknowledge the support of the Neutron computer cluster of the Department of Physics, City University of Hong Kong, for the computational work involved in this paper.
Author Contributions
M.S.B. and K.N.Y. conceived and designed the experiments; M.S.B. and D.K. performed the experiments; M.S.B., D.K., and D.N. analyzed the data; D.N. and K.N.Y. contributed reagents/materials/analysis tools; and M.S.B., D.N., and K.N.Y. wrote the paper.
Conflicts of Interest
The authors declare no conflict of interest.
References
- Butson, M.J.; Yu, P.K.N.; Cheung, T.; Metcalfe, P. Radiochromic film for medical radiation dosimetry. Mater. Sci. Eng. R Rep. 2003, 41, 61–120. [Google Scholar] [CrossRef]
- McLaughlin, W.L.; Al-Sheikhly, M.; Lewis, D.F.; Kovács, A.; Wojnárovits, L. Radiochromic Solid-State Polymerization Reaction. In Irradiation of Polymers, Chapter 11; ACS Symposium Series; American Chemical Society: Washington, DC, USA, 1996; Volume 620, pp. 152–166. [Google Scholar]
- Shahmohammadi Beni, M.; Krstic, D.; Nikezic, D.; Yu, K.N. Modeling Coloration of a Radiochromic Film with Molecular Dynamics-Coupled Finite Element Method. Appl. Sci. 2017, 7, 1031. [Google Scholar] [CrossRef]
- X-5 Monte Carlo Team. MCNP—A General Monte Carlo N-Particle Transport Code, Version 5, Vol. I: Overview and Theory; LA-UR-03-1987; Los Alamos National Laboratory: Los Alamos, NM, USA, 2003.
- Shahmohammadi Beni, M.; Ng, C.Y.P.; Krstic, D.; Nikezic, D.; Yu, K.N. Conversion coefficients for determination of dispersed photon dose during radiotherapy: NRUrad input code for MCNP. PLoS ONE 2017, 12, e0174836. [Google Scholar] [CrossRef] [PubMed]
- Shahmohammadi Beni, M.; Krstic, D.; Nikezic, D.; Yu, K.N. A calibration method for realistic neutron dosimetry in radiobiological experiments assisted by MCNP simulation. J. Radiat. Res. 2016, 57, 492–498. [Google Scholar] [CrossRef] [PubMed]
- Shahmohammadi Beni, M.; Krstic, D.; Nikezic, D.; Yu, K.N. Realistic dosimetry for studies on biological responses to X-rays and γ-rays. J. Radiat. Res. 2017, 58, 729–736. [Google Scholar] [CrossRef] [PubMed]
- MUMPS Solver. Available online: http://mumps.enseeiht.fr/ (accessed on 14 November 2017).
- Girard, F.; Bouchard, H.; Lacroix, F. Reference dosimetry using radiochromic film. J. Appl. Clin. Med. Phys. 2012, 13, 339–353. [Google Scholar] [CrossRef] [PubMed]
- Chan, P.M.; Ng, C.Y.P.; Shahmohammadi Beni, M.; Law, S.S.; Yu, K.N. Auto-development issue in quality assurance of biological X-ray irradiator using Gafchromic EBT3 film. Results Phys. 2017, 7, 444–445. [Google Scholar] [CrossRef]
- V 20 Committee. Standard for Verification and Validation in Computational Fluid Dynamics and Heat Transfer; American Society of Mechanical Engineers: New York, NY, USA, 2009. [Google Scholar]
- Shahmohammadi Beni, M.; Yu, K.N. Computational Fluid Dynamics Analysis of Cold Plasma Plume Mixing with Blood Using Level Set Method Coupled with Heat Transfer. Appl. Sci. 2017, 7, 578. [Google Scholar] [CrossRef]
- Shahmohammadi Beni, M.; Yu, K.N. Computational fluid dynamics analysis of cold plasma carrier gas injected into a fluid using level set method. Biointerphases 2015, 10, 041003. [Google Scholar] [CrossRef] [PubMed]
- Shahmohammadi Beni, M.; Zhao, J.; Yu, K.N. Investigation of droplet behaviors for spray cooling using level set method. Ann. Nucl. Energy 2018, 113, 162–170. [Google Scholar] [CrossRef]
- Shahmohammadi Beni, M.; Hau, T.C.; Krstic, D.; Nikezic, D.; Yu, K.N. Monte Carlo studies on neutron interactions in radiobiological experiments. PLoS ONE 2017, 12, e0181281. [Google Scholar] [CrossRef] [PubMed]
- Chance, R.R.; Patel, G.N. Solid-state polymerization of a diacetylene crystal: Thermal, ultraviolet, and γ-ray polymerization of 2, 4-hexadiyne-1, 6-diol bis-(p-toluene sulfonate). J. Polym. Sci. Part B Polym. Phys. 1978, 16, 859–881. [Google Scholar] [CrossRef]
- Kim, T.Y.; Lofgren, E.A.; Jabarin, S.A. Solid-state polymerization of poly(ethylene terephthalate). I. Experimental study of the reaction kinetics and properties. J. Appl. Polym. Sci. 2003, 89, 197–212. [Google Scholar] [CrossRef]
Figure 1.
Photon energy distribution of the X-ray beam used to irradiate the EBT3 film [10].
Figure 1.
Photon energy distribution of the X-ray beam used to irradiate the EBT3 film [10].

Figure 2.
Schematic diagram showing the irradiation of the EBT3 film (film active layer was 28 µm; surface area was 1 × 1 cm2).
Figure 2.
Schematic diagram showing the irradiation of the EBT3 film (film active layer was 28 µm; surface area was 1 × 1 cm2).

Figure 3.
Schematic diagram showing the irradiation of the IOC (model TN 30 013, PTW Farmer® Chamber, UNIDOS® E Universal Dosemeter, PTW, Freiburg, Germany) (IOC: ionization chamber).
Figure 3.
Schematic diagram showing the irradiation of the IOC (model TN 30 013, PTW Farmer® Chamber, UNIDOS® E Universal Dosemeter, PTW, Freiburg, Germany) (IOC: ionization chamber).

Figure 4.
Exposure of EBT3 film to the light source and reflection from the film surface.
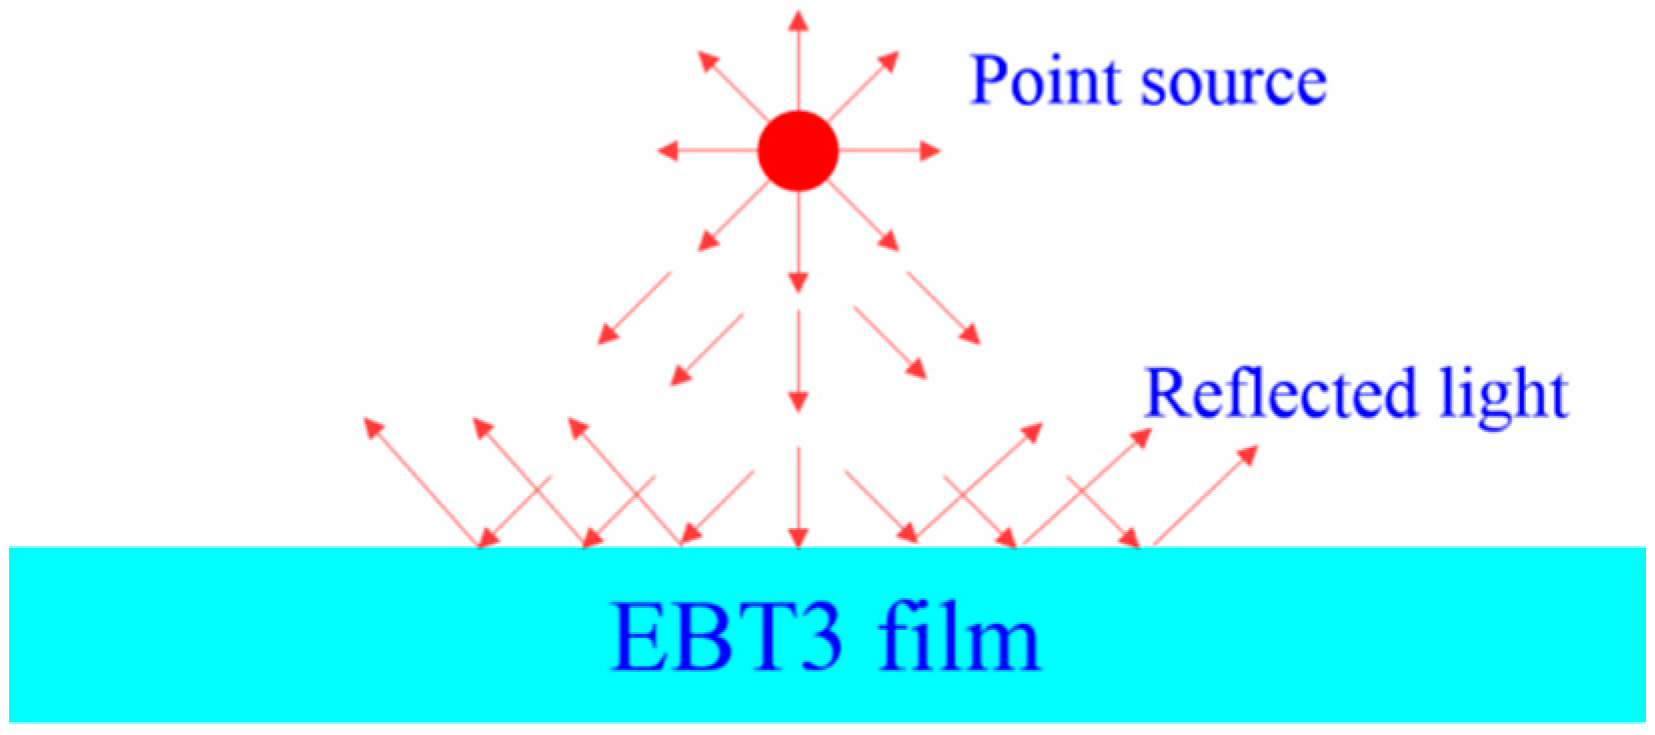
Figure 5.
Calculated absorption coefficients of EBT3 film active layer versus X-ray dose.

Figure 6.
Atomic scale configuration of DA monomers: (a) before and (b) after exposure to X-ray. (Green spheres: carbon atoms; purple spheres: hydrogen atoms; lines: bonding among different atoms in the monomer chains, with more lines representing formation of a denser cluster and thus a denser polymerization.) (Note: A 3D model of polymerization was considered. However, 2D representation of the atomic scale system was used for better visualization) (DA: diacetylene).

Figure 7.
Reflected light intensity (log()) from the EBT3 film surface versus X-ray dose for three average grid sizes, namely, 7.68, 5.15, and 3.73 µm.
Figure 7.
Reflected light intensity (log()) from the EBT3 film surface versus X-ray dose for three average grid sizes, namely, 7.68, 5.15, and 3.73 µm.

Figure 8.
Comparison of Net ROD values obtained experimentally by Chan et al. [10] and theoretically in the present work (for three average grid sizes of 7.68, 5.15, and 3.73 µm) for different administrated X-ray doses. The error bars for the experimental data are smaller than the symbols. The shades around the theoretical curves represent the uncertainties introduced by the Monte Carlo model.

© 2018 by the authors. Licensee MDPI, Basel, Switzerland. This article is an open access article distributed under the terms and conditions of the Creative Commons Attribution (CC BY) license (http://creativecommons.org/licenses/by/4.0/).
Share and Cite
MDPI and ACS Style
Shahmohammadi Beni, M.; Krstic, D.; Nikezic, D.; Yu, K.N. Modeling kV X-ray-Induced Coloration in Radiochromic Films. Appl. Sci. 2018, 8, 106. https://doi.org/10.3390/app8010106
AMA Style
Shahmohammadi Beni M, Krstic D, Nikezic D, Yu KN. Modeling kV X-ray-Induced Coloration in Radiochromic Films. Applied Sciences. 2018; 8(1):106. https://doi.org/10.3390/app8010106
Chicago/Turabian StyleShahmohammadi Beni, Mehrdad, Dragana Krstic, Dragoslav Nikezic, and Kwan Ngok Yu. 2018. "Modeling kV X-ray-Induced Coloration in Radiochromic Films" Applied Sciences 8, no. 1: 106. https://doi.org/10.3390/app8010106
Note that from the first issue of 2016, this journal uses article numbers instead of page numbers. See further details here.