Real-Time Strength Monitoring for Concrete Structures Using EMI Technique Incorporating with Fuzzy Logic


1
Interdisciplinary Program in Crisis, Disaster and Risk Management, Sungkyunkwan University, 2066 Seobu-ro, Jangan-gu, Suwon-si 16419, Gyonggi-do, Korea
2
Department of Civil, Architecture & Environmental System Engineering, Sungkyunkwan University, 2066 Seobu-ro, Jangan-gu, Suwon-si 16419, Gyonggi-do, Korea
3
School of Civil & Architectural Engineering, Sungkyunkwan University, 2066 Seobu-ro, Jangan-gu, Suwon-si 16419, Gyonggi-do, Korea
4
Department of Civil Engineering, Hanseo University, 46 Hanseo 1-ro, Haemi-myeon, Seosan-si 31962, Chungcheongnam-do, Korea
*
Author to whom correspondence should be addressed.
Appl. Sci. 2018, 8(1), 75; https://doi.org/10.3390/app8010075
Submission received: 29 November 2017
/
Revised: 2 January 2018
/
Accepted: 3 January 2018
/
Published: 8 January 2018
(This article belongs to the Section Materials Science and Engineering)
Abstract
:This study estimates the strength of a special mixture of high-strength concrete (HSC) with admixtures for use in a nuclear power plant (NPP). Nuclear power plant structures need a HSC with some additional qualities to operate the safe options. For this purpose, the experimented concrete was specially designed to fulfill the required qualities of NPP. For gaining these desirable qualities, it needs to monitor the concrete strength development process. Here, the PZT materials were used as sensors to acquire data by measuring the electromechanical impedance (EMI), and then cross correlation (CC) was calculated to look at changes according to strength development. Data were measured for 28 days, and over this period concrete can gain up to 96% of its design strength. This technique is based on a single sensor. After casting concrete, the PZT material starts vibrating as an actuator to produce vibrations. At the same time, it also works as a sensor to measure the dynamic response of the structure to the vibrations. With strength development, the resonant frequencies of the EMI start changing. To estimate the strength development, a fuzzy logic tool was used to analyze the parameters, allowing for us to estimate and predict the concrete strength. For cross-checking, the estimated strength was compared with the actual strength of concrete; this was determined by examining cuboid cores taken from specimens during experiments at the 1st, 3rd, 7th, 14th, and 28th days. According to the results, this approach of strength estimation and monitoring the strength development is useful for forecasting the stability of structures.
1. Introduction
Due to the rapid development of more demanding concrete infrastructures worldwide, these structures need to be upgraded and enlarged in terms of their size, design, shape, stability, and strength. To meet these new design requirements, the strength of concrete is important; these structures rely on concrete as a construction agent due to its good compressive strength, durability, and cost efficiency [1,2]. Because concrete is a heterogeneous material, consisting of a mixture of water, cement, fine aggregates, coarse aggregates, fiber/steel, and different other admixtures, it is sensitive to the curing process that is used to gain the design strength [3]. Thus, concrete needs to be monitored precisely from right after it is poured until the 28th day to determine whether it has achieved the appropriate design strength [4,5]. Wide range of novel technologies have been adopted to construct concrete structures to decrease costs and increase safety in NPPs and other construction industry. Some admixtures have also been developed to add into the concrete mixtures to obtain higher compressive strength and durability or to improve the workability. When constructing NPPs, durable concrete with high compressive strength is needed to safely run toxic chemical processes and protect human life and the environment [6]. Thus, when casting HSC, it is necessary to monitor the strength development at an early age and determine whether concrete gains the design strength. To estimate the early-age compressive strength of concrete, different types of tests can be used. NDT (non-destructive testing) methods are usually considered to be cost effective and time-saving approaches to estimating the state of structures [7,8,9]. NDT methods for concrete include the rebound/Schmidt hammer test, ultrasonic wave propagation, and techniques that use PZT (piezoelectric) materials [5,10,11,12,13,14]. Due to the accuracy of its result, the strength estimation of concrete using EMI has been widely studied [13,14,15,16,17,18,19]. In our work, experiments are conducted on the basis of NDT by analyzing the dynamic response of structures to vibrations using a PZT material sensor and analyzing EMI results [20] with fuzzy logic. In this study, NDT based a single-sensor technique is used to obtain data from concrete specimens. Here, the PZT material performs as an actuator and a sensor simultaneously. After concrete casting, the PZT sample actuates (actuator mode) to produce vibrations and then receives (sensor mode) the structure’s dynamic response to ultrasonic waves and vibration [21]. Moreover, after acquisition of the data, the cross correlation (CC) was calculated and the EMI was analyzed as a function of the curing time of concrete using a fuzzy logic simulation. The fuzzy logic simulation tool in MATLAB was used to simulate the data in order to obtain clear results. The required rules of fuzzy logic were set according to strength estimation, and then the input of data was run to obtain results. After this process, based on the growth pattern of the frequencies of ultrasonic waves from the EMI and fuzzy logic-treated data, the curves for strength prediction were established; this gave us a flow line that could be used to predict the concrete compressive strength for 28 days. When these simulation data were compared with the actual strength results of concrete, which were observed during 28 days of curing by testing cylindrical cores taken from specimens, the results were almost similar.
Our proposed NDT method to estimate the strength of concrete by analyzing the EMI using fuzzy logic saves time and provides a secure and satisfactory procedure to monitor the structural health of concrete. This method can be modified in the future by using other related parameters.
2. Concrete Strength Estimation Using a PZT Sensor
2.1. Piezoelectric Sensor
Piezoelectric materials can convert the mechanical energy into electric signals and vice versa [21,22]. Thus, PZT materials can be used and embedded in concrete to induce and detect wave propagation and vibrations [5,17,18,23]. Through different approaches, the piezoelectric sensors can use to estimate the strength of concrete. By creating ultrasonic waves and observe the dynamic effects of the structure to these waves to analyze the EMI of excitation [5,16]. The ultrasonic wave response and EMI can be acquired due to the unique properties of PZT [13].
The material electrical behavior is linear:
Here, E is the electric field strength and D is the displacement of the electric charge density; the factor of proportionality relating the electric displacement and electric field strength is defined as the medium’s dielectric constant. Additionally, ε is the permittivity of a free body. Equation (1) also shows the tensor of the displacement of the electric charge density.
Additionally, according to Hook’s law:
Combining Equations (1) and (2) yields:
Here, the strain is shown by S, similarly represents the compliance under a constant electrical field, is the dielectric constant of PZT under a constant stress, and T is the stress. The combined equation can cover the strain and electric field strength with the other factors.
As mentioned earlier, PZT can interconvert electrical and mechanical energies [14,22]. Thus, PZT can be used as an actuator and a sensor [15]. Here, PZT was embedded in concrete and was used to create vibrations and produce guided ultrasonic waves; it also worked as a sensor to sense the EMI and dynamic response of the host structure [5,15,17]. For data acquisition, the sensor had to be installed before pouring concrete. To secure the sensor and prevent it from being damaged during concrete casting, a protection cover of Styrofoam was used, as shown in Figure 1.
The size and properties of PZT used in our experiments are shown below in Table 1.
In the table above, the terms d33 and d31 represent the piezoelectric charge constant while k33 and k31 represent the piezoelectric coupling factor.
2.2. Methodology
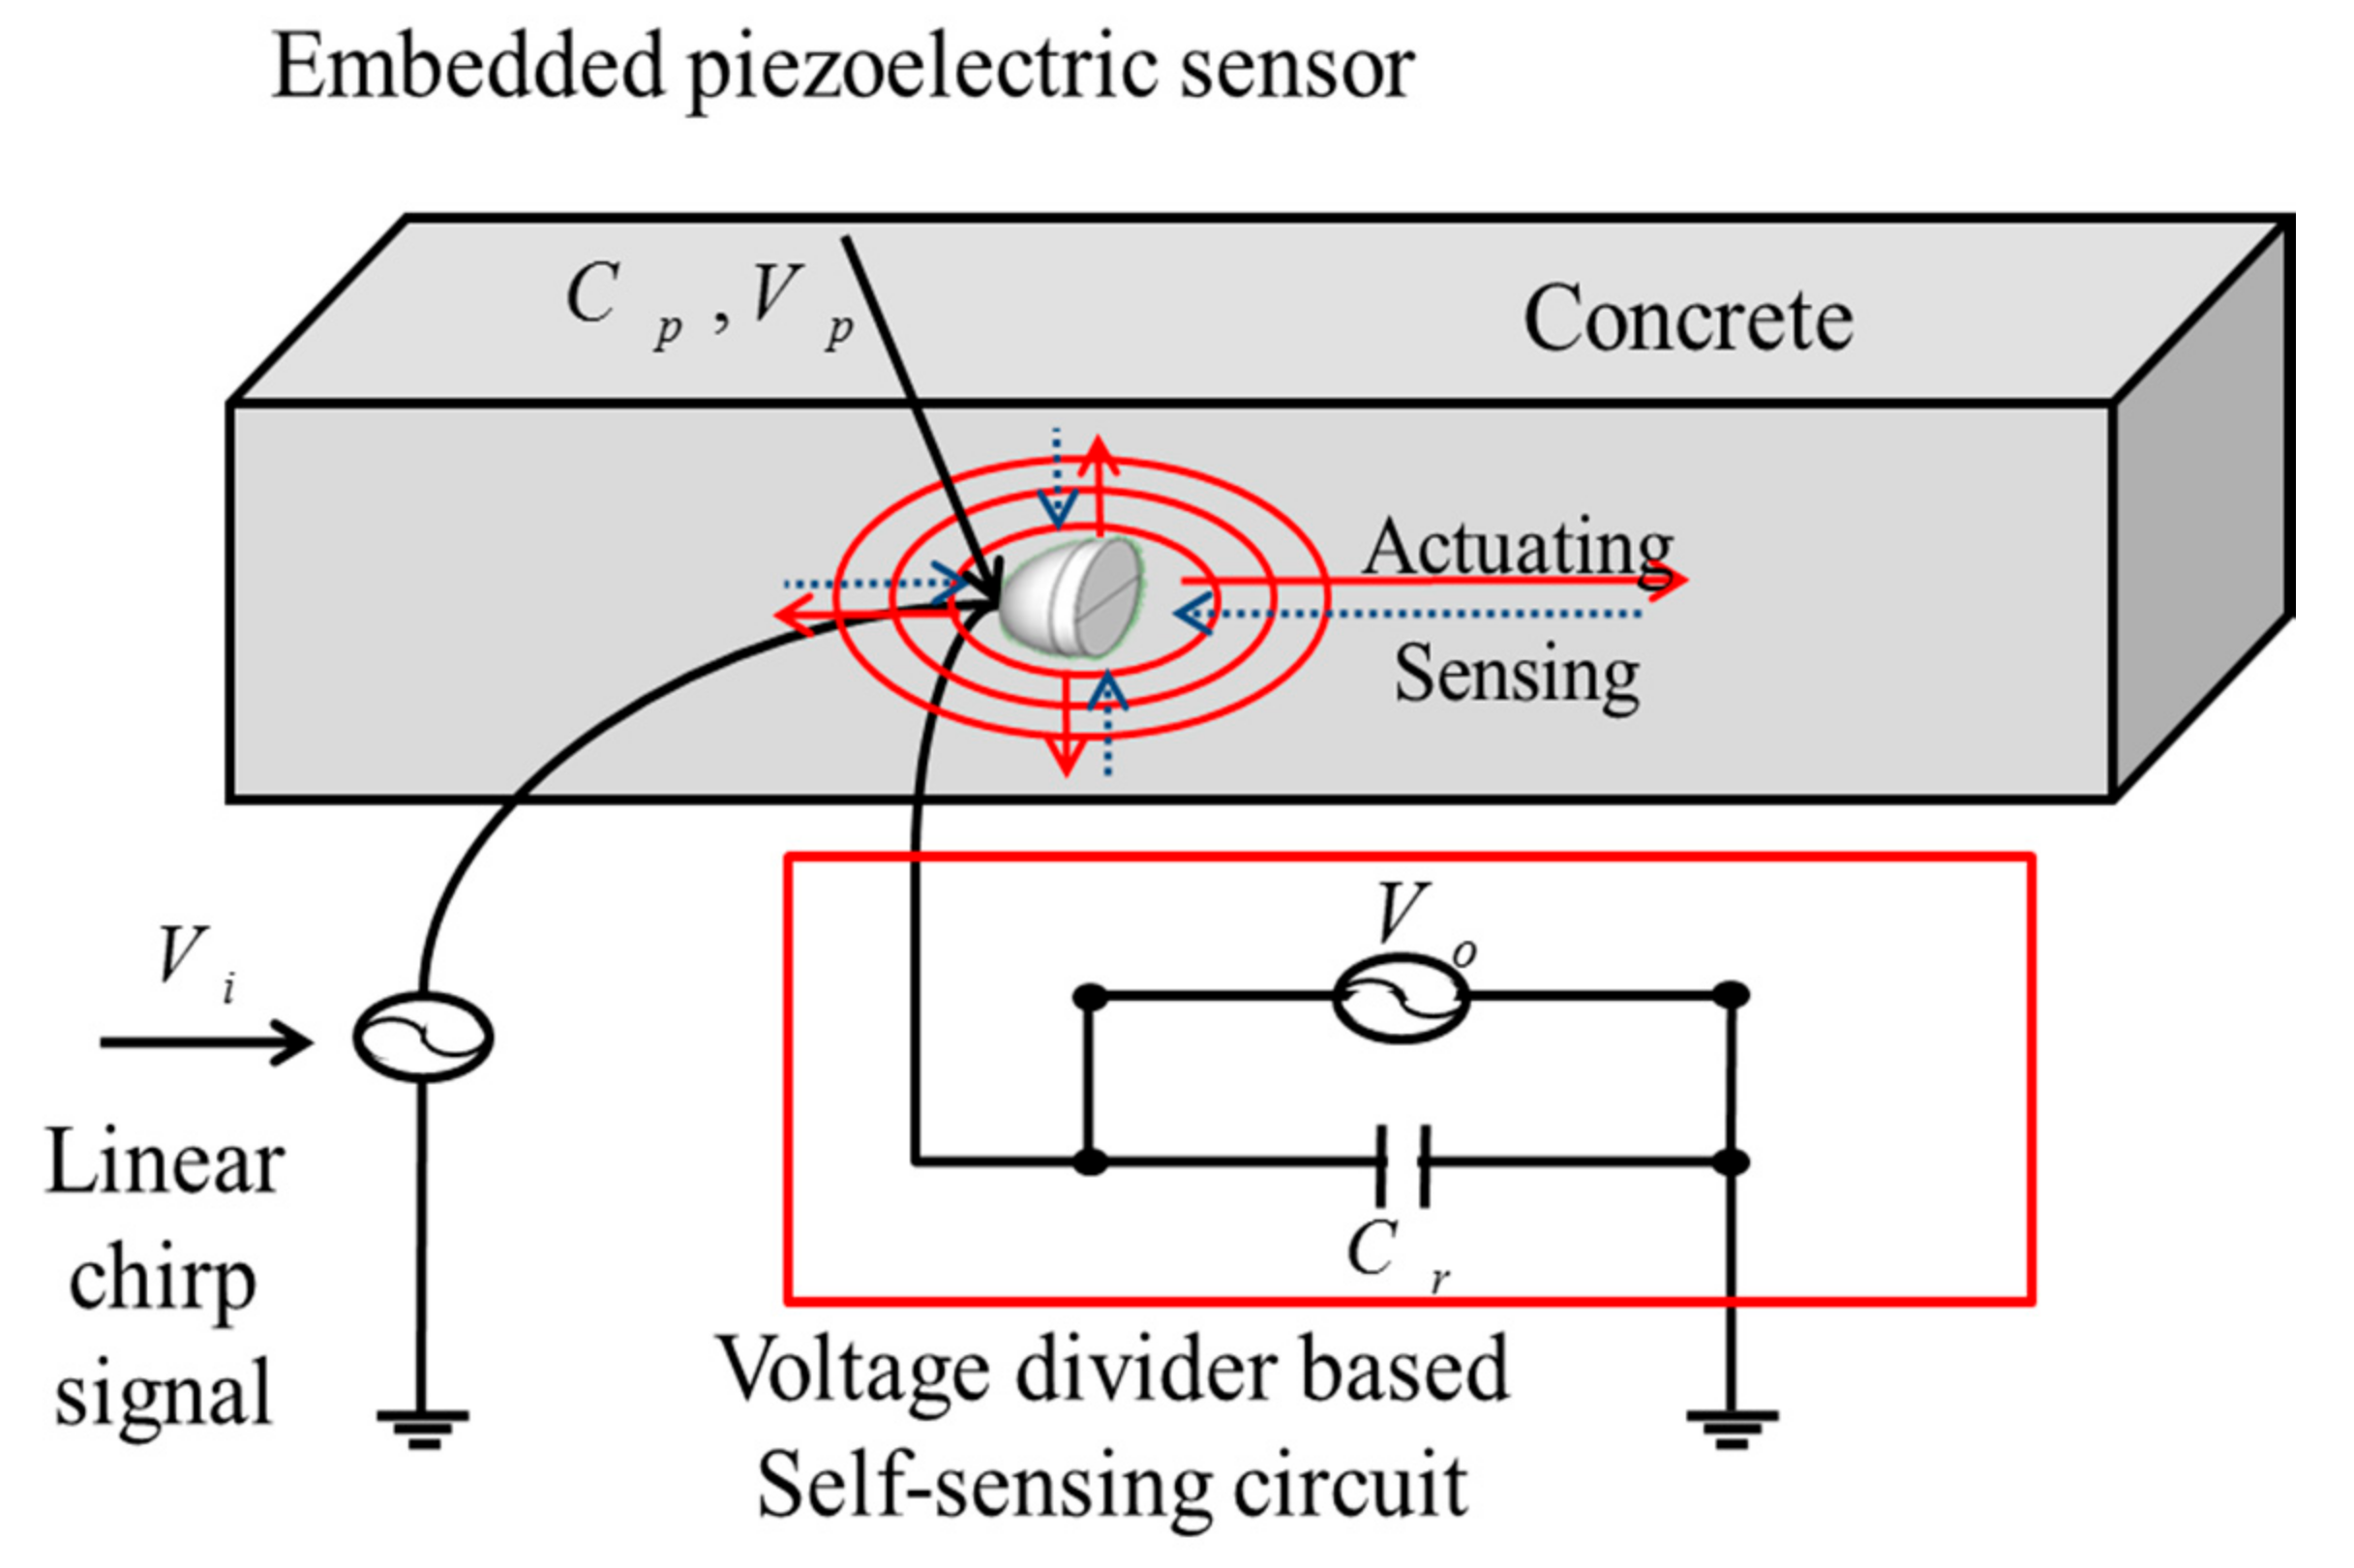
In this study, we estimated the concrete strength from the initial time of casting to the curing age of 28 days; this was done by analyzing the EMI as a function of curing and cross correlation. In this procedure, the dynamic response of ultrasonic waves was measured by the PZT sensor; the impedance data depend on the time and frequency changes of the vibrations and ultrasonic waves. To analyze these data precisely, a fuzzy logic tool was used to simplify the data and show the EMI of signals flow; this allows for us to predict the concrete strength. Fuzzy logic coding was created in MATLAB based on several rules and parameters to simulate and categorize the EMI. Figure 2 shows some systematic details of the experiment with regard to the sensor, placement of sensor, process, and data acquisition. Here, C represents the capacitance and V indicates the input and output voltages.
Equation (4) was used to derive 1-CC values for the data. Additionally, the 1-CC term (i.e., the cross-correlation index) was calculated to provide information about the vibrations of the signals.
Here, Re (z0) represents the real part of the impedance function at the baseline and Re (zi) is the real part of the impedance at the i-th hour for each measured data point.
3. Experimental Study
3.1. Specimen Size and Embedded Sensor
For this study, experiments were conducted on special HSC specimens that were designed for use in nuclear power plants. When concrete with a compressive strength of 64.5 MPa was used to construct of the Civaux-2 NPP in France, decrease in the temperature were observed to cut off 25% [24]. With reference of this NPP concrete these specimens, processed at 5 °C, 20 °C, and 40 °C, showed strengths of 49.56, 60.98, and 70.02 MPa, respectively. The compressive strength of this concrete was expected to be 55.16 MPa. After conducting experiments, the estimated strength was 49.56 MPa, 60.98, and 70.02 MPa for three different samples. These three samples were placed in different temperature zones of 5 °C, 20 °C, and 40 °C in order to measure the strength under various weather conditions. PZT materials were used as sensors and inserted into experimental specimens of concrete. With the changes in mechanical strength and elastic stiffness, structures can dynamically response well to vibrations and ultrasonic waves [3].
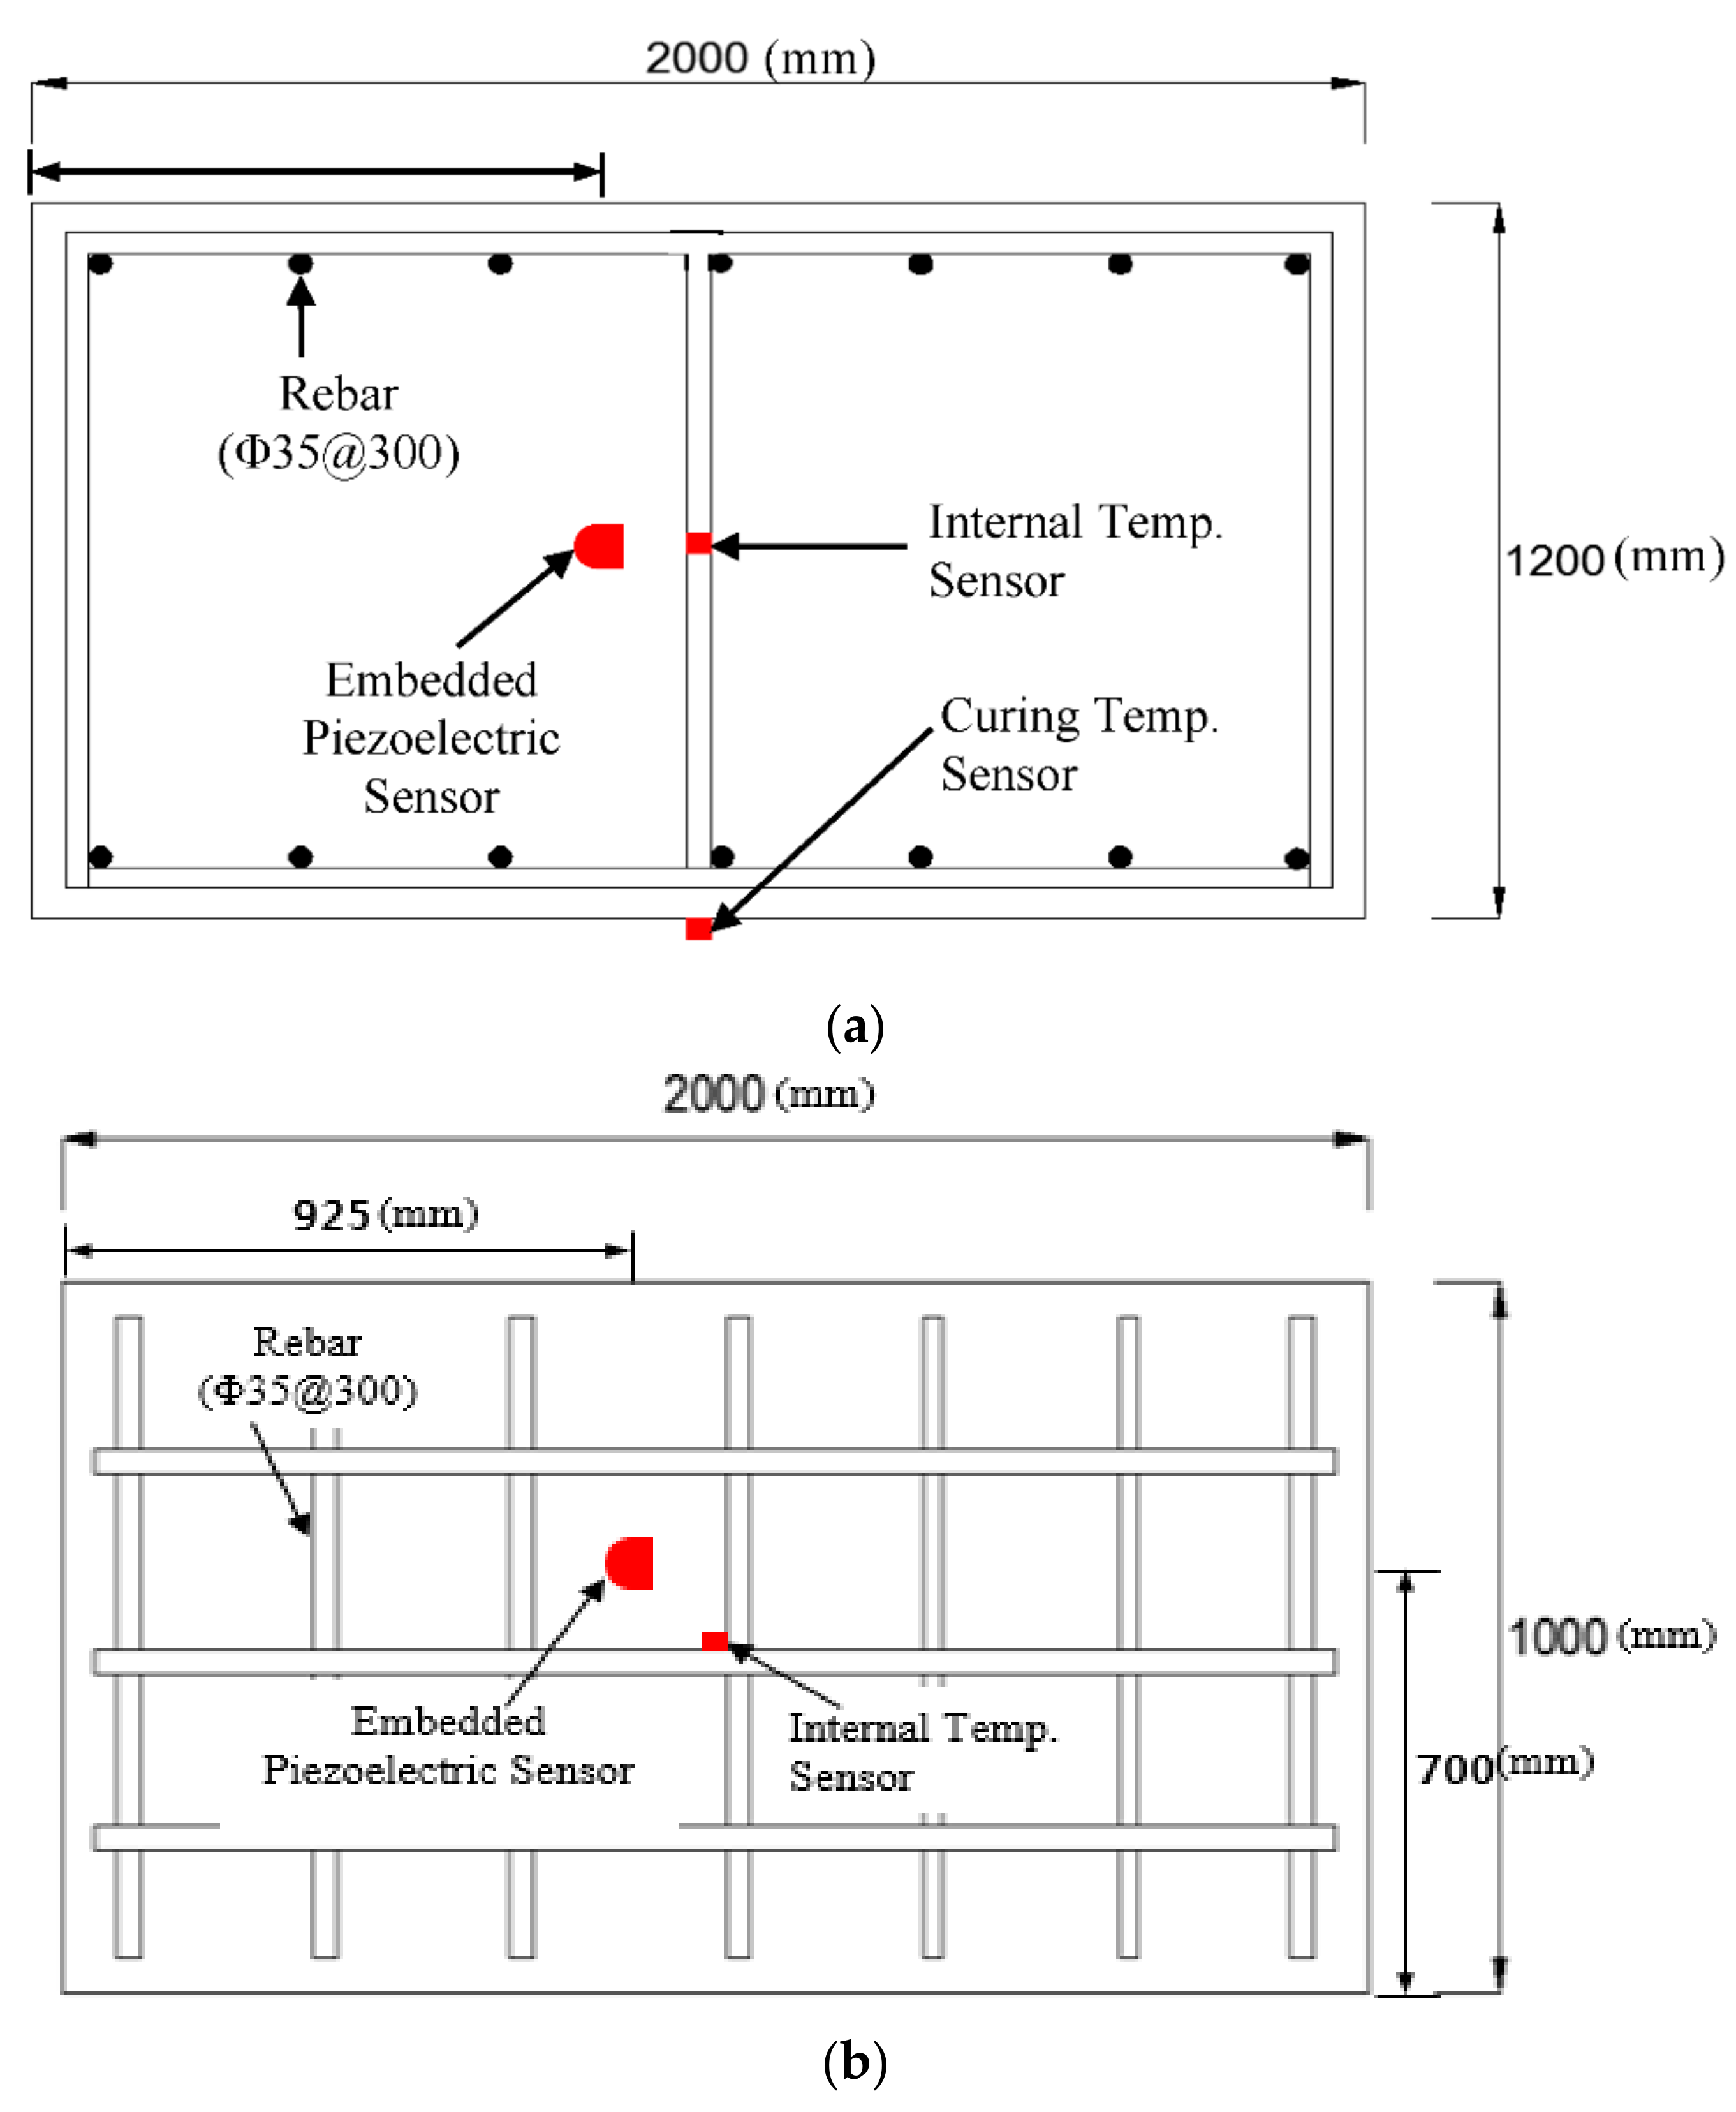
The size of each specimen was kept at 1200 × 2000 × 1000 mm3, as shown in Figure 3a,b. Though the concrete specimens were small but for real time concrete strength estimation of NPP, it was necessary to use the actual size of steel reinforcement bars. For this purpose, the bar of 35 mm was used as reinforcement in the experimented samples.
The experimented concrete was specially designed for NPPs, as the toxic chemical reaction and explosions take place in NPP, so some qualities of this special concrete must be highly selective for the reliable operations of NPP [24]. The compressive strength, mixing ratio, durability, density, resistance to weather, wear resistance, and permeability are the key factors to select for the HSC of NPP. Strength can be used as per requirement; normal, moderate, and high strength; similarly, density can be low, medium, and high. To gain the desired properties, some admixtures were added, the ratio of this HSC mix is given below in Table 2. Here, FA denotes fly ash, GGBS denotes ground granulated blast-furnace slag, SF denotes silica fume, AD denotes admixture, and AE denotes air entraining.
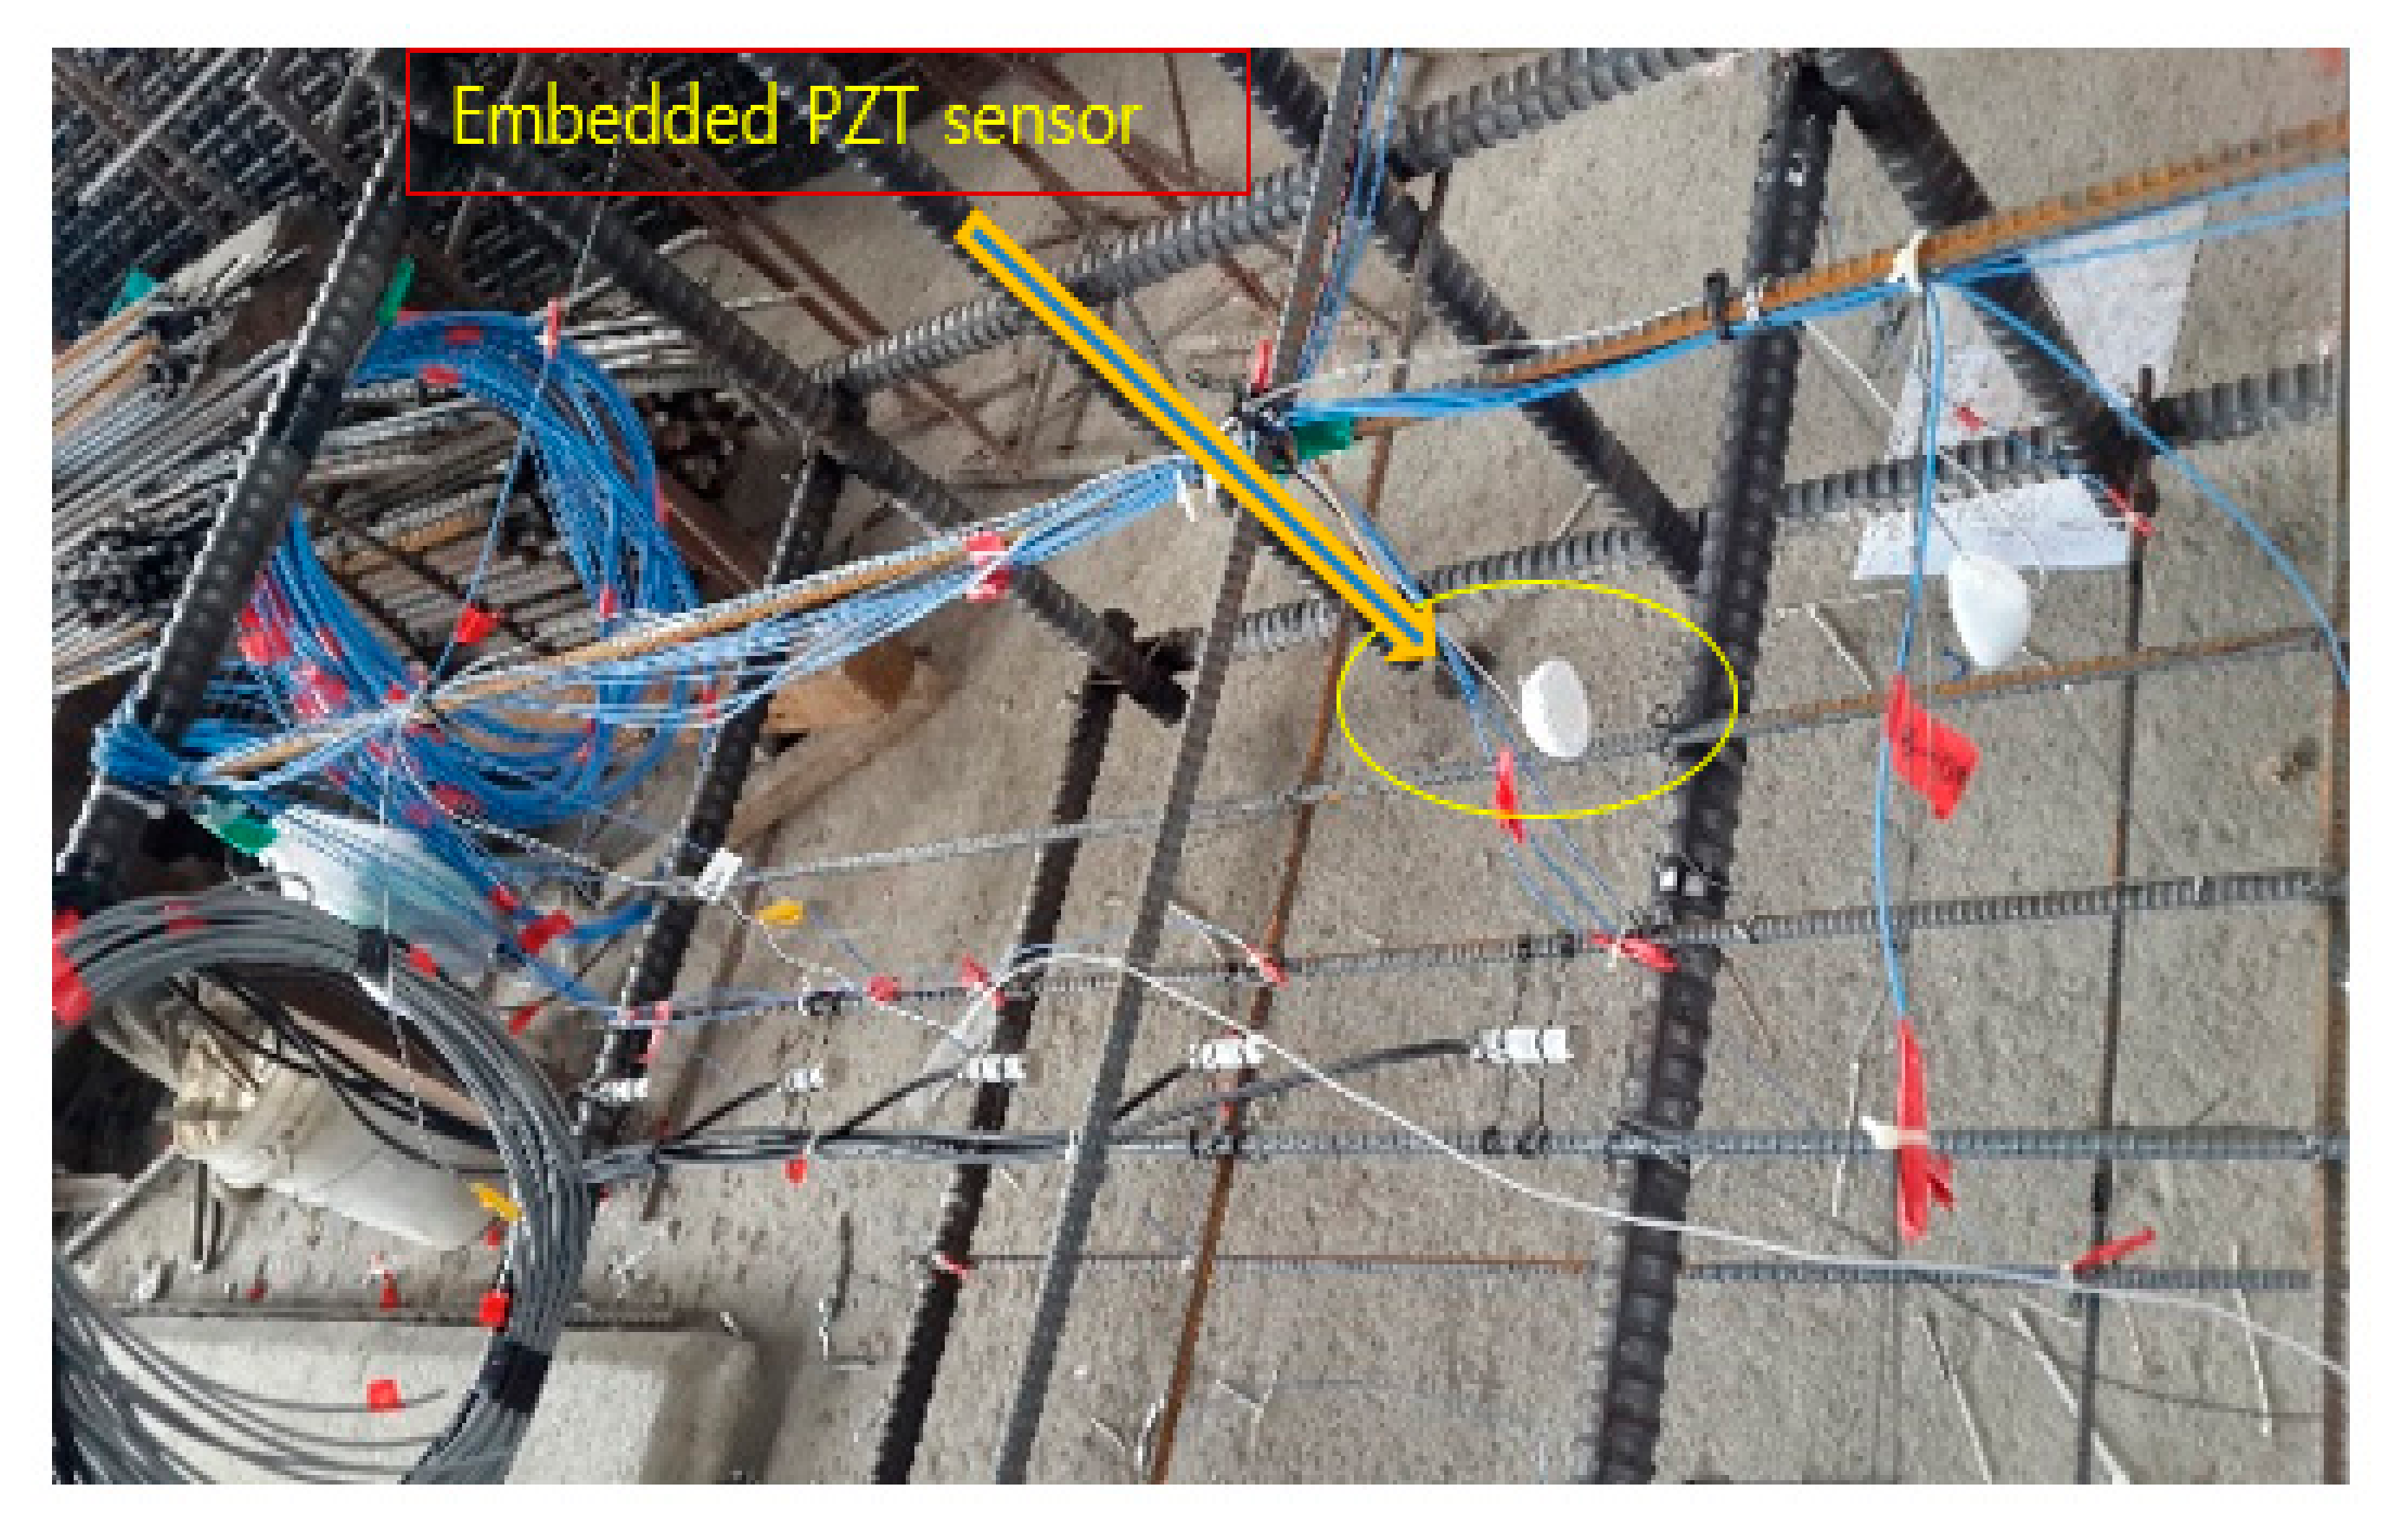
The experimental setup was prepared before casting concrete. After pouring concrete, data were acquired by a single PZT sensor in each specimen; these sensors were already embedded in the specimens before casting concrete. Using the sensors embedded in the concrete specimens, the dynamic responses of the structures to the ultrasonic waves and vibrations created by actuators were measured every hour for 28 days. At the same time, the internal temperature of the concrete was measured. The specimens were also simultaneously examined via compressive strength testing using cylinder cores taken from the main concrete at 1st, 3rd, 7th 14th, and 28th days. Figure 4 shows some details of the sensor placement, spacing, and arrangement, which were set up before casting concrete.
3.2. Results of Ultrasonic Signals and EMI
Figure 5a–c show the data measured by sensors for three specimens. The data shown is for the 1st, 3rd, 7th, 14th, and 28th days. The resonant frequency is proportional to the stiffness of the concrete [3]. Thus, the velocity is observed to increase with longer curing times. We also observed that the velocity changes frequently during the earlier stages of curing.
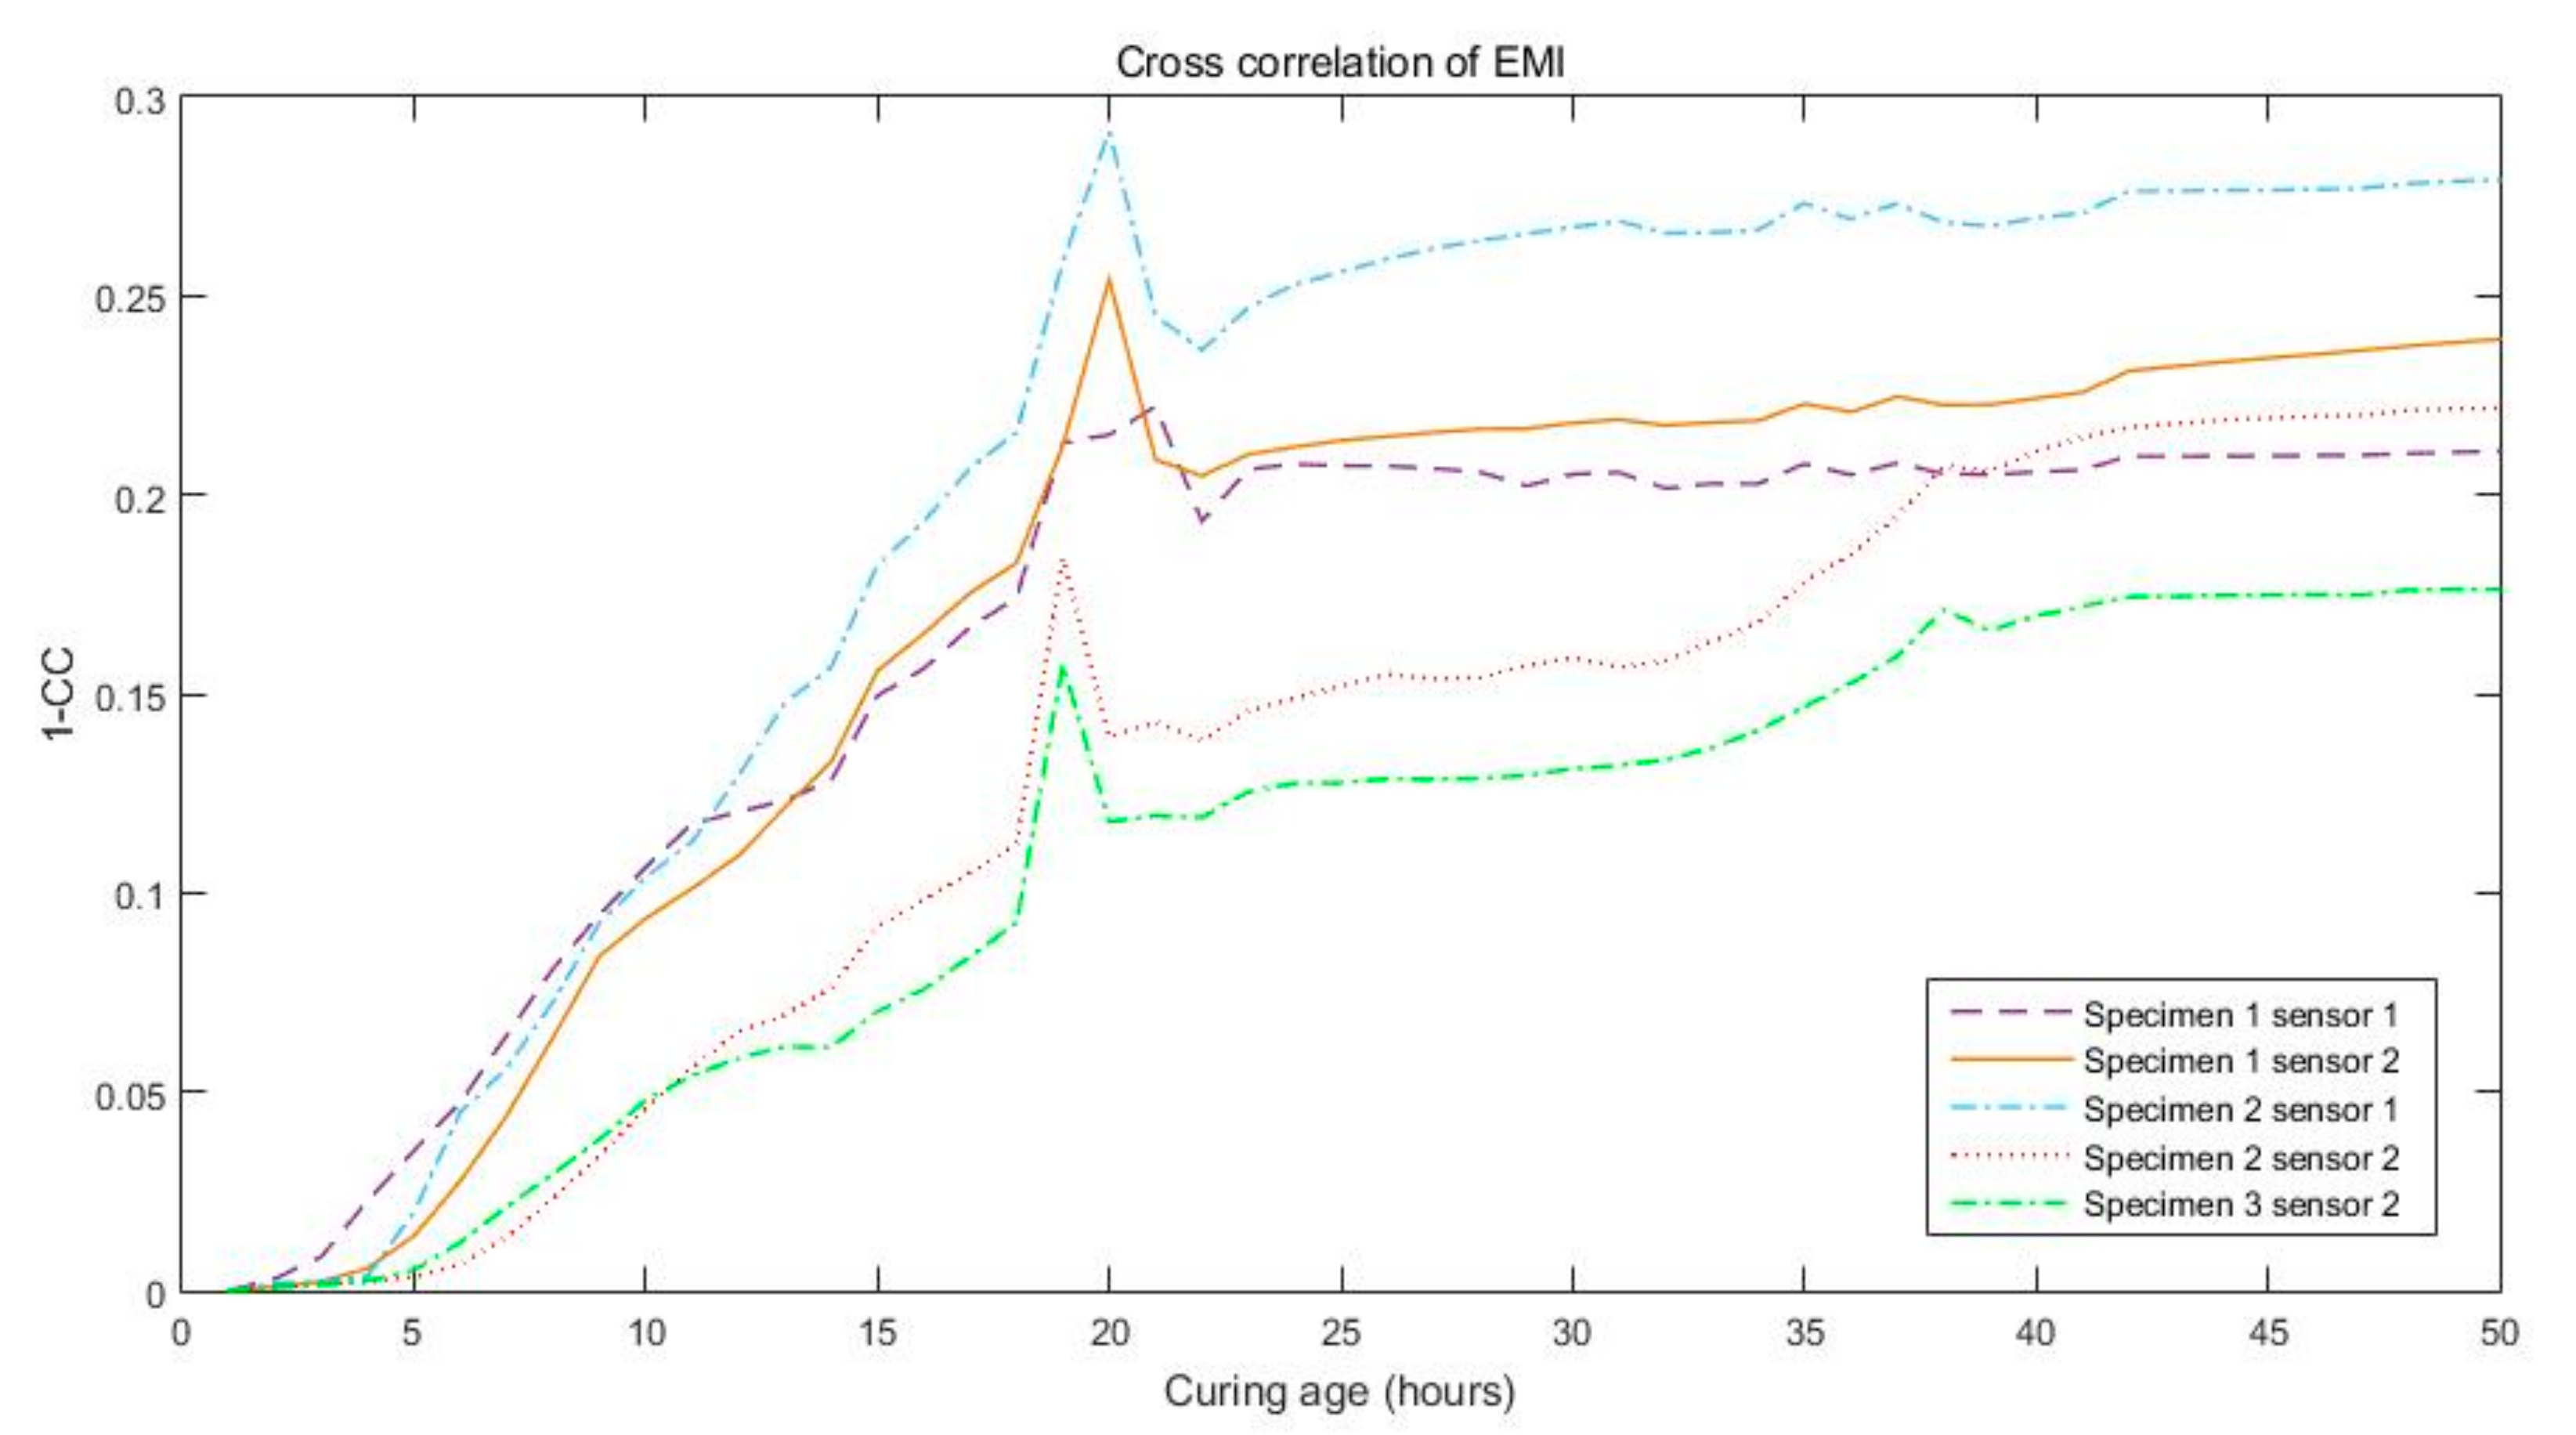
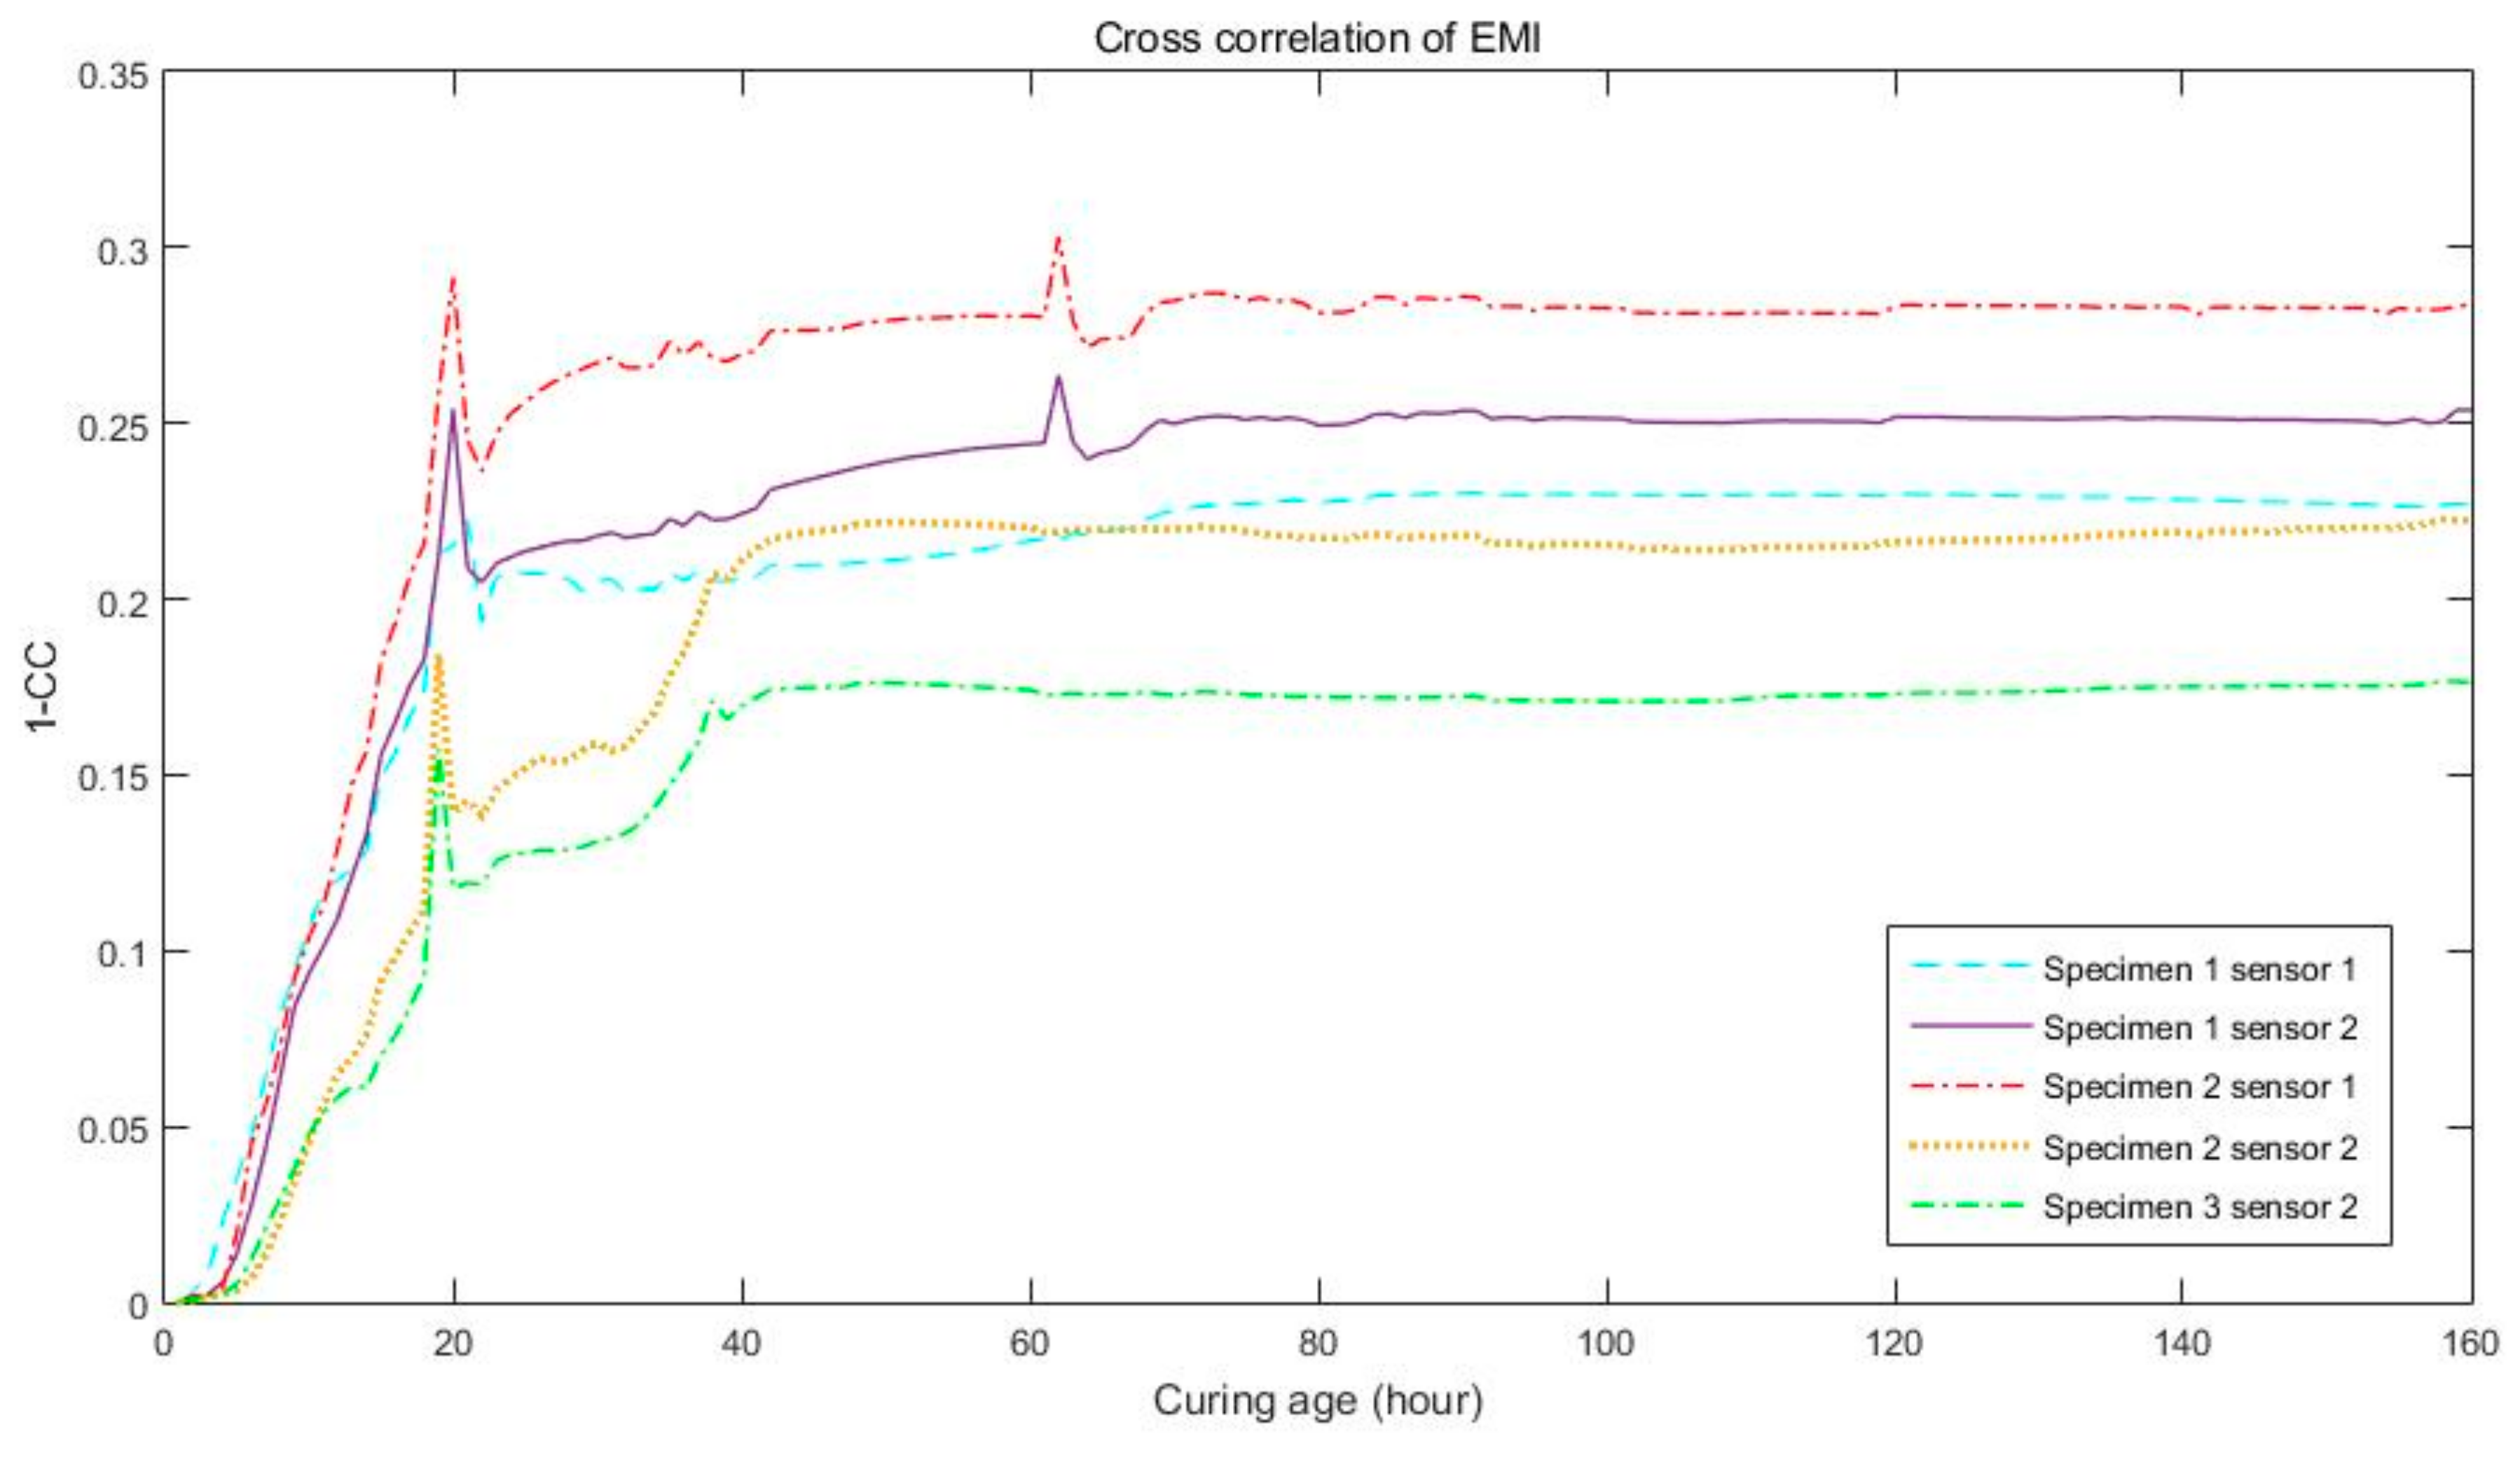
These data were measured in specimens after cast concrete was aged for between one hour and 28 days. The Figure 6 and Figure 7 shown below depict the cross correlation of impedance data for five different channels over a curing time of 48 h. It can be seen that the amplitude is almost zero after the first hour. After that, until the 18th hour of aging, the amplitude changes and grows rapidly. This indicates a rapid change in the strength behavior. After the 20th hour, the amplitude’s rate of change becomes slower.
The following diagram shows data for seven days of aging. From this, we can see that the amplitude follows a nearly-continuous rising flow after 72 h. Thus, after three days, the strength-gaining progress is steady and continuous.
4. Fuzzy Logic Coding and Results
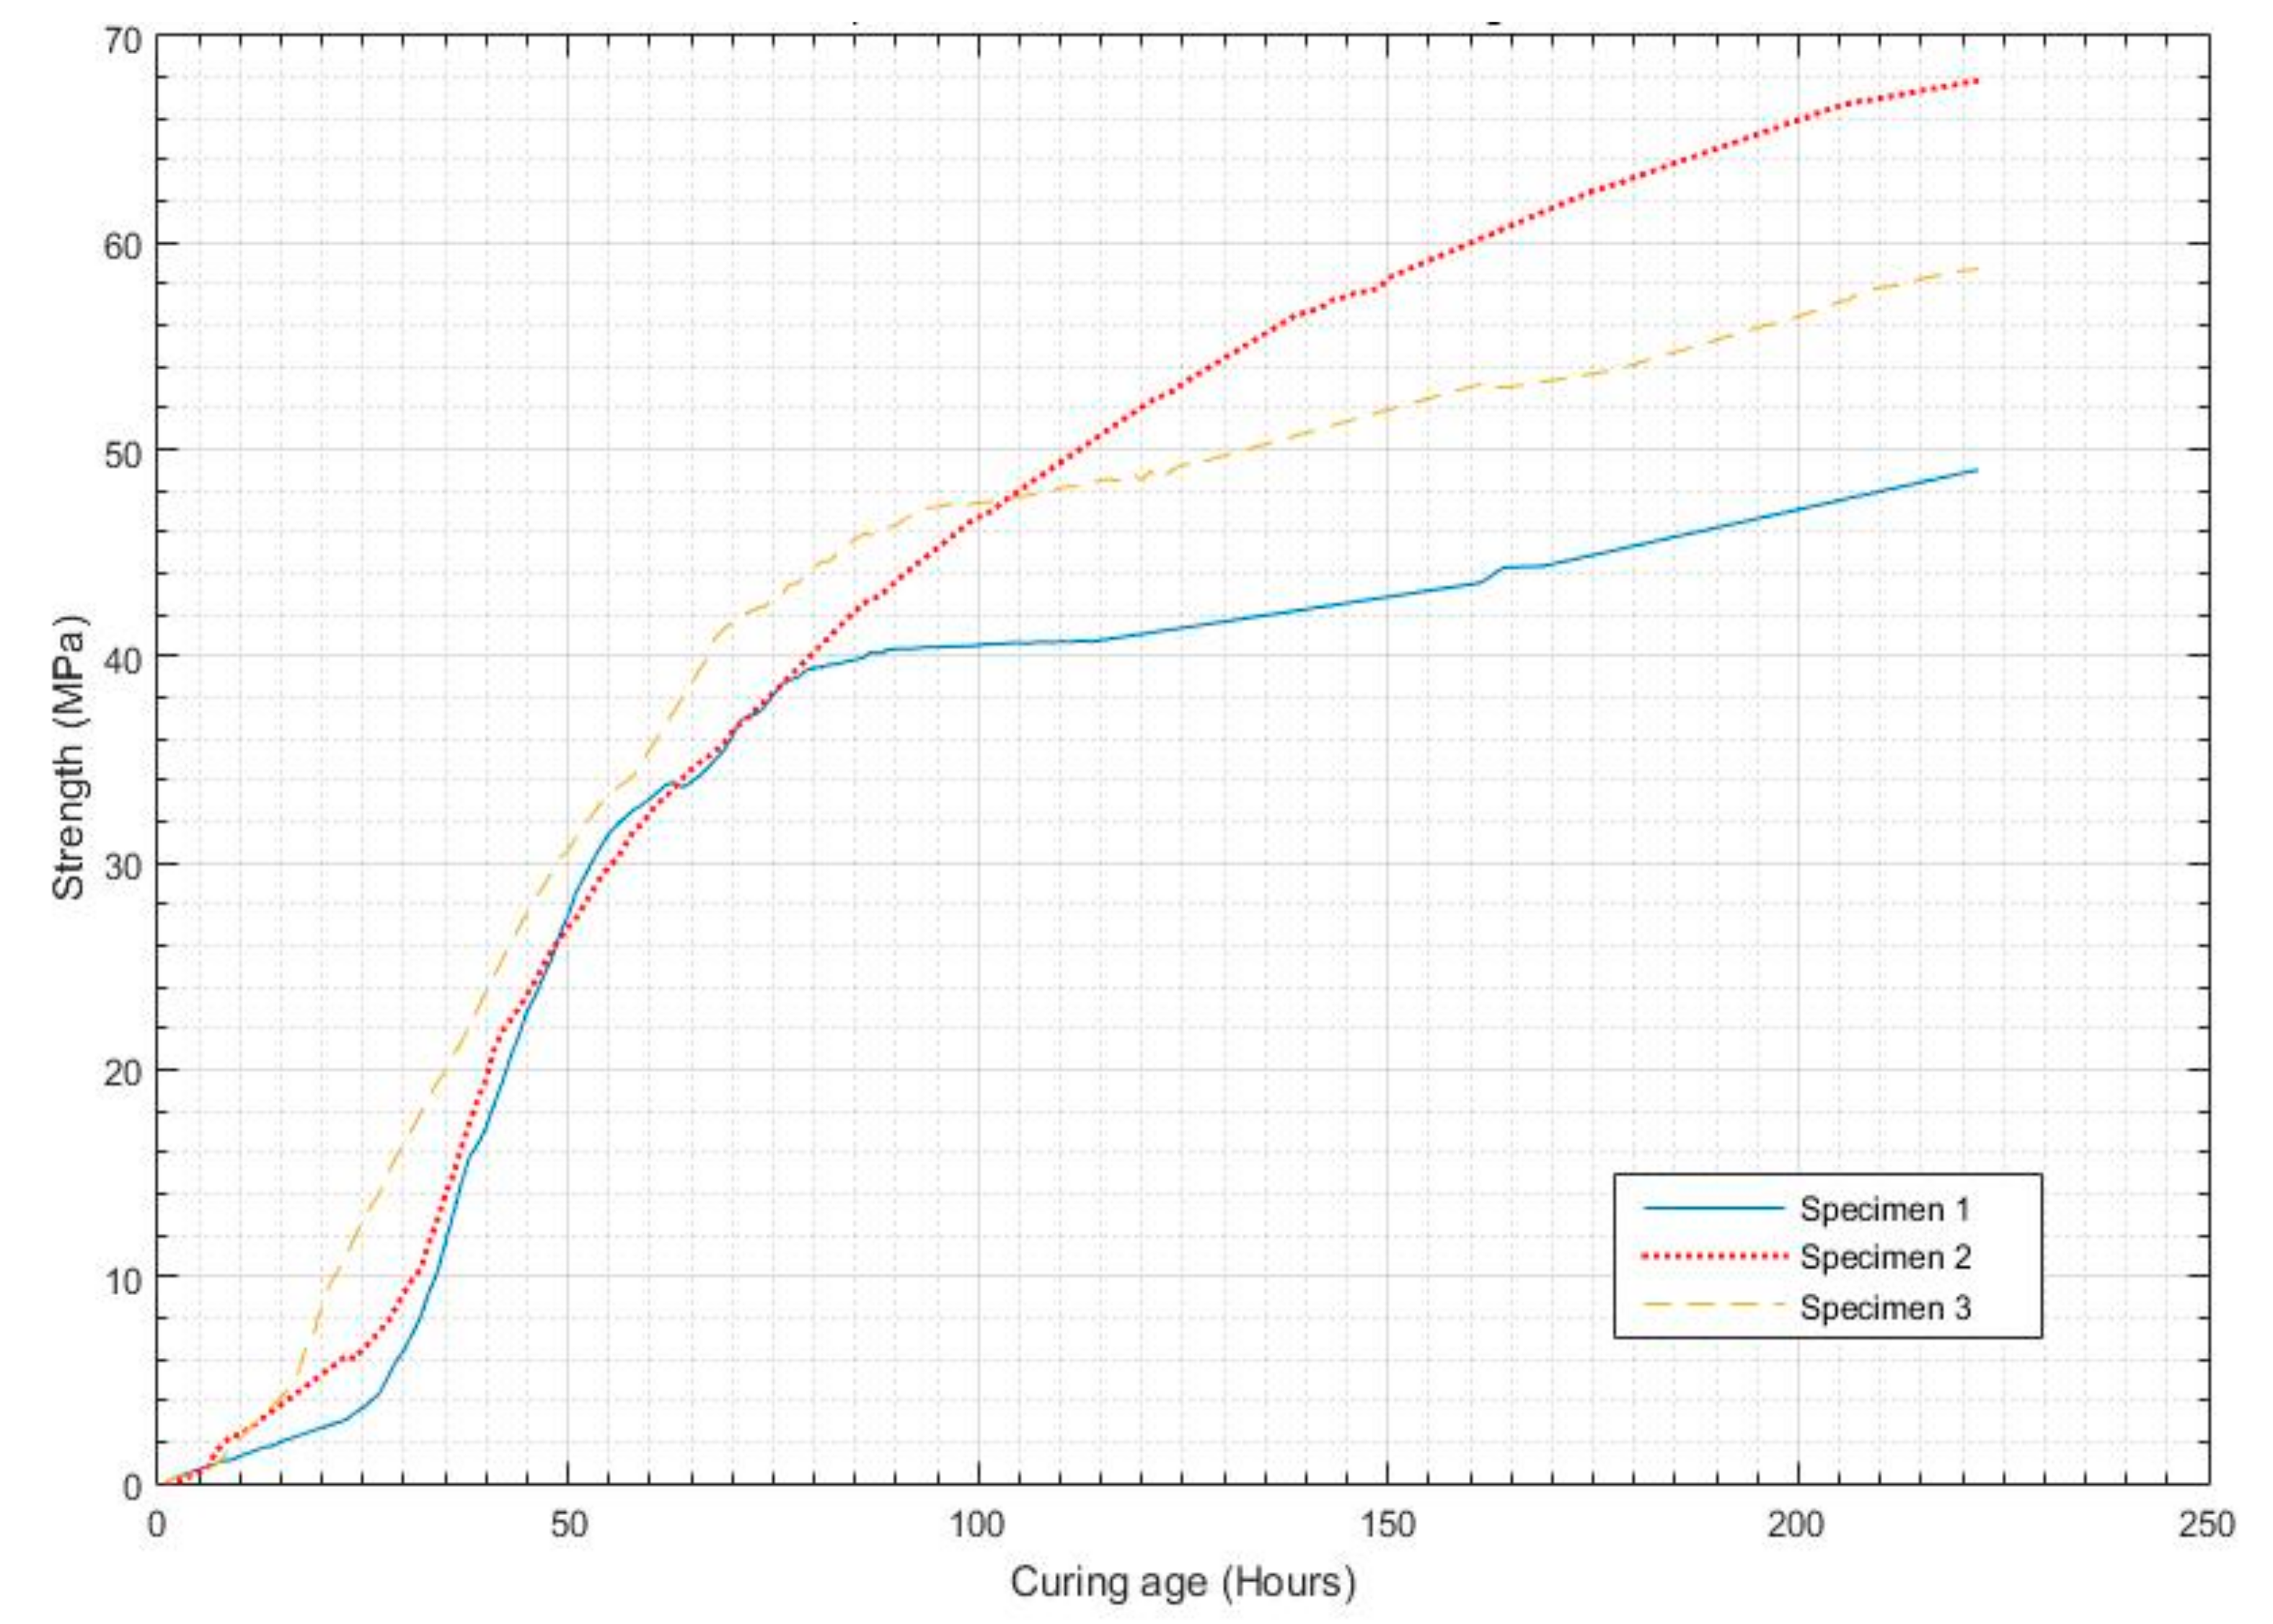
To model the fuzzy logic MATLAB codes, rules were set according to the parameters that were used. The parameters of EMI, cross correlation, and curing time were used to analyze the regular pattern of concrete strength development. Here, the temperature effects on strength developments can be observed from the graph, as the specimen 1 was placed in 5 °C, so the very initial strength growth was observed slowly, the specimen 2 was placed in 20 °C, so the initial growth was comparatively faster than the 1st specimen, similarly for specimen 3, the growth was faster in initial hours. Figure 8 show the strength development patterns for specimens 1, 2, and 3.
In Figure 8, the solid line shows the data of specimen 1; this experiment was conducted at 5 °C. It can be seen that the concrete strength establishment started late in the first hour. Continuous and steady growth was observed from this point up to a curing time of 25 or 26 h. However, after 26 h, the strength-gaining process became more rapid; this continued until 60 h, enabling the concrete to develop the majority of its strength. In the third day, growth was observed to slow and become less steady. After the 80th hour of curing, the strengthening process was observed to slow further and remain constant until the 28th day of aging; this is the duration in which a concrete gain its estimated strength.
The data collected from specimen 2 are shown by dotted line in Figure 8. Here, the graph shows that the concrete strength establishment was started similarly to specimen 1. In the earlier hours, it was observed to be relatively slow when compared to the curing of the second day. After 28 and 29 h of curing (on the second day), the strength-gaining process appears to begin, rising rapidly until the end of the second day. After the second day, the strength development was slower, and the same ratio was observed until 142 h of curing. After this point, the strength development slowed further and was constant until the 28th day of curing.
Similarly, the results for specimen 3 are presented by dashed line in Figure 8. Here, the data indicate that the strength development was started in the initial ages, between the first and second hours; this had been happened because this specimen was placed at a temperature of 40 °C. The graph further shows that the strength development was fairly slow until the eighth or 10th hours; after 10 h the strength was observed to rise a bit faster until the end of the first day. On the second day, the strength grew faster until the 45th or 46th hour of curing, and then on the third day it was observed to be slower when compared to the second day (but still rapid). After the 115th hour, it became constant and the strength development growth was slower until the 28th day of curing.
5. Discussion
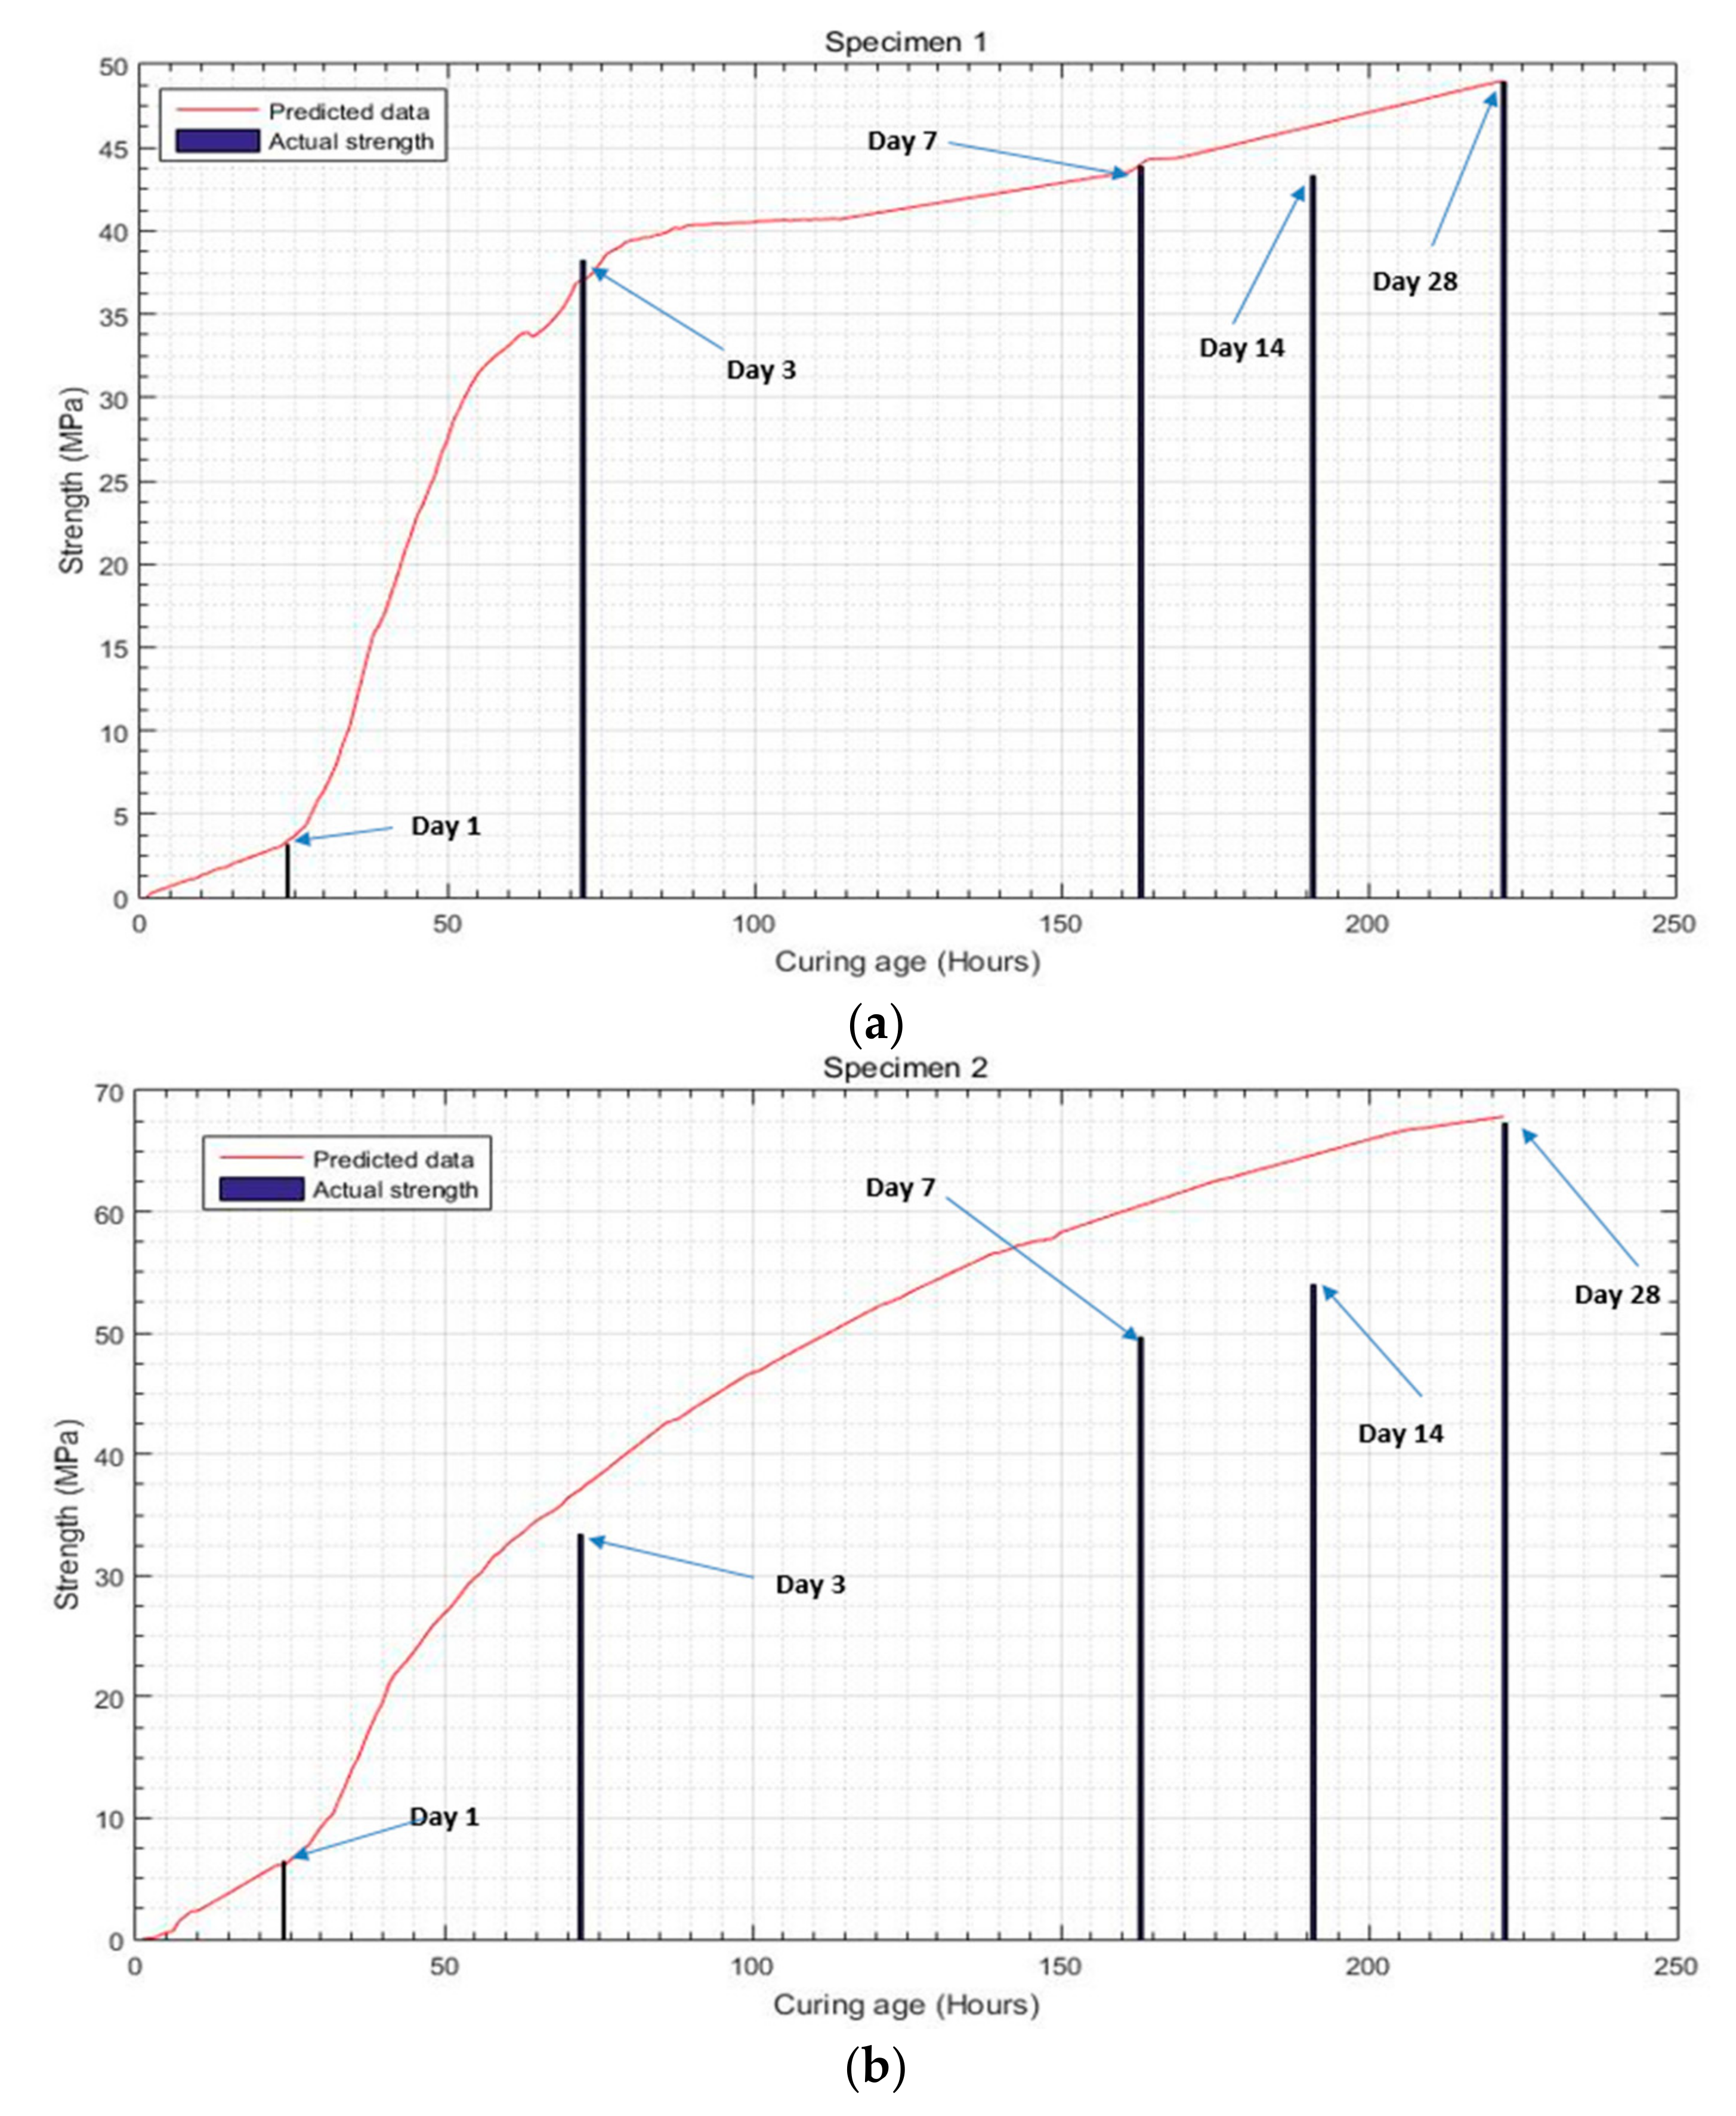
In this section, we discuss and make comparisons between the actual strength and predicted strength of concrete. The actual strength was estimated from test cores that were extracted during experiments, and the predicted strength of concrete was predicted based on data analyzed using fuzzy logic. Figure 9a–c shows the comparison between the actual and predicted strengths of concrete samples. The actual strength values are represented by bars and correspond to the 1st, 3rd, 7th, 14th, and 28th days.
In Figure 9a, specimen 1 shows matching actual and predicted compressive strength results on the first day; both of the values were 3.4 MPa. After that, the actual strength on the third day (38.2 MPa) was higher than the predicted strength (37.1 MPa); this difference may be due to signal fluctuation. Similarly, the predicted and actual strengths on the seventh day were very similar; after slight variation, they were observed to almost match at the end of the 28th day. This plot shows 92% similarity between the strength development patterns of the actual and forecasted compressive strengths of concrete.
The data for specimen 2, in Figure 9b, show similar strength development for the actual strength and estimated strength until the second day of curing. After that point, the predicted strength values were observed to be higher than the actual values until the 20th day of concrete aging. This may be due to signal fluctuations and temperature effects. After 28 days, the results are quite similar, with only a slight difference of 0.39 MPa; the actual strength was 67.26 MPa and the predicted result was 67.65 MPa.
Figure 9c shows a smoother plot. The data from specimen 3 indicate that the predicted and actual strengths of concrete do not match closely at the first day. This is due to the fact that the specimen was placed at a high temperature of 40 °C. Thus, the strength development started quickly. The actual strength after 24 h was observed to be 6 MPa, while the predicted strength was 11.09 MPa. After curing for seven days, the results are much more closely matched; this similarity was maintained through the 28th day, where the observed core strength was 59.23 MPa and the strength predicted based on the fuzzy logic simulated data was 58.70 MPa.
6. Conclusions
In this study, experiments were performed to investigate different aspects of concrete, including its heterogeneous mixture, to determine how these features are related to concrete strength development. For the NPP concrete, the admixtures and high strength makes it more important to observe and monitor all of the desired qualities for which this HSC was designed for this purpose of monitoring, NDT is typically used to determine the strength, stability, and health of a structure. This research has explained the process of early age strength estimation of HSC for NPP structure. The concrete strength was estimated from early age, until the 28th day of curing. In this research, the EMI signals and curing age (time) are the key parameters that were investigated. After collecting ultrasonic wave responses with PZT sensors, the cross correlation was calculated. Then, the EMI and curing age were analyzed through fuzzy logic MATLAB coding. That cleared the forecasted result of NPP structure designed concrete. Our forecasted results for the strength development of concrete were observed to be similar with actual test results. So, this study may help engineers to better understand the variations that occur during strength development and monitor the strength of concrete. Our proposed NDT, to forecast the strength of concrete during early aging, is a useful method that can be implemented easily to quickly ensure structure safety. This method can be developed further by using other parameters and may overcome some of the strength and stability issues that are encountered during the early stages of curing in concrete. This procedure can also be used for the long-term maintenance and health monitoring of concrete structures.
Acknowledgements
This research was supported by a National Research Foundation of Korea (NRF) grant funded by the Korean government (MSIP) (Nos. NRF-2017R1A2B3007607, NRF-2017R1D1A1B03033399) and the Korea Agency for Infrastructure Technology Advancement under the Ministry of Land, Infrastructure and Transport of the Korean government. (Project Number: 13CCTI-T01). We are thankful to Sungkyunkwan University for sharing their research environment and wish to offer special thanks to Hameedullah Tareen and family for providing moral support during this research.
Author Contributions
Shang-Ki Choi, Junkyeong Kim and Seunghee Park designed the experiments; Najeebulla Tareen and Junkyeong Kim performed the experiments; Najeebullah Tareen, Seunghee Park and Innjoon Park analyzed data and wrote the paper.
Conflicts of Interest
The authors declare no conflict of interest.
Abbreviations
| NDT | Non-destructive testing |
| NPP | Nuclear power plant |
| EMI | Electromechanical impedance |
| HSC | High-strength concrete |
| CC | Cross correlation |
| PZT | Piezoelectric materials |
| MPa | Megapascal |
References
- Akindahunsi, A.A.; Uzoegbo, H.C. Strength and Durability Properties of concrete with starch Admixture. Int. J. Concr. Mater. 2015, 9, 323–335. [Google Scholar] [CrossRef]
- Kim, H.S.; Lee, S.H.; Moon, H.Y. Strength properties and durability aspects of high strength concrete using Korean metakaolin. Constr. Build. Mater. 2007, 21, 1229–1237. [Google Scholar] [CrossRef]
- Mirmiran, A.; Wei, Y. Damage assessment of FRP-Encased concrete using ultrasonic pulse velocity. J. Eng. Mech. 2001, 127, 126–135. [Google Scholar] [CrossRef]
- Rizzo, P.; Ni, X.; Nassiri, S.; Vandenbossche, J. A solitary wave-based sensor to monitor the setting of fresh concrete. Sensors 2014, 14, 12568–12584. [Google Scholar] [CrossRef] [PubMed] [Green Version]
- Gu, H.; Song, G.; Dhonde, H.; Mo, Y.; Yan, S. Concrete early-age strength monitoring using embedded piezoelectric transduces. Smart Mater. Struct. 2006, 15, 1837. [Google Scholar] [CrossRef]
- Phung, Q.T.; Maes, N.; Jacques, D. Current concerns on durability of concrete used in Nuclear Power Plants and Radioactive wasted repositories. In Proceedings of the 4th Congress International de Geotechnique-Ouvrages-Structures (CIGOS 2017), Ho Chi Minh City, Vietnam, 26–27 October 2017; Springer: Singapore, 2017; Volume 8. [Google Scholar]
- Kim, J.; Kim, J.; Shin, K.J.; Lee, H.; Park, S. ANN-based tensile force estimation for pre-stressed tendons of PSC girders using FBG/EM hybrid sensing. Insight 2017, 59, 544–552. [Google Scholar] [CrossRef]
- Lee, C.; Kim, J.; Park, S.; Kim, D.H. Advanced Fatigue Crack Detection using Nonlinear Self-Sensing Impedance Technique for Automated NDE of Metallic Structures. Res. Nondestruct. Eval. 2015, 26, 107–121. [Google Scholar] [CrossRef]
- Kim, J.; Kim, J.W.; Lee, C.; Park, S. Development of embedded EM sensors for estimating tensile forces of PSC girder bridges. Sensors 2017, 17, 1989. [Google Scholar] [CrossRef] [PubMed]
- Park, S.; Inman, J.; Lee, J.; Yun, B. Piezoelectric sensor based health monitoring of railroad track using a two step support vector machine classifier. J. Infrastruct. Syst. 2008, 14, 80–88. [Google Scholar] [CrossRef]
- Lee, C.; Park, S.; Bolander, J.E.; Pyo, S. Monitoring the hardening process of ultra high performance concrete using decomposed modes of guided waves. Constr. Build. Mater. 2017, 163, 267–276. [Google Scholar] [CrossRef]
- Azhar, M.; Ahmed, Z.; Safeer, A.; Mubashir, A. Ultrasonic pulse velocity and rebound hummer testing for nondestructive evaluation of existing concrete structure. Pak. J. Eng. Appl. Sci. 2016, 18, 89–97. [Google Scholar]
- Wang, D.; Song, H.; Zhu, H. Numerical and experimental studies on damage detection of a concrete beam based on PZT admittances and correlation coefficient. Constr. Build. Mater. 2013, 49, 564–574. [Google Scholar] [CrossRef]
- Kim, J.W.; Kim, J.; Park, S.; Oh, T.K. Integrating embedded piezoelectric sensors with continuous wavelet transforms for real-time concrete curing strength monitoring. Struct. Infrastruct. Eng. 2015, 11, 897–903. [Google Scholar] [CrossRef]
- Bhalla, S.; Soh, C.K. Structural health monitoring by piezo-impedance transducers. J. Aerosp. Eng. 2004, 17, 154–165. [Google Scholar] [CrossRef]
- Park, S.; Kim, W.; Lee, C.; Park, K. Impedance-based wireless Debonding condition monitoring of CFRP Laminated Concrete structure. NDT E Int. 2011, 44, 232–238. [Google Scholar] [CrossRef]
- Kim, W.; Lee, C.; Park, S.; Koh, T. Real-time strength development monitoring for concrete structure using wired and wireless electro-mechanical impedance techniques. KSCE J. Civ. Eng. 2013, 17, 1432–1436. [Google Scholar] [CrossRef]
- Park, S.; Yun, C.-B.; Inman, D.J. Structural health monitoring using Electro-mechanical Impedance Sensors. J. Fatique Fract. Eng. Mater. Struct. 2008, 31, 714–724. [Google Scholar] [CrossRef]
- Park, S.; Ahmad, S.; Yun, C.-B.; Roh, Y. Multi crack detection of concrete structure using impedance based structural health monitoring technology. J. Exp. Mech. 2006, 46, 609–618. [Google Scholar] [CrossRef]
- Hu, X.; Zhu, H.; Wang, D. A study of concrete slab damage detection based on the electromechincal impedance method. Sensors 2014, 14, 19897–19909. [Google Scholar] [CrossRef] [PubMed]
- Maeder, M.; Damjanovic, D.; Setter, N. Lead Free Piezoelectric Materials. J. Electroceram. 2004, 13, 385–392. [Google Scholar] [CrossRef]
- Sherrit, S.; Mukherjee, B.K. Characterization of Piezoelectric Materials for Transducers. Available online: http://arxiv.org/ftp/arxiv/papers/0711/0711.2657.pdf (accessed on 24 May 2017).
- Voutetaki, M.E.; Papadopoulos, N.A.; Angeli, G.M.; Providakis, C.P. Investigation of a new experimental method for damage assessment of RC beam failing in shear using piezoelectric transducers. Eng. Struct. 2016, 114, 226–240. [Google Scholar] [CrossRef]
- Basu, P.; Labbe, P.; Naus, D. Nuclear Power Plant Concrete Structures. Proceedings of 22nd Conference on Structural Mechanics in Reactor Technology, San Francisco, CA, USA, 18–23 August 2013. [Google Scholar]
Figure 1.
Styrofoam case used to protect the sensor.
Figure 2.
A schematic diagram of the sensor in concrete and the data acquisition process.

Figure 3.
(a) Geometric information of the concrete specimen and sensors (planar view); (b) Geometric information of the concrete specimen and sensors (front/elevated view).
Figure 3.
(a) Geometric information of the concrete specimen and sensors (planar view); (b) Geometric information of the concrete specimen and sensors (front/elevated view).

Figure 4.
Sensor placement and arrangement for concrete casting.

Figure 5.
The data measured by sensors in specimens 1, 2, and 3 are represented by (a–c), respectively.
Figure 5.
The data measured by sensors in specimens 1, 2, and 3 are represented by (a–c), respectively.
Figure 6.
Cross correlation (CC) of impedance data observed by five channels for 48 h.

Figure 7.
CC of the impedance data observed by five channels for seven days.

Figure 8.
Predicted data for concrete strength development of specimen 1, 2, and 3.

Figure 9.
(a–c) show the comparison between the actual compressive strengths of concrete and the predicted strengths of concrete.
Figure 9.
(a–c) show the comparison between the actual compressive strengths of concrete and the predicted strengths of concrete.


Table 1.
Properties of the piezoelectric sensor.
| APC Materials 850 WEB Series | ||
|---|---|---|
| Size | Thickness | 0.508 mm |
| Diameter | 30.00 mm | |
| Piezoelectric charge constant, 10−12 | d33 | 400 |
| d31 | −175 | |
| Electromechanical coupling factor of the material | k33 | 0.72 |
| k31 | 0.36 | |
Table 2.
Concrete mix details.
| Specimen No | W/C % | Unit Weight kg/m3 | AD % | AE % | Temperature for Curing, °C | ||||||
|---|---|---|---|---|---|---|---|---|---|---|---|
| W | C | FA | GGBS | SF | S | G | |||||
| 1 | 40 | 162 | 324 | 81 | 0 | 0 | 722 | 965 | 0 | 0 | 5 |
| 2 | 34 | 155 | 328 | 0 | 228 | 0 | 717 | 723 | 0.9 | 0.8 | 20 |
| 3 | 34 | 155 | 137 | 0 | 296 | 23 | 724 | 966 | 0.007 | 0.005 | 40 |
© 2018 by the authors. Licensee MDPI, Basel, Switzerland. This article is an open access article distributed under the terms and conditions of the Creative Commons Attribution (CC BY) license (http://creativecommons.org/licenses/by/4.0/).
Share and Cite
MDPI and ACS Style
Choi, S.-K.; Tareen, N.; Kim, J.; Park, S.; Park, I. Real-Time Strength Monitoring for Concrete Structures Using EMI Technique Incorporating with Fuzzy Logic. Appl. Sci. 2018, 8, 75. https://doi.org/10.3390/app8010075
AMA Style
Choi S-K, Tareen N, Kim J, Park S, Park I. Real-Time Strength Monitoring for Concrete Structures Using EMI Technique Incorporating with Fuzzy Logic. Applied Sciences. 2018; 8(1):75. https://doi.org/10.3390/app8010075
Chicago/Turabian StyleChoi, Sang-Ki, Najeebullah Tareen, Junkyeong Kim, Seunghee Park, and Innjoon Park. 2018. "Real-Time Strength Monitoring for Concrete Structures Using EMI Technique Incorporating with Fuzzy Logic" Applied Sciences 8, no. 1: 75. https://doi.org/10.3390/app8010075
Note that from the first issue of 2016, this journal uses article numbers instead of page numbers. See further details here.