A Novel Particulate Matter 2.5 Sensor Based on Surface Acoustic Wave Technology

1
Institute of Acoustics, Chinese Academy of Sciences, No. 21, North 4th Ring West Road, Beijing 100190, China
2
Beijing Research Institute of Telemetry, Beijing 100076, China
*
Author to whom correspondence should be addressed.
Appl. Sci. 2018, 8(1), 82; https://doi.org/10.3390/app8010082
Submission received: 7 December 2017
/
Revised: 3 January 2018
/
Accepted: 5 January 2018
/
Published: 9 January 2018
(This article belongs to the Section Acoustics and Vibrations)
Abstract
:Design, fabrication and experiments of a miniature particulate matter (PM) 2.5 sensor based on the surface acoustic wave (SAW) technology were proposed. The sensor contains a virtual impactor (VI) for particle separation, a thermophoretic precipitator (TP) for PM2.5 capture and a SAW sensor chip for PM2.5 mass detection. The separation performance of the VI was evaluated by using the finite element method (FEM) model and the PM2.5 deposition characteristic in the TP was obtained by analyzing the thermophoretic theory. Employing the coupling-of-modes (COM) model, a low loss and high-quality SAW resonator was designed. By virtue of the micro electro mechanical system (MEMS) technology and semiconductor technology, the SAW based PM2.5 sensor detecting probe was fabricated. Then, combining a dual-port SAW oscillator and an air sampler, the experimental platform was set up. Exposing the PM2.5 sensor to the polystyrene latex (PSL) particles in a chamber, the sensor performance was evaluated. The results show that by detecting the PSL particles with a certain diameter of 2 μm, the response of the SAW based PM2.5 sensor is linear, and in accordance with the response of the light scattering based PM2.5 monitor. The developed SAW based PM2.5 sensor has great potential for the application of airborne particle detection.
1. Introduction
Atmospheric particulate matter (PM) is the sum of solid and liquid particles suspended in air. The complex mixture originates from a variety of sources such as salt, soot, metals and fly ash. PM2.5, also known as fine particle, refers to particles with a nominal aerodynamic diameter less than or equal to 2.5 μm, which have an adverse impact on air environment. Exposure to such air pollution may carry a risk of epidemic disease and the atmospheric visibility is degraded [1,2,3,4]. To control the PM2.5 pollution, the monitoring work, especially extensive area monitoring, is indispensable. At present, the main methods for PM2.5 monitoring are the gravimetric method, the β-ray decay method and the tapered element oscillating microbalance (TEOM) method [5], which suffer from large volume and high price. On the other hand, for portable purposes, the light scattering method, the micro electro mechanical systems (MEMS) method and some novel detecting approaches [6,7,8,9] are reported. Besides, to realize better sensitivity for mass sensors, high-frequency and high-Q aluminum nitride Lamb wave resonators were also developed recently [10,11]. The light scattering method’s output depends highly on particle composition and size, leading to low accuracy [12]. The MEMS method based on a film bulk acoustic resonator (FBAR) mass sensor has a sensitivity of 2 μg/m3 with a 10 min testing time [13]. The sensor’s fabrication process is complex [14]. Thus, to satisfy the development trend and urgent requirement of the PM2.5 monitoring methods, a miniature PM2.5 sensor based on the surface acoustic wave (SAW) technology was developed.
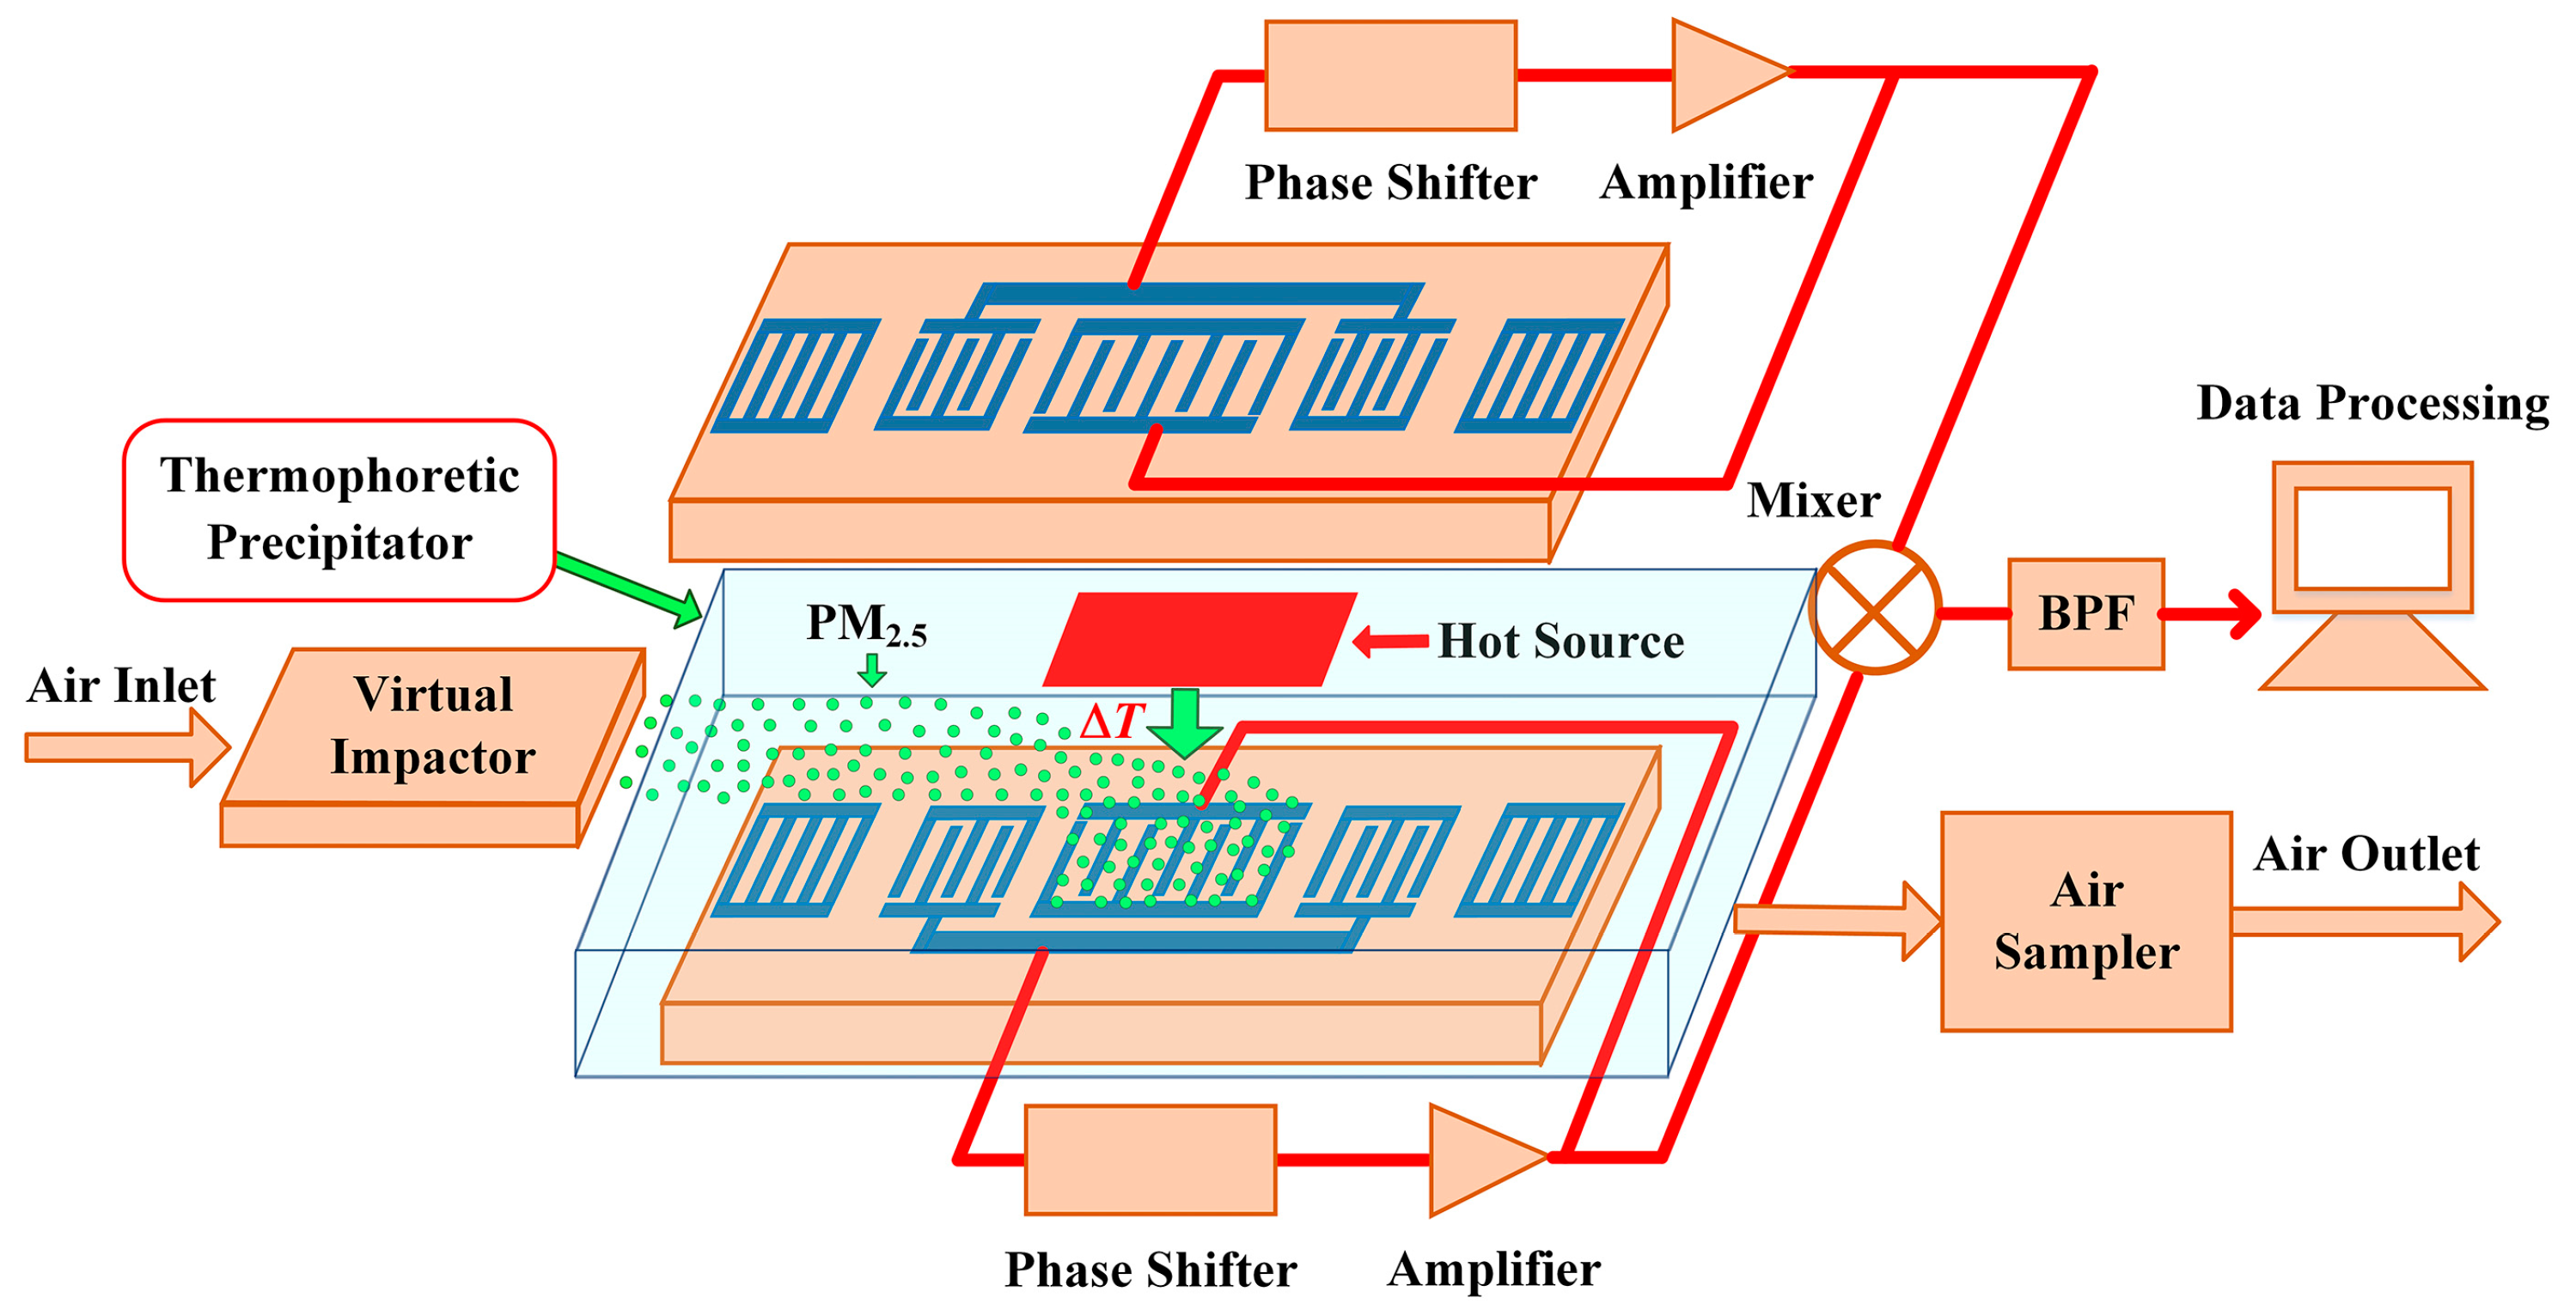
The schematic of the SAW based PM2.5 sensor is shown in Figure 1. In the sensor, a virtual impactor (VI), a thermophoretic precipitator (TP) and a SAW sensor chip are integrated into an air current microchannel. When the airborne particles are separated by size in the VI, the PM2.5 is transferred to the plate-to-plate TP. By the thermophoresis effect, the mass loading from the deposited PM2.5 results in the SAW velocity shift, and accordingly, the change of the oscillation frequency is utilized for PM2.5 mass detection.
In this paper, the system design and evaluation of the SAW based PM2.5 sensor were presented. To determine the optimal dimensions of the VI, a finite element method (FEM) model was established in the software COMSOL MULTIPHYSICS 4.4 (COMSOL Inc., Stockholm, Sweden, 2013) to analyze collection efficiency. Based on the thermophoretic deposition efficiency for a laminar flow profile, the dimensions of the TP were obtained. Also, the coupling-of-modes (COM) model, an efficient technique for SAW device simulation, was used to find optimal design parameters of the SAW sensor chip prior to fabrication. Accordingly, a dual-port 300 MHz SAW oscillator was implemented by using the sensor detecting probe as the feedback element. Combining the precise air sampling unit and the data processing unit, the performance of the developed SAW based PM2.5 sensor was evaluated by detecting the monodispersed polystyrene latex (PSL) particles.
2. Design and Simulation
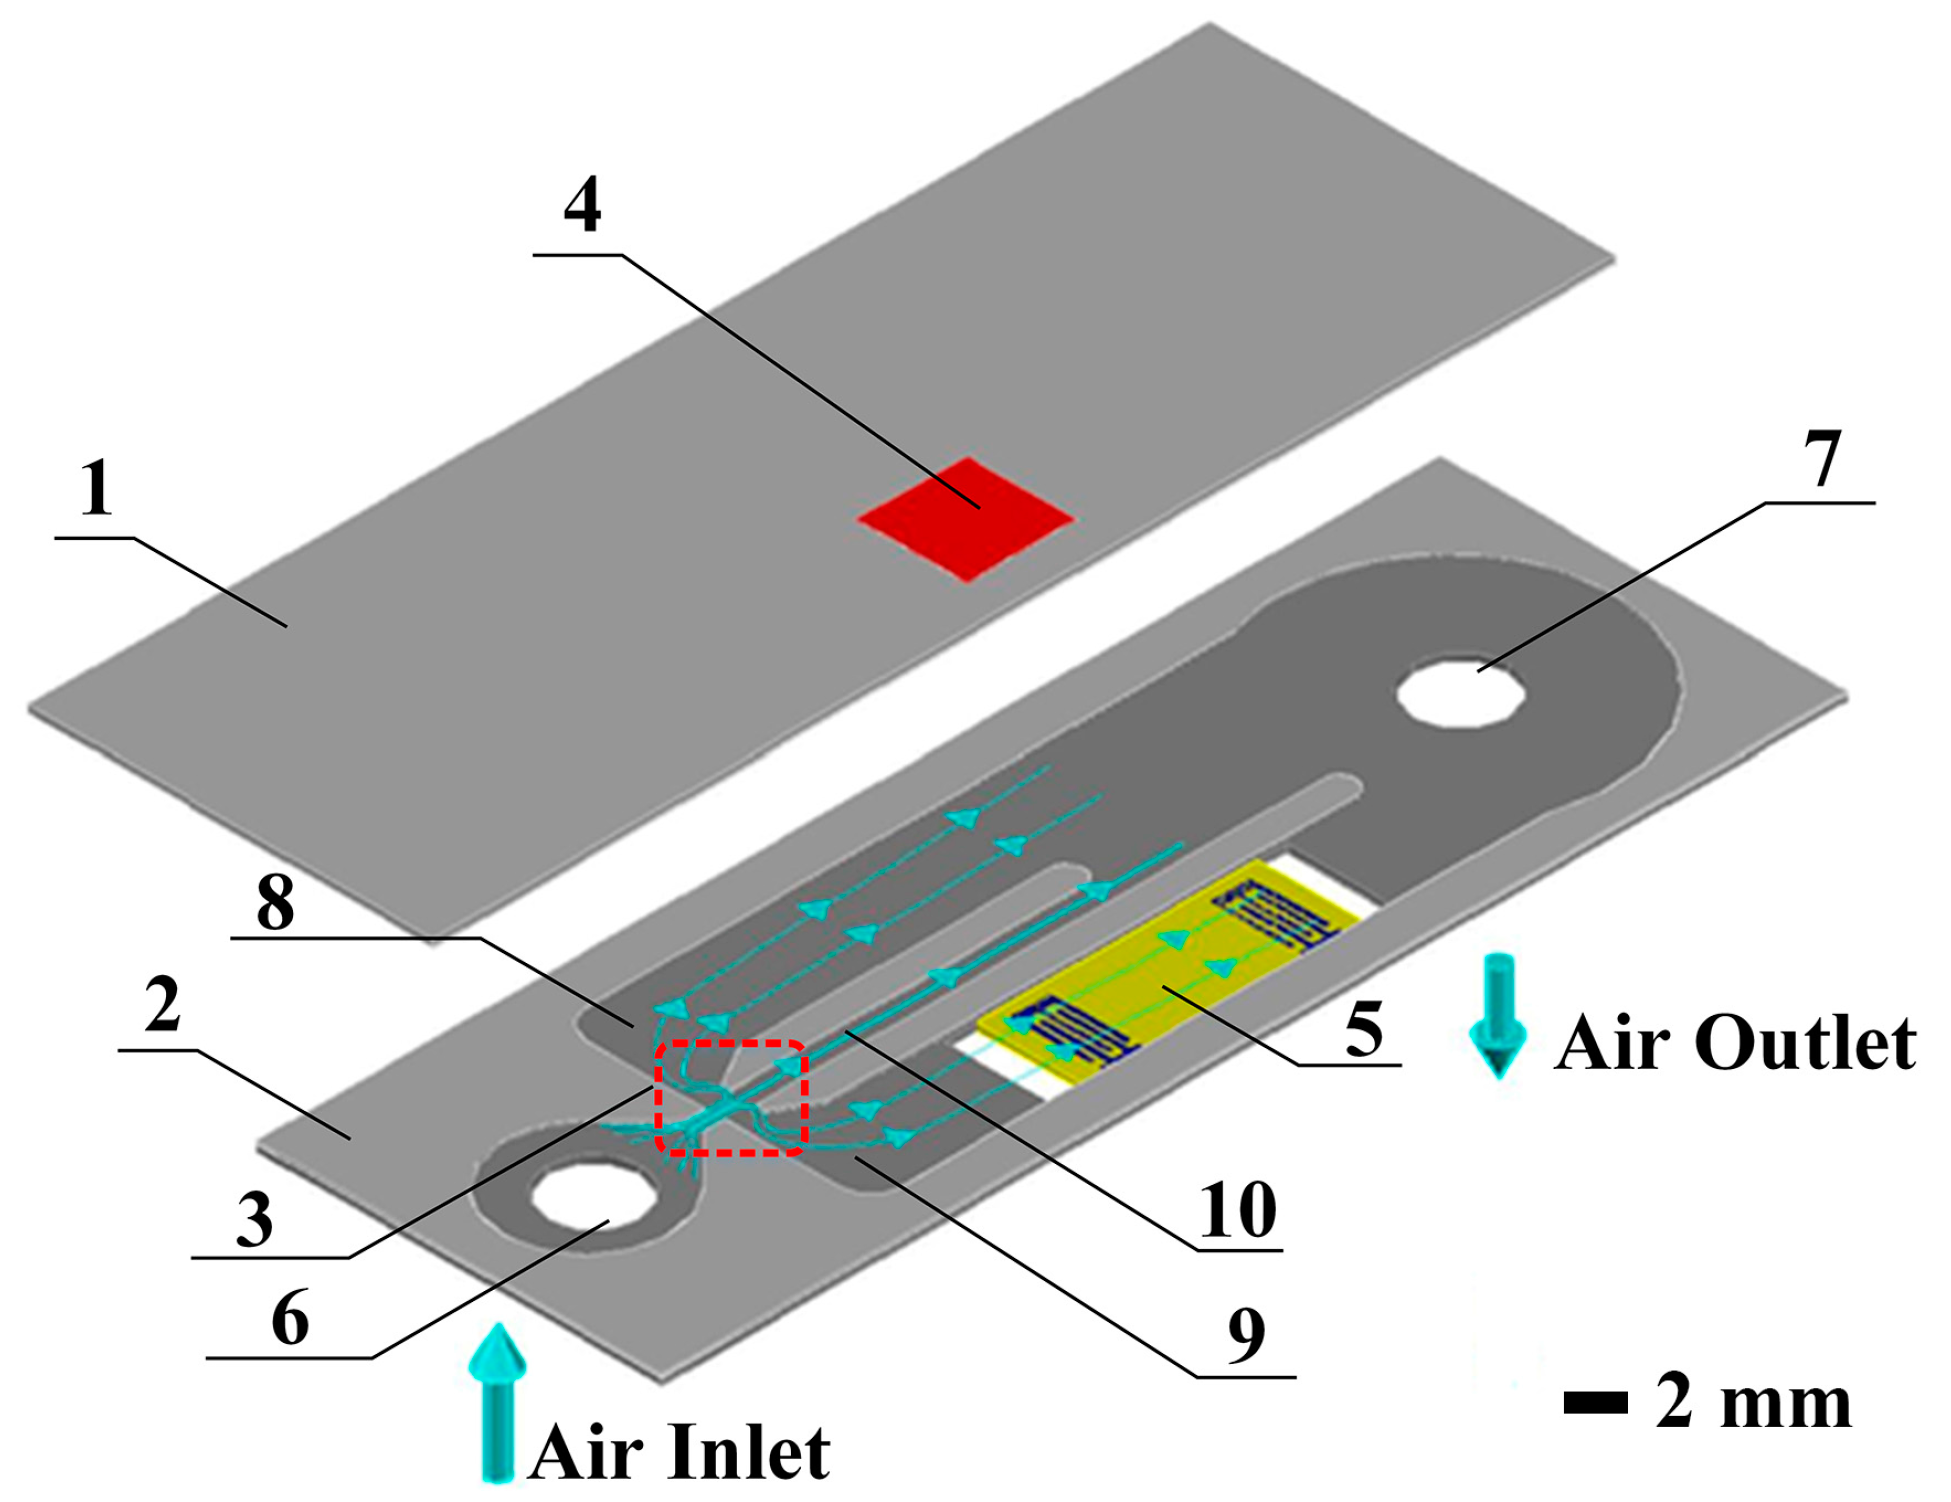
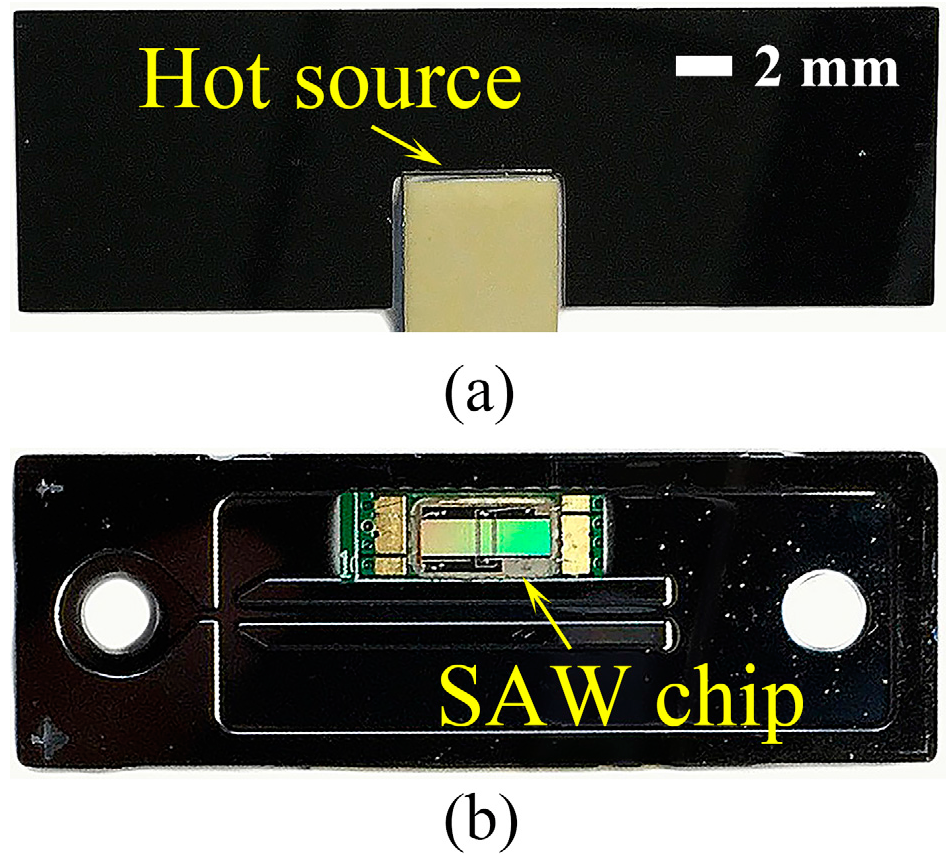
The exploded view of the proposed detecting probe is shown in Figure 2. The detecting probe consists of an upper shell (1); a lower shell (2); a slit nozzle VI (3); a hot source (4) and a SAW sensor chip (5). An air inlet (6) and an air outlet (7) are at both ends of the lower shell.
The SAW sensor chip is embedded in the lower shell and aligned with the hot source in the upper shell, forming a plate-to-plate TP in the channel (9). When the airborne particles are inhaled into the VI, the airflow is divided into two. The large particles follow into the middle channel (10) owing to their large inertia. Accordingly, because of small inertia, the small particles, namely PM2.5, follow into the left channel (8) and right channel (9) equally. When the PM2.5 flows through the TP in the channel (9), particles are captured on the surface of the SAW sensor chip by thermophoretic force. Meanwhile, the particles in the left and middle channels are expelled from the outlet together. In the following section, the design and simulation of the slit nozzle VI, the plate-to-plate TP and the SAW sensor chip are presented.
2.1. Particle Separation
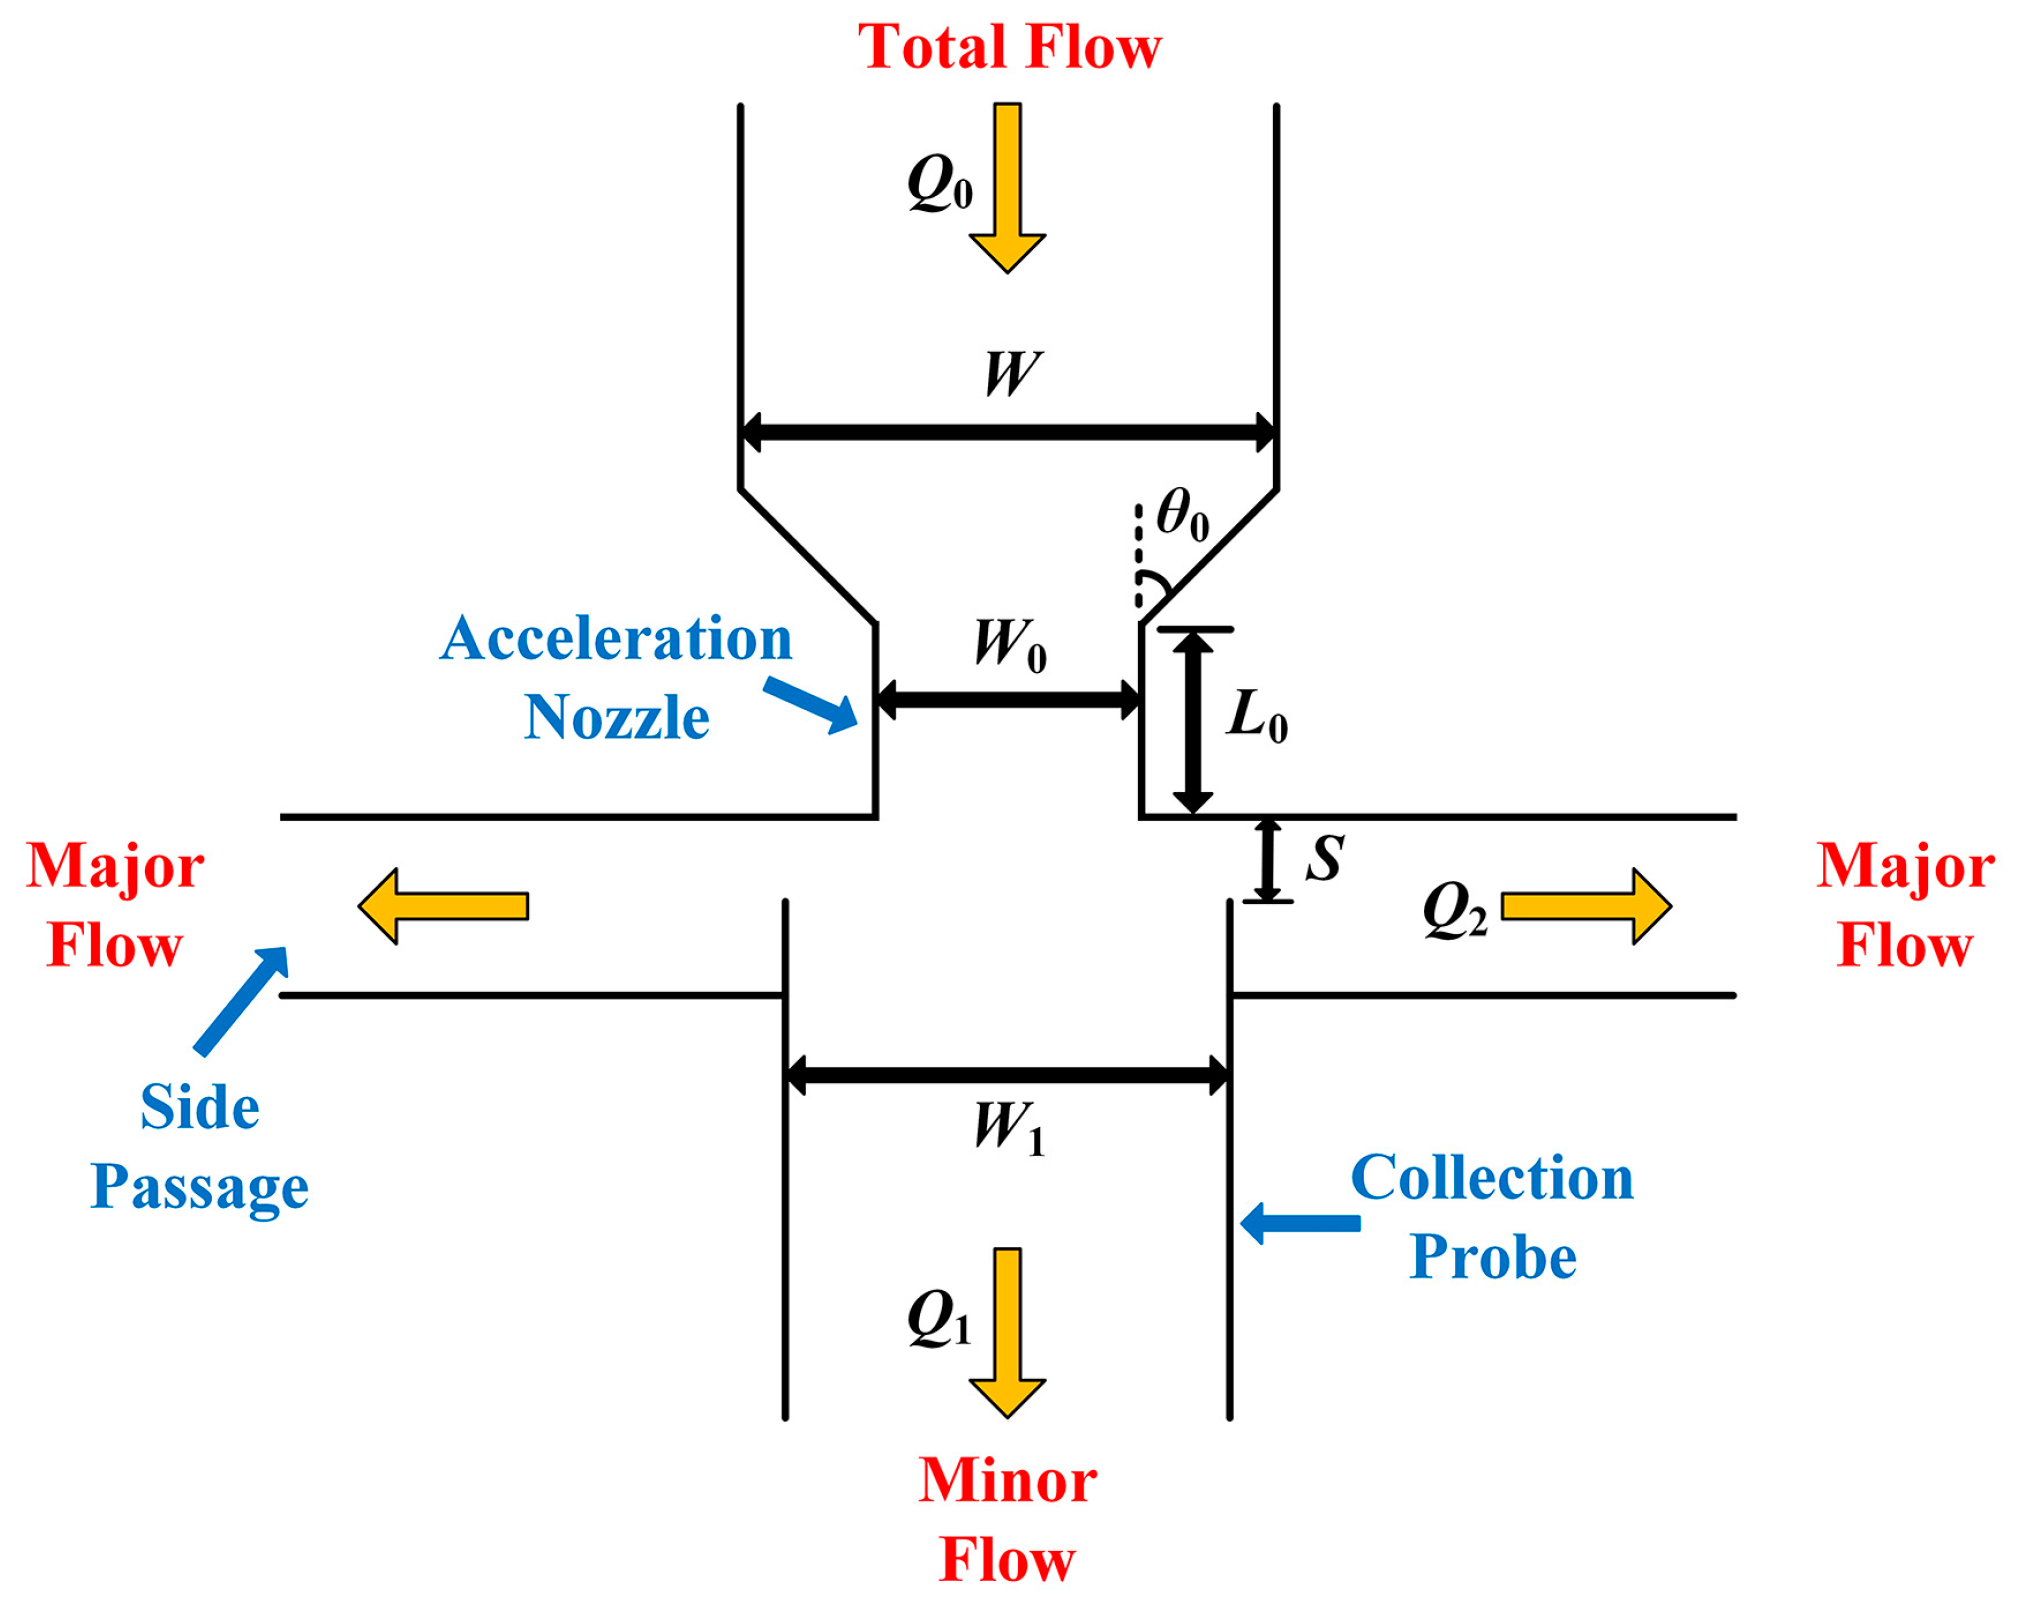
The sampling principle of the VI is based on the different inertia of particles of different diameters [15,16]. The VI is composed of two coaxial nozzles, shown in Figure 3. The upper nozzle is the acceleration nozzle, and the lower nozzle is the collection probe. The geometric parameters are the width of inlet W, the angle of inlet θ0, the width of acceleration nozzle W0, the length of acceleration nozzle L0, the nozzle-to-probe distance S, the width of collection probe W1 and the height of microchannel h (perpendicular to the cross-sectional view).
When the air flows into the nozzle, the high-speed airflow is divided into two. One part of it, occupying 90% of the total flow, changes direction with an angle of 90 degrees and flows into the side passage. This part is called major flow. Another part of airflow, occupying 10% of the total flow, enters the collection probe directly. This part is called minor flow. Meanwhile, particles of small diameter have small inertia and are easy to move with the major flow to the side passage. On the other hand, large particles have large inertia and are easy to break away from the deflecting airflow, entering the collection probe. The inertia based separation property of particles is characterized by a parameter, namely the Stokes number (Stk) [17]. If the particles with a certain diameter that 50% of which flow into the side passage and another 50% of which flow into the collection probe, the certain diameter is called the cut-off diameter (D50). The corresponding Stokes number is Stk50. The D50 and Stk50 satisfy the Stokes equation (Equation (1)), which is influenced by the fluid properties and the VI geometric parameters. In Equation (1), μ is the dynamic viscosity of the fluid, ρs is the particle density, Q0 is the total flow and C is the Cunningham slip correction.
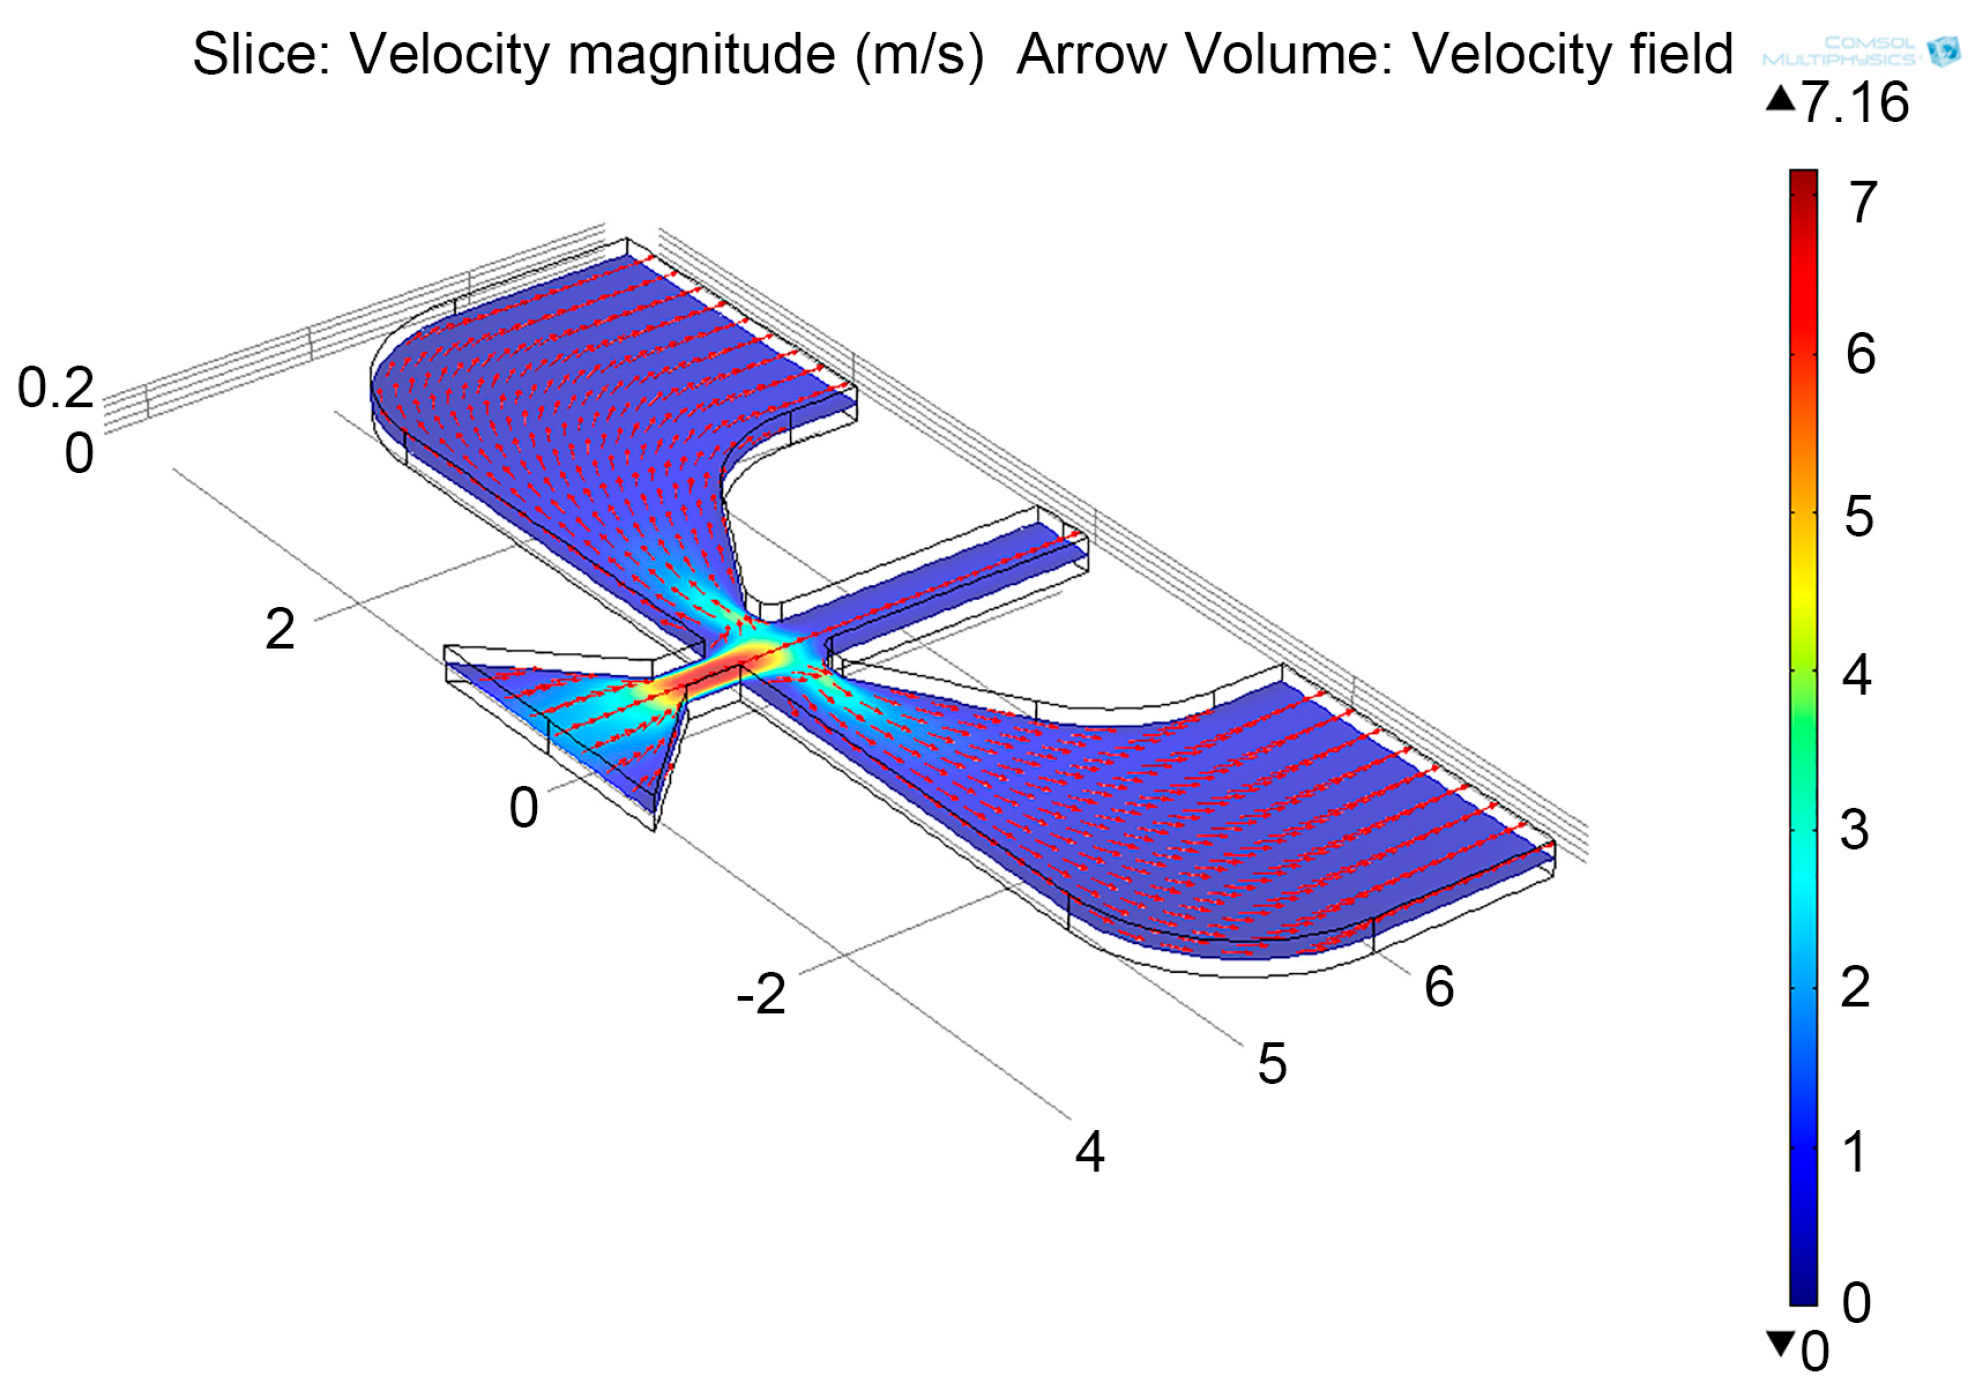
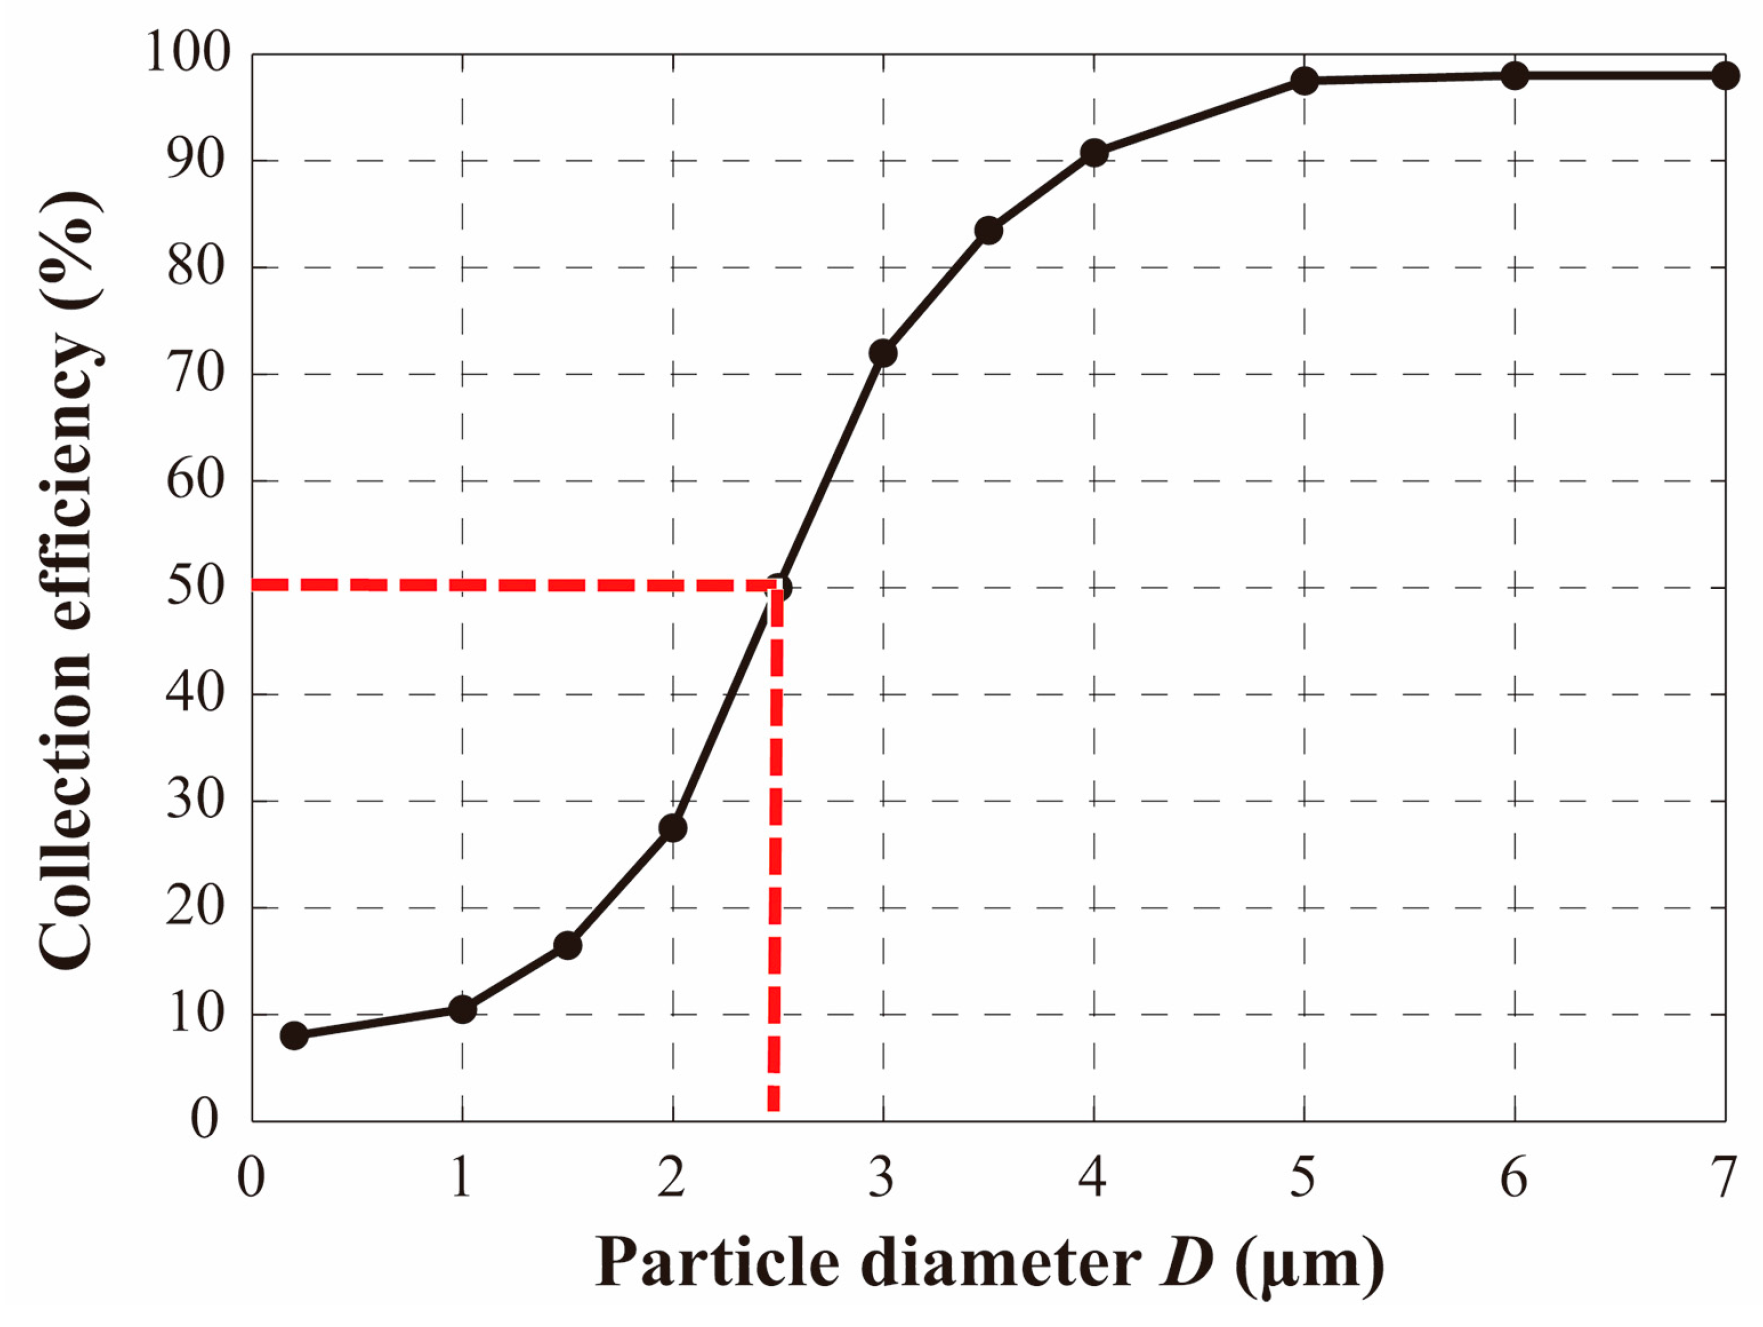
First, the value of Stk50 was assumed to be 0.55 and the D50 was set to 2.5 μm. According to Equation (1), the total flow Q0 = 13.5 mL/min, the height h = 200 μm and the width W0 = 290 μm were determined. Then, the other geometric parameters were obtained in succession referring to [18]. Lastly, the proposed design of the microchannel was further adjusted by using the FEM software COMSOL to deduce the collection efficiency. The collection efficiency is the ratio of the particles collected in the minor flow to the particles supplied to the inlet. By using the Laminar Flow and the Particle Tracing for Fluid Flow packages in COMSOL, the velocity field distribution and the collection efficiency curve of the VI were obtained, shown in Figure 4 and Figure 5 respectively. The maximum velocity is 7.16 m/s and the cut-off diameter is 2.5 μm.
2.2. PM2.5 Deposition
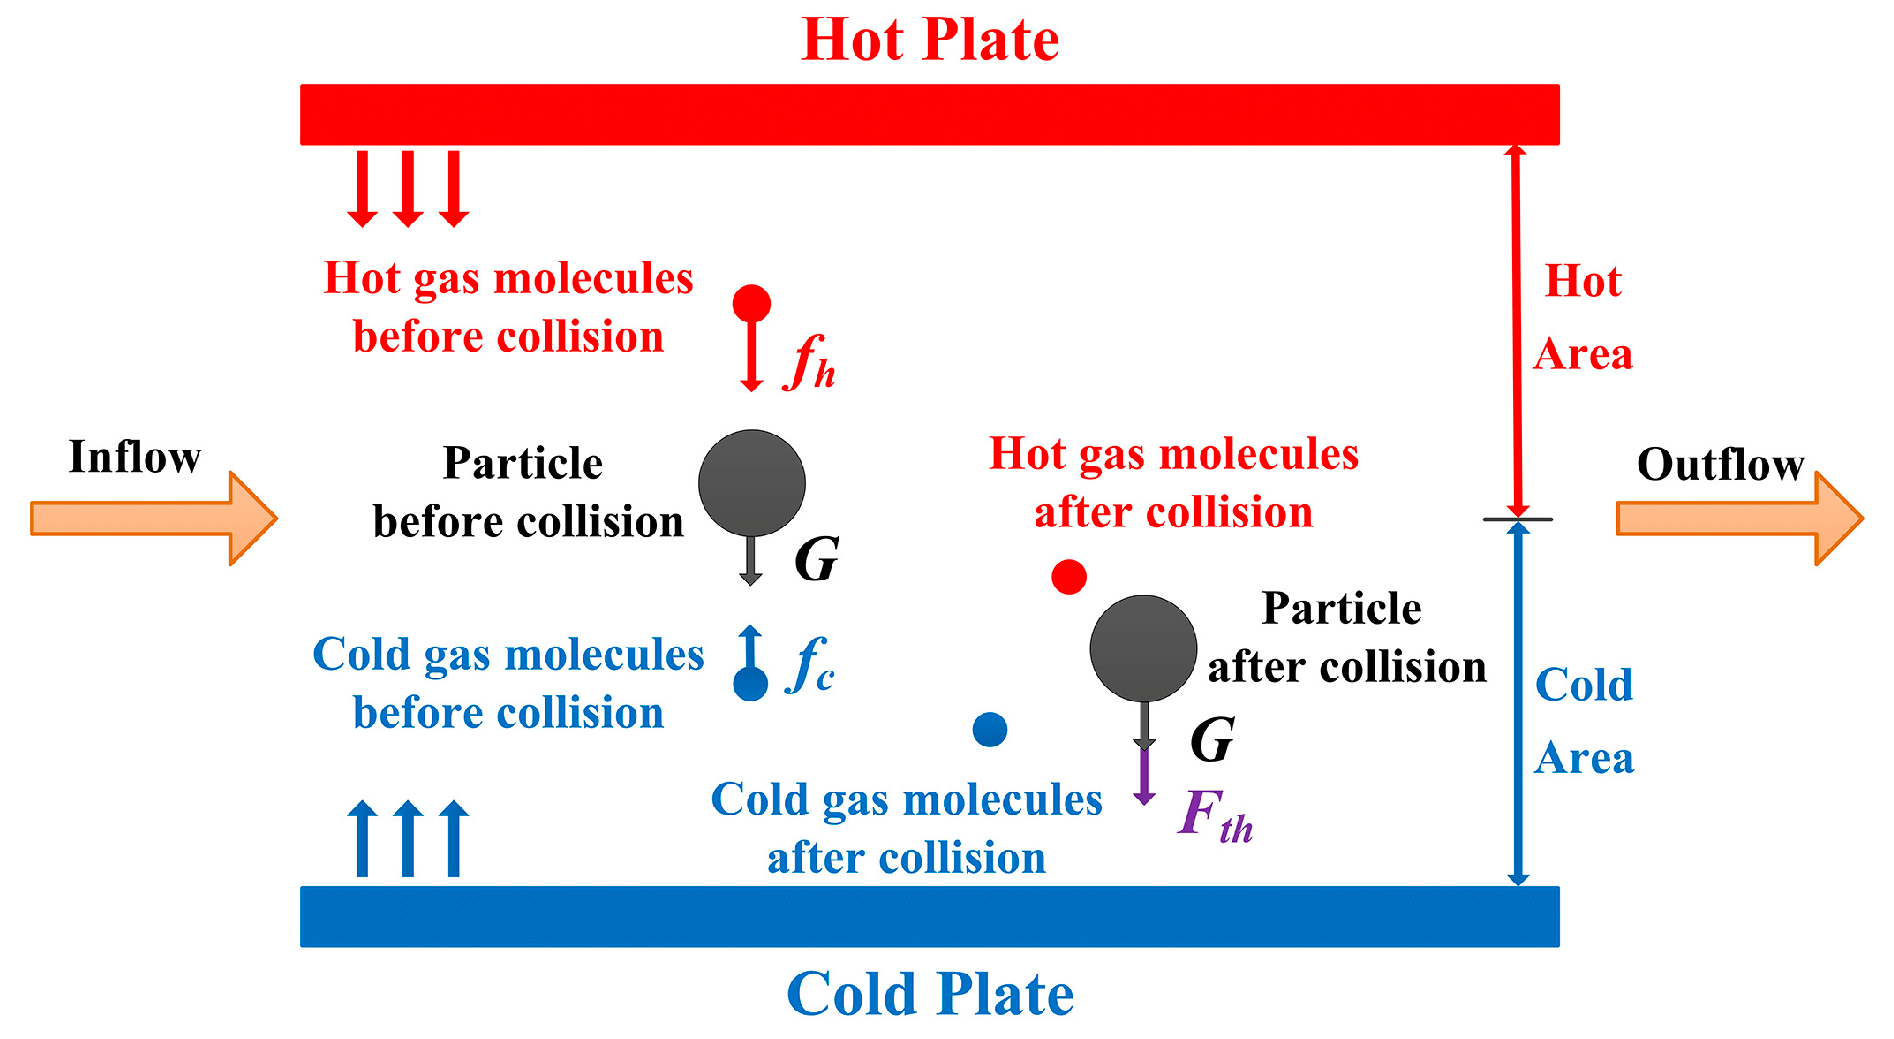
The upper hot source and the lower SAW sensor chip embedded in the air current microchannel form the plate-to-plate TP. As shown in Figure 6, the gas molecules coming from the hot plate have a larger kinetic energy than those coming from the cold plate [19]. Thus, the greater momentum received from the hot side causes a net force (thermophoretic force Fth) in the direction of decreasing temperature, leading to the overall movement of particles to the cooler side. The velocity resulting from the thermophoretic force is called thermophoretic velocity Vth.
In the microscale TP, the particle deposition efficiency η can be written as [21]:
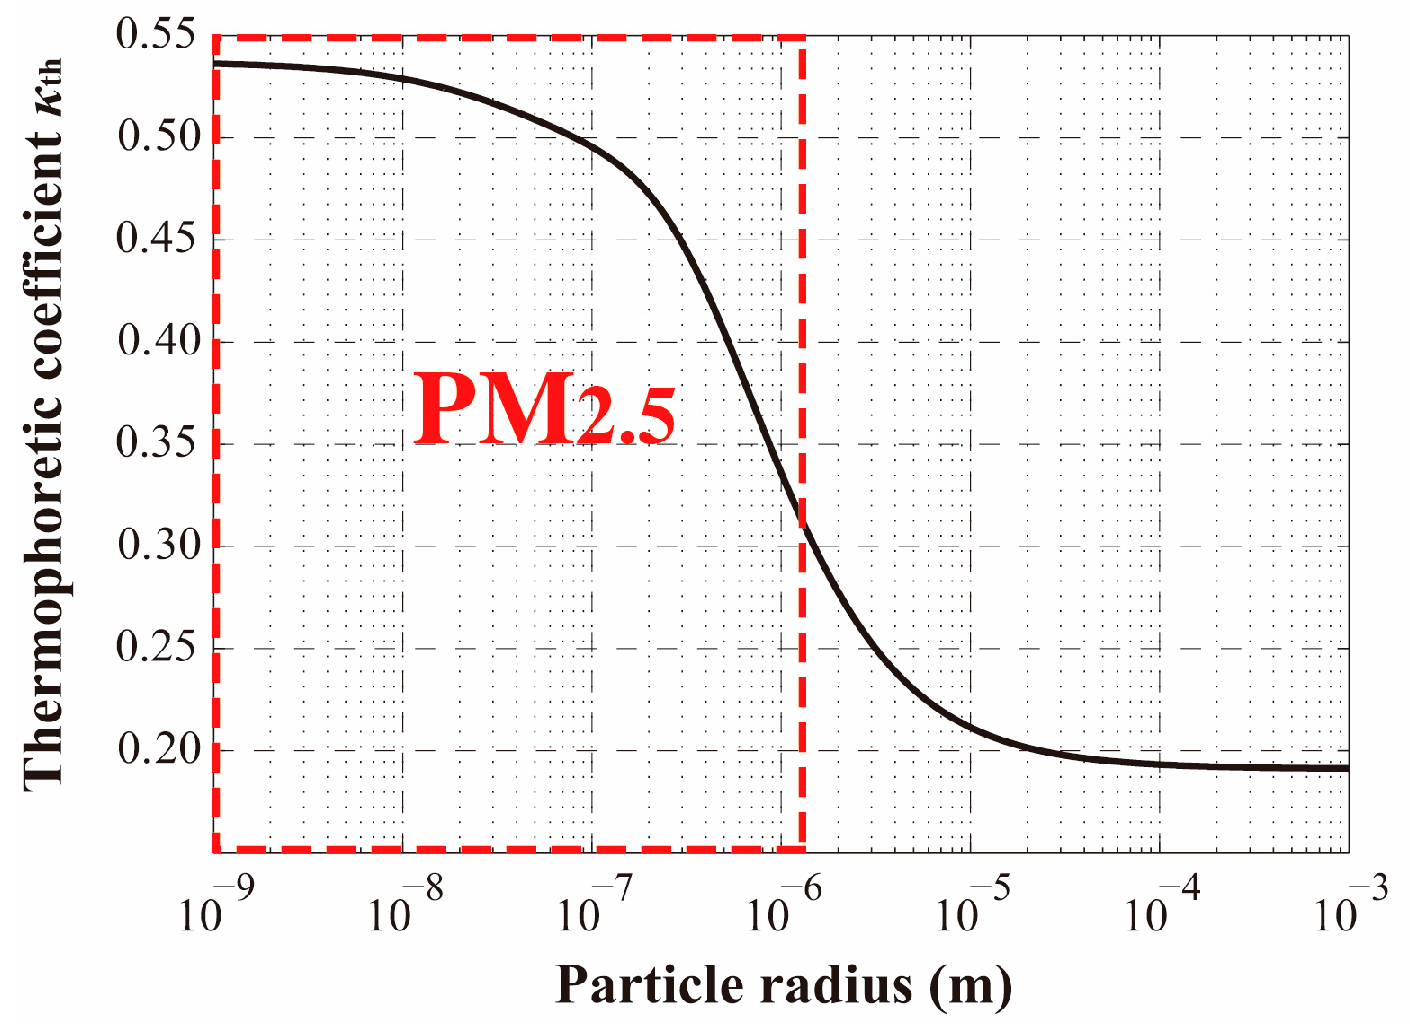
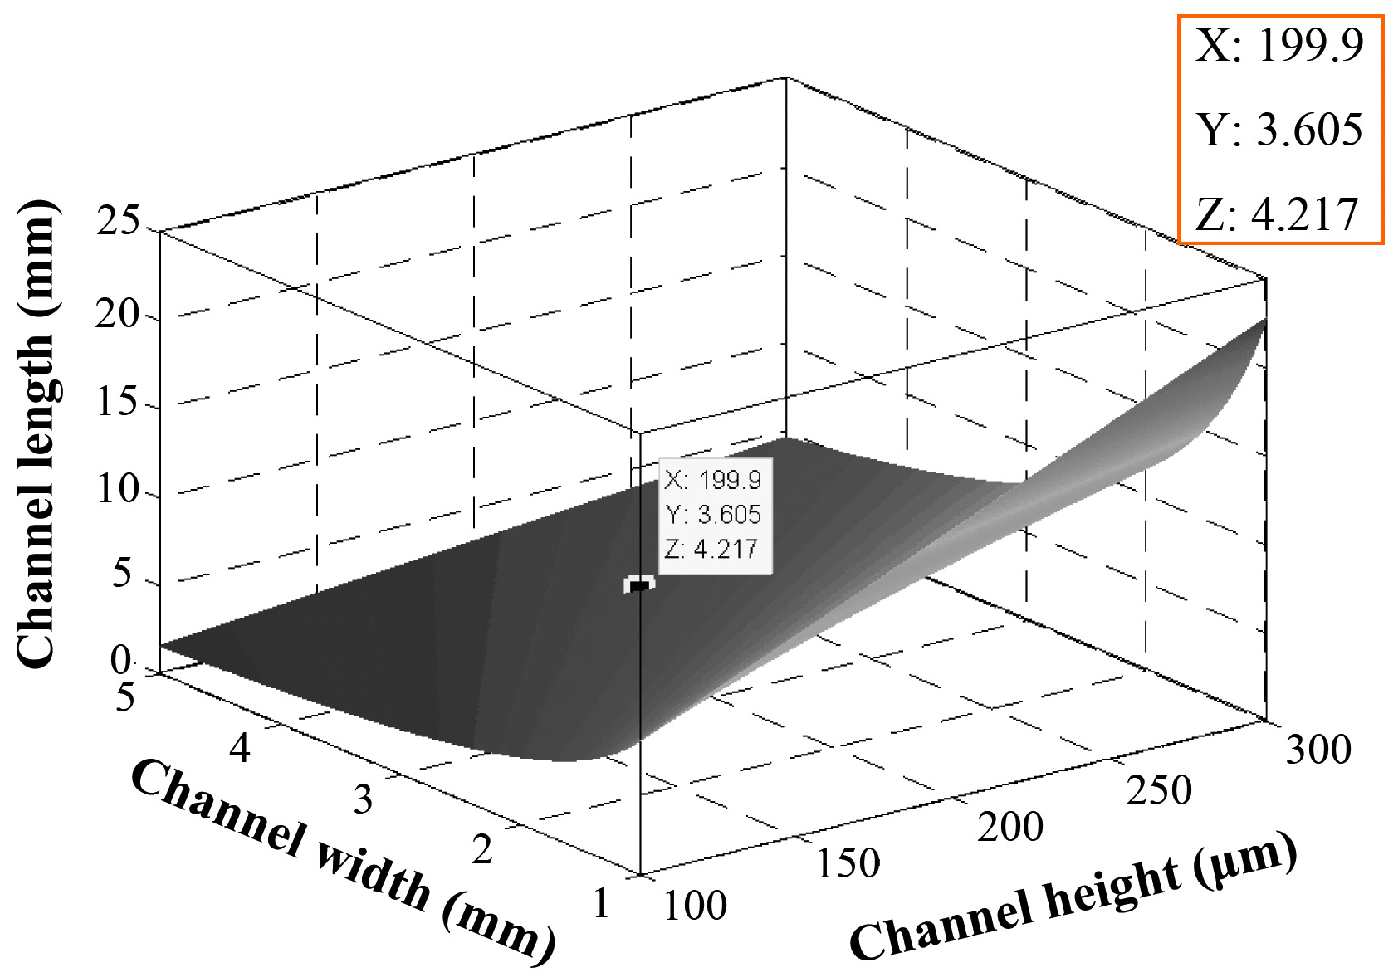
which is determined by the collection area of the cold plate (Scold), the thermophoretic velocity (Vth) and the inlet flow rate (Qin). ν is the kinematic viscosity of the fluid, is the temperature gradient, T is the particle temperature and Kth is the thermophoretic coefficient. Here, the Kth formula given by Talbot is adopted [22]. In Figure 7, the dimensionless Kth is plotted as a function of R in a semi-logarithmic coordinate, where the area in red dashed line represents the PM2.5 area. With the decrease of particle radius, the Kth increases monotonously, and accordingly, the deposition efficiency will increase. Thus, when the deposition efficiency for particles of a certain diameter of 2.5 μm is set to 100%, the TP dimensions can be deduced and drawn in Figure 8. The corresponding operating conditions were the temperature of the hot plate equaling 393.15 K, the temperature of the cold plate equaling 303.15 K and the Qin equaling 6 mL/min. Besides, considering the surface size of a SAW sensor chip, the dimensions of the thermophoretic precipitator were 200 μm × 3.6 mm × 6.3 mm.
2.3. PM2.5 Mass Detection
When the VI and TP on the front end are working at the steady flow and temperature fields, the SAW propagation along the piezoelectric substrate is perturbed by the PM2.5 mass loading, causing a linear velocity shift of SAW. This characteristic is used to detect the particulate mass concentration. The corresponding response mechanism was analyzed theoretically by solving the piezoelectric medium equations of motion and the surface effective permittivity in [23], indicating the threshold detection limit of the PM2.5 sensor using a SAW sensor chip was 0.17 ng.
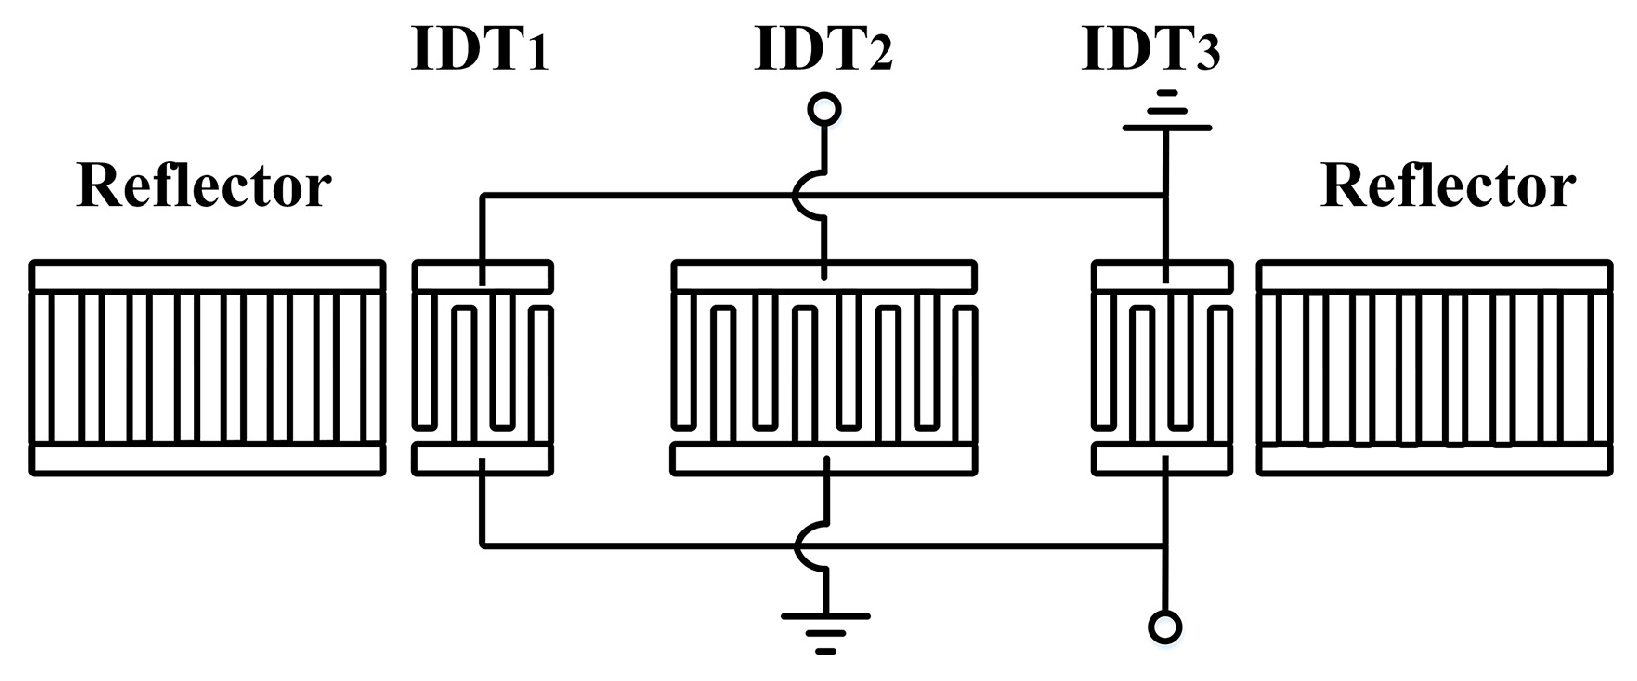
To obtain the sufficient deposition area, a SAW sensor chip configuring a three-transducer-structure resonator was adopted. The schematic of the resonator structure is shown in Figure 9, which consists of three interdigital transducers (IDTs) and two identical shorted grating reflectors [24].
Prior to the fabrication of the SAW sensor chip, the design parameters of the SAW resonator are determined by using the COM model [25]. The aim is to obtain low insertion loss and high-quality value of the resonator. By using the cascading mixed P-matrixes of the IDTs, reflectors and gaps, where the acoustic ports are cascaded and the electrical ports are in parallel, the frequency response S12 is obtained as [26]:
In Equation (3), Y01 and Y02 are the input and output impedance respectively, Y11, Y12, Y21 and Y22 are the admittance matrix elements.
Considering the area of the collection plate in TP, the center frequency of the resonator was set to 311.6 MHz, where the period of electrode λ0 is 10 μm. The electrode width is λ0/4. The electrode thickness is 1600 Å. The aluminum (Al) fingers and the ST-X quartz piezoelectric substrate were used. The acoustic aperture is 150λ0. The numbers of electrodes of IDT1, IDT2, IDT3 and adjacent gratings are 45, 90, 45 and 400, respectively. The gaps between the IDTs and reflectors are all 1.25λ0, and the distances between the IDTs are both 22.25λ0 [27]. The frequency response of the SAW resonator was deduced and shown in Figure 10. The insertion loss was 5.2 dB and the quality value was 4500.
3. Technique Realization
3.1. Sensor Detecting Probe
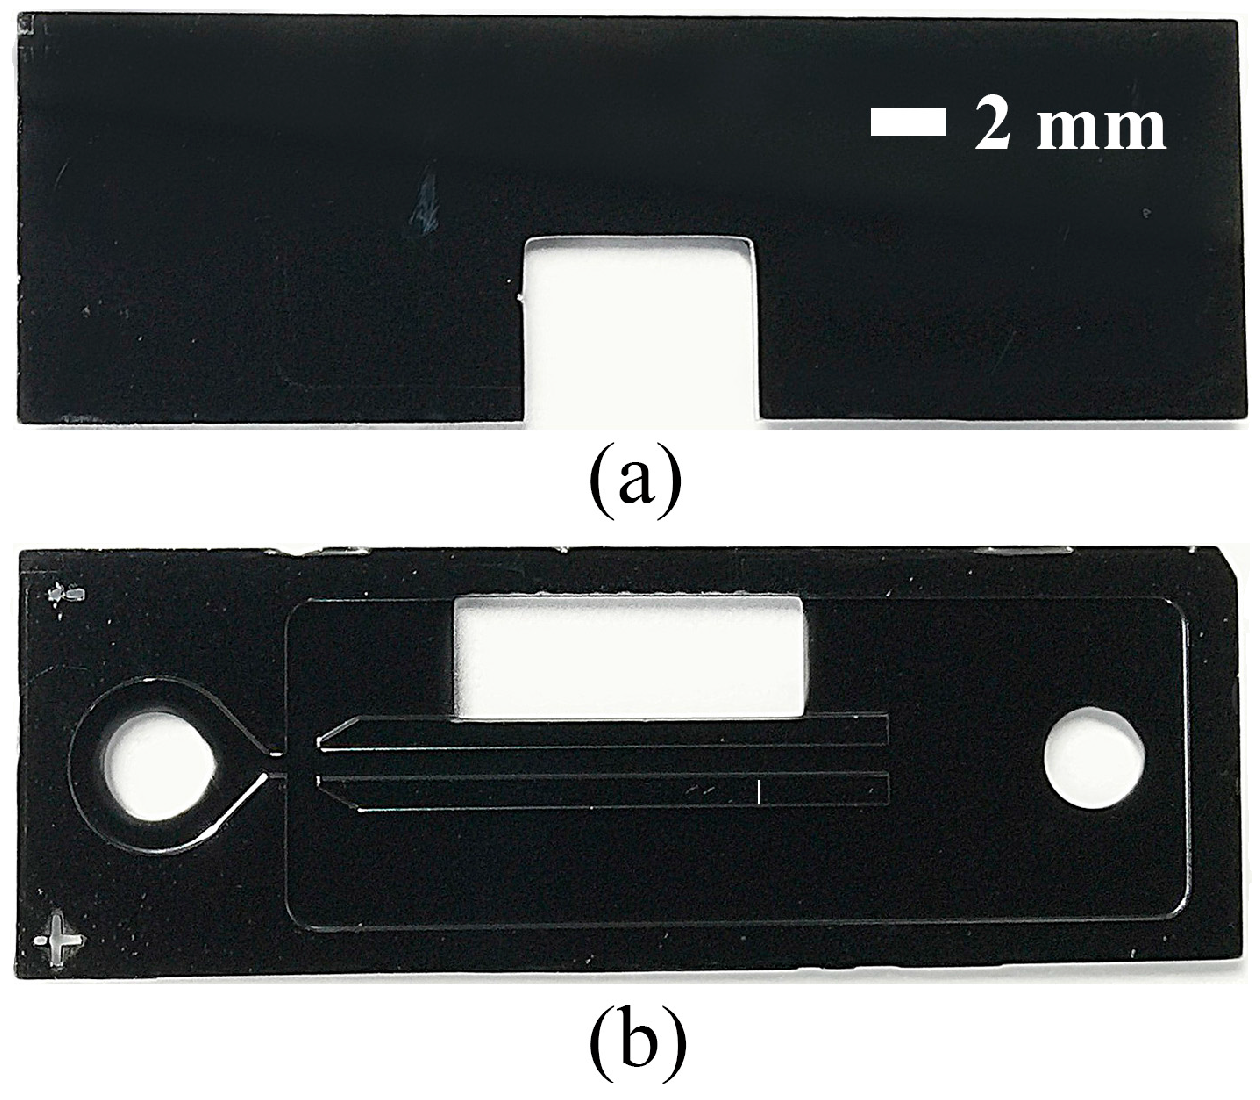
The air current microchannel in Figure 2 is composed of an upper shell (1) and a lower shell (2). For the upper shell, a 1 μm Al was deposited on a silicon substrate by using an electron beam evaporator. Then, the photoresist (PR) was spin-coated, exposed and patterned. By using the inductively coupled plasma (ICP) technology, the window was etched off. For the lower shell, the fabrication process was similar to the upper one. First, a 1 μm Al was deposited on a silicon substrate and the PR was patterned. Then, the air inlet, outlet and window were etched off. Second, we repeated the first step and etched the wafer to a depth of 200 μm by using the ICP. Lastly, the two silicon wafers were bonded together into an individual die. The fabricated air current microchannel is shown in Figure 11, where (a) is the upper shell and (b) is the lower shell.
To realize a stable and constant temperature gradient, two Peltier elements were utilized. One was placed in the hole of the upper shell, and the other was pasted on the back of the lower shell. When a direct current (DC) current was applied to a Peltier element, a heat flux was created, causing one side of the Peltier element to become warmer and the other side colder [28]. The difference in temperature was proportional to the current applied. By using two Peltier elements in parallel, the desired temperature gradient of 4.5 × 10⁵ K/m was realized in the microchannel.
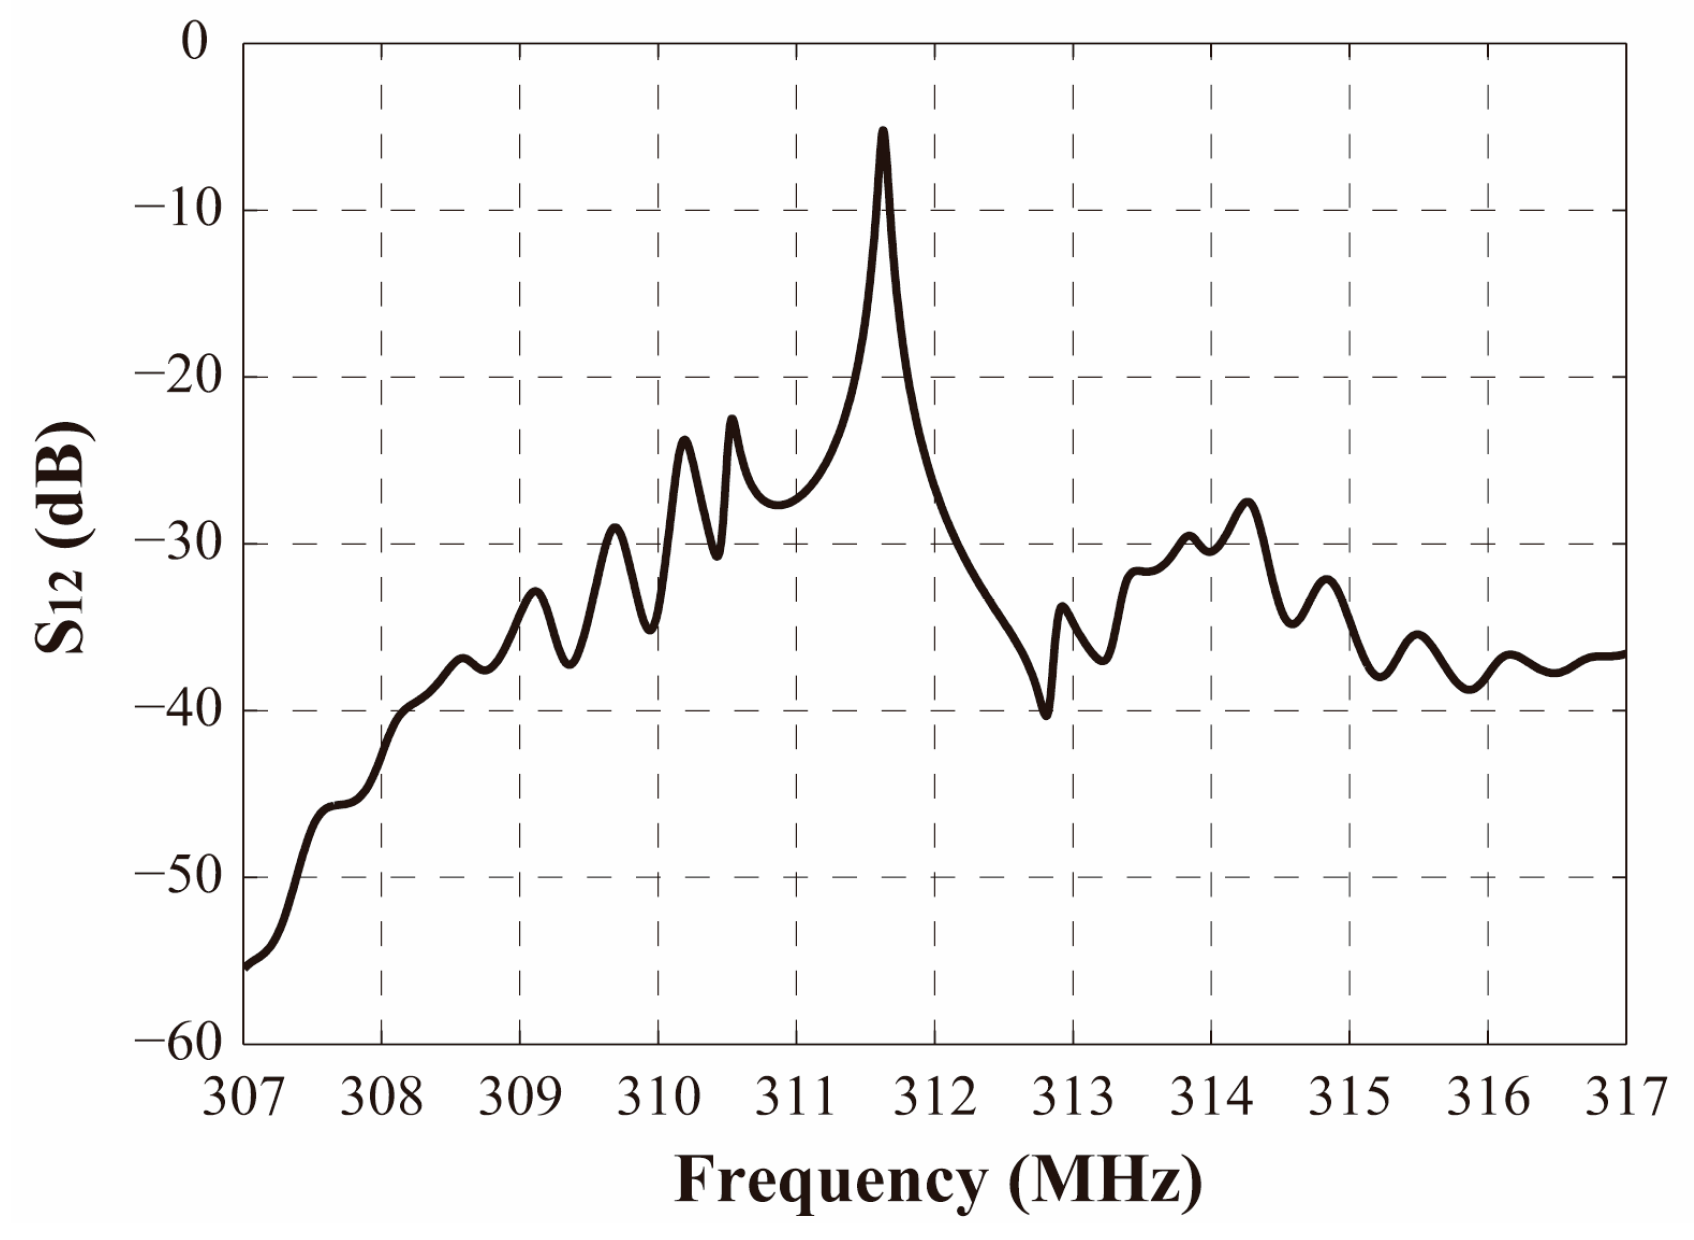
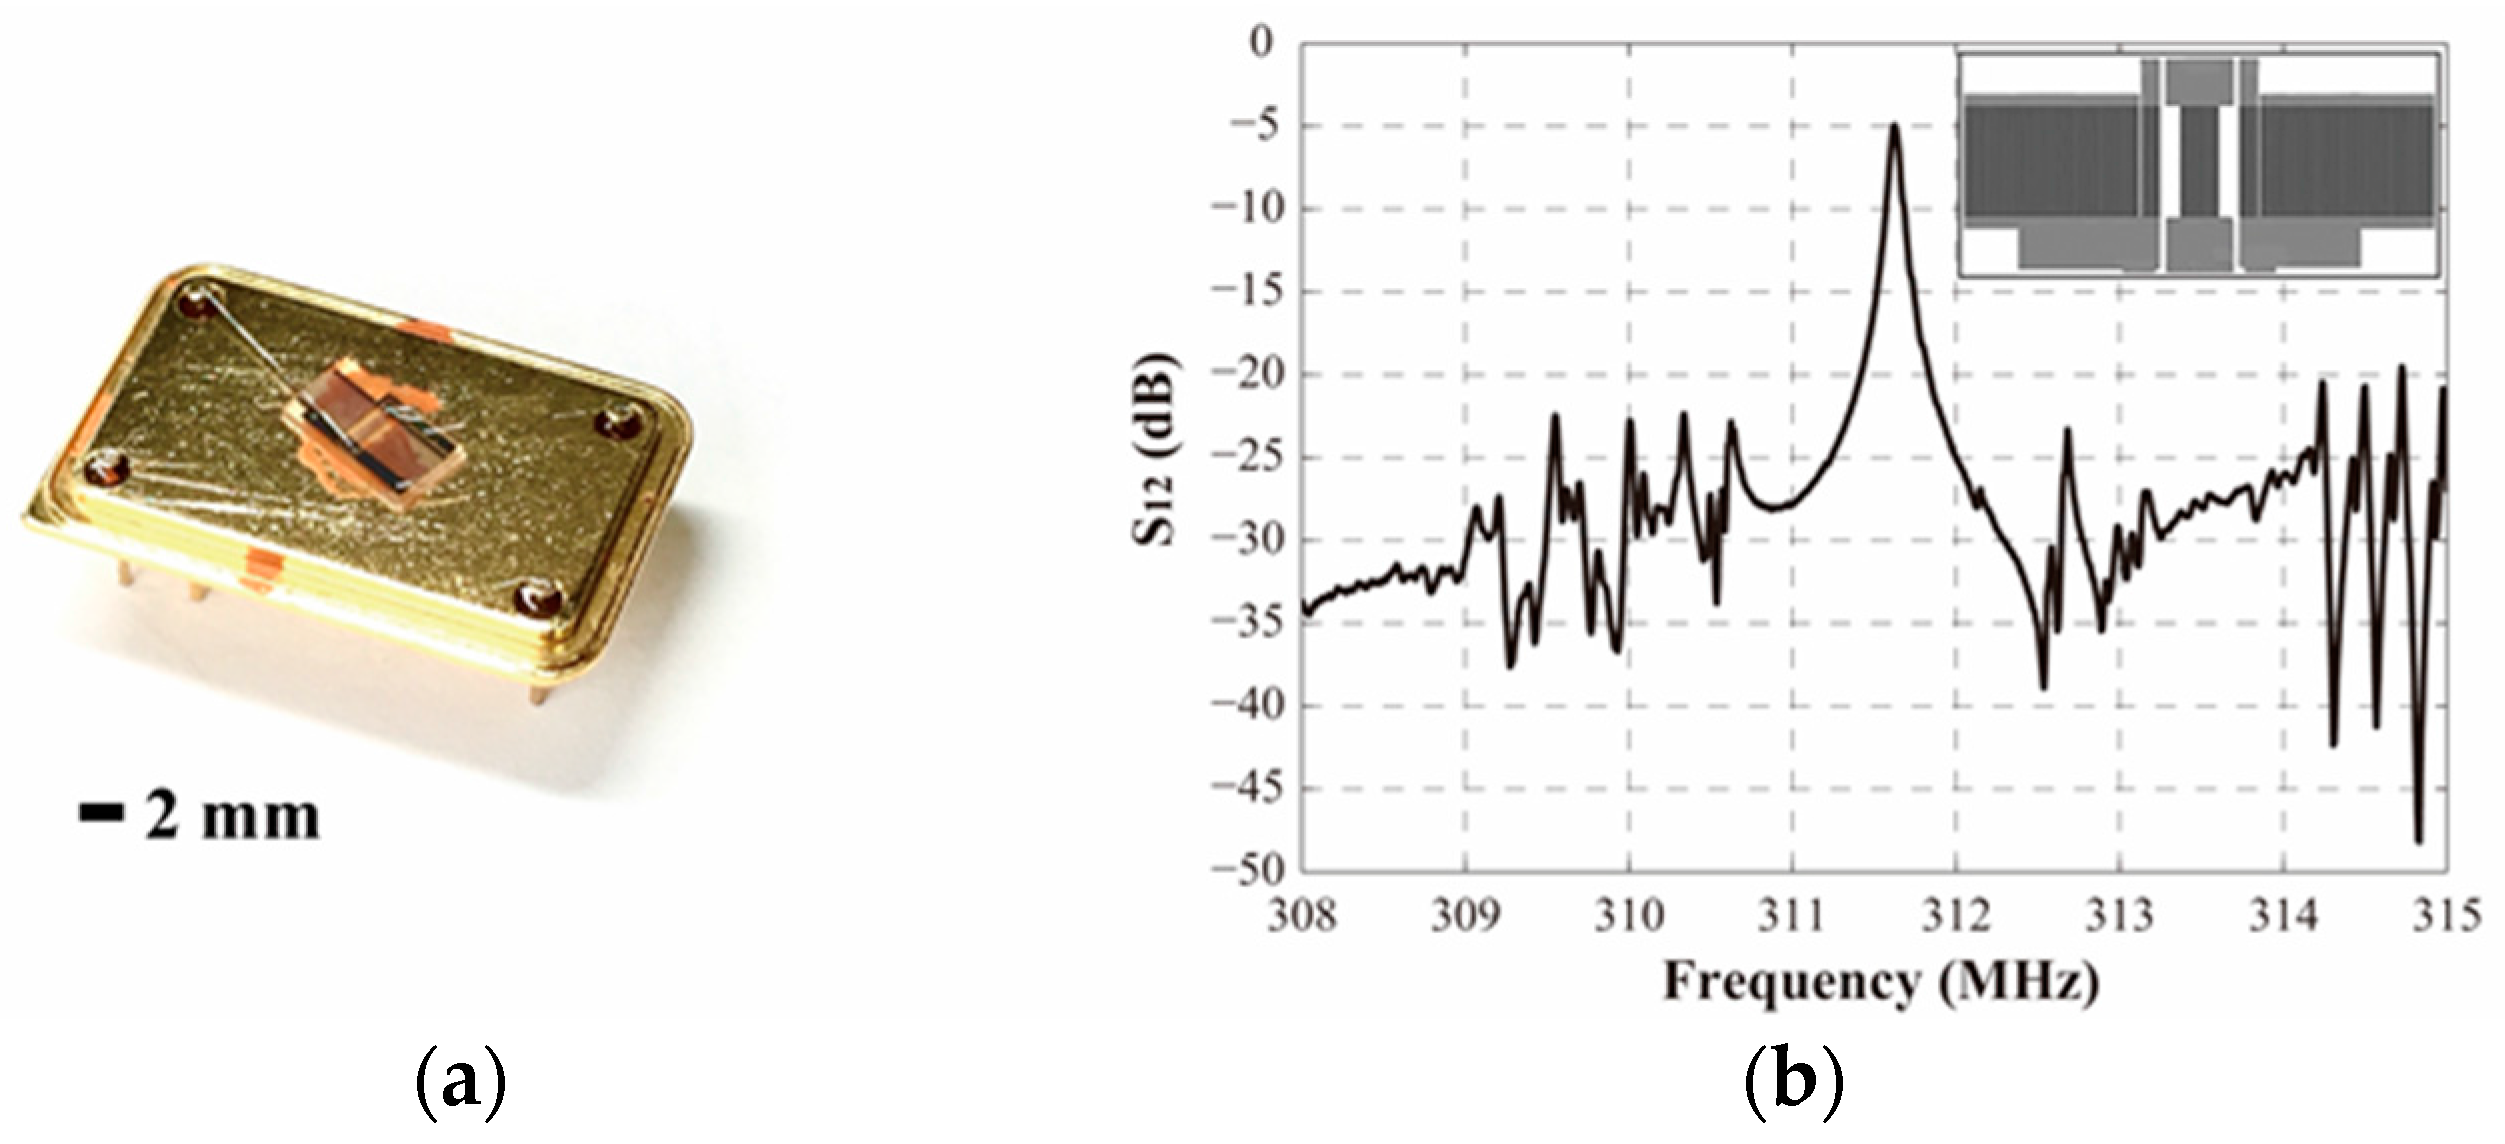
To fabricate the SAW device, a 1600 Å Al was deposited on the ST-X quartz substrate using an electron beam evaporator. Then, the PR was spin-coated, exposed and patterned for the IDTs and the adjacent shorted grating reflectors. Lastly, the Al was wet-etched and the PR was dissolved in acetone. The fabricated resonator is shown in Figure 12a. Measured by a network analyzer (E5071B, Keysight, Palo Alto, CA, USA), the frequency response S12 of the SAW resonator is shown in Figure 12b. The center frequency was 311.625 MHz, the insertion loss was 5.0 dB and the quality value was 4371.
Finally, the Peltier element and the SAW resonator were placed into the air current microchannel together to form the final detecting probe. The hot source was over against the surface of the SAW sensor chip. To guarantee sealing of the air channel, a silicone sealant was used to adhere around the cracks. Exposing the bonded probe to the air for about 24 h, the sealant was solidified continuously from within. By optimizing the fabrication process, a detecting probe was successfully prepared. Figure 13 gives a fabricated exploded detecting probe prototype, where the SAW sensor chip is inserted in the channel. The dimensions of the detecting probe were 50 mm × 15 mm × 3 mm.
3.2. SAW Oscillator
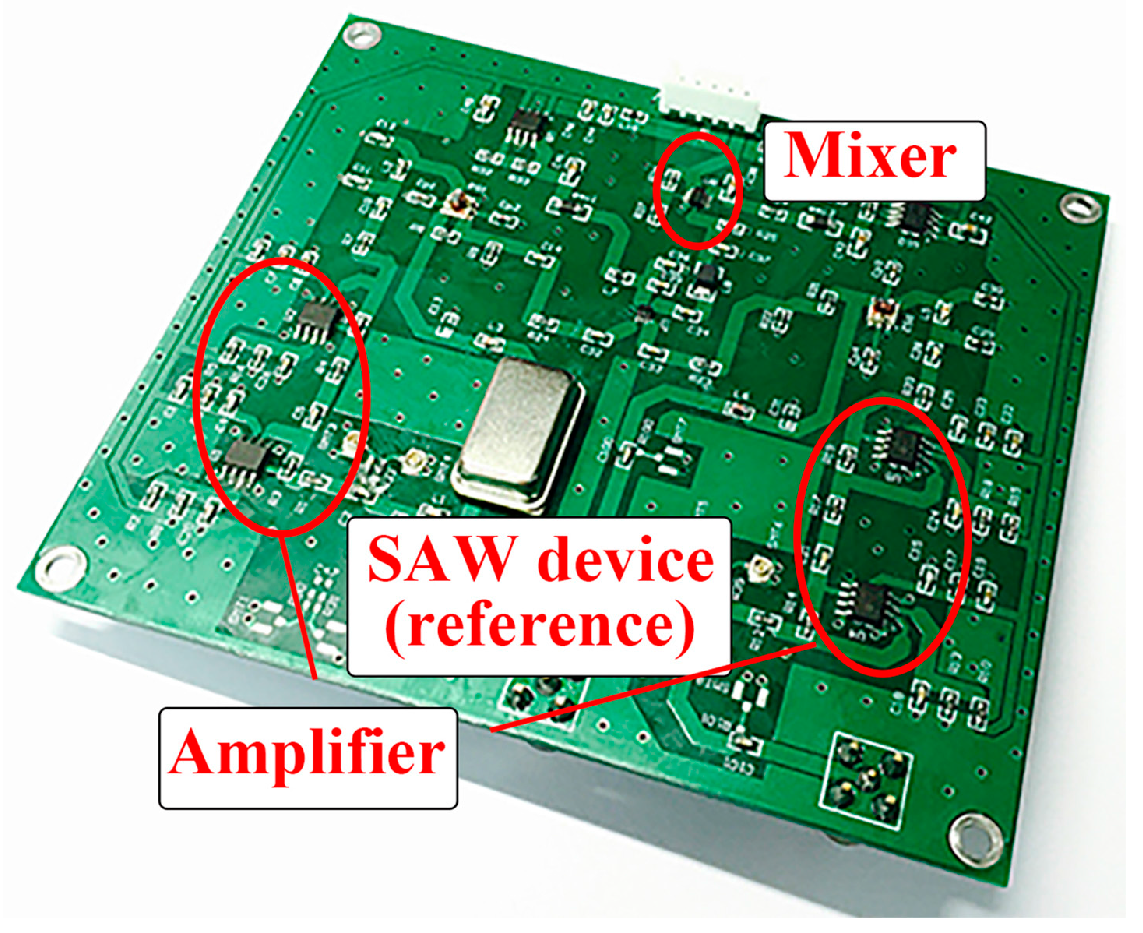
The fabricated sensor detecting probe was used as the control element of an oscillator and was connected to the oscillation circuit through a RF cable. The circuit was made of an amplifier, a phase shifter and so on. Then, the output of the amplifier was mixed in the mixer to obtain a differential frequency comparing with the referenced SAW oscillator loop, shown in Figure 14.
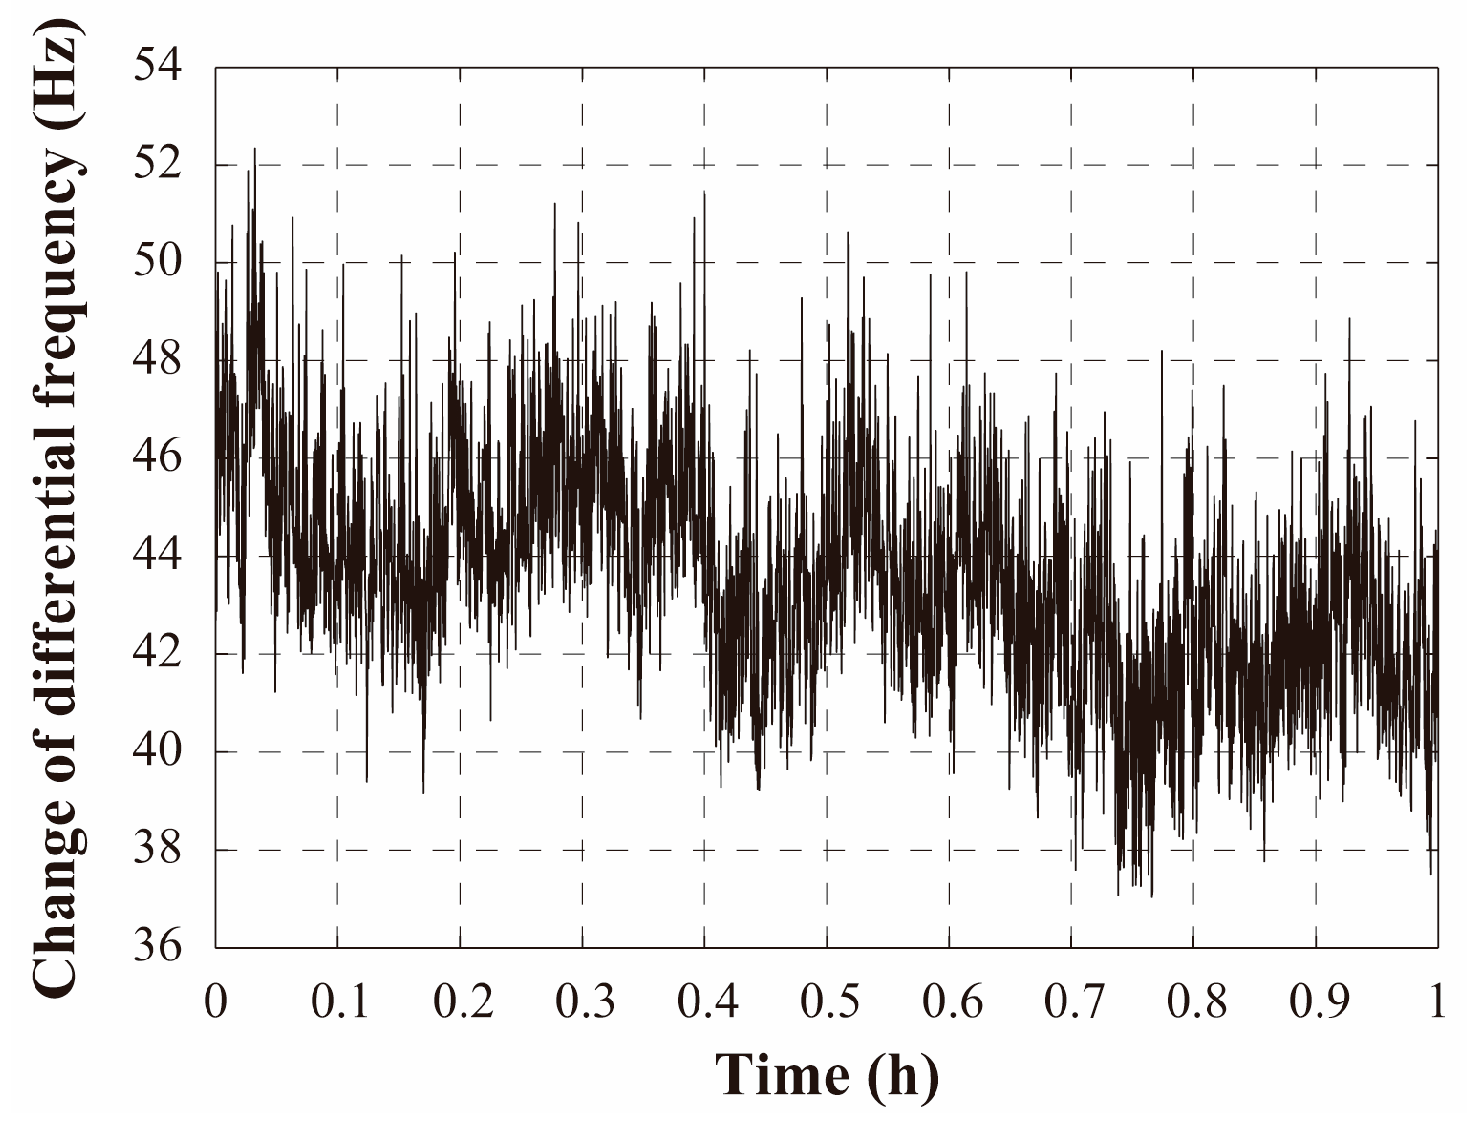
The differential frequency was picked by a programmable frequency counter and plotted by a computer in real-time. Figure 15 shows the measured medium-term frequency stability, and excellent frequency stability of 18 Hz per hour was observed.
4. Experimental Setup
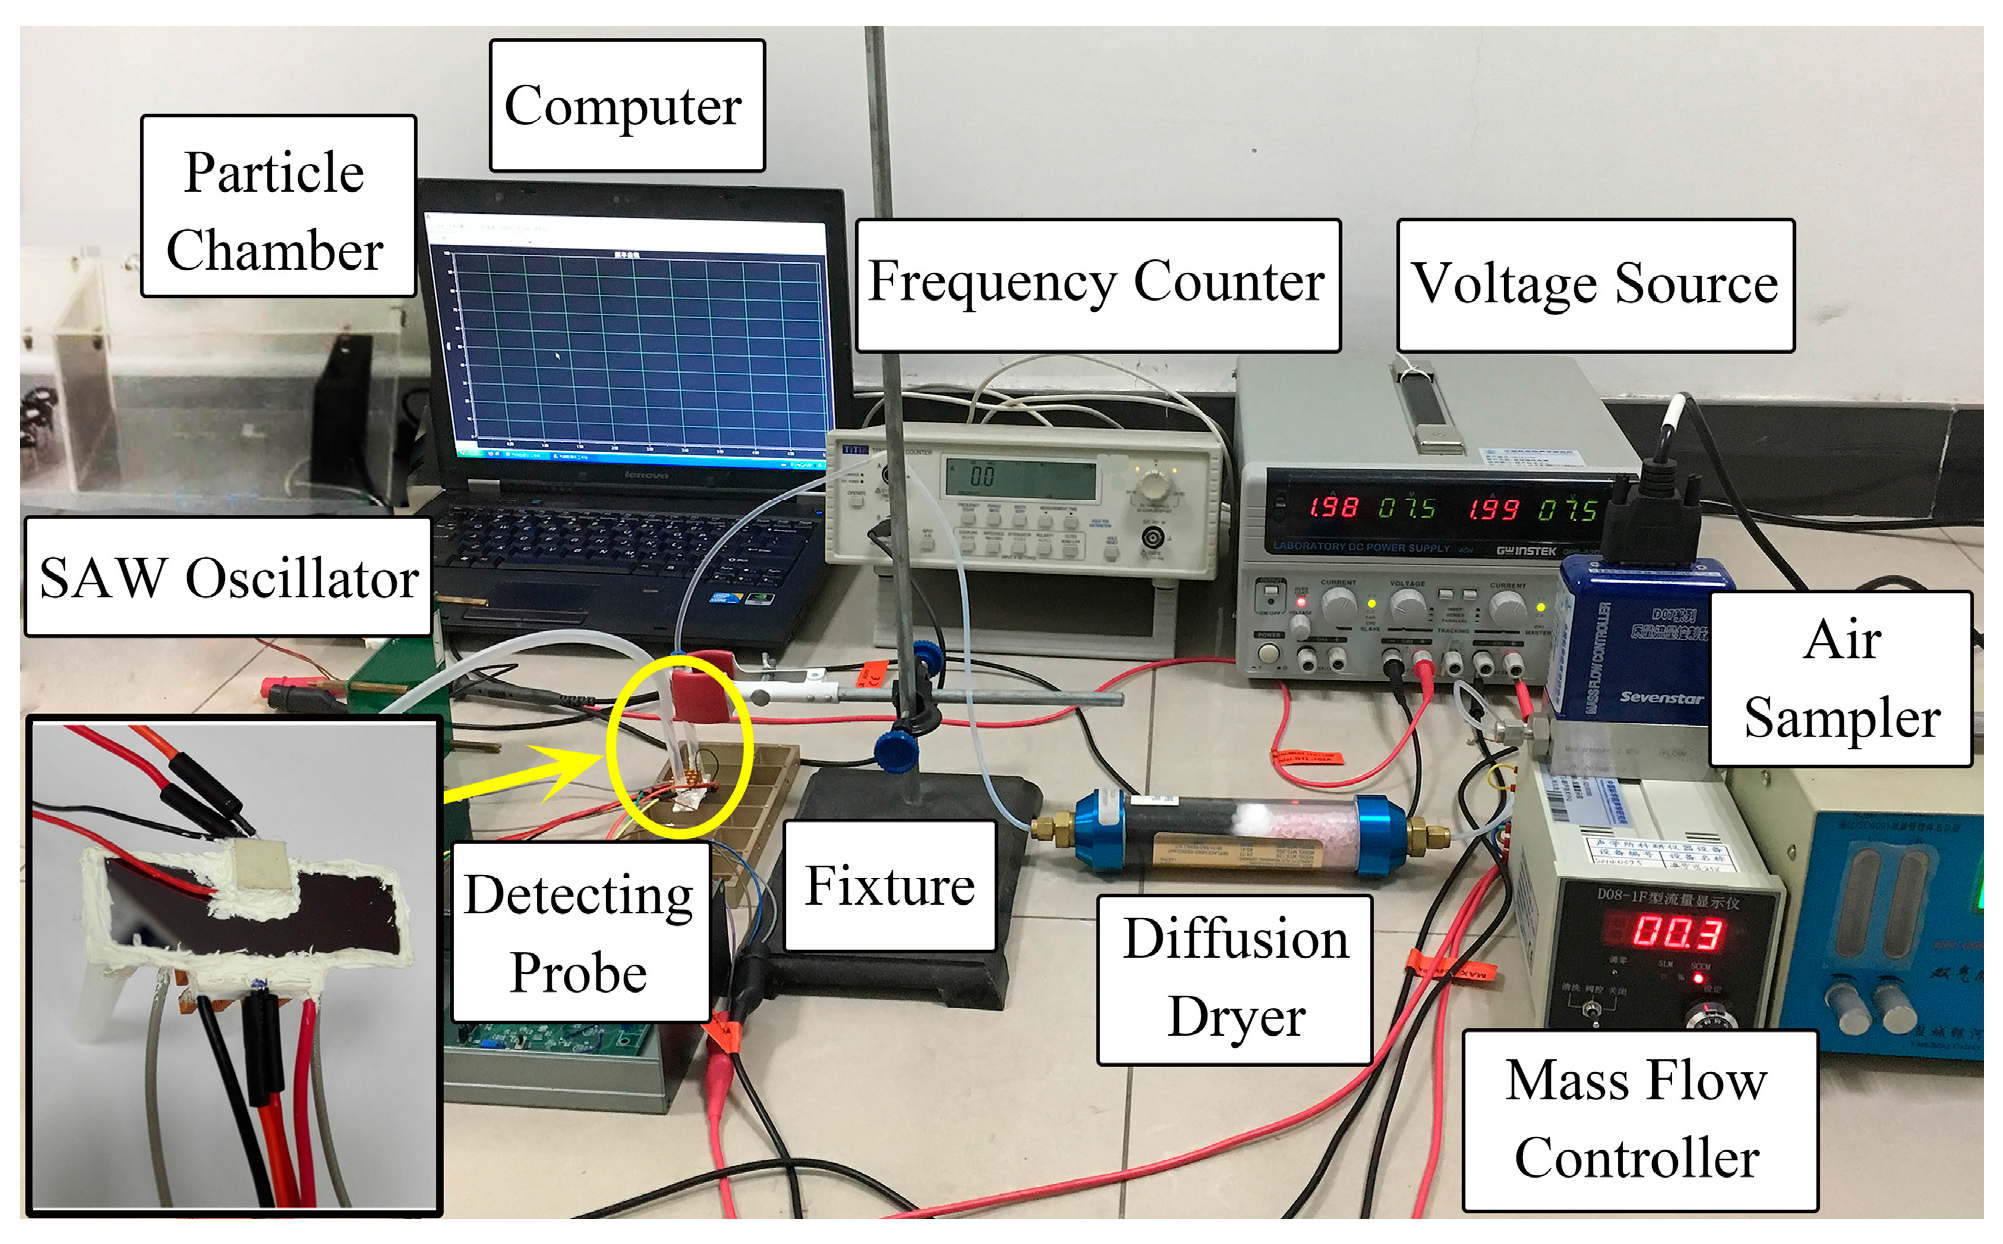
Figure 16 and Figure 17 exhibit the schematic and photograph of the experimental setup. The emitted PM was introduced into the particle chamber in the front end. In the air sampling unit, an air sampler (QCS 3000, Yancheng Galaxy Technology Co., Ltd., Yancheng, Jiangsu province, China) with a mass flow controller (D07-19B, Beijing Sevenstar Electronics Co., Ltd., Beijing, China) were used to precise control the sampling flow. A diffusion dryer was used in front of the mass flow controller to absorb the water and the residual particles. In the data processing unit, the output resonant frequency change of the SAW sensor chip was measured by a frequency counter (TF930, Aim and Thurlby Thandar Instruments, Huntingdon, Cambridgeshire, UK) and recorded in a personal computer by a custom-developed program.
Before sampling the particles, the air sampler was kept off until a stable temperature gradient was formed. When the Peltier element reached the given temperature during the heat up phase, the air sampler was turned on to sample the pure nitrogen gas to clean the channel. After about 10–15 min, when the SAW oscillator was stable and the concentration of particles in the chamber was steady, the sampling inlet was switched to the particle chamber. During the sampling, the flow rate of the mass flow controller was 13.5 mL/min and the temperature difference was 90 K. The continuous change of differential frequency was recorded to evaluate the mass concentration of PM2.5.
5. Results and Discussions
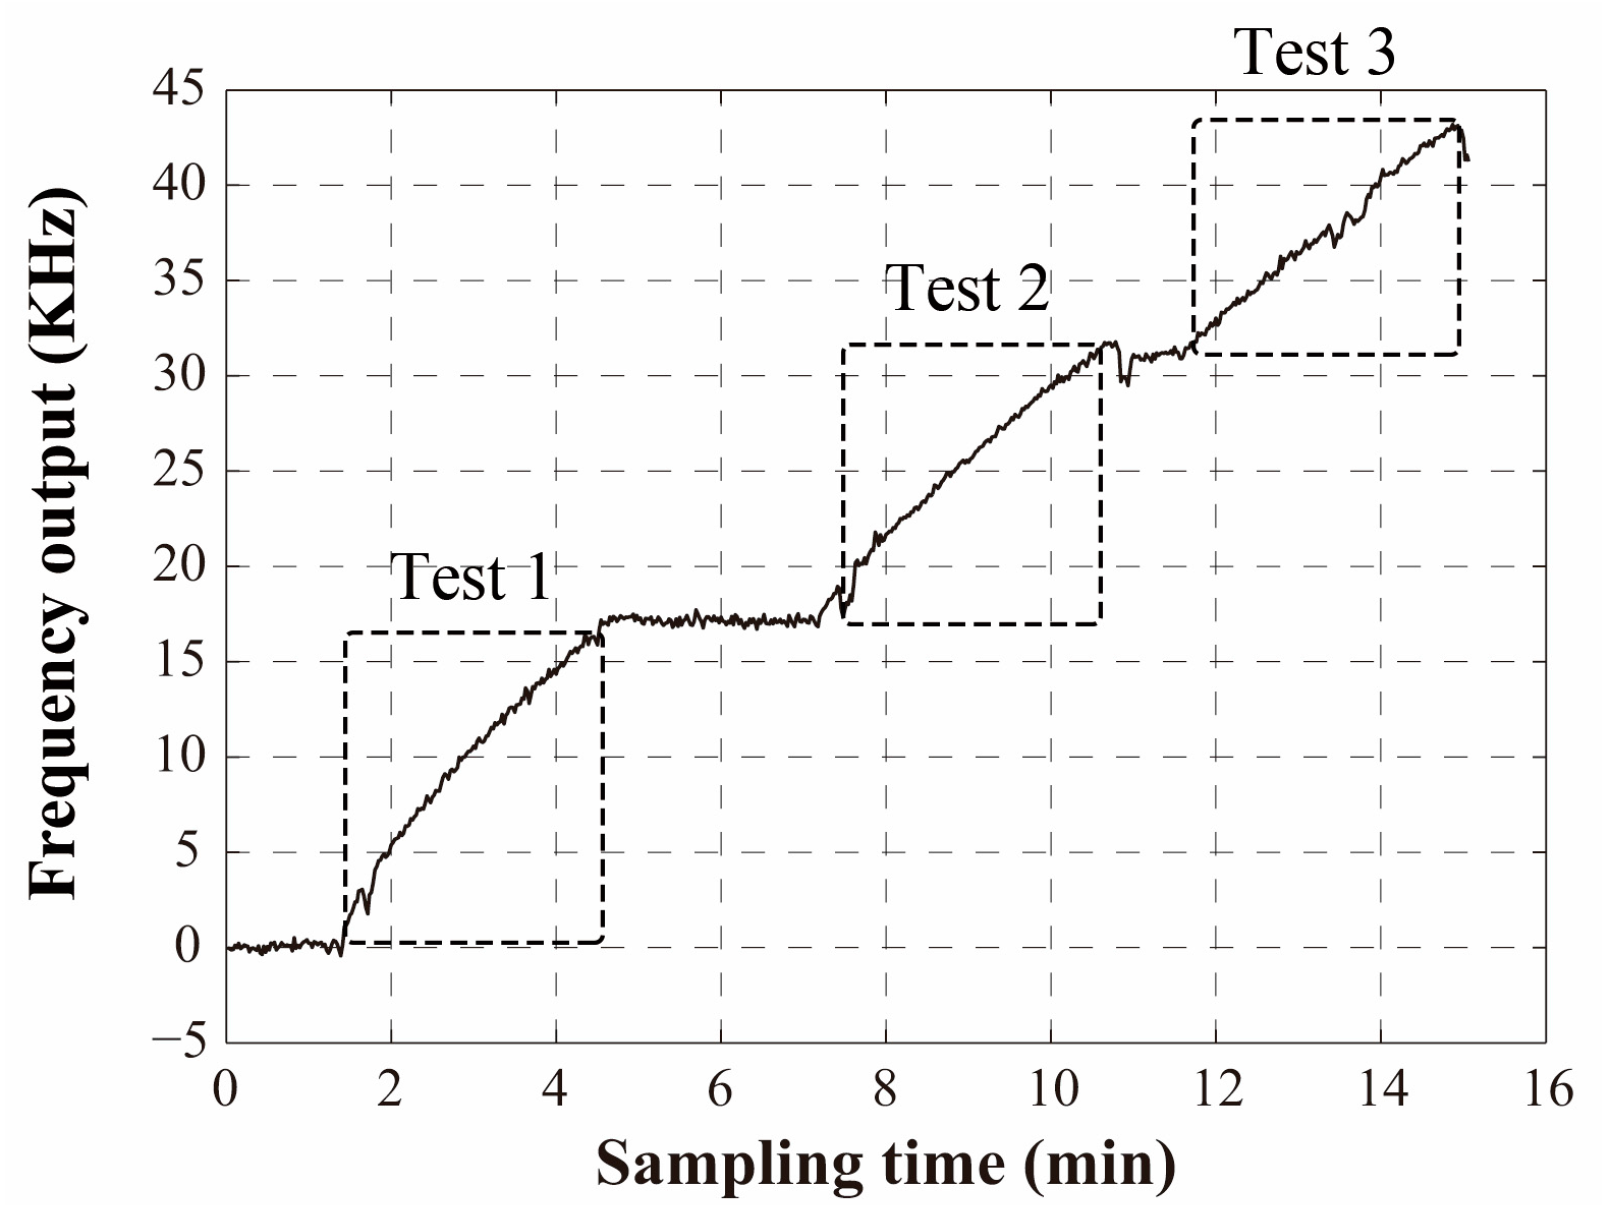
In the experiment, the monodispersed PSL particles with the diameter of 2 μm were adopted. Meanwhile, a light scattering aerosol monitor was parallel connected to the particle chamber to provide a reference. Although the light scattering method was proven inaccurate in practical application [12], in terms of the particles of known material and size, the light scattering method was accurate after calibration. In the experiments, an atomizer was used to disperse PSL particles and then mixed up uniformly by fans in the chamber. Figure 18 shows the frequency output of the SAW based PM2.5 sensor for PSL particle tests. The horizontal line areas are the intervals between sampling and the oblique line areas are the three sampling processes.
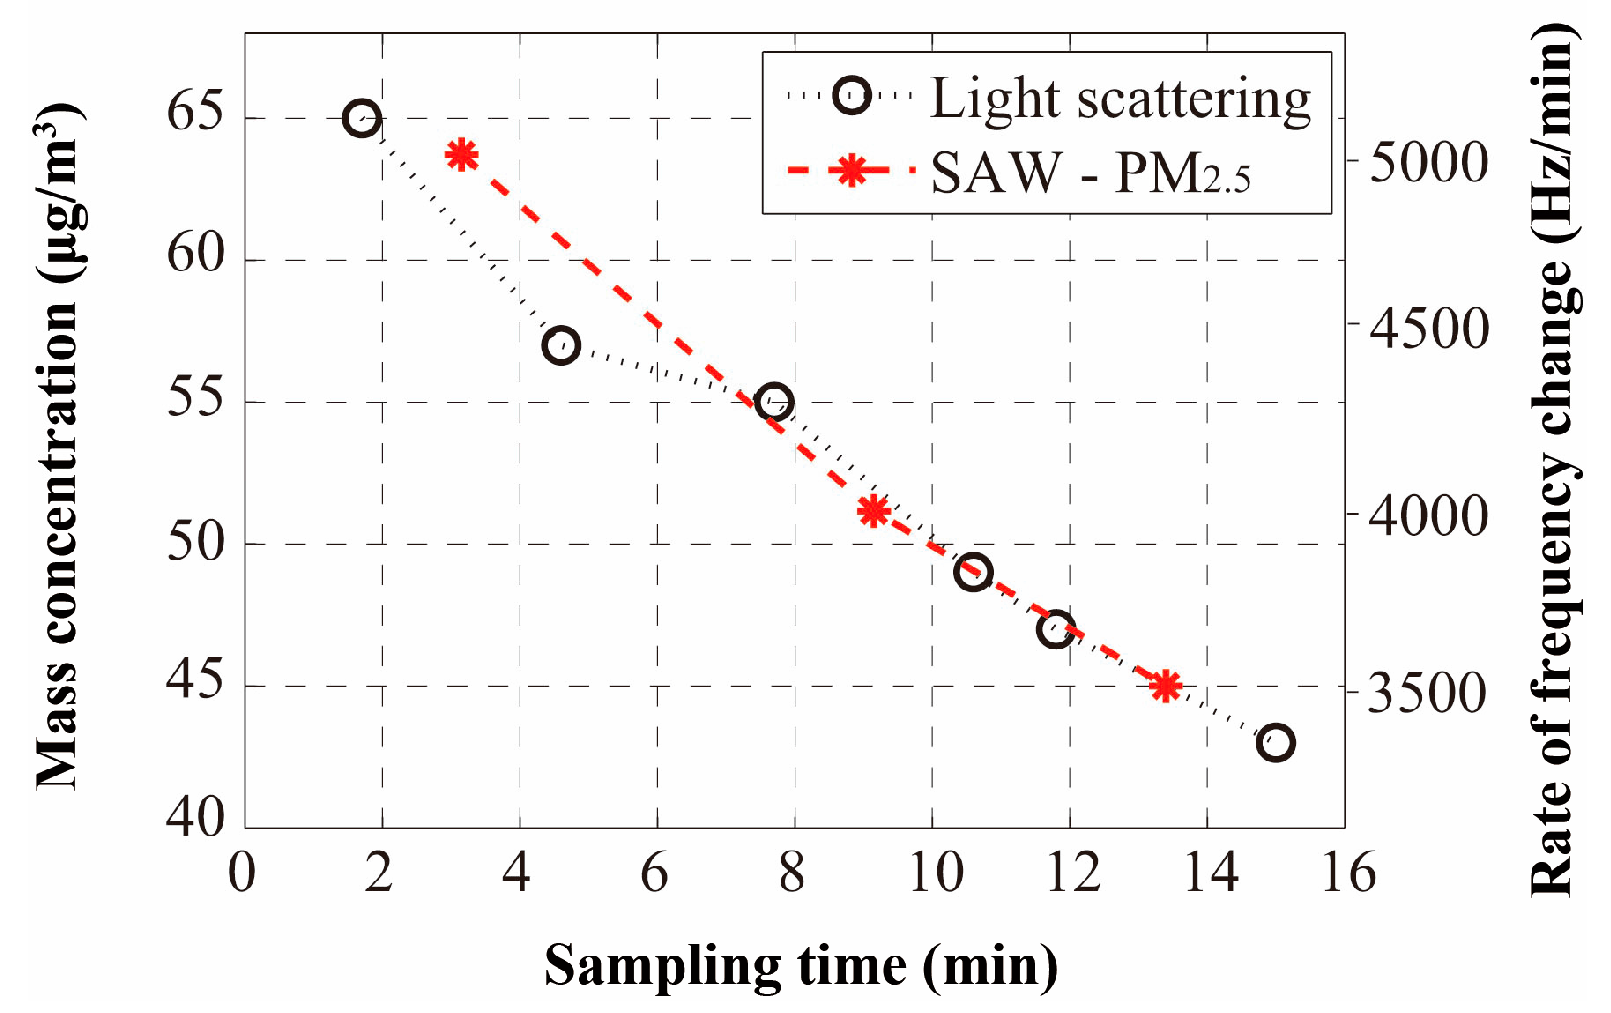
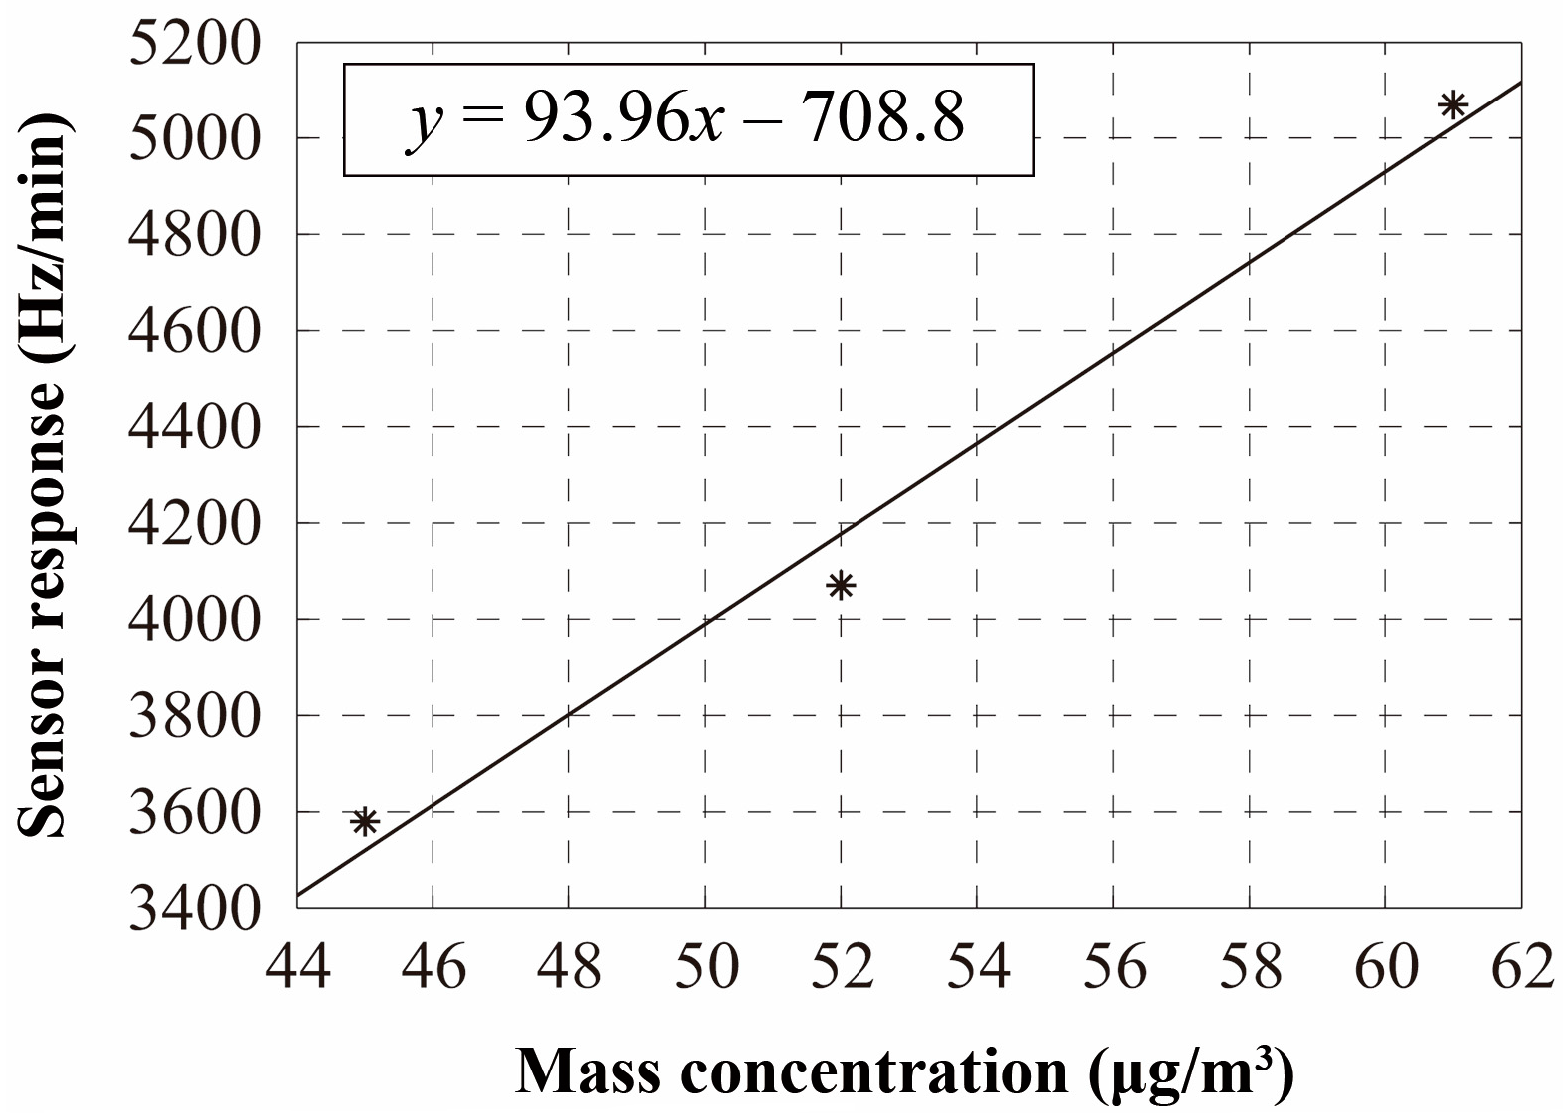
To handle the results, the slope of the oblique line is used to represent the SAW sensor response. Figure 19 gives the performance comparison between the light scattering monitor and the SAW based PM2.5 sensor for measuring PSL particles. The horizontal axis presents the sampling time. The left vertical axis presents the particle mass concentration (unit: μg/m3) measured by the light scattering monitor, and the right vertical axis presents the response of the SAW based PM2.5 sensor (unit: Hz/min). Furthermore, the curve of the SAW sensor responses changing with the particle mass concentration is shown in Figure 20. The slope of the linear fitting equation is 93.96 (Hz/min)/(μg/m3). The results show that by detecting the PSL particles with a certain diameter of 2 μm, the response of the SAW based PM2.5 sensor is linear, and in accordance with the response of the light scattering based PM2.5 monitor. To get a better view of the sensor response, an optimal data processing approach needs to be developed.
When more particles accumulate on the surface of SAW devices, the sensitivity of the SAW sensor will be worse. Therefore, to disperse the particles on the sensor, an “inverse temperature gradient” was established. In the experiment, to realize a stable temperature gradient, two Peltier elements were utilized. One was placed on the upper shell, and the other was pasted on the back of the lower shell. In the cleaning procedure, the upper Peltier element was set to low temperature, and the lower Peltier element was set to high temperature. The inverse temperature gradient was used to expel particles from the surface of the SAW device. Table 1 shows the cleaning effect of a SAW sensing device during two testing rounds, where IL represents the insertion loss and f0 represents the center frequency. The frequency responses were measured by a network analyzer. The second column shows the device performance after repeated sampling and the third column shows the device performance after cleaning. Obviously, this method was successfully applied in our experiments.
6. Conclusions
A novel surface acoustic wave (SAW) based particulate matter (PM) 2.5 sensor was successfully demonstrated. In the sensor detecting probe, a virtual impactor, a thermophoretic precipitator and a SAW sensor chip were integrated into an air current microchannel. By theoretical analysis, the optimal design parameters of the detecting probe were determined. By detecting the PM mass emitted from the monodispersed polystyrene latex particles, the results were presented. The response of the SAW based PM2.5 sensor is in accordance with the response of the light scattering based PM2.5 monitor. In our future work, the mass sensitivity of the sensor can be further improved by considering the particle distribution deposited by thermophoresis. Furthermore, a more optimized data processing method is demanded to handle the sensor’s output.
Acknowledgments
The authors gratefully acknowledge the support of the Natural Science Foundation of China (No. 11304348).
Author Contributions
All authors participated in the work presented here. Jiuling Liu defined the research topic and integrated the design. Wenchang Hao contributed the theoretical analysis and carried out most of the experiments. Yong Liang fabricated the SAW devices. Minghua Liu provided the silicon etching. Shitang He instructed from the point of theories.
Conflicts of Interest
The authors declare no conflict of interest.
References
- Gozzi, A.; Ventura, G.D.; Marcelli, A. Mobile Monitoring of Particulate Matter: State of Art and Perspectives. Atmos. Pollut. Res. 2015, 7, 228–234. [Google Scholar] [CrossRef]
- Baumgardner, D.; Brenguier, J.L.; Bucholtz, A.; Coe, H.; DeMott, P.; Garrett, T.J.; Gayet, J.F.; Hermann, M.; Heymsfield, A.; Korolev, A.; et al. Airborne Instruments to Measure Atmospheric Aerosol Particles, Clouds and Radiation: A Cook’s Tour of Mature and Emerging Technology. Atmos. Res. 2011, 102, 10–29. [Google Scholar] [CrossRef] [Green Version]
- Wilson, W.; Chow, J.C.; Claiborn, C.; Fusheng, W.; Engelbrecht, J.; Watson, J.G. Monitoring of Particulate Matter Outdoors. Chemosphere 2002, 49, 1009–1043. [Google Scholar] [CrossRef]
- McMurry, P.H. A Review of Atmospheric Aerosol Measurements. Atmos. Environ. 2000, 34, 1959–1999. [Google Scholar] [CrossRef]
- White, R.; Paprotny, I.; Doering, F.; Cascio, W.; Solomon, P.; Gundel, L. Sensors and ‘Apps’ for Community-Based Atmospheric Monitoring. Air Waste Manag. Assoc. Environ. Mag. (EM) 2012, 5, 36–40. [Google Scholar]
- Lutic, D.; Pagels, J.; Bjorklund, R.; Josza, P.; Visser, J.H.; Grant, A.W.; Johansson, M.L.; Paaso, J.; Fägerman, P.; Sanati, M. Detection of Soot Using a Resistivity Sensor Device Employing Thermophoretic Particle Deposition. J. Sens. 2010, 1, 421072. [Google Scholar]
- Carminati, M.; Pedalà, L.; Bianchi, E.; Nason, F.; Dubini, G.; Cortelezzi, L.; Ferrari, G.; Sampietro, M. Capacitive Detection of Micrometric Airborne Particulate Matter for Solid-State Personal Air Quality Monitors. Sens. Actuators A Phys. 2014, 219, 80–87. [Google Scholar] [CrossRef]
- Wasisto, H.S.; Merzsch, S.; Uhde, E.; Uhde, E.; Waag, A.; Peiner, E. Handheld Personal Airborne Nanoparticle Detector Based on Microelectromechanical Silicon Resonant Cantilever. Microelectron. Eng. 2015, 145, 96–103. [Google Scholar] [CrossRef]
- Thomas, S.; Cole, M.; Villa-López, F.H.; Gardner, J.W. High Frequency Surface Acoustic Wave Resonator-Based Sensor for Particulate Matter Detection. Sens. Actuators A Phys. 2016, 244, 138–145. [Google Scholar] [CrossRef]
- Lin, C.M.; Chen, Y.Y.; Felmetsger, V.V.; Senesky, D.G.; Pisano, A.P. AlN/3C–SiC Composite Plate Enabling High-Frequency and High-Q Micromechanical Resonators. Adv. Mater. 2012, 24, 2722–2727. [Google Scholar] [CrossRef] [PubMed]
- Lin, C.M.; Yen, T.T.; Lai, Y.J.; Felmetsger, V.V.; Hopcroft, M.A.; Kuypers, J.H.; Pisano, A.P. Temperature-Compensated Aluminum Nitride Lamb Wave Resonators. IEEE Trans. Ultrason. Ferroelectr. Freq. Control 2010, 57, 524–532. [Google Scholar] [PubMed]
- Wang, Y.; Li, J.; Jing, H.; Zhang, Q.; Jiang, J.; Biswas, P. Laboratory Evaluation and Calibration of Three Low-Cost Particle Sensors for Particulate Matter Measurement. Aerosol Sci. Technol. 2015, 49, 1063–1077. [Google Scholar] [CrossRef]
- Paprotny, I.; Doering, F.; Solomon, P.A.; White, R.M.; Gundel, L. Microfabricated Air-Microfluidic Sensor for Personal Monitoring of Airborne Particulate Matter: Design, Fabrication, and Experimental Results. Sens. Actuators A Phys. 2013, 201, 506–516. [Google Scholar] [CrossRef]
- Garcíagancedo, L.; Milne, W.I.; Luo, J.K.; Flewitt, A.J. Sensors based on SAW and FBAR technologies. Proc. SPIE 2013, 8793. [Google Scholar] [CrossRef]
- Zhao, J.; Liu, M.; Liang, L.; Wang, W.; Xie, J. Airborne Particulate Matter Classification and Concentration Detection Based on 3D Printed Virtual Impactor and Quartz Crystal Microbalance Sensor. Sens. Actuators A Phys. 2016, 238, 379–388. [Google Scholar] [CrossRef]
- Jiang, J.K.; Deng, J.G.; Duan, L.; Zhang, Q.; Li, Z.; Chen, X.T.; Li, X.H.; Hao, J.M. Development of a Two Stage Virtual Impactor for Stationary Source PM10 and PM2.5 Sampling. Environ. Sci. 2014, 35, 3639–3643. [Google Scholar]
- Kim, Y.H.; Maeng, J.Y.; Park, D.; Jung, I.H.; Hwang, J.; Kim, Y.J. Micromachined Cascade Virtual Impactor with a Flow Rate Distributor for Wide Range Airborne Particle Classification. Appl. Phys. Lett. 2007, 91, 043512. [Google Scholar] [CrossRef]
- Loo, B.W.; Cork, C.P. Development of High Efficiency Virtual Impactors. Aerosol Sci. Technol. 1988, 9, 167–176. [Google Scholar] [CrossRef]
- Messerer, A.; Niessner, R.; Pöschl, U. Thermophoretic Deposition of Soot Aerosol Particles under Experimental Conditions Relevant for Modern Diesel Engine Exhaust Gas Systems. J. Aerosol Sci. 2003, 34, 1009–1021. [Google Scholar] [CrossRef]
- Saputra; Geelhoed, P.F.; Goosen, J.F.L.; Lindken, R.; Westerweel, J.; van Keulen, F. Microfabricated Thermal Gradient Separator Device. In Proceedings of the ASME 2009 2nd International Conference on Micro/Nanoscale Heat & Mass Transfer International, Shanghai, China, 18–21 December 2009; pp. 379–386. [Google Scholar]
- Wang, B.; Tao, S.; Chen, D.R. A Cylindrical Thermal Precipitator with a Particle Size-Selective Inlet. Aerosol Sci. Technol. 2012, 46, 1227–1238. [Google Scholar] [CrossRef]
- Tsai, C.J.; Lu, H.C. Design and Evaluation of a Plate-to-Plate Thermophoretic Precipitator. Aerosol Sci. Technol. 1995, 22, 172–180. [Google Scholar] [CrossRef]
- Hao, W.C.; Liu, J.L.; Liu, M.H.; He, S.T. Development of a new surface acoustic wave based PM2.5 monitor. In Proceedings of the 2014 Symposium on Piezoelectricity, Acoustic Waves and Device Applications, Beijing, China, 30 October–2 November 2014; pp. 52–55. [Google Scholar]
- Liu, J.L.; Wang, W.; Li, S.Z.; Liu, M.H.; He, S.T. Advances in SAW Gas Sensors Based on the Condensate-Adsorption Effect. Sensors 2011, 11, 11871–11884. [Google Scholar] [CrossRef] [PubMed]
- Plessky, V.; Koskela, J. Coupling-of-Modes Analysis of SAW Devices. Int. J. High Speed Electron. Syst. 2000, 10, 867–947. [Google Scholar] [CrossRef]
- Wang, W.; Xue, X.F.; Huang, Y.Q.; Liu, X.L. A Novel Wireless and Temperature-Compensated SAW Vibration Sensor. Sensors 2014, 14, 20702–20712. [Google Scholar] [CrossRef] [PubMed]
- Hao, W.C.; Liu, J.L.; Liu, M.H.; Yong, L.; He, S.T. Mass sensitivity optimization of a surface acoustic wave sensor incorporating a resonator configuration. Sensors 2016, 16, 562. [Google Scholar] [CrossRef] [PubMed]
- Azong-Wara, N.; Asbach, C.; Stahlmecke, B.; Fissan, H.; Kaminski, H.; Plitzko, S.; Bathen, D.; Kuhlbusch, T. Design and Experimental Evaluation of a New Nanoparticle Thermophoretic Personal Sampler. J. Nanopart. Res. 2013, 15, 1–12. [Google Scholar] [CrossRef]
Figure 1.
Schematic of the surface acoustic wave (SAW) based PM2.5 sensor.

Figure 2.
Exploded view of the detecting probe.

Figure 3.
Cross-sectional view of the virtual impactor.

Figure 4.
Velocity field distribution of the virtual impactor.

Figure 5.
Collection efficiency curve of the virtual impactor.

Figure 6.
Schematic of the deposition principle of thermophoresis [20].
Figure 6.
Schematic of the deposition principle of thermophoresis [20].

Figure 7.
Thermophoretic coefficient Kth with different particle radius R in a semi-logarithmic coordinate.
Figure 7.
Thermophoretic coefficient Kth with different particle radius R in a semi-logarithmic coordinate.

Figure 8.
Thermophoretic precipitator dimensions for particles of 2.5 μm diameter under 100% deposition efficiency condition.
Figure 8.
Thermophoretic precipitator dimensions for particles of 2.5 μm diameter under 100% deposition efficiency condition.

Figure 9.
Schematic of a three-transducer-structure surface acoustic wave (SAW) resonator.

Figure 10.
Frequency response of the SAW resonator.

Figure 11.
Photograph of a fabricated air current microchannel: (a) the upper shell; (b) the lower shell.
Figure 11.
Photograph of a fabricated air current microchannel: (a) the upper shell; (b) the lower shell.

Figure 12.
Fabricated SAW resonator: (a) photograph; (b) measured frequency response.

Figure 13.
Photograph of a fabricated exploded sensor detecting probe: (a) the upper shell; (b) the lower shell.
Figure 13.
Photograph of a fabricated exploded sensor detecting probe: (a) the upper shell; (b) the lower shell.

Figure 14.
Photograph of a fabricated dual-port SAW oscillator.

Figure 15.
Measured medium-term frequency stability of the SAW oscillator.

Figure 16.
Experimental setup for evaluating the characteristics of the SAW based PM2.5 sensor.
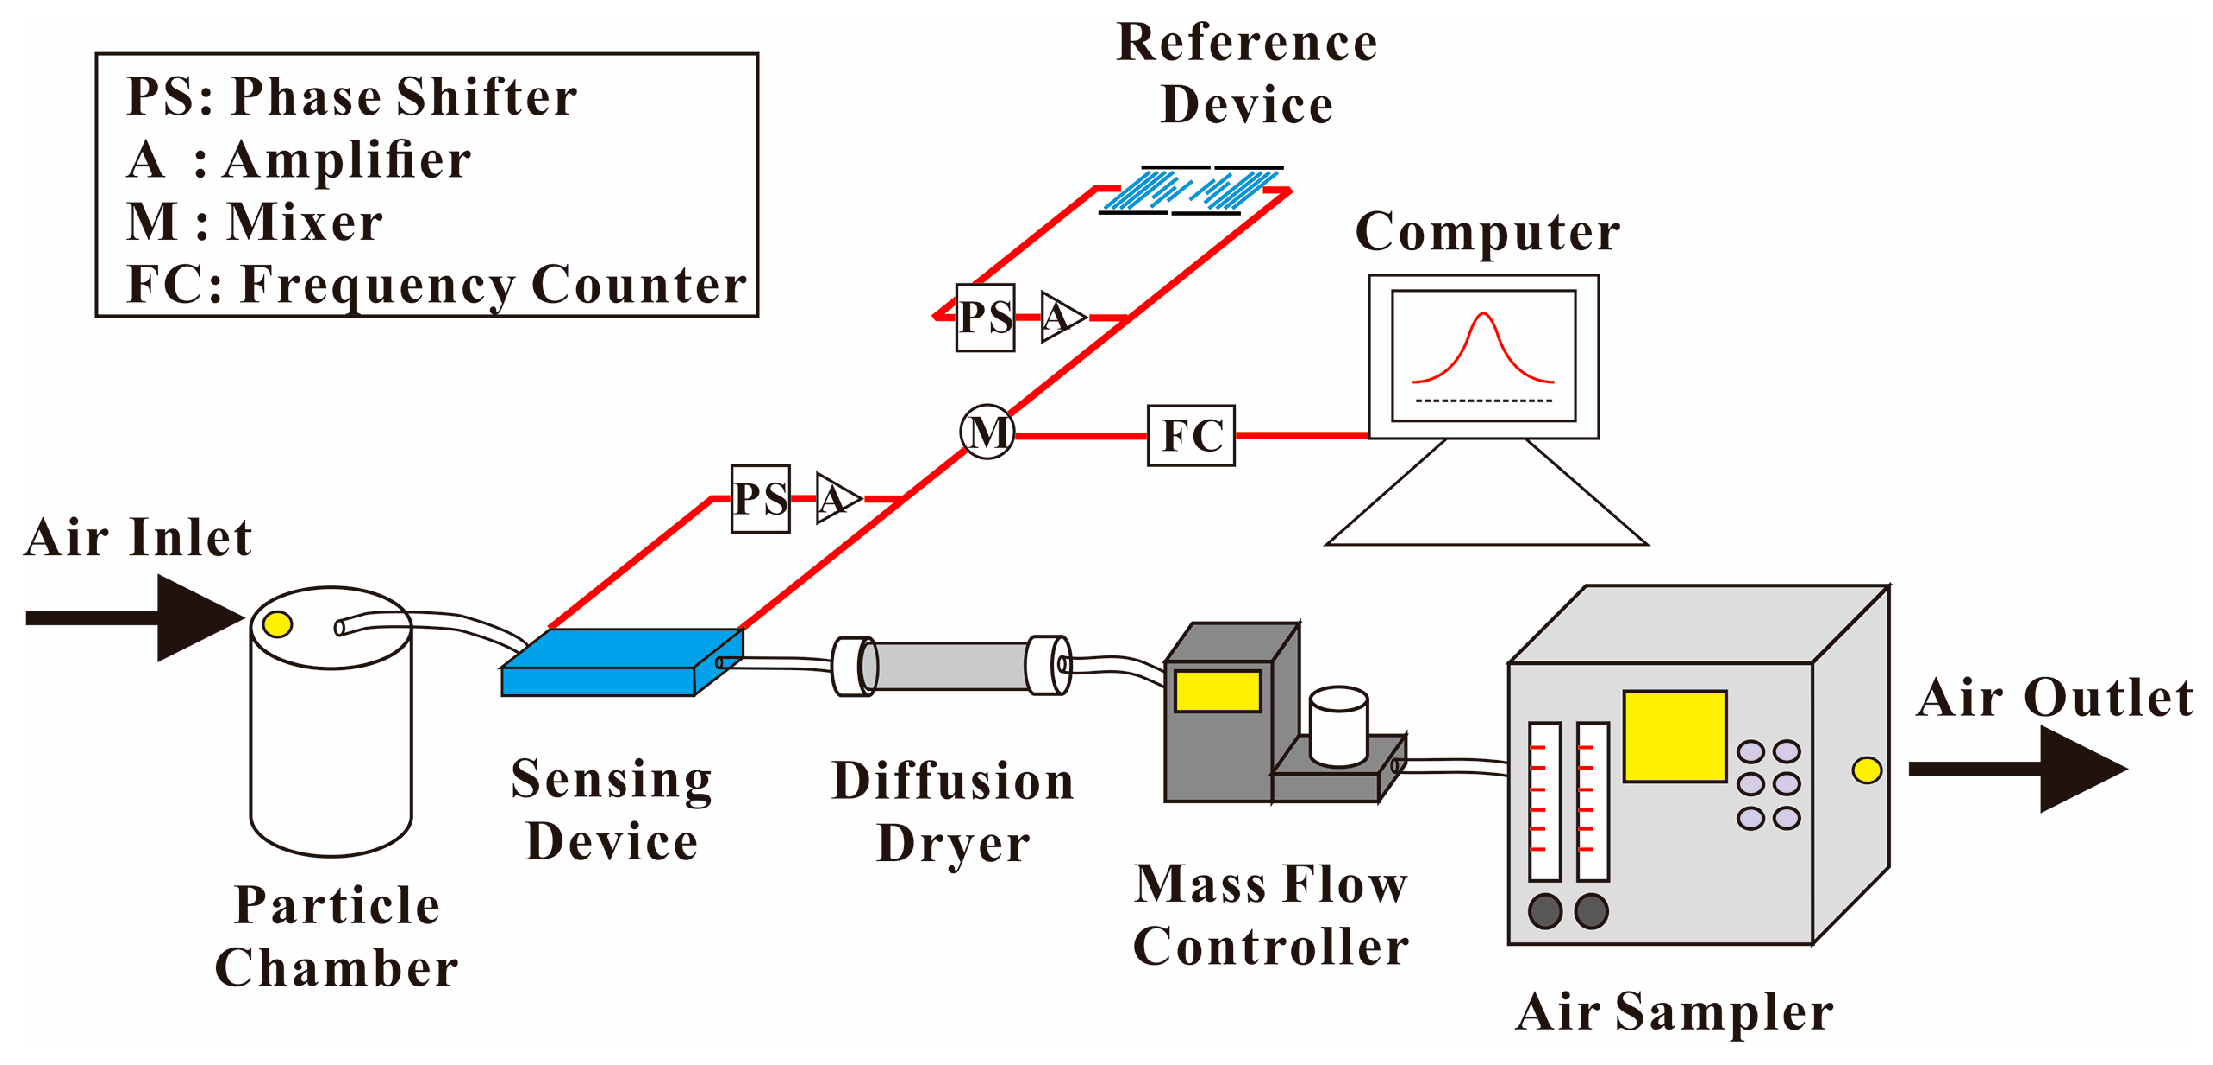
Figure 17.
Photograph of the experimental setup.

Figure 18.
Frequency output of the SAW based PM2.5 sensor for polystyrene latex (PSL) particle tests.
Figure 18.
Frequency output of the SAW based PM2.5 sensor for polystyrene latex (PSL) particle tests.

Figure 19.
Sensor response comparison between the light scattering monitor and the SAW based PM2.5 sensor for PSL particles sampling.
Figure 19.
Sensor response comparison between the light scattering monitor and the SAW based PM2.5 sensor for PSL particles sampling.

Figure 20.
SAW based PM2.5 sensor response changes with the particle mass concentration.


Table 1.
Cleaning effect of a SAW sensing device during two testing rounds.
| Testing Round | Device Performance (Before Sampling) | Device Performance (After Repeated Sampling) | Device Performance (After Cleaning) |
|---|---|---|---|
| 1 | IL: 7.7 dB | IL: 11.0 dB | IL: 8.18 dB |
| f0: 311.925 MHz | f0: 311.862 MHz | f0: 311.894 MHz | |
| 2 | IL: 8.18 dB | IL: 13 dB | IL: 8.17 dB |
| f0: 311.894 MHz | f0: 311.769 MHz | f0: 311.893 MHz |
© 2018 by the authors. Licensee MDPI, Basel, Switzerland. This article is an open access article distributed under the terms and conditions of the Creative Commons Attribution (CC BY) license (http://creativecommons.org/licenses/by/4.0/).
Share and Cite
MDPI and ACS Style
Liu, J.; Hao, W.; Liu, M.; Liang, Y.; He, S. A Novel Particulate Matter 2.5 Sensor Based on Surface Acoustic Wave Technology. Appl. Sci. 2018, 8, 82. https://doi.org/10.3390/app8010082
AMA Style
Liu J, Hao W, Liu M, Liang Y, He S. A Novel Particulate Matter 2.5 Sensor Based on Surface Acoustic Wave Technology. Applied Sciences. 2018; 8(1):82. https://doi.org/10.3390/app8010082
Chicago/Turabian StyleLiu, Jiuling, Wenchang Hao, Minghua Liu, Yong Liang, and Shitang He. 2018. "A Novel Particulate Matter 2.5 Sensor Based on Surface Acoustic Wave Technology" Applied Sciences 8, no. 1: 82. https://doi.org/10.3390/app8010082
Note that from the first issue of 2016, this journal uses article numbers instead of page numbers. See further details here.