Prediction of Damage to the Vehicle Underbody due to Stone Chipping

1
Electric Powertrain R&D Center, Korea Automotive Technology Institute, 201 Gwahakseo-ro, Guji-myon, Dalseong-gum, Daegu 43011, Korea
2
Department of Mechanical Engineering, Sogang University, 35 Baekbeom-ro, Mapo-gu, Seoul 04107, Korea
*
Author to whom correspondence should be addressed.
Appl. Sci. 2018, 8(10), 1805; https://doi.org/10.3390/app8101805
Submission received: 31 August 2018
/
Revised: 22 September 2018
/
Accepted: 28 September 2018
/
Published: 2 October 2018
(This article belongs to the Special Issue Fault Detection and Diagnosis in Mechatronics Systems)
Abstract
:In these days, there is a paradigm shift from internal-combustion-engine vehicles to electric vehicles. Most electric vehicles developed include batteries mounted at the bottom, near the rear wheels. Hence, the robust design of underbody parts against the impact of external bodies or random stone chipping needs to be made. In this study, the mathematical modeling and statistical probability analysis of stone chipping and tire slip are performed for identifying and confirming the critical zones of the vehicle underbody that may be damaged by stone chipping. Thereby, stone chipping can be predicted by simulations using the employed mathematical model, before conducting experimental verification using the existing methods. Furthermore, the development cost and time can be reduced because the elements of the designed underbody can be analyzed for robustness, and the safety factor can be established during the design stage.
1. Introduction
In automobile development, a powertrain system change necessitates the design of modified peripherals, a revised layout, and a corresponding fuel system. There is no denying that electric vehicles will replace internal-combustion-engine vehicles in the coming decades. Most electric vehicles developed include a lithium-ion battery pack mounted at the underbody. When a lithium-ion battery is pierced, the lithium usually reacts with air, causing a fire or explosion [1]. Therefore, the severe design considerations of underbody shield against the impact of external bodies or random stone chipping needs to be made. As the driving performance of newly developed automobiles is rapidly improving and the maximum driving speed is gradually increasing, aerodynamic noise, vibration and harshness (NVH) become significant in passenger vehicles [2]. Moreover, most public roads, other than toll expressways, are difficult to maintain, and roads damaged by aging due to seasonal changes are rapidly destroyed. A driving vehicle is often in contact with the stones or gravel spattered by its own or the preceding vehicles. Dropped objects that pass under vehicle tires on aged roads continuously impact the underbody, which mainly protects the engine and powertrain, and the lower parts of vehicles. In addition, impact with massive objects damage the underbody relatively faster, leading to functional loss. The cumulative fracturing caused by these various impacts is called stone chipping, which results in long-term damage to the exterior and components of vehicles.
The stone chipping problem can be passively solved by applying electroplating and ceramic coating for protecting the large body chassis against external impact [3]. However, it is difficult to design the external parts of a vehicle and set the safety factor for the parts exposed to the external environment. Unlike internal combustion engine driven vehicles, electric and hydrogen-fueled vehicles have underbody spaces that are mostly occupied by batteries and fuel cells. Thus, underbody damage can lead to the loss of vehicle function, and if a fire develops in an extreme case, passenger safety cannot be guaranteed. Thus, as a countermeasure, the critical zones need to be analyzed for deriving a prediction model, and the underbody and batteries must be robustly designed to protect against stone chipping.
Vadori [4] proposed a mathematical model for stone chipping and investigated its effects on the underbody parts by performing simulations using the model. However, the definition of the tire model was assumed to be a cylinder. Additionally, the variables of the mathematical model, such as the vehicle driving speed, the friction of tire and the air pressure, did not express the real driving environments. Razin et al. [5] analyzed the damage tendency of the vehicle coating system by stone chipping considering several factors, such as the coating thickness, the number of layers and the chipping angle. There was good correlation between the results of image processing and the parameters extracted from an electrochemical impedance spectroscopy after stone chipping tests. Yoon et al. [6] studied the external impact resistances and tendencies of plastic underbody parts, such as the transmission oil pan, muffler housing, and fuel system protector. Shang et al. [7] developed a mathematical model for the external impact of vehicle wheels, and conducted research and analyses, using it for verification. Russo proposed a model for experimental verification, and compared the analytical and experimental results obtained according to the test criteria [8]. Furthermore, a study was conducted to determine the parameters by adjusting the shell structure, boundary conditions, and impact body speed for analyzing the response of a shell plate element to low-speed impact using commercial software [9]. In addition, Botev et al. [10] proposed a nonparametric kernel density estimation method based on the plane characteristics of the linear distribution method. Ben-Ami et al. [11] numerically analyzed the shear energies of soft materials generated by the collision of solid particles, considering the incident angle, shape, and speed of the particles.
In this study, a mathematical model was developed for stone chipping and the kinetic energy was generated as a function of the tire contact area and environment. The density distribution was analyzed using the Gaussian kernel density estimator by identifying the stone hit points on the vehicle underbody. Using this statistical pattern analysis, the areas of the underbody at risk were established and the course necessary to achieve robust design was determined. Furthermore, the impact factors affecting stone chipping were analyzed by numerical analysis, using a commercial software MATLAB, and by applying the impact body analysis method employed in previous studies [9,11].
2. Definition and Prediction of Stone Chipping
2.1. Tire Geometry and Numerical Model
In a typical road environment, an automobile may drive over dropped objects or stones above a certain size or weight. To predict the impact area and energy that may be transmitted to the underbody of the vehicle resulting from tire slip, mathematical models for the initial slip speed and progression direction in stone chipping were analyzed in this study. A statistical model, based on the established mathematical model, was applied to predict the areas where impact could occur, as well as the kinetic and impact energies of the stones.
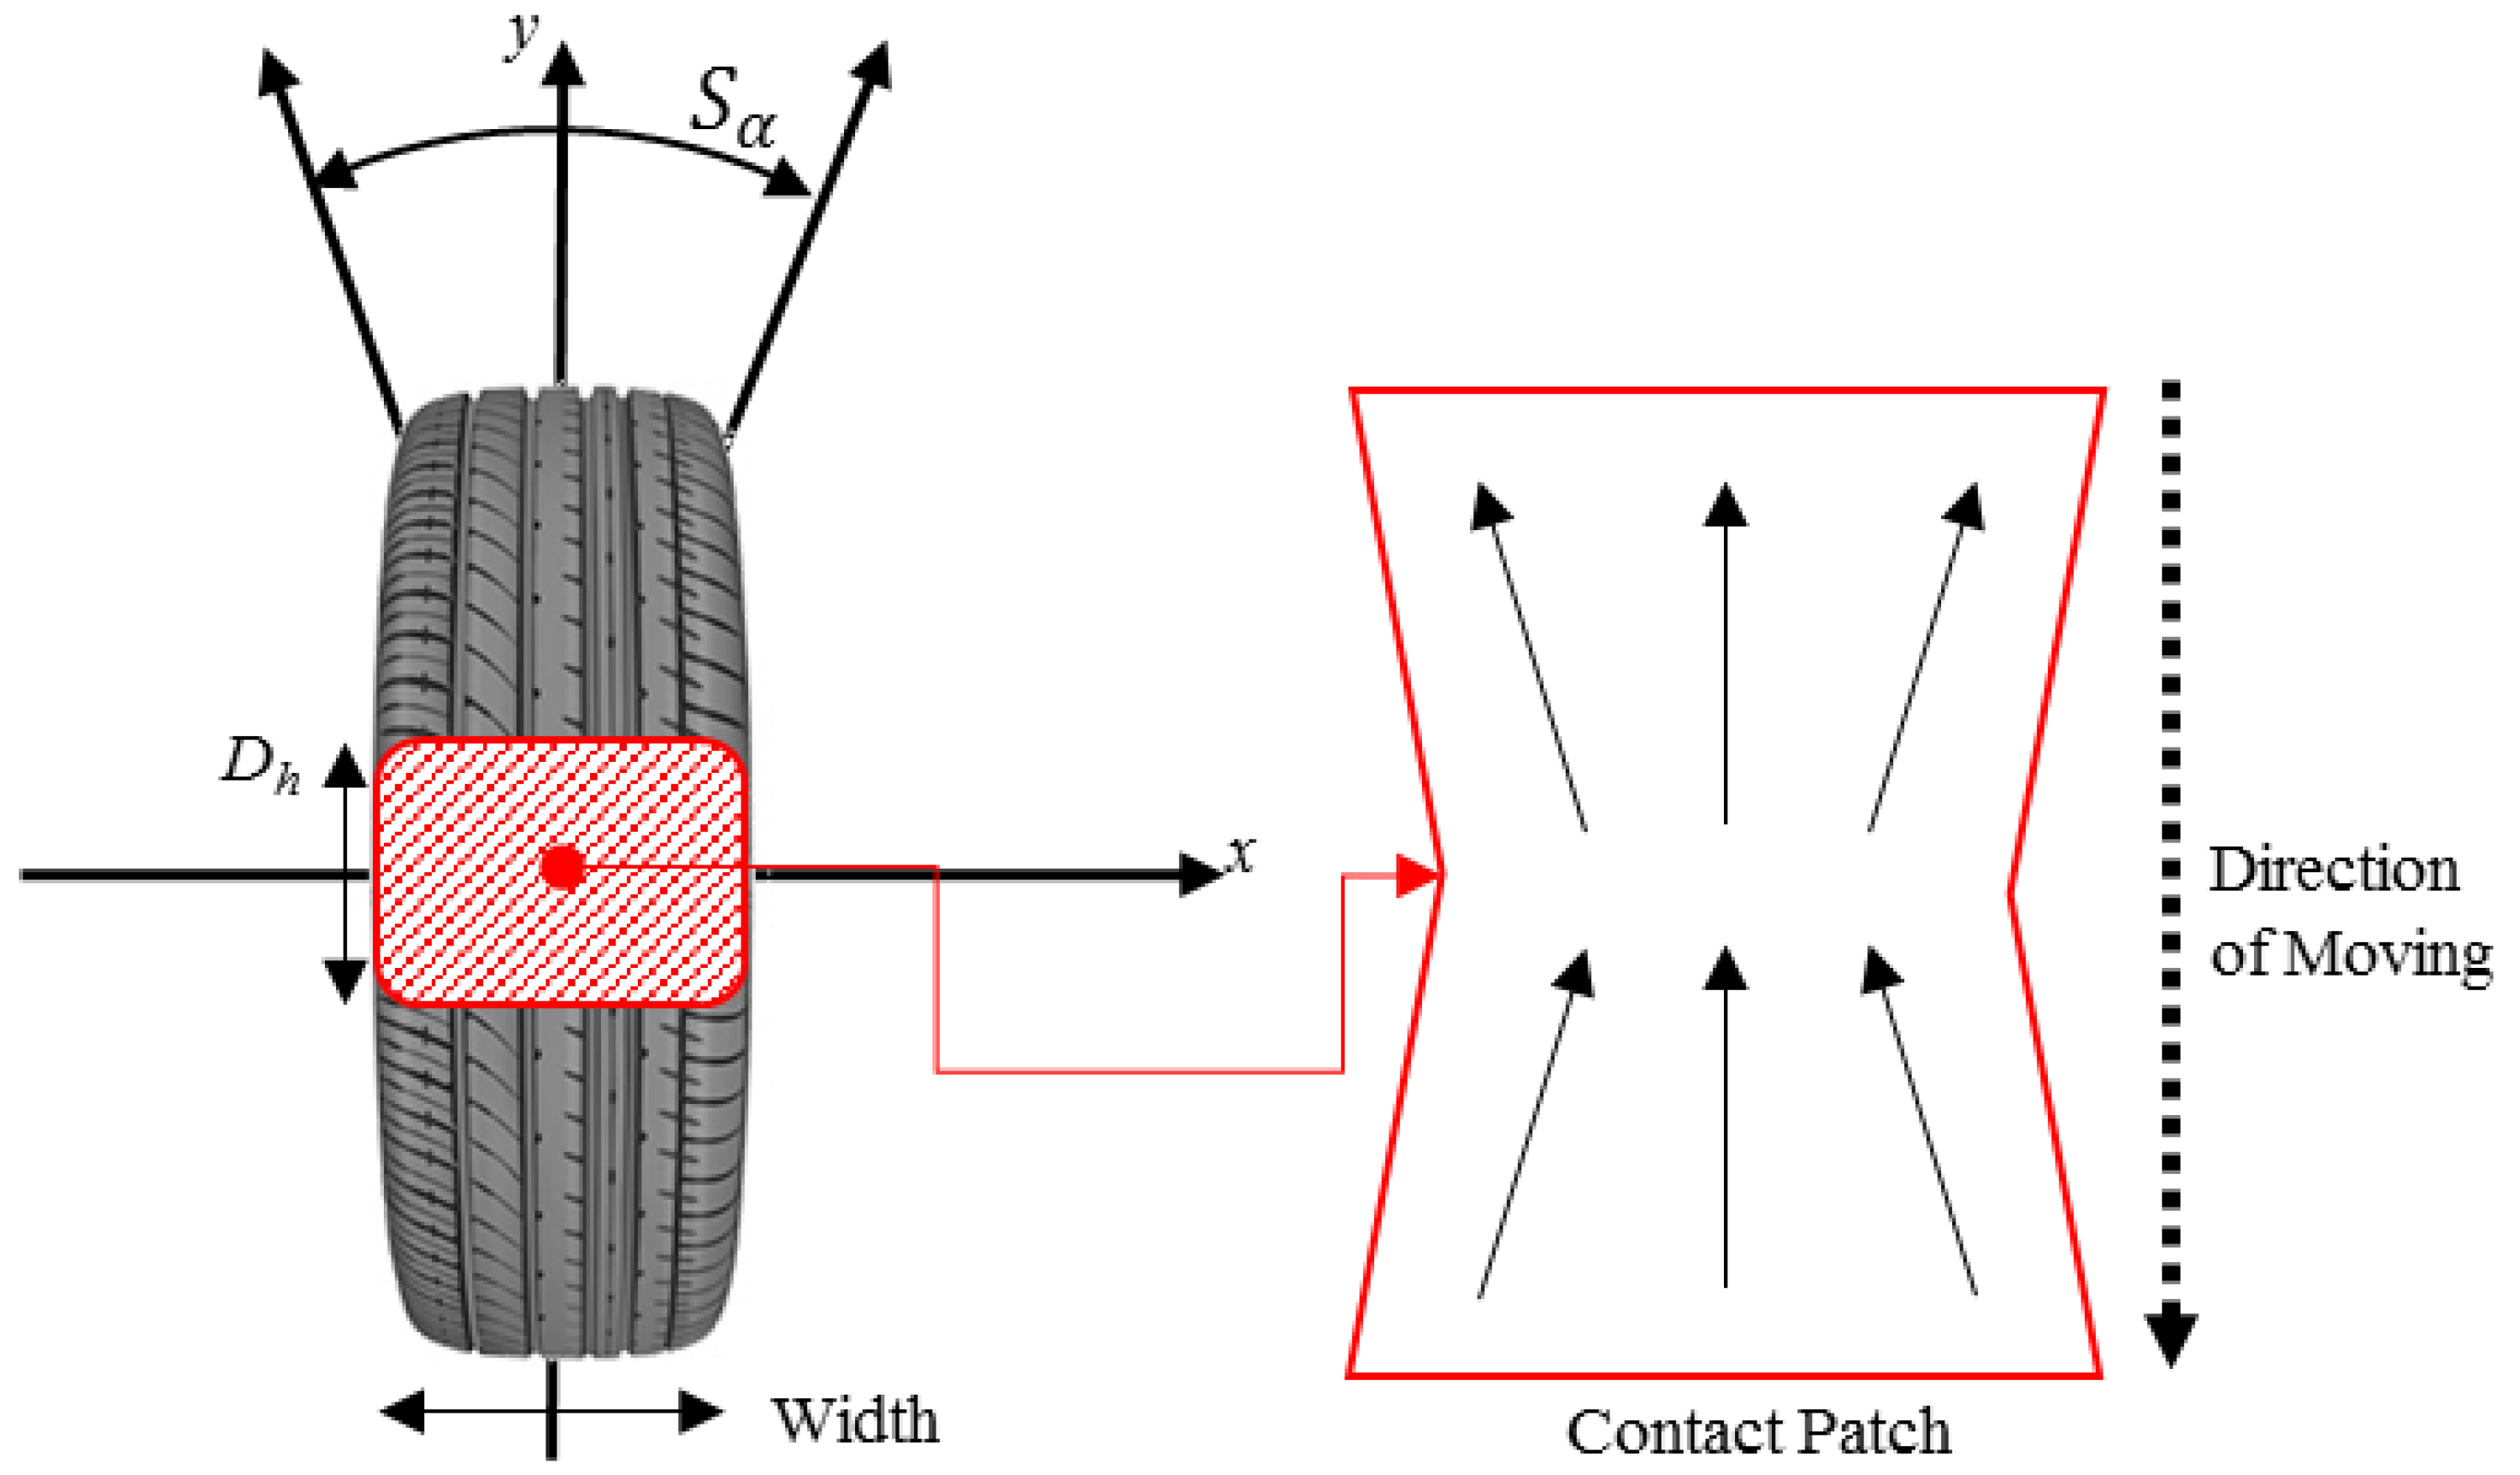
The vehicle specifications, layout, and tires were defined for a compact hybrid electric vehicle (HEV) of the H Company, Korea, which has a diverse lineup including internal combustion engine vehicles, HEVs, plug-in hybrid electric vehicles, and electric vehicles (EVs). The empty mass of the target vehicle was approximately 1400 kg, the tire size was 195 mm/65/15 inch, and the tire pressure was 241.3kPa. The tire contact area, geometry, and variables for the weight distribution on the contact surface, which were used for calculating the escape speed of a stone due to tire slip, are shown in Figure 1.
The lateral force characteristics of a rotating tire are determined by the constant load and slip angle conditions in steady state. For an initial slip angle, Sα, range of 5–10°, the lateral force is directed straight forward, whereas for an Sα range of 15–20°, the contact surface increases but the lateral force tends to decrease. Therefore, the range of Sα was set to ±20° [12]. In Figure 1, the tire contact area S, is defined as in Equation (1), and can be calculated by substituting the abovementioned vehicle specifications in this equation:
where F is the empty weight of the vehicle (kN) and P is the tire pressure (kPa).
The acceleration and braking force of the tire are caused by the difference between the rotational and driving speeds. Consequently, minor slippage occurs due to the difference between the frictional and propulsive forces of the contact surface, resulting in energy loss. The slip is defined as a dimensionless quantity, which is a percentage of the forward speed, as in Equation (2). Hence, the potential energy ratio delivered to the stone can be calculated using the slip ratio:
where r is the effective rotational radius of the tires, ω is the angular speed of the wheels, and V is the driving speed of the vehicle.
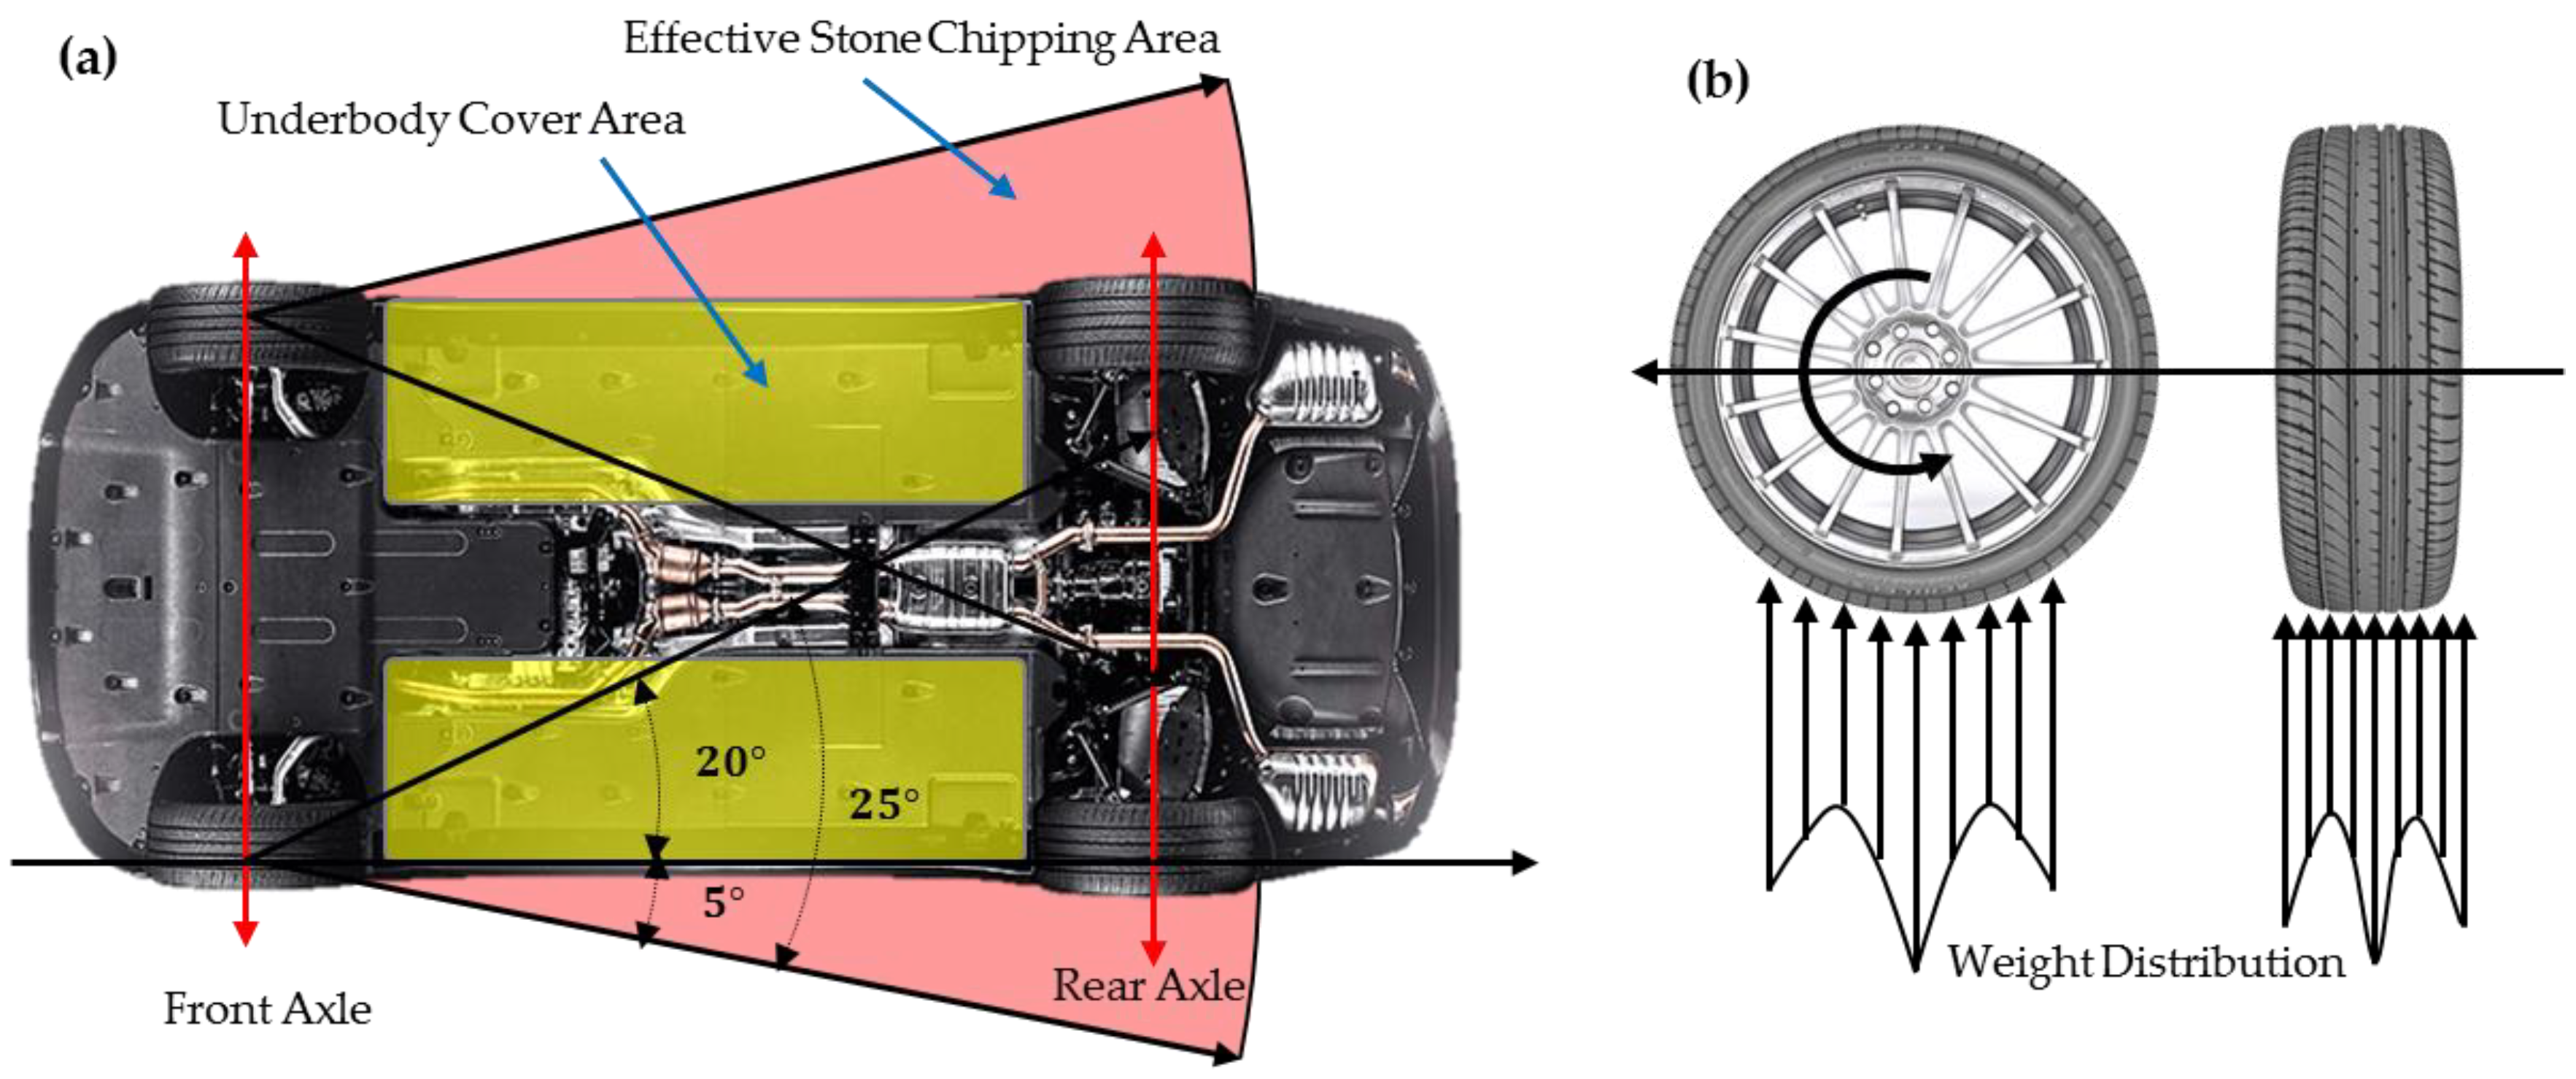
In this study, the linear speed, immediately after the escape of the dropped object, was assumed to be equal to the vehicle speed multiplied by the slip ratio. The tire contact area was defined as per the definition in ISO 4130. Furthermore, when the vehicle turned, the belt code angle was assumed to range approximately between −5° and 20° as shown in Figure 2a. The effective stone chipping area was defined by the range, because the stones below the angle −5° does not affect the underbody damage, considering the slip angle of ±20°.
The escape direction and potential energy of a dropped object generally vary, depending upon the tire contact weight distribution. In general, the contact load is the highest at the center of the tire contact area, increasing again at both its ends. As the vehicle moves, the code angle of the tire belt maintains under 20° in order to stabilize the contact force against lateral deformation of the tire. The contact force of tire, which is caused by shear stress on the contact surface, does not occur at one point but on the whole contact surface [13]. In this study, the cross-section of the tire contact weight distribution was calculated using spline interpolation, considering the continuity. The weight distribution for the escape angle of a dropped object, according to the code angle of the tire belt, can be calculated using this method, as shown in Table 1 and Figure 2b.
2.2. Numerical Definition of Stone Chipping Based on Vehicle Geometry
The vehicle driving environments in this study were assumed to be irregularly cleaned roads with speed limits of 60 kph (downtown), 80 kph (urban expressway), and 110 kph (expressway), respectively, and the masses of the dropped objects or stones that are highly likely to exist on these roads were assumed to be approximately 1–10 g. The road driving environment and dropped objects that are highly likely to be encountered by vehicles in the development stage were considered.
The escape direction of a dropped object that has passed under the contact surface of a rotating tire is tangential to the tire from the escape point, which depends on the air pressure and slip angle of the tire. Thus, the equation for the tire contact area (Equation (1)) can be used for calculating the tire contact length, Dh, depending on the travel direction. Dh was calculated as a function of the tire pressure by selecting the height, based on the tire radius, R, as shown in Table 2. In Equation (3), α is the tangential angle of the stone at the escape point, and Dh is the vertical length of the tire contact area.
Under the given tire conditions, the escape point of the dropped object or stone is determined by Dh, as given in Equation (3). Thus, the tangential angle of escape and the escape point of the dropped object can be identified.
As seen in Figure 3, the range of the stone chipping zone as a function of the tire pressure can be defined by θ1 and θ2, which are the tangential angles of the dropped object, and L is the overall length of the vehicle. In this study, the ratio of the potential energy of the tire slip transferred to the stone was defined as in Equation (4), where η is the kinetic energy ratio (%) delivered by the slip described above.
Furthermore, Equation (5) defines the linear velocity of the stone [4], where Mv is the empty weight of the vehicle, Mp is the mass of the stone, and VΔ is the amount by which the linear velocity of the stone increases. Applying the weight distribution ratio (WD_ratio) from Table 1, VΔratio depending on the escape angle of the dropped object can be calculated as follows:
The absolute speed, Vabs, of the stone immediately after it passes below the tire can be determined using the local reference frame (LRF), as illustrated in Figure 4 [4]. Furthermore, Vabs can be expressed in terms of its i, j and k vector components, based on ISO Standard 4130; the functions for the absolute speed are given by Equations (7)–(10), where Va is the driving speed of the vehicle. In the situation addressed in this study, the stone escapes tangentially to the tire; however, the elevation angle differs depending on the absolute speed and direction, as in Equation (8), as well as the stone masses. The vertical component of the stone speed, Vabsk, is given by Equation (10).
Here, the flight time of the stone after passing below the tire contact surface varies depending on the height, H, of the chassis above ground. The driving speed and gravitational acceleration, g, of the vehicle can be expressed as in Equation (11) by applying Vabsk, where α is the tangential angle of the dropped object at the escape point. As the flight time is short enough, the drag force of air is ignored.
Using Equations (1)–(11), the chipping of a single random stone can be mathematically proven, and its range can be set to determine the critical zone. However, although it may be meaningful to define chipping for a single random stone in terms of the potential energy, a statistical estimation model is required to identify the impact area.
2.3. Matrix Definitions for Numerical Simulation
To apply a statistical estimation model for random stone chipping, the variables shown in Equations (12)–(16) were defined, where αi is the tangential angle of the stone, Mpj is the mass of the stone, Vk is the vehicle speed, and β is the code angle of the tire belt.
Here the letters p, q, r and s correspond to the number of levels of each variable. In this study, we set them as 5, 10, 3 and 51 with discrete intervals, respectively. In this simulation, the tangential angle αi of a stone is assumed to be the nominal exit angle of the stone having the magnitude equal to the vehicle speed Vk. Equation (12) was reconfigured and expressed as a projection matrix (3D space matrix). First, the tangential angle of the stone from Table 2 was included as the x-axis of the matrix, and the mass of the stone from Equation (14) was included in the y-axis. Then, the vehicle speed component along the z-axis was set to 60, 80 and 110 kph to configure a 5 × 10 × 3 projection matrix. Furthermore, Equation (16) substituted in the projection matrix, and as β was distributed across the overall width of the underbody corresponding to belt code angles of −5–20°, Equation (12) was expanded into Equation (17) as a projection matrix for each belt code angle.
To calculate the impact zone over time and thereby identify the critical stone chipping zone, Equation (11) was applied, and the time was calculated using the following matrix equation:
The energy, immediately after chipping from tire, can be calculated using Equation (19), which can be formulated from Equations (8)–(10). The kinetic energy, immediately before collision, can be calculated using Equation (20) with Vabsk and t, which can be calculated using Equations (10) and (11).
where Ep0 and Ep1 are the kinetic energies of the stone after chipping and immediately before collision, respectively. The matrix for the kinetic energy of the stone can be defined as Equation (20) by substituting the 3D space matrix for random stone chipping, which can be determined using Equation (17) and the time, which can be determined using Equation (18).
3. Results
Numerical Simulation for Impact Prediction with the Kinetic Energy
In this numerical simulation based on the Equations (12)–(18), we calculated the estimation model of the random stone chipping for different combinations of variables; three vehicle speeds (60, 80, 110 kph), ten masses of stone (1, 2, …, 9, 10 g), five tire pressures (70, 75, 80, 85, 90 kPa), and four underground heights (0.25R, 0.5R, 0.75R, R). For each simulation, the stone chipping area is obtained as the code angle of the tire belt changes from −5° to 20° with the fifty-one cases (−5, −4.5, −4, … 19, 19.5, 20°).
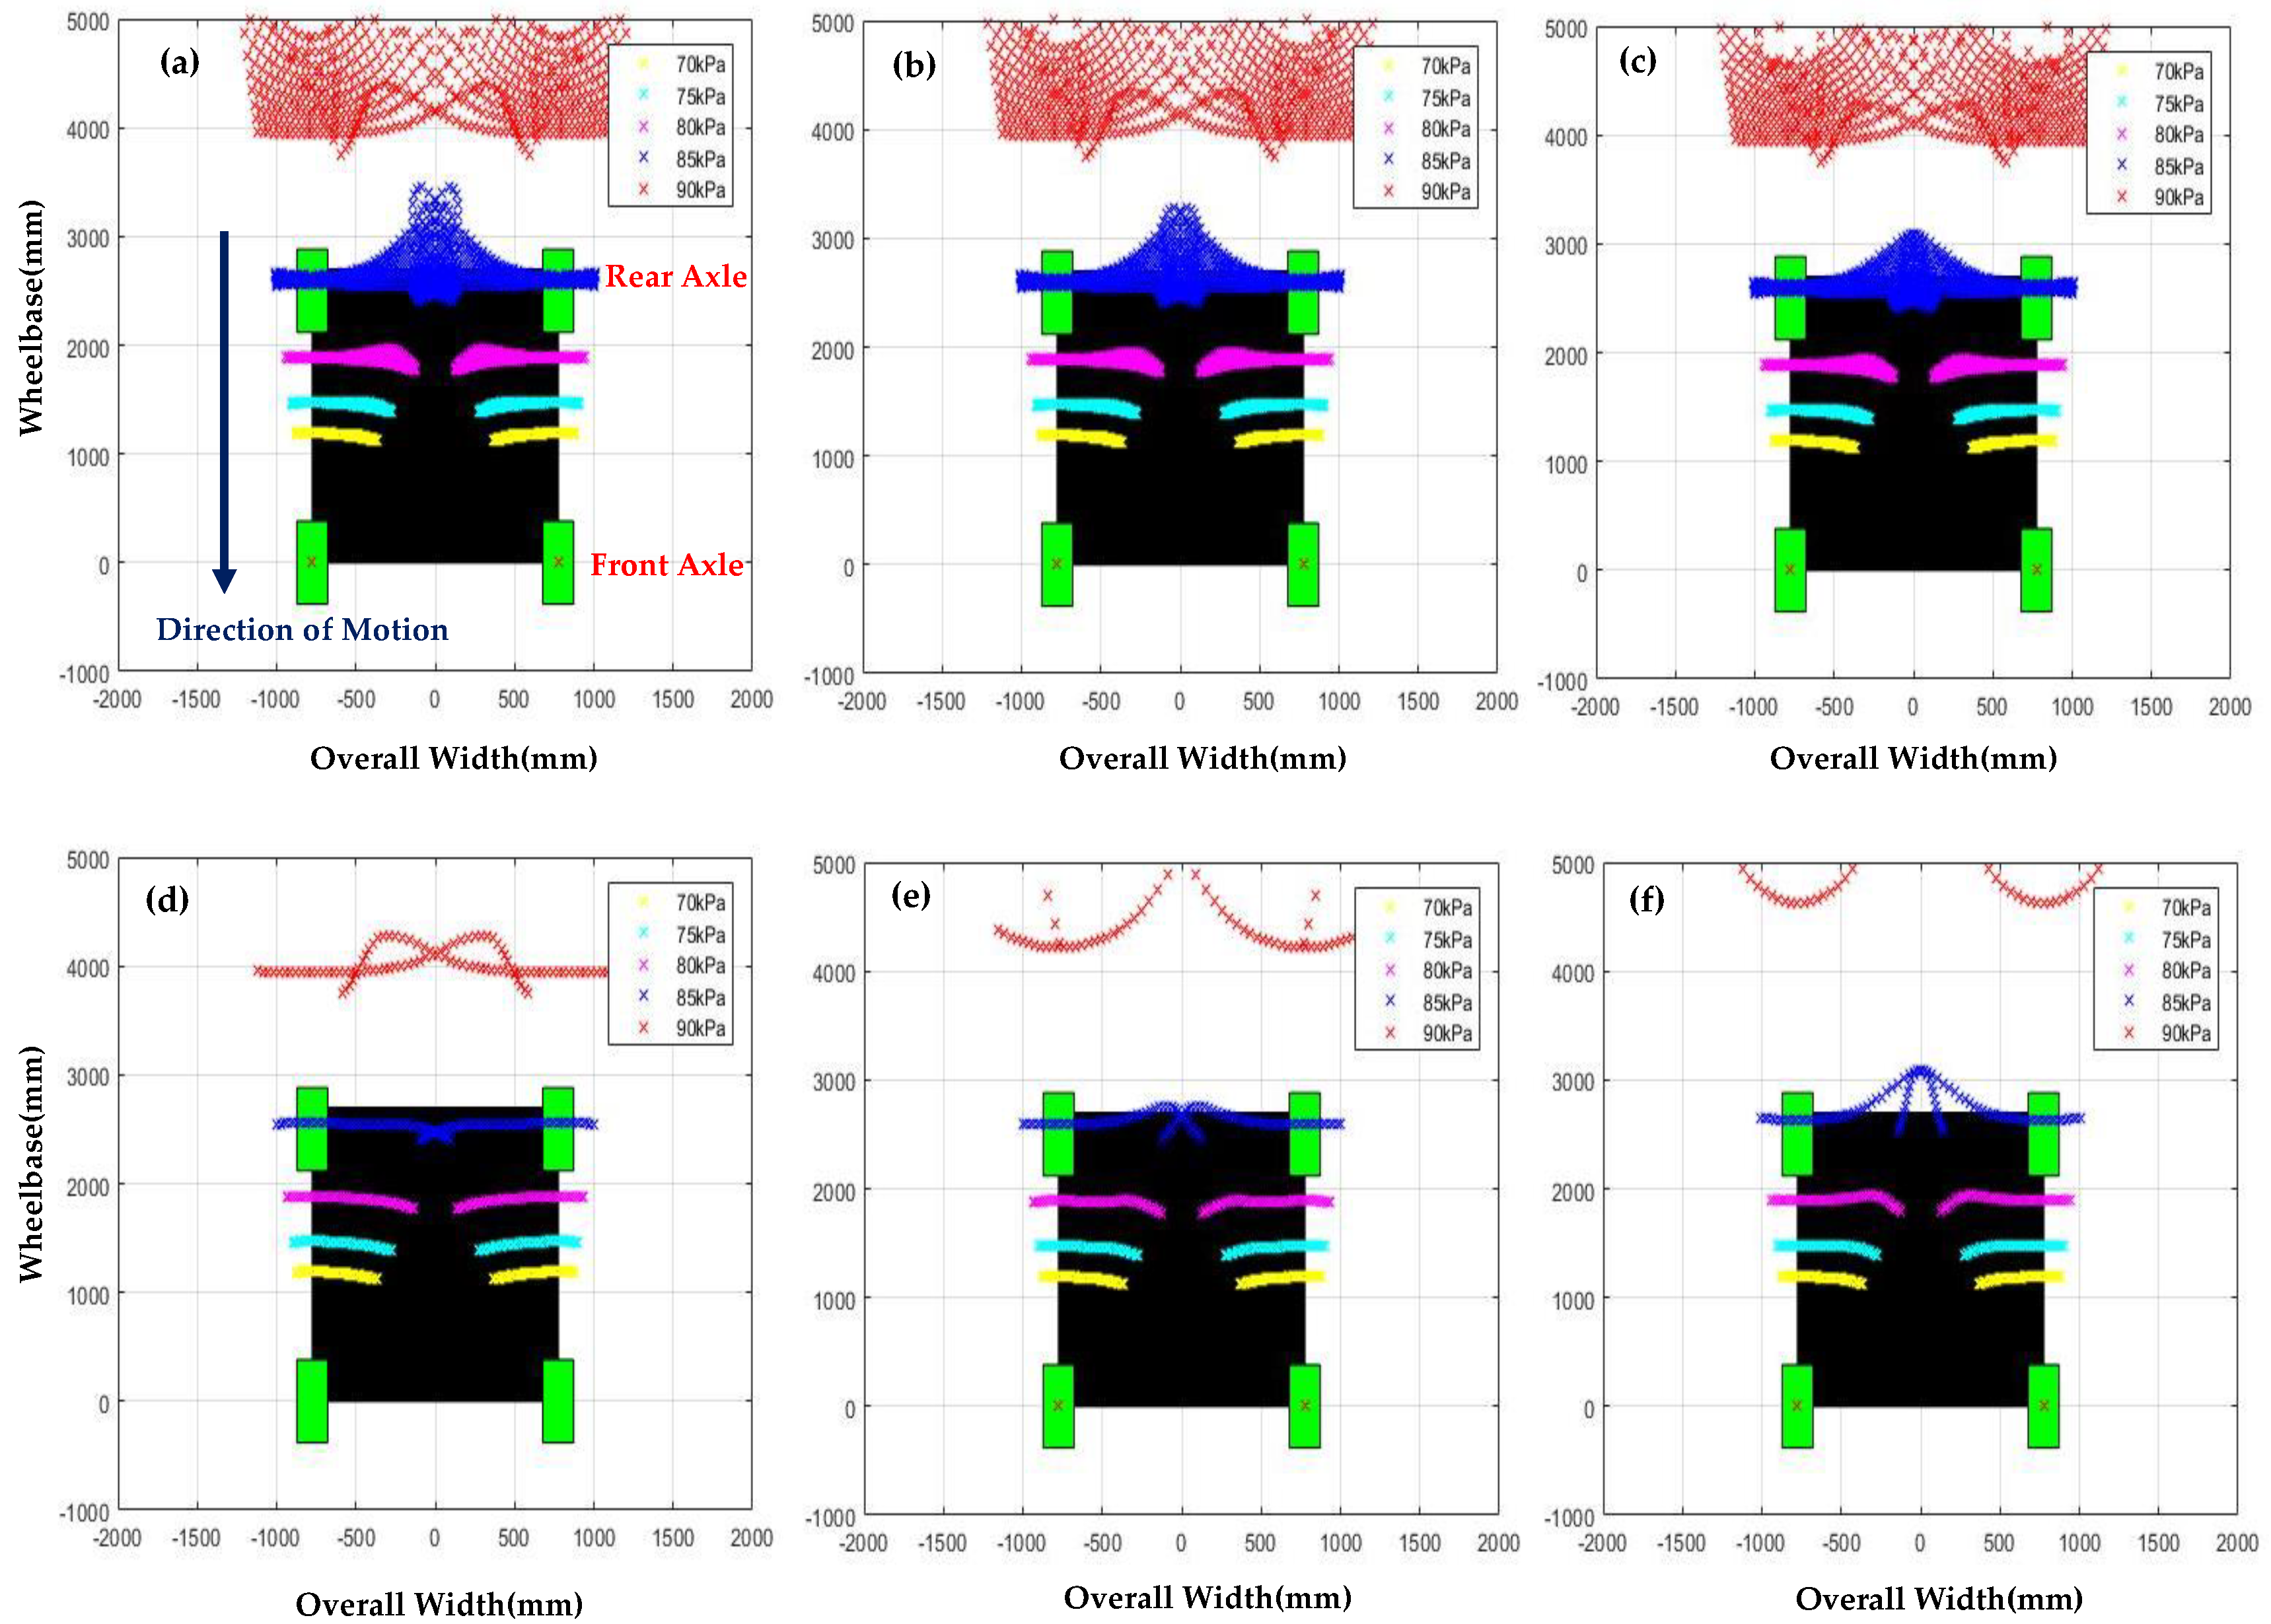
Figure 5a–c shows the predicted stone chipping zone for different vehicle speeds (60, 80, 110 kph) at the range from 70 kPa to 90 kPa of tire pressure. Figure 5a–c indicates that the tangential angle of the stone depends on the tire pressure. In other words, at low tire pressure, stone chipping occurs around the front-axle because the linear velocity of the stone is low and then the tangential angle of the stone is high. However, at high tire pressure, stones hit the area around the rear-axle because of higher linear velocity and then lower tangential angle.
Figure 5d–f shows the effect of tire pressure on stone chipping zone for different stone masses (1, 5, 10 g) at the vehicle speed of 110 kph. When the vehicle speed is constant, the stone chipping tends to progress in the direction of the rear-axle according to the mass of the stone. In addition, there is a variation in the stone chipping area depending on the mass of the stone. At low tire pressure, the effect of stone mass on the stone chipping area around the underbody is small. Moreover, the radial distribution and shape of the stone chipping zone are much the same.
The ground clearance (ride height), which is the underbody height to the ground, of a driving vehicle varies due to road condition, tire pressure and additional passengers. Figure 6a–d displays the stone chipping zone for the four cases of ground clearance (0.25R, 0.5R, 0.75R, R). For each case, the stone chipping area is plotted together in one color for five tire pressures (70, 75, 80, 85, 90 kPa). At the ground clearance of 25%, the stone chipping zone is formed around the front-axle, as shown in Figure 6a. Whereas, the stones hit the area around the rear-axle at the ground clearance of 50% in Figure 6b, therefore, the stone chipping zone has a radial distribution around the rear-axle at higher ground clearance. In general, the ground clearance has a range between 0.75R and 1R, as normal driving conditions are maintained. Figure 6c,d shows that the radially distributed critical zone is formed around the back of the rear-axle for the standard road clearance (75–100%) and high tire pressure.
The predicted zone displays the area where stones may collide with the vehicle after passing below the tire contact surface identified by applying Equations (12)–(17). Furthermore, the zone obtained substituting the 3D space matrix for t in Equation (18) can be observed in Figure 5 and Figure 6, considering the effect of the gravitational force on the stones; this demonstrates that the stones have radial directions, depending on the tire belt code angle. These results confirm that stone chipping occurs most frequently at the rear-axle, where the fuel tanks and mufflers of vehicles, in general, or the batteries and fuel cells of EVs are located.
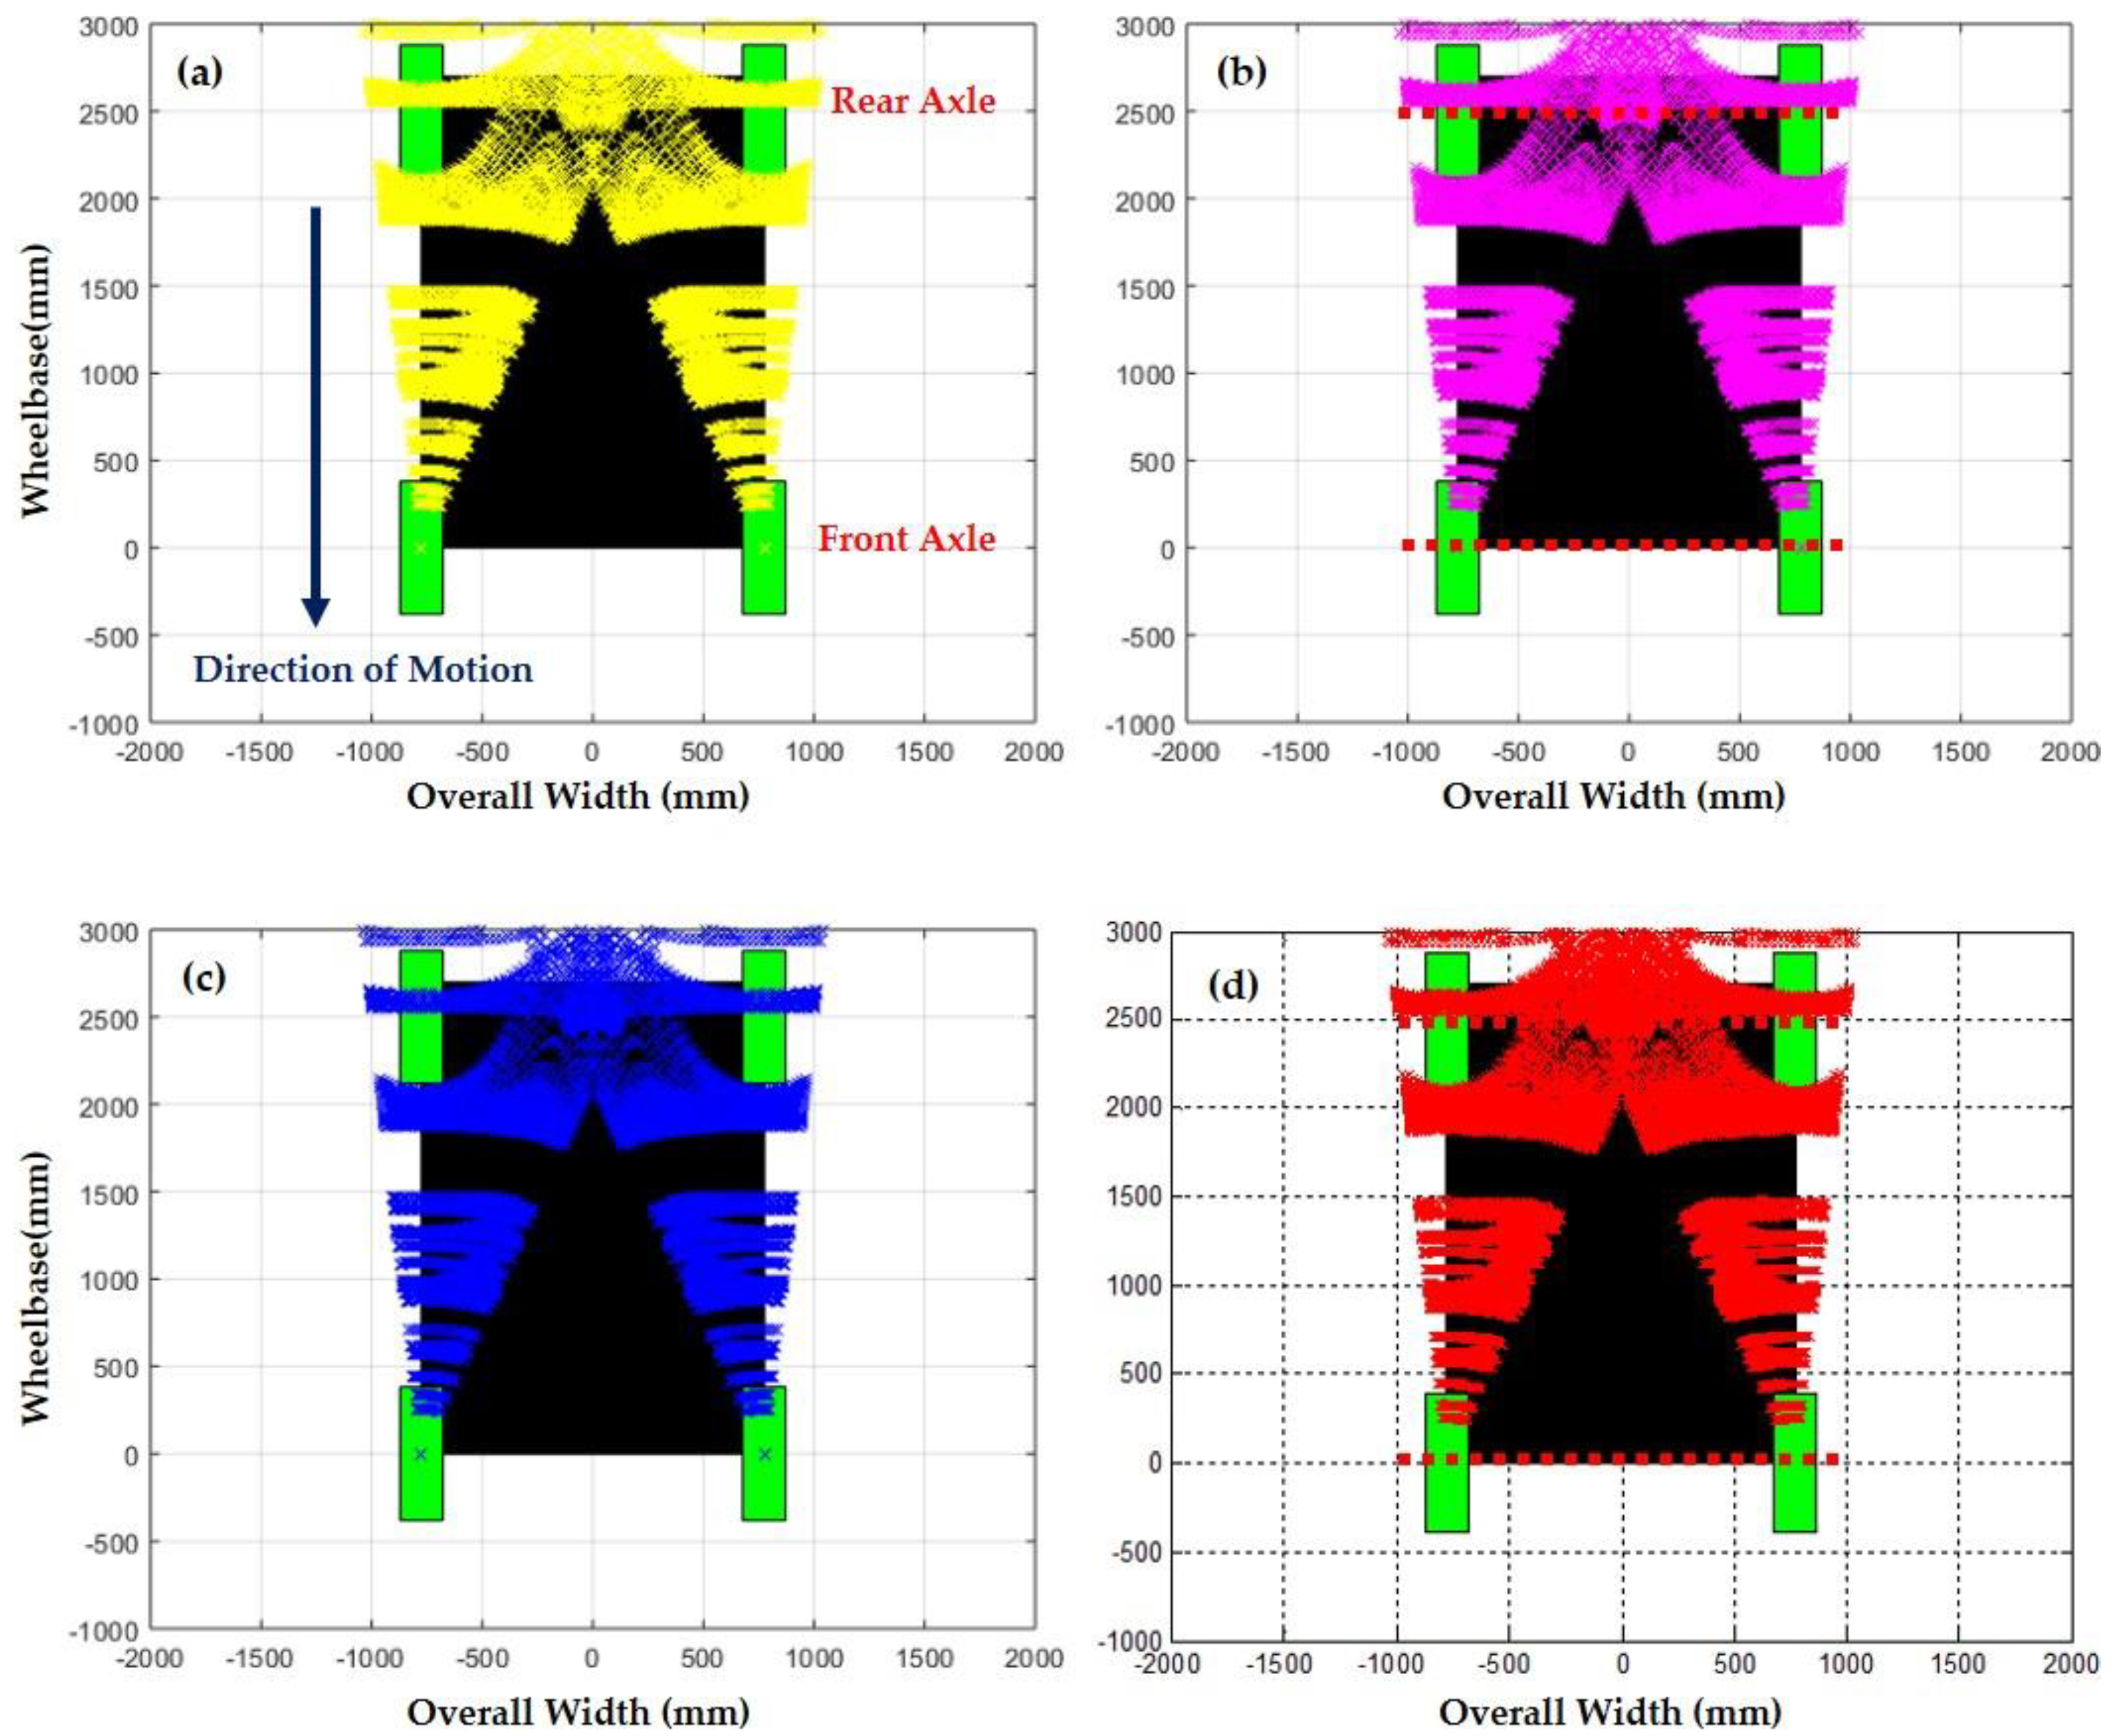
Figure 7a–c shows the predicted stone chipping zone, plotted together for all the cases (5 tire pressures, 4 ground clearances, 10 stone masses) for different vehicle speeds (60, 80, 110 kph). As observed in Figure 7, the stones have the same radial distribution for all driving speeds ranging from 60 to 110 kph. Certain critical zones exhibit differences in the density; however, their shapes and sizes are identical. This finding suggests that for vehicles with a certain driving speed range, the critical zone is located in the same area. Thus, this method can be used for determining the design criteria for the critical zone, and the weight for robust vehicle component design.
The empty area of the stone chipping zone in Figure 7 is located between 1500 to about 1800 mm vehicle length. As the tangential angle in Equation (3) varies with the tire pressure, the chipping area locates along the vehicle length from the front-axle to the rear one. This means that stones with high tangential angles (low tire pressure) impact below 1500 mm vehicle length. Considering in combination with the code angles of the tire belt from −5° to 20°, they spread out widely over 1800 mm vehicle length. Considering the discrete intervals of tire pressure (70, 75, 80, 85, 90 kPa) in the numerical simulation, this empty area is expected to have low possibility for stone chipping, even at the smaller intervals of tire pressure.
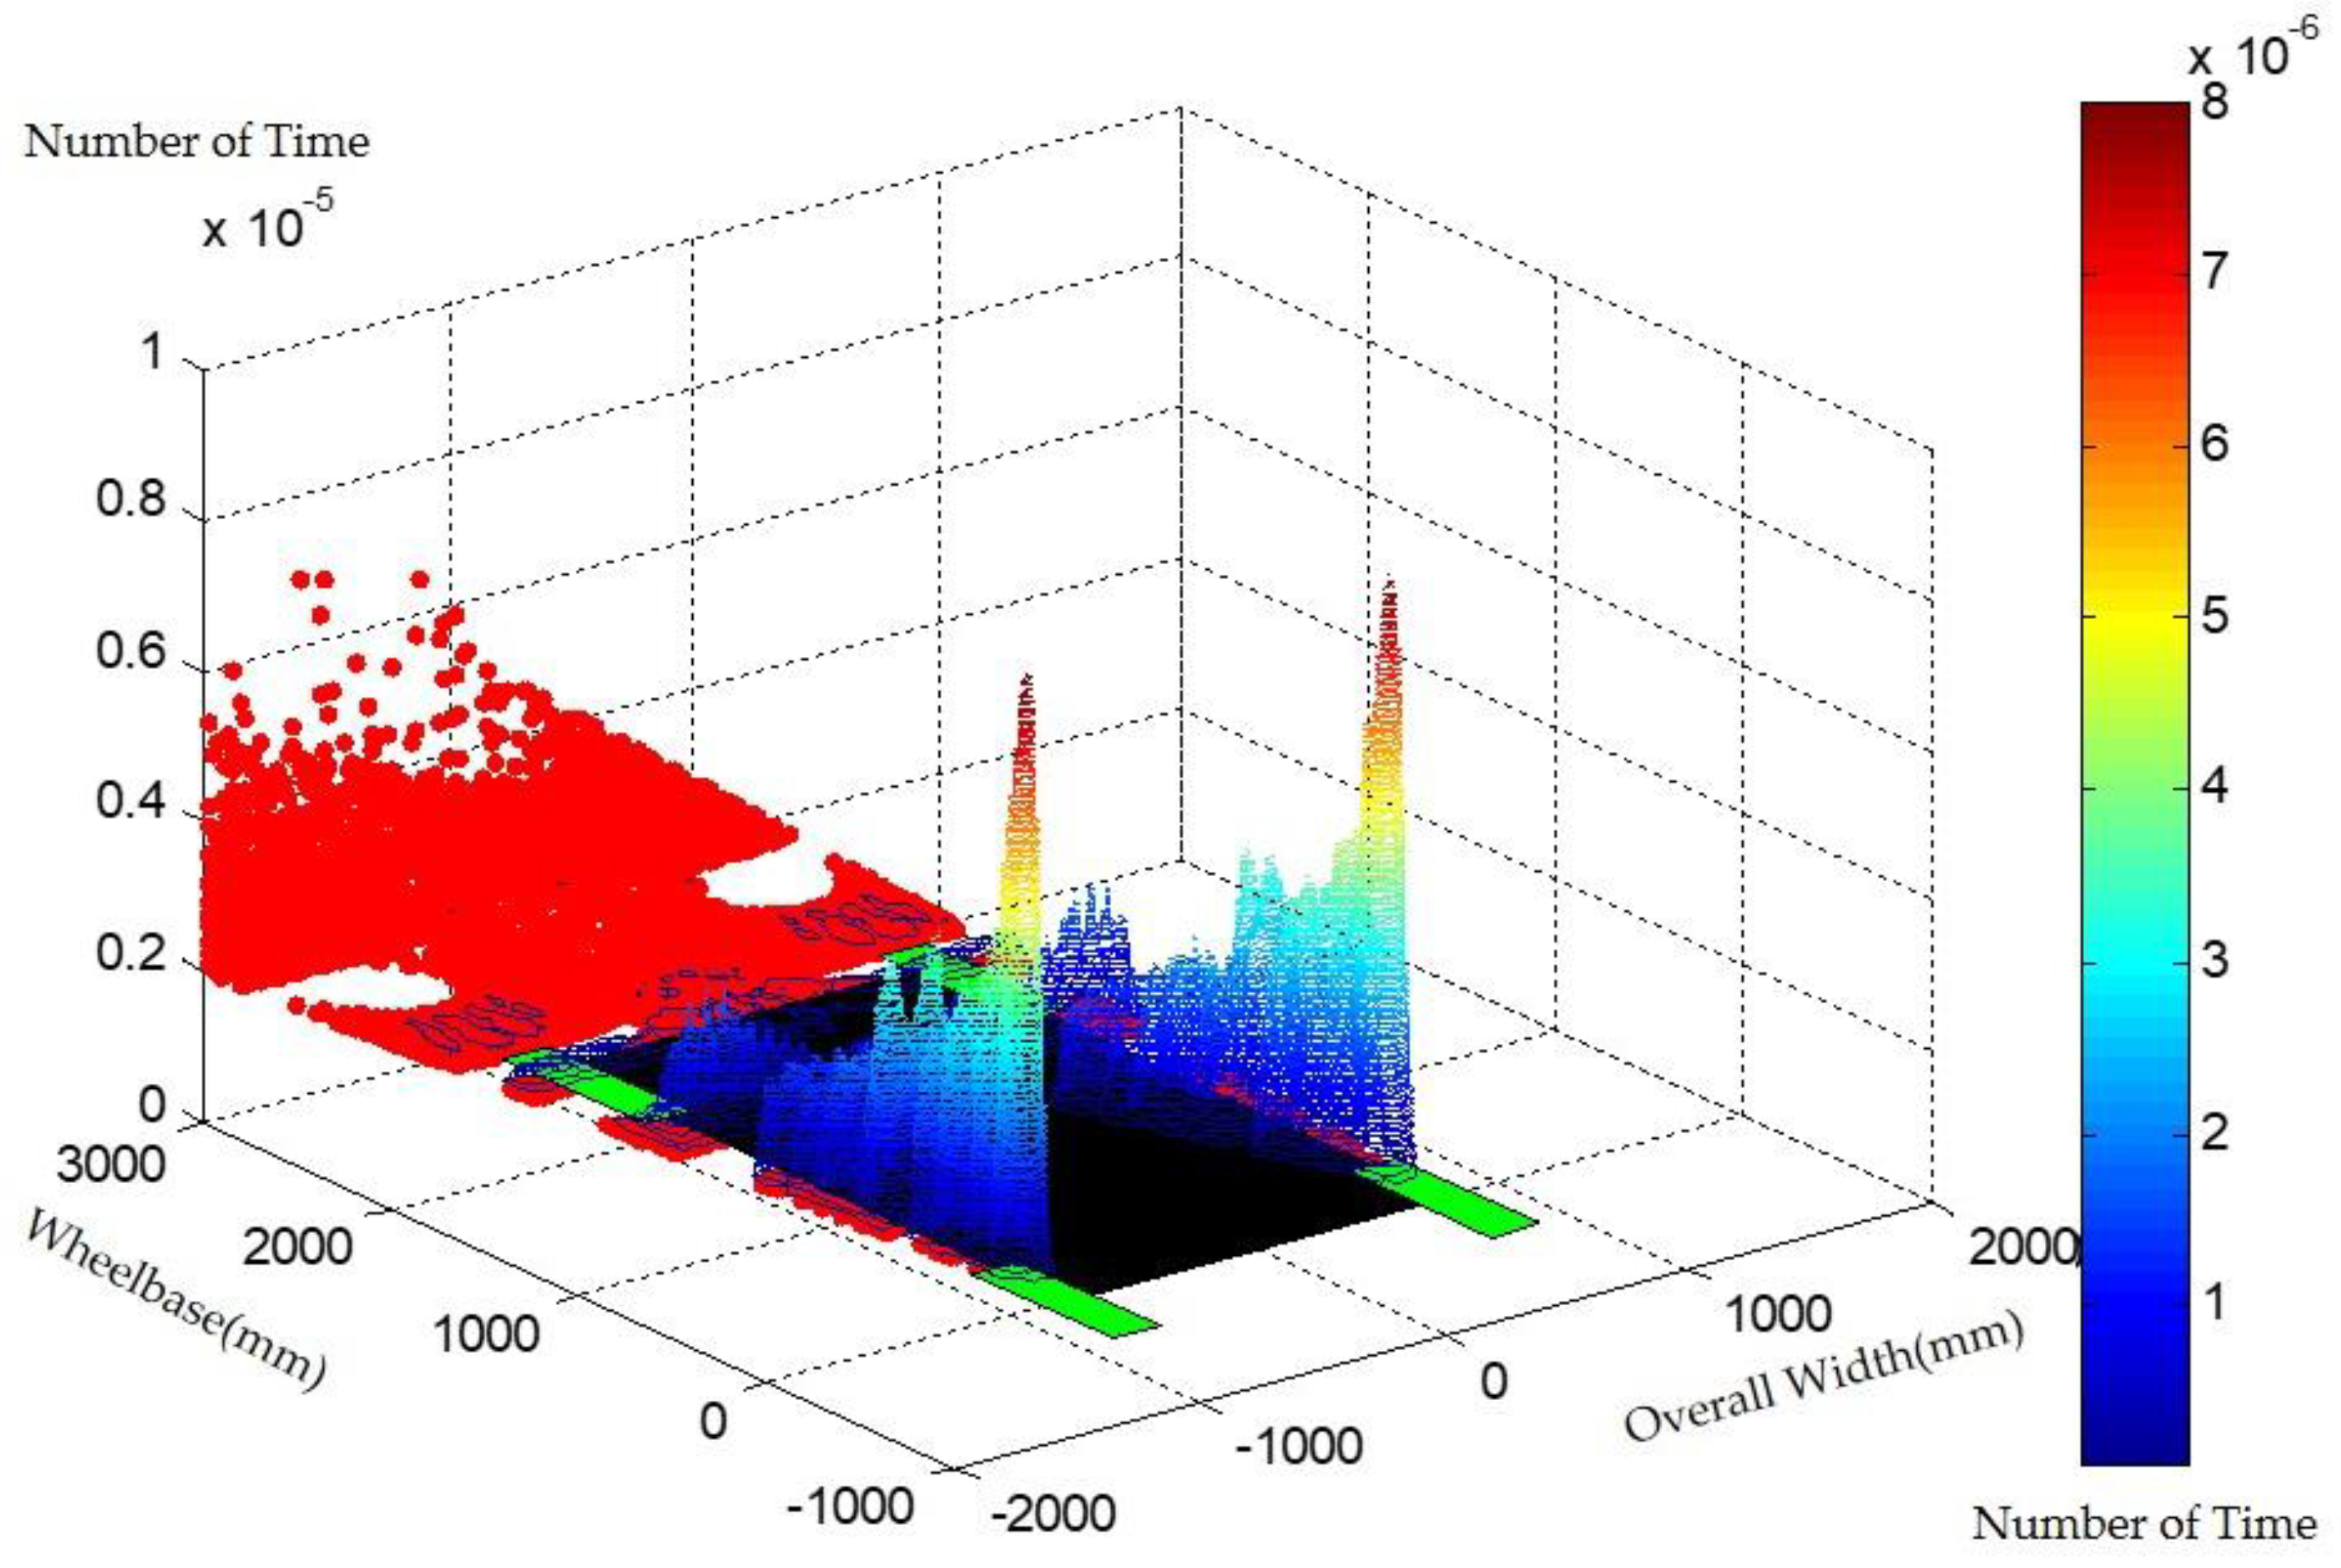
In general, the position at a given time can be calculated using Equation (11) for each stone, but for random stone chipping, the position range must be predicted by statistical probability. In this study, density estimation was performed to determine the probabilistic distribution characteristics of the stone chipping zone in Figure 8 by applying the extensively used kernel density estimation method [14]; i.e., after obtaining the predicted histogram by non-parametric density estimation, the histogram was normalized, and the probability density function was used. By setting the bandwidth of the kernel density function, the stone chipping probability density was obtained, as depicted in Figure 8.
Figure 8 demonstrates that the probability density of stone chipping is high behind the front-axle and tends to be low between the front and rear-axle, as suggested by Figure 7. However, the probability density is relatively high in the rear-axle zone. As observed in Figure 8, random stone chipping can cause concentrated damage to the rear-axle zone, as well as the rear parts and suspension parts.
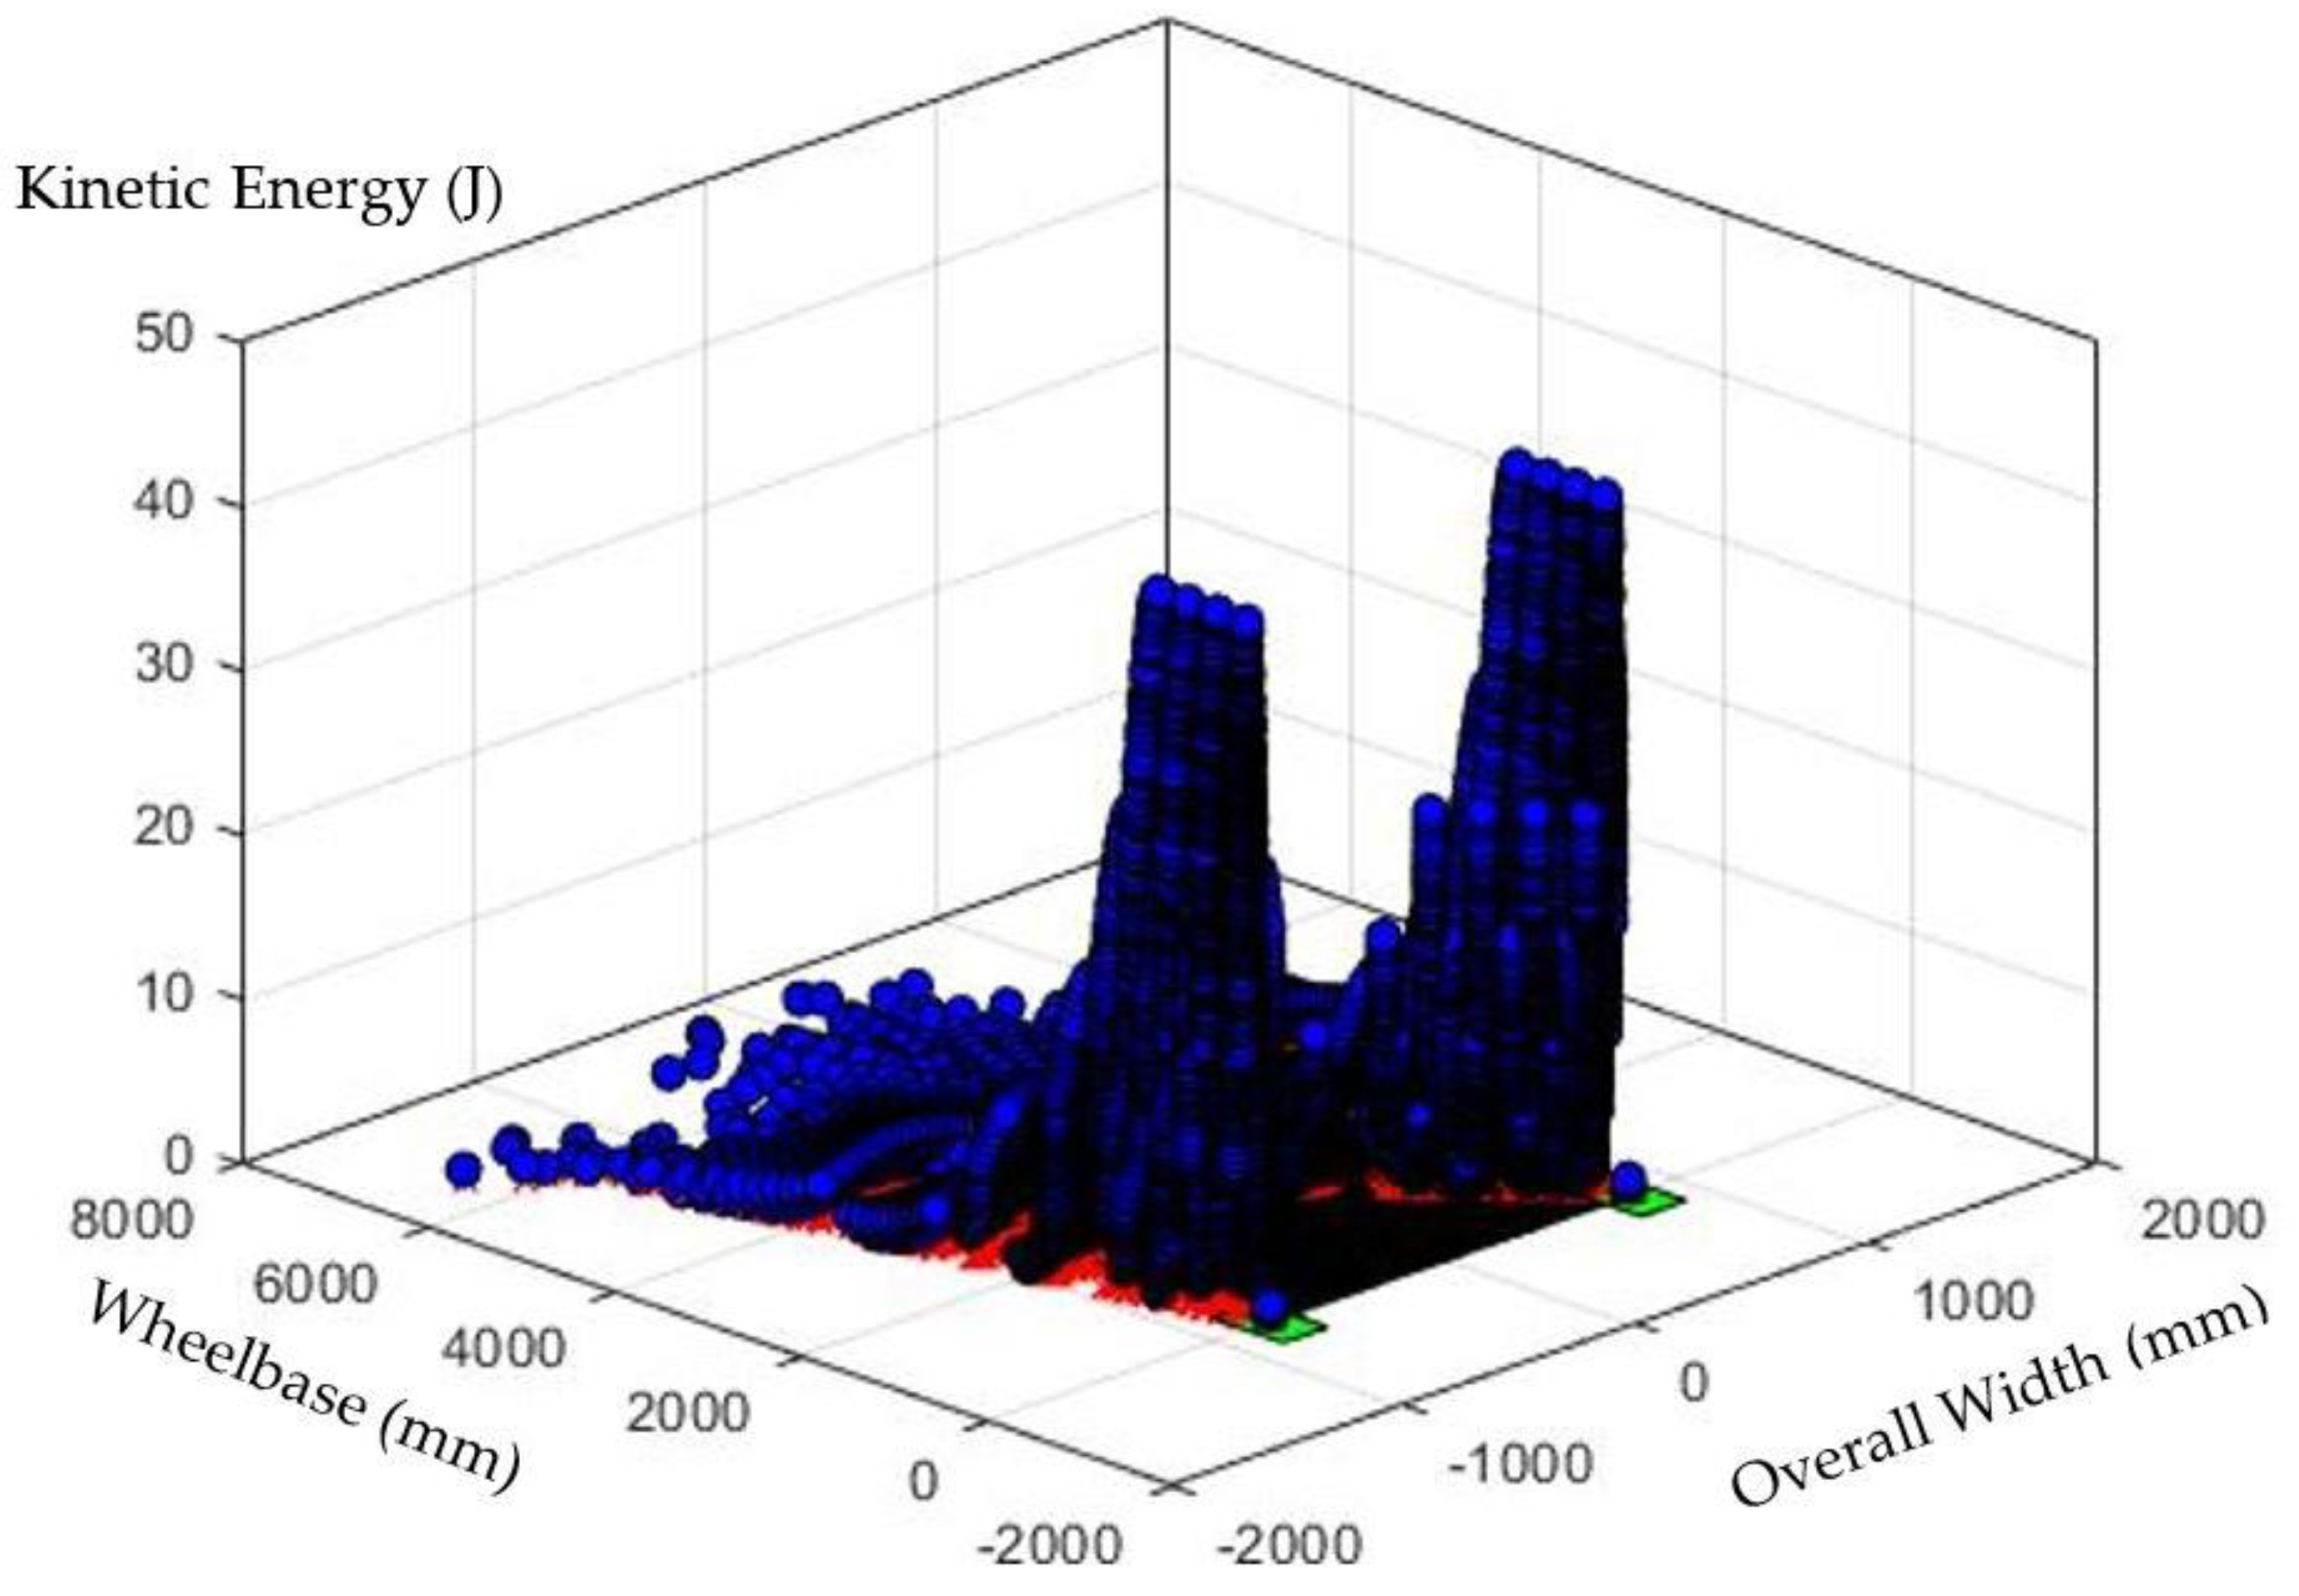
Hence, the chipping zone is large, when the road clearance is 75–100%. Furthermore, the stones that are chipped and fly affect the kinetic energy and impact zone, depending on the driving speed of the vehicle and the gravitational acceleration. Using Equation (20), the kinetic energy of each stone was calculated to be approximately 50 J.
Figure 9 demonstrates that the vehicle speed and gravitational acceleration do not substantially affect the impact zone, but serious damage may result, when the front-axle is impacted. However, it is predicted that the rear-axle, with relatively large portions in the critical zone, will be continuously impacted. When a metal surface with a large area is continuously impacted, shape changes and extreme fractures occur due to fatigue.
As shown in Figure 7, Figure 8 and Figure 9, the numbers of stones that can reach the critical zone and impact the vehicle, as well as the potential energy, were calculated, as shown in Table 3, dividing the critical zone into 500 mm interval sections from the front-axle. The number of stones chipping the vehicle is obviously maximum at the center of the rear wheels, which corresponds to a range of 500–1000 mm from the front-axle. In addition, the critical zones exhibit the same tendencies at all driving speeds. Furthermore, in the 500–1000 mm region, the collision possibility is approximately 73%, and the total potential energy is the highest at 217,730 J. Here, the number of stones that could potentially cause chipping was 30,600, and among them, it was predicted that 29,658 collisions would occur.
4. Conclusions
In this study, a mathematical model was developed for estimating the impact zone and the energy transmitted to the underbody of a vehicle due to stone chipping, and the impact zone was examined using a statistical approach involving kernel density estimation.
The prediction model, based on kernel density estimation, indicated that the percentage of impact on the rear-axle region was greater compared to the front-axle region. However, the risk factor for accidents is the rear-axle center part, which can be impacted continuously. Hence, if the region that may be exposed to continuous impacts contains the critical functions of the vehicle, these vehicle components should be designed robustly to extend their life span.
The mathematical model and statistical technique used in this study can reduce the trial and error as well as the cost involved in vehicle development because they enable potential energy prediction and planning for regions that are to be robustly designed, even without verifying the degree of damage through expensive experiments, such as actual vehicle impact or single-component tests. Furthermore, they can be employed for predicting the components that may be damaged in the long term by continuous impact, and provide guidelines for coping with potential accidents in critical zones.
Author Contributions
Y.-J.C. designed the numerical modeling for stone chipping. H.-J.E. assisted with the numerical modeling and analysis. S.-Y.L. contributed to the theoretical analysis.
Fundings
This research was funded by the Ministry of Trade, Industry and Energy of the Republic of Korea and Korea Institute for Advancement of Technology (KIAT) through the Encourage Program for The Industries of Economic Cooperation Region (R0005790) and the National Research Foundation of Korea funded by Ministry of Science & ICT (2018M2B2A9065873).
Conflicts of Interest
The authors declare no conflict of interest.
References
- Larsson, F.; Andersson, P.; Mellander, B.-E. Lithium-ion battery aspects on fires in electrified vehicles on the basis of experimental abuse tests. Batteries 2016, 2, 9. [Google Scholar] [CrossRef]
- Chu, Y.-J.; Shin, Y.-S.; Lee, S.-Y. Aerodynamic analysis and noise-reducing design of an outside rear view mirror. Appl. Sci. 2018, 8, 519. [Google Scholar] [CrossRef]
- Lin, C.S.; Lee, H.B.; Hsieh, S.H. Microstructure and formability of ZnNi alloy electrodeposited sheet steel. Metall. Mater. Trans. A 2000, 31, 475–485. [Google Scholar] [CrossRef]
- Vadori, R. On the Simulation of the Effects of the “Stone Chipping” on the Car Underbody—An Application of Monte Carlo Methods; SAE Technical Paper, 2010-01-0731; Society of Automotive Engineers: Warrendale, PA, USA, 2010. [Google Scholar]
- Razin, A.A.; Ramezamzadeh, B.; Yari, H. Detecting and estimating the extent of automotive coating delamination and damage indexes after stone chipping using electrochemical impedance spectroscopy. Prog. Org. Coat. 2016, 92, 95–109. [Google Scholar] [CrossRef]
- Youn, J.Y.; Kim, S.H.; Jin, Y.S. A study on the impact resistance of plastic underbody parts. SAE Int. J. Mater. Manf. 2016, 9, 776–780. [Google Scholar] [CrossRef]
- Shang, R.; Altenhof, W.; Hu, H. Kinetic Energy Compensation of Tire Absence in Numerical Modeling of Wheel Impact Testing; SAE Technical Paper, 2005-01-1825; Society of Automotive Engineers: Warrendale, PA, USA, 2005. [Google Scholar]
- Charles, J.R. The Design and Processing of Cast Aluminum Wheels for Impact Performance; SAE Technical Paper, 2001-01-0749; Society of Automotive Engineers: Warrendale, PA, USA, 2001. [Google Scholar]
- Shiuh, C.H.; Yu, C.L. The finite element analysis of composite laminates and shell structures subjected to low velocity impact. Compos. Struct. 2004, 66, 277–285. [Google Scholar] [CrossRef]
- Botev, Z.I.; Grotowski, F.I.; Kroese, D.P. Kernel density estimation via diffusion. Ann. Statist. 2010, 38, 2916–2957. [Google Scholar] [CrossRef] [Green Version]
- Ben, A.Y.; Levy, A. Absorbed shear energy during solid particle impact on ductile surface. WEAR 2016, 368, 162–172. [Google Scholar] [CrossRef]
- Gim, G.; Nikravesh, P.E. An analytical model of pneumatic tires for vehicle dynamic simulations. Part 1: Pure slips. Int. J. Vehicle Des. 1990, 11, 589–618. [Google Scholar] [CrossRef]
- Gillespie, T. Fundamentals of Vehicle Dynamics, 1st ed.; Society of Automotive Engineers Inc.: Warrendale, PA, USA, 1992; pp. 304–321. ISBN 978-1-56091-199-9. [Google Scholar]
- Bendat, J.; Piersol, A. Random Data: Analysis and Measurement Procedures, 4th ed.; John Wiley & Sons: Hoboken, NJ, USA, 2011; p. 594. ISBN 978-0-470-24877-5. [Google Scholar]
Figure 1.
Tire contact area and belt code angle with respect to the vehicle weight.

Figure 2.
(a) Underbody geometry and effective stone chipping area due to the code angle of tire belt; (b) the weight distribution of the tire.
Figure 2.
(a) Underbody geometry and effective stone chipping area due to the code angle of tire belt; (b) the weight distribution of the tire.

Figure 3.
Geometry of the tangential angle and target position with respect to the escape point of the dropped object.
Figure 3.
Geometry of the tangential angle and target position with respect to the escape point of the dropped object.
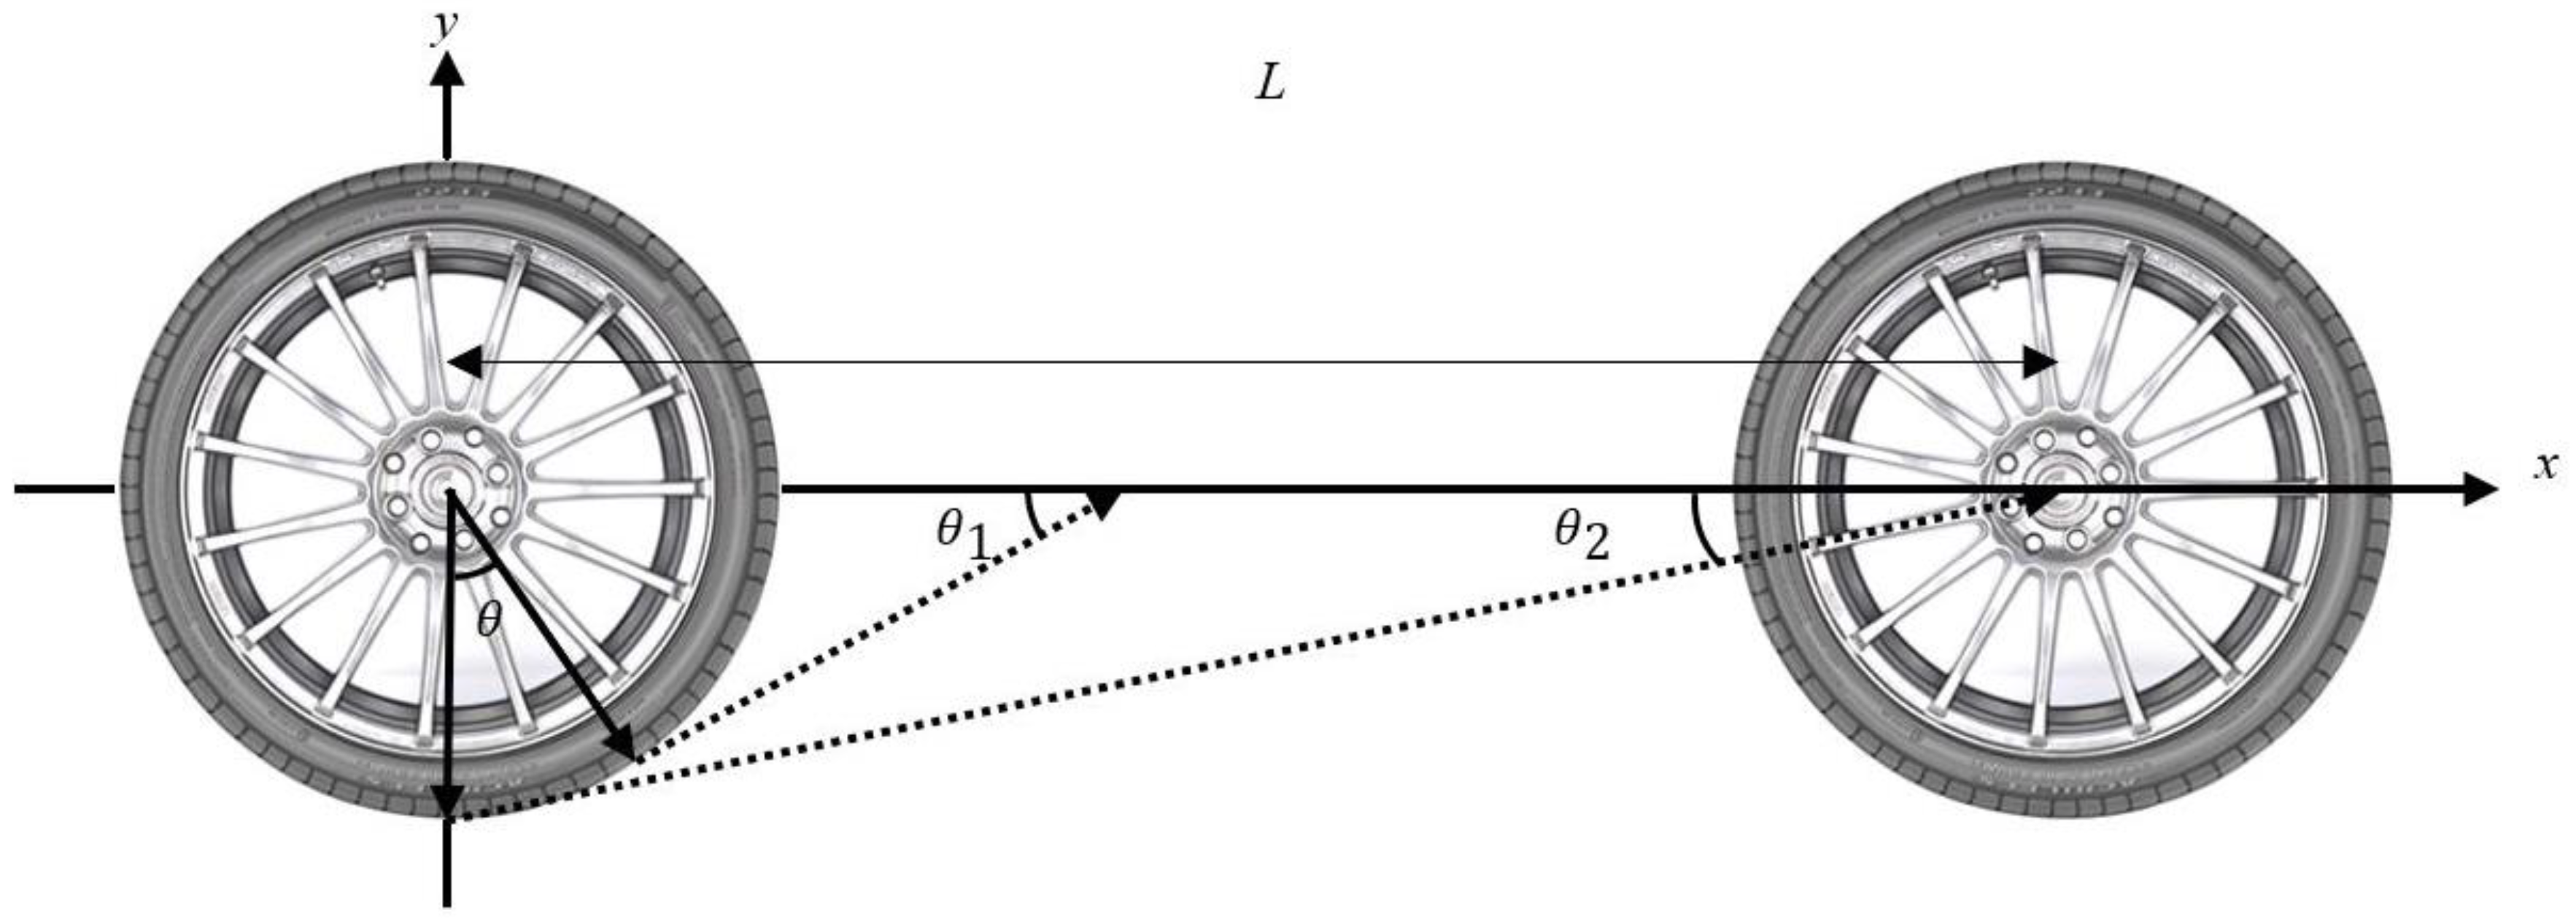
Figure 4.
Local reference frame for the absolute speed of the stone.
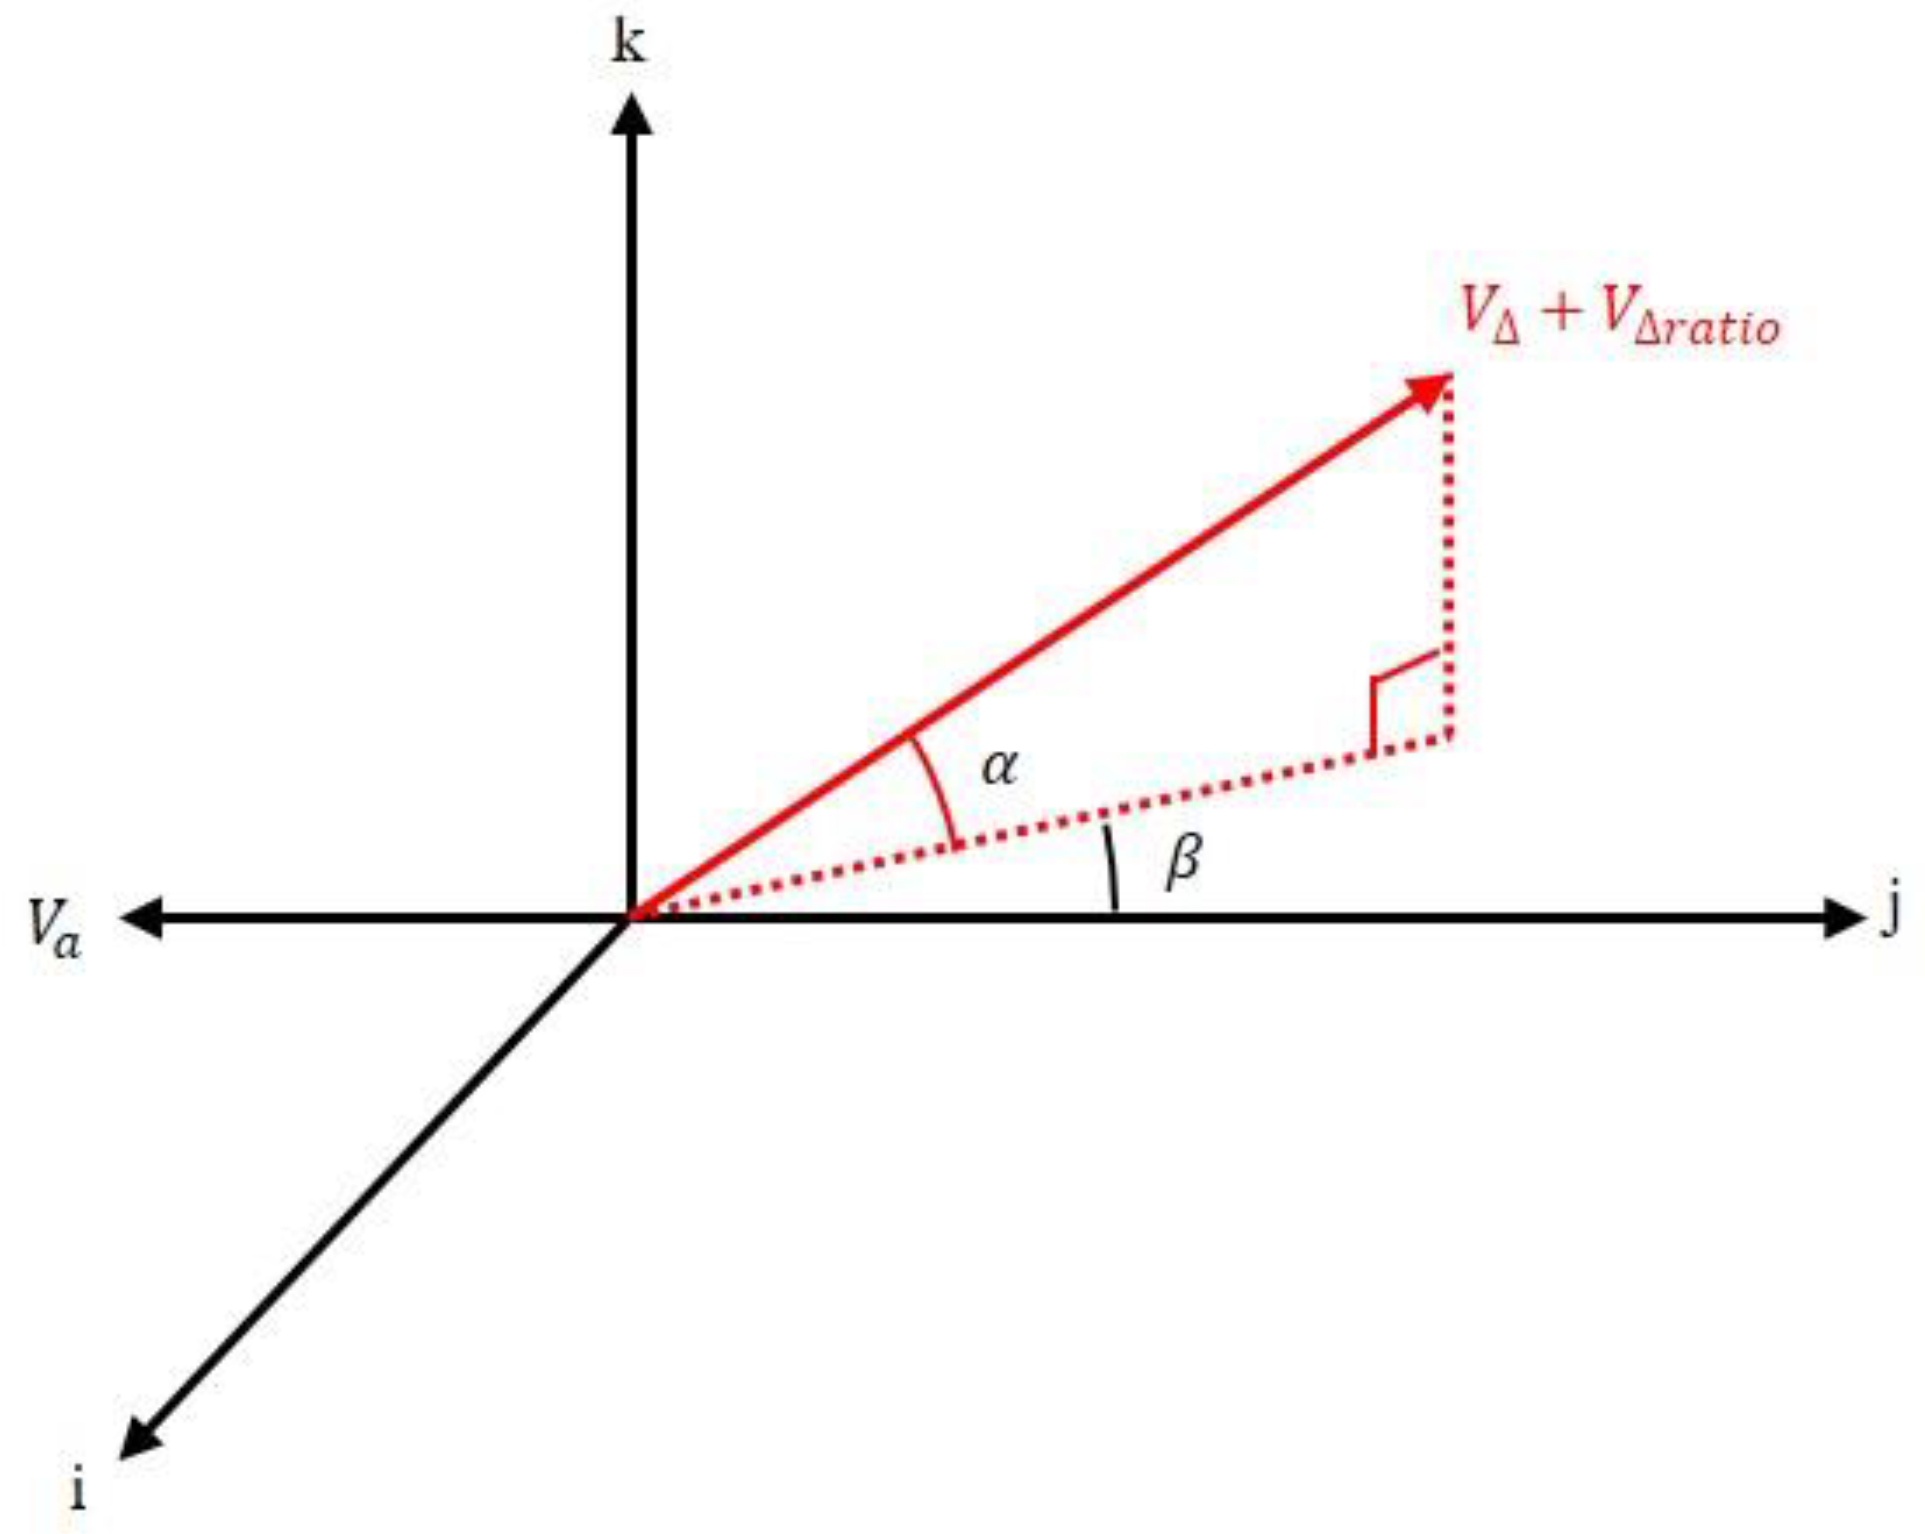
Figure 5.
Predicted stone chipping zones for various vehicle speeds, tire pressures and stone masses. (a–c): The effect of tire pressure on stone chipping zone for different vehicle speeds; (a) 60 kph; (b) 80 kph; and (c) 110 kph at the range (1~10 g) of the stone mass. (d–f): The effect of tire pressure on stone chipping zone at the vehicle speed of 110 kph for different stone masses; (d) 1 g; (e) 5 g; and (f) 10 g.

Figure 6.
Stone chipping zones for different ground clearance (ride height) (a) 0.25R; (b) 0.5R; (c) 0.75R; and (d) R; respectively.
Figure 6.
Stone chipping zones for different ground clearance (ride height) (a) 0.25R; (b) 0.5R; (c) 0.75R; and (d) R; respectively.
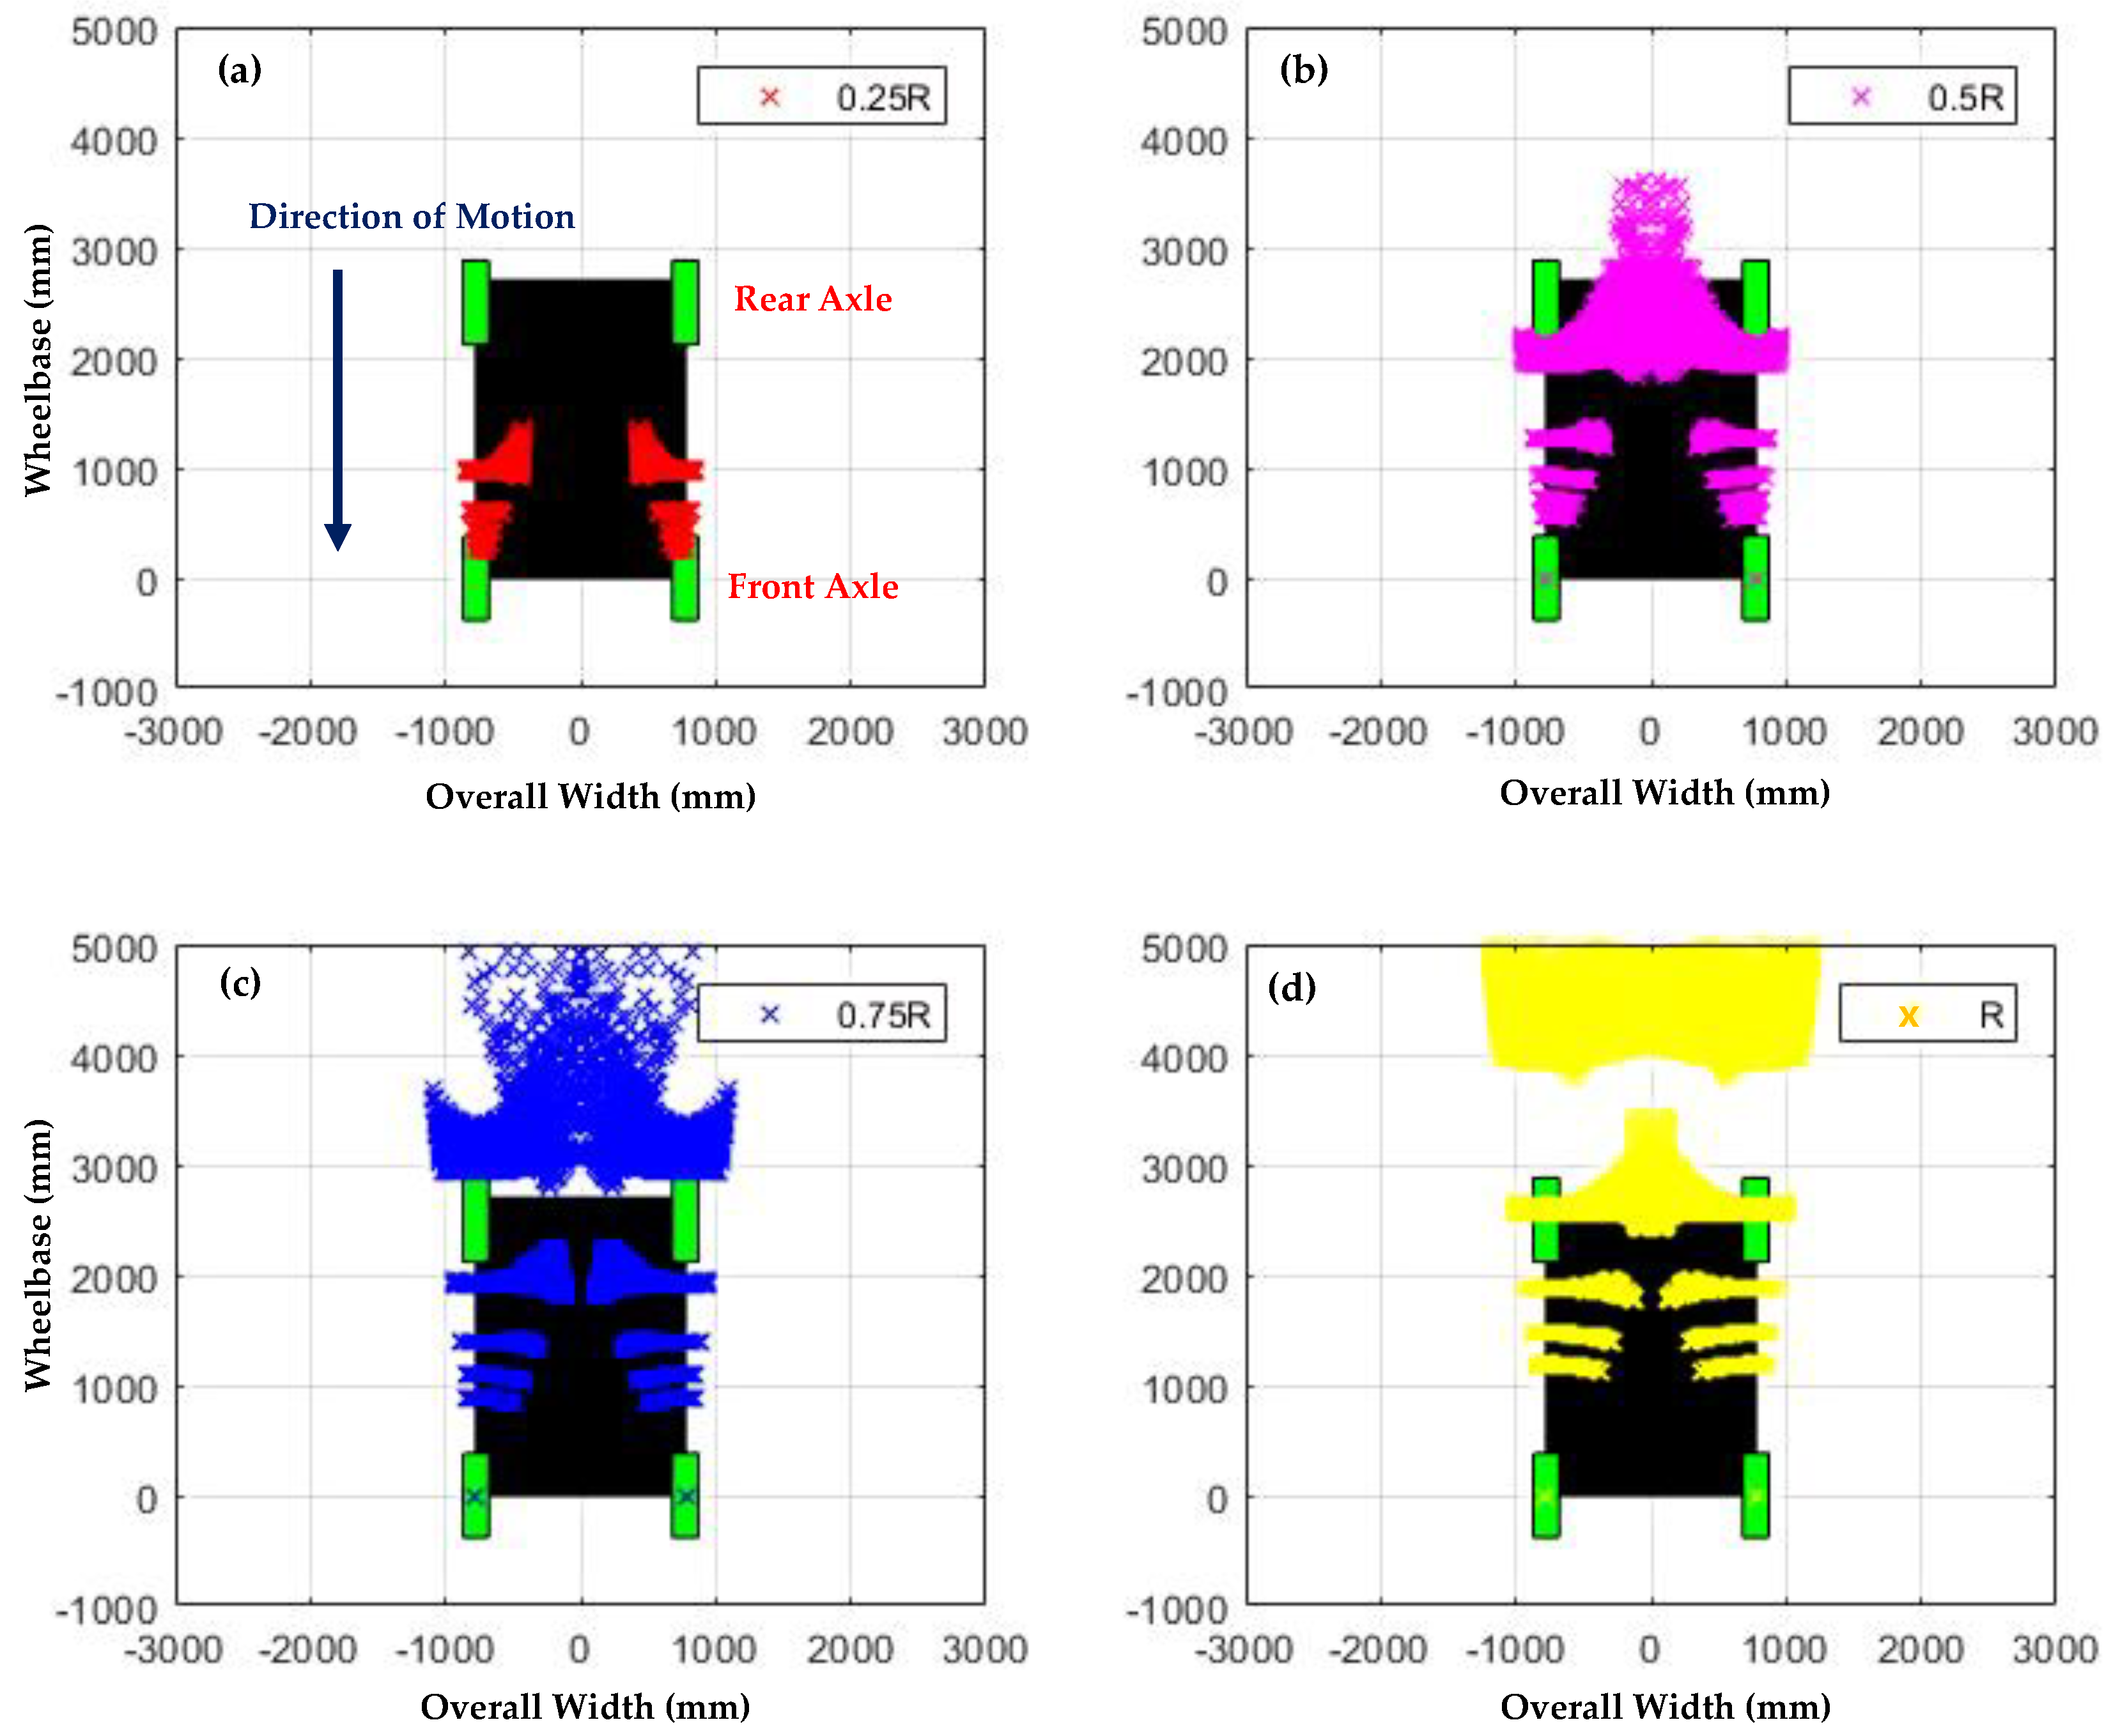
Figure 7.
Predicted stone chipping zones of all the cases (5 tire pressures, 4 ground clearances, 10 stone masses) for different vehicle speeds of (a) 60 kph; (b) 80 kph; and (c) 110 kph; (d) combination of (a–c).
Figure 7.
Predicted stone chipping zones of all the cases (5 tire pressures, 4 ground clearances, 10 stone masses) for different vehicle speeds of (a) 60 kph; (b) 80 kph; and (c) 110 kph; (d) combination of (a–c).

Figure 8.
Probability density of the stone chipping zone obtained by kernel density estimation.

Figure 9.
Stone chipping zone and energy immediately before collision.

Table 1.
Weight distribution of the tire by spline interpolation [13].
Table 1.
Weight distribution of the tire by spline interpolation [13].
| Code Angle of the Tire Belt (°) | −20 | −10 | 0 | 10 | 20 |
|---|---|---|---|---|---|
| Weight Distribution (kPa) | 6 | 4 | 8 | 4 | 6 |
| Weight Distribution Ratio | 0.75 | 0.5 | 1 | 0.5 | 0.75 |
Table 2.
Tire contact length and tangential angle for various tire pressures [13].
Table 2.
Tire contact length and tangential angle for various tire pressures [13].
| Tire Pressure (%) | 70 | 75 | 80 | 85 | 90 |
|---|---|---|---|---|---|
| Height (Dh, cm) | 22.31 | 18.59 | 14.88 | 11.16 | 7.44 |
| Tangential Angle (α, rad) | 0.2972 | 0.2465 | 0.1965 | 0.1469 | 0.0978 |
Table 3.
Numbers of stones causing chipping and the total kinetic energy in the critical zone.
| Critical Zone (mm) | 0–500 | 500–1000 | 1000–1500 | 1500–2000 | |
|---|---|---|---|---|---|
| Number of Stones | 60 kph | 2272 | 7480 | 88 | 0 |
| 80 kph | 2297 | 7491 | 86 | 1 | |
| 110 kph | 2343 | 7515 | 85 | 0 | |
| Total | 6912 | 22,486 | 259 | 1 | |
| Collision Probability (%) | 22.588 | 73.484 | 0.846 | 0.003 | |
| Total Kinetic Energy (J) | 14,423 | 217,730 | 315 | 0.54 | |
© 2018 by the authors. Licensee MDPI, Basel, Switzerland. This article is an open access article distributed under the terms and conditions of the Creative Commons Attribution (CC BY) license (http://creativecommons.org/licenses/by/4.0/).
Share and Cite
MDPI and ACS Style
Chu, Y.-J.; Eun, H.-J.; Lee, S.-Y. Prediction of Damage to the Vehicle Underbody due to Stone Chipping. Appl. Sci. 2018, 8, 1805. https://doi.org/10.3390/app8101805
AMA Style
Chu Y-J, Eun H-J, Lee S-Y. Prediction of Damage to the Vehicle Underbody due to Stone Chipping. Applied Sciences. 2018; 8(10):1805. https://doi.org/10.3390/app8101805
Chicago/Turabian StyleChu, Yong-Ju, Hyo-Jun Eun, and Seung-Yop Lee. 2018. "Prediction of Damage to the Vehicle Underbody due to Stone Chipping" Applied Sciences 8, no. 10: 1805. https://doi.org/10.3390/app8101805
Note that from the first issue of 2016, this journal uses article numbers instead of page numbers. See further details here.