Extending Battery Lifetime by Avoiding High SOC


Department of Electrical Engineering, Chalmers University of Technology, 41296 Gothenburg, Sweden
*
Author to whom correspondence should be addressed.
Appl. Sci. 2018, 8(10), 1825; https://doi.org/10.3390/app8101825
Submission received: 4 September 2018
/
Revised: 25 September 2018
/
Accepted: 1 October 2018
/
Published: 4 October 2018
(This article belongs to the Special Issue Plug-in Hybrid Electric Vehicle (PHEV))
Abstract
:The impact of ageing when using various State of Charge (SOC) levels for an electrified vehicle is investigated in this article. An extensive test series is conducted on Li-ion cells, based on graphite and NMC/LMO electrode materials. Lifetime cycling tests are conducted during a period of three years in various 10% SOC intervals, during which the degradation as function of number of cycles is established. An empirical battery model is designed from the degradation trajectories of the test result. An electric vehicle model is used to derive the load profiles for the ageing model. The result showed that, when only considering ageing from different types of driving in small Depth of Discharges (DODs), using a reduced charge level of 50% SOC increased the lifetime expectancy of the vehicle battery by 44–130%. When accounting for the calendar ageing as well, this proved to be a large part of the total ageing. By keeping the battery at 15% SOC during parking and limiting the time at high SOC, the contribution from the calendar ageing could be substantially reduced.
1. Introduction
Electrified vehicles (EVs) are today becoming more and more common. Despite the significant decreases in the cost of the battery, the battery itself is still the dominating cost in the electric propulsion system. It is thus of very high importance that the battery in the vehicle degrades as little as possible during the life of the vehicle.
It is well known that high temperature has a negative impact on battery ageing [1,2,3,4,5]. Another factor that affects the ageing is the Depth of Discharge (DOD), where a larger DOD increases the ageing [6,7]. High charge and discharge rates accelerate the ageing [6,7,8]. For the investigated test cell, current rates over 3C are considered as high and rapidly deteriorates the cell if used for longer than a few seconds.
In vehicle applications, the discussion has been very focused on the driving range of the vehicle. A study by S. Karlsson [9] on drive patterns showed that the most common trip is 30–50 km long and that the majority of trips were even shorter.
The driving range of EVs today are from 100 km [10] and up to 499 km [11], meaning that the battery in most occasions only will be used in a small DOD before it is charged again. It is therefore of high interest to investigate the effects this user pattern can have on the vehicle battery.
Only few studies concerning small DODs can be found in the literature, and even fewer are considering the ageing effect of the placement of the DOD in the State of Charge (SOC) window. The ageing as a function of SOC levels for LiFePO (LFP) battery cells was investigated in [1,2] and it was found that high and low SOC levels are substantially degrading the cell. Similar results were presented for an NMC cell [3]. However, extensive testing on large commercial cells in small DODs at different SOC levels have not been documented to this date.
The purpose of this article is to investigate the ageing dependency on SOC, using an extensive test series on large commercial cells as foundation. An empirical model is used to quantify this impact in synthetic drive cycles as well as more realistic drive cycles and user cases. Furthermore, a final objective is to establish the impact of calendar ageing, i.e., to plan the charging so that a more favourable SOC level can be used for the battery while the vehicle is parked.
2. Methods
2.1. Battery Cell Test Set-Up
A 26 Ah commercial pouch battery cell is used as reference object. The SOC window is defined, based on the recommendations from the cell manufacturer, by a lower and upper voltage limit of 2.8 and 4.15 V.
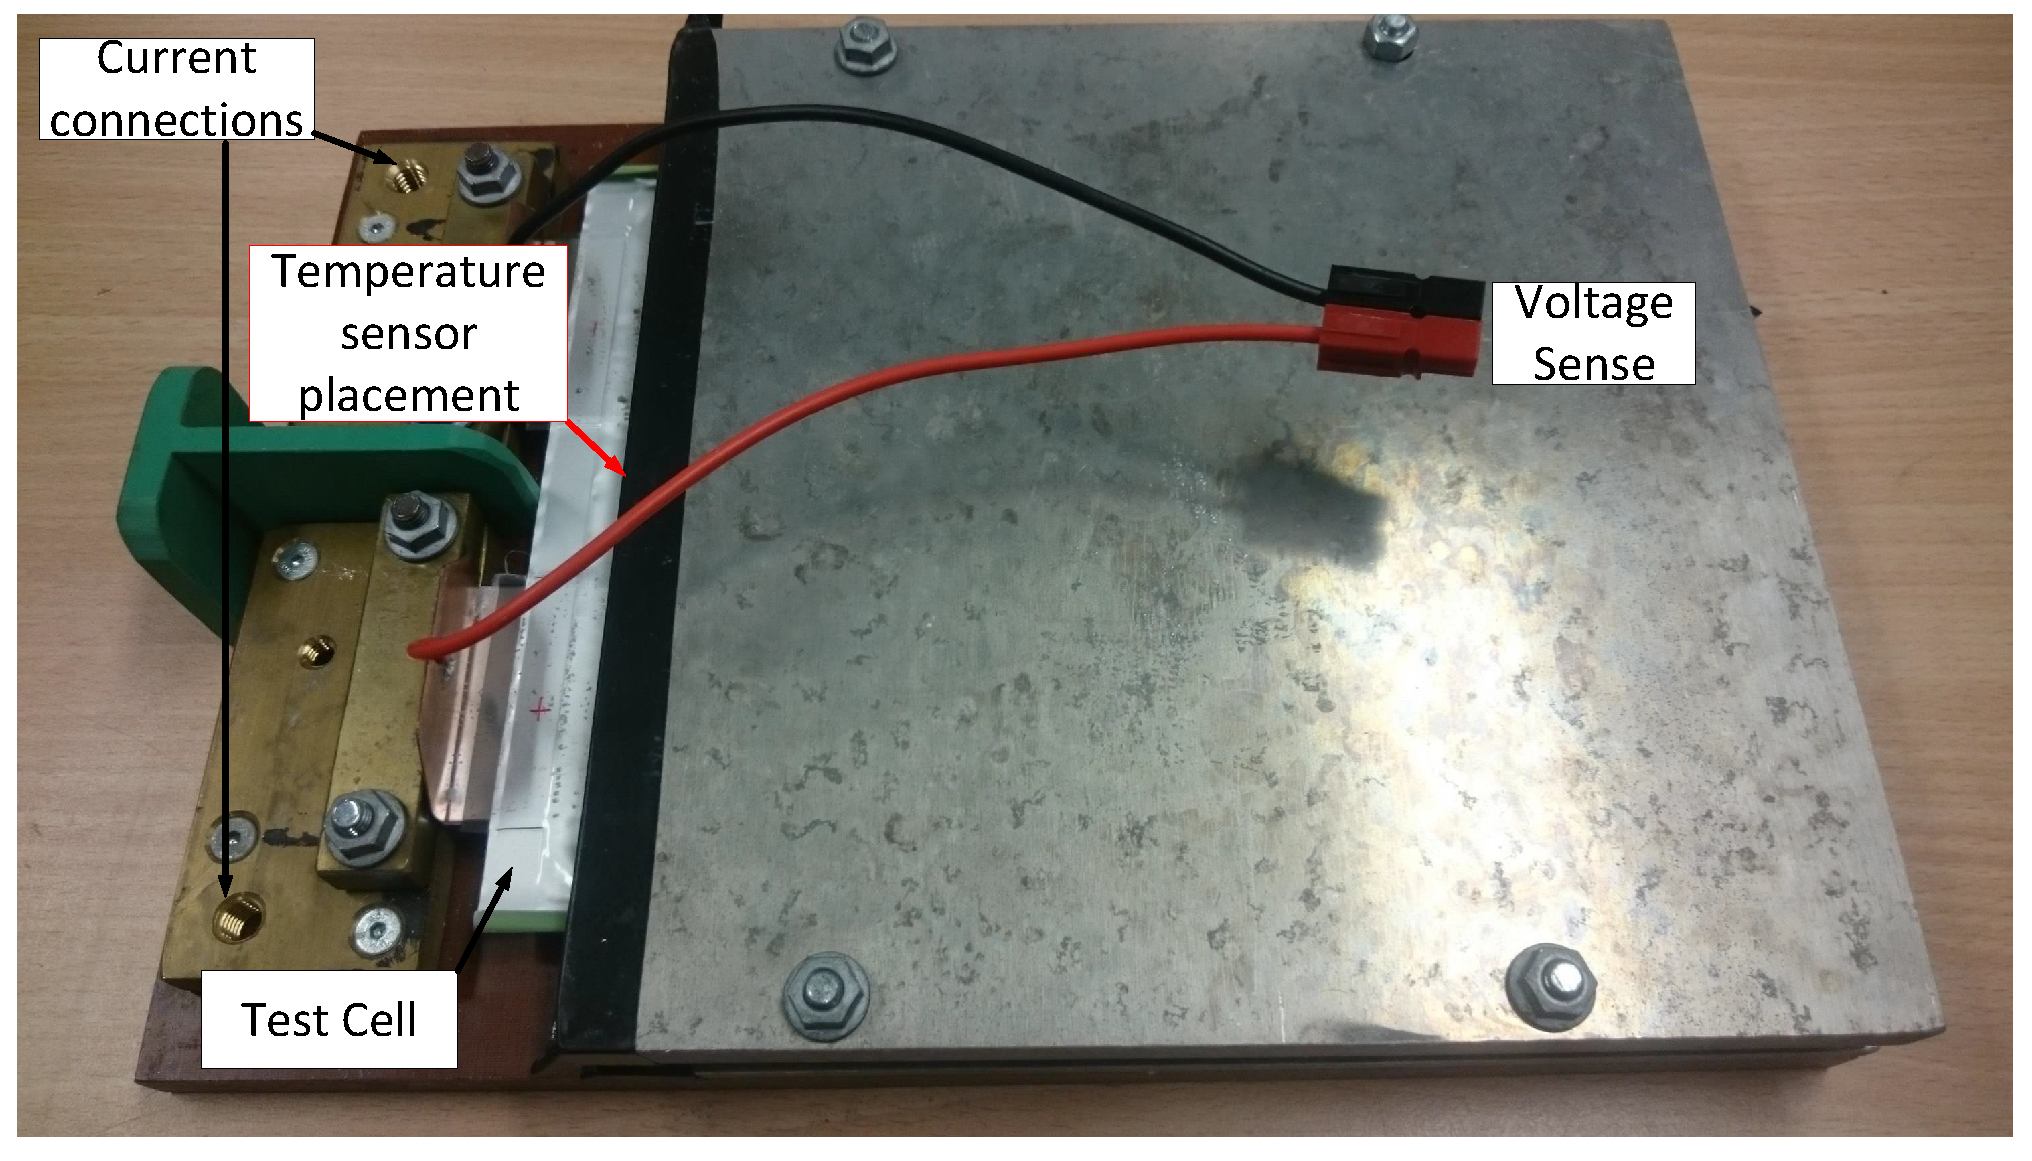
The cells are put in a test set-up as presented in Figure 1. The set-up comprises of the test cell, current connections, voltage and temperature sensors, a bakelite bottom and two aluminum plates to represent the cell placed in a battery pack. The equipments used for the lifetime testing were a MACCOR Series 4000, a PEC SBT0550, and a Digatron MCT 100-05-08 ME.
Apart from registering the voltage and current, the temperature of the cell was also monitored. The ambient temperature was controlled by climate chambers Vötsch VT3 7034, VT3 4060, VC 4033, and Climate Temperature System (CTS) T-40/350.
The cells were tested using symmetric synthetic constant current (CC) cycles in different SOC levels, C-rates, and temperatures. The charge and discharge currents were always kept the same. A test cycle with a 1C charge and 1C discharge is here represented by the shorter notation 1C. In Table 1, the full test matrix is provided.
2.2. Test Procedure
The capacity as well as the impedance of the battery cells were investigated on a regular basis during the lifetime, using an RPT (Reference Performance Test) procedure, at approximately each 200 Full Cycle Equivalent (FCE). The RPT procedure contains a 1C capacity measurement, followed by discharge and charge pulses at 5C and 1C at every 10% SOC level.
2.3. Measurement Results
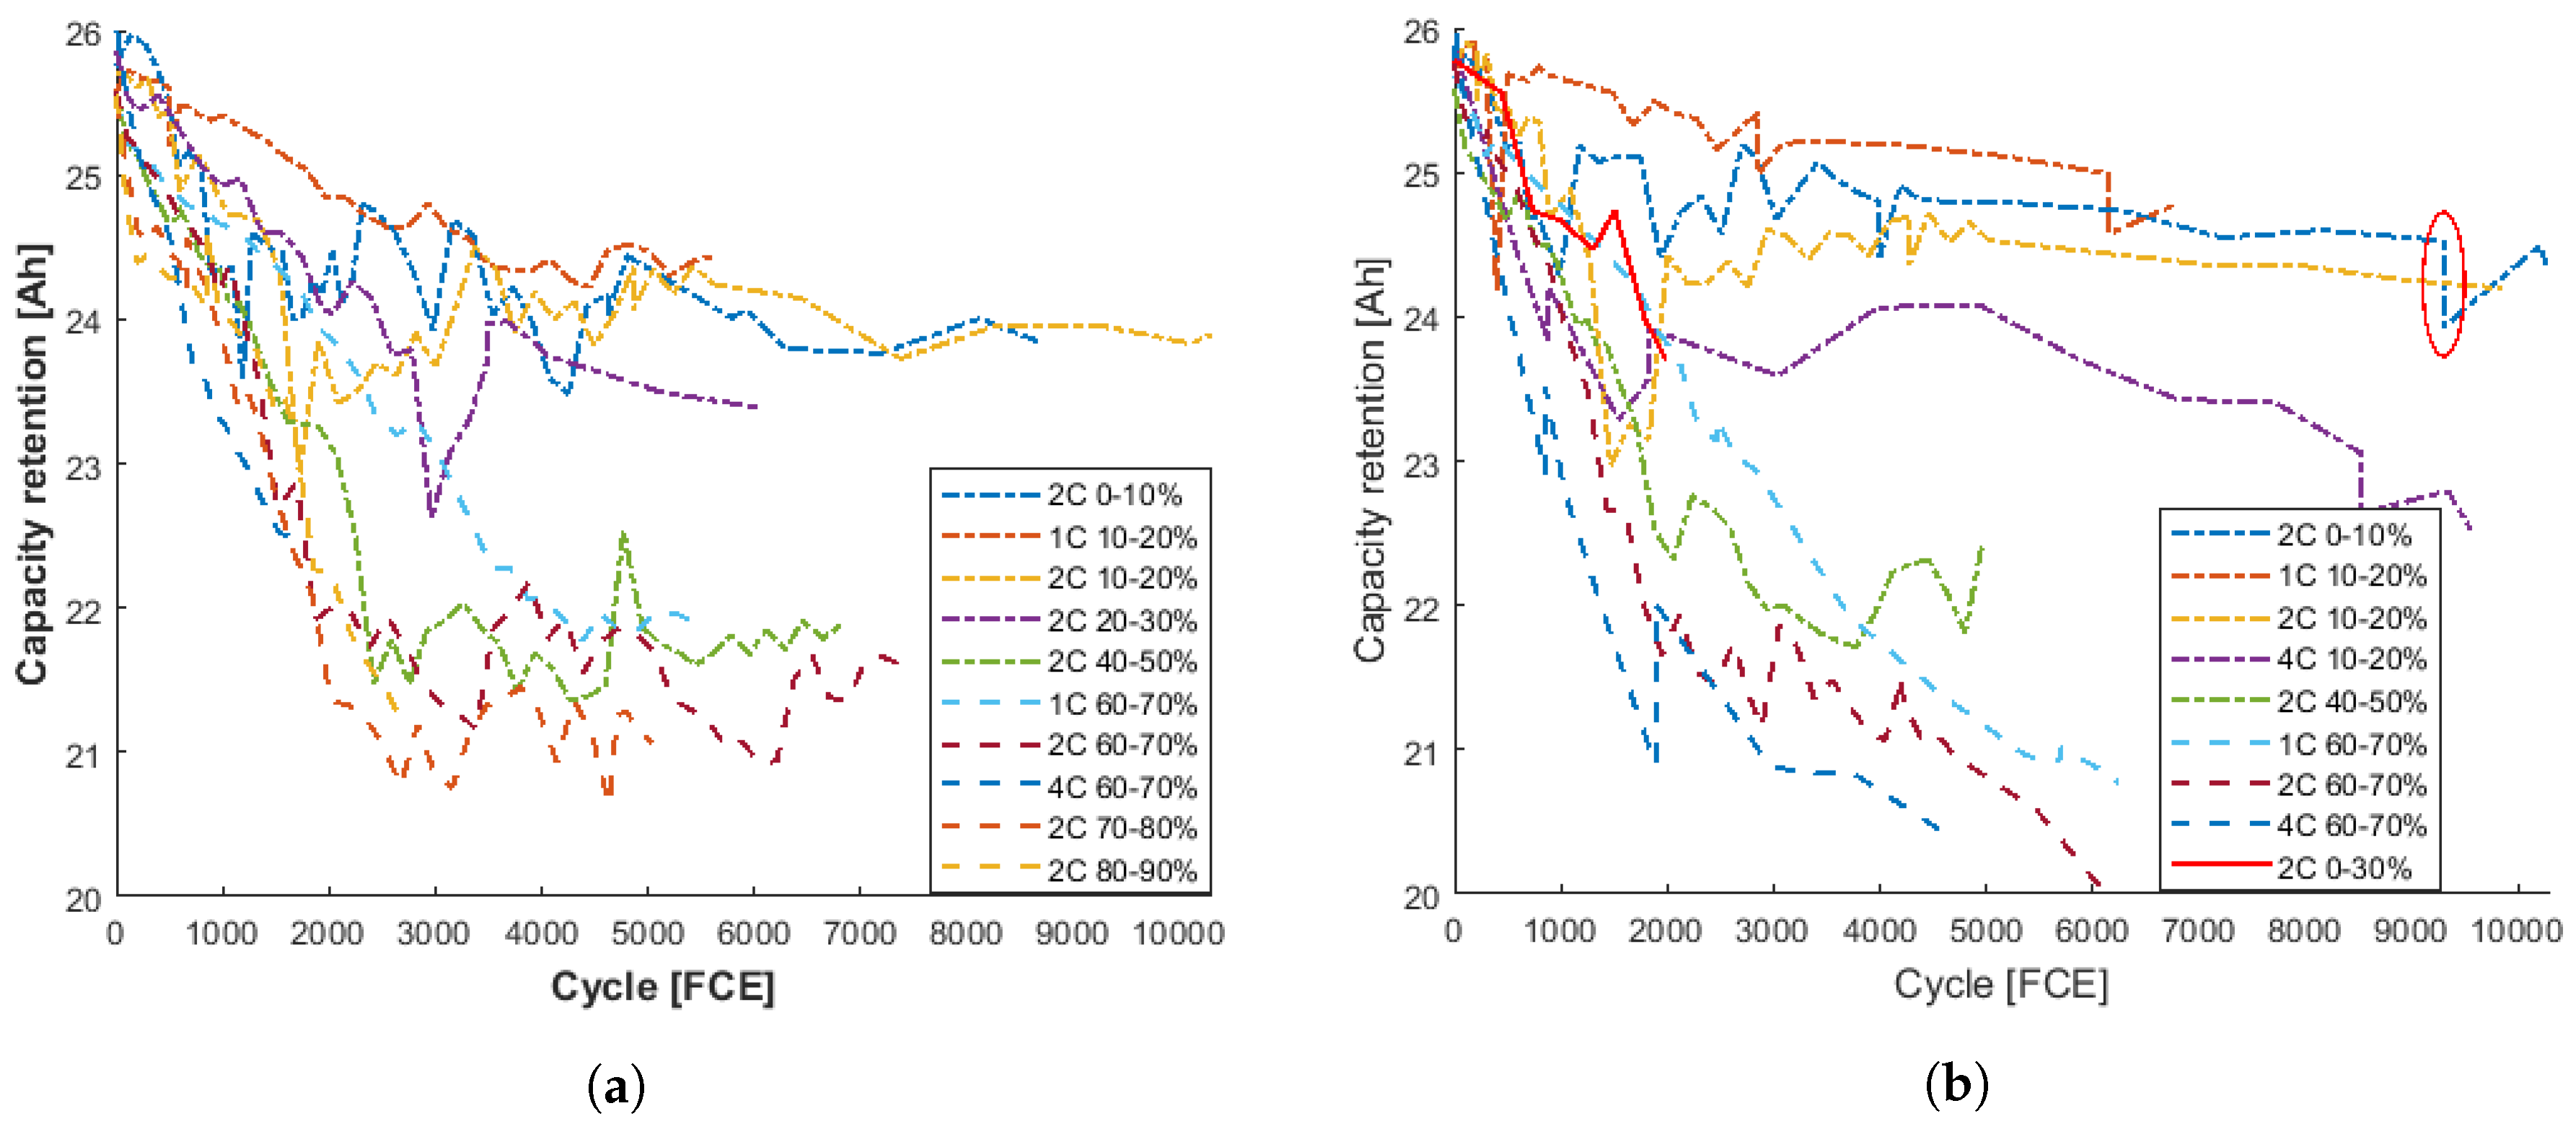
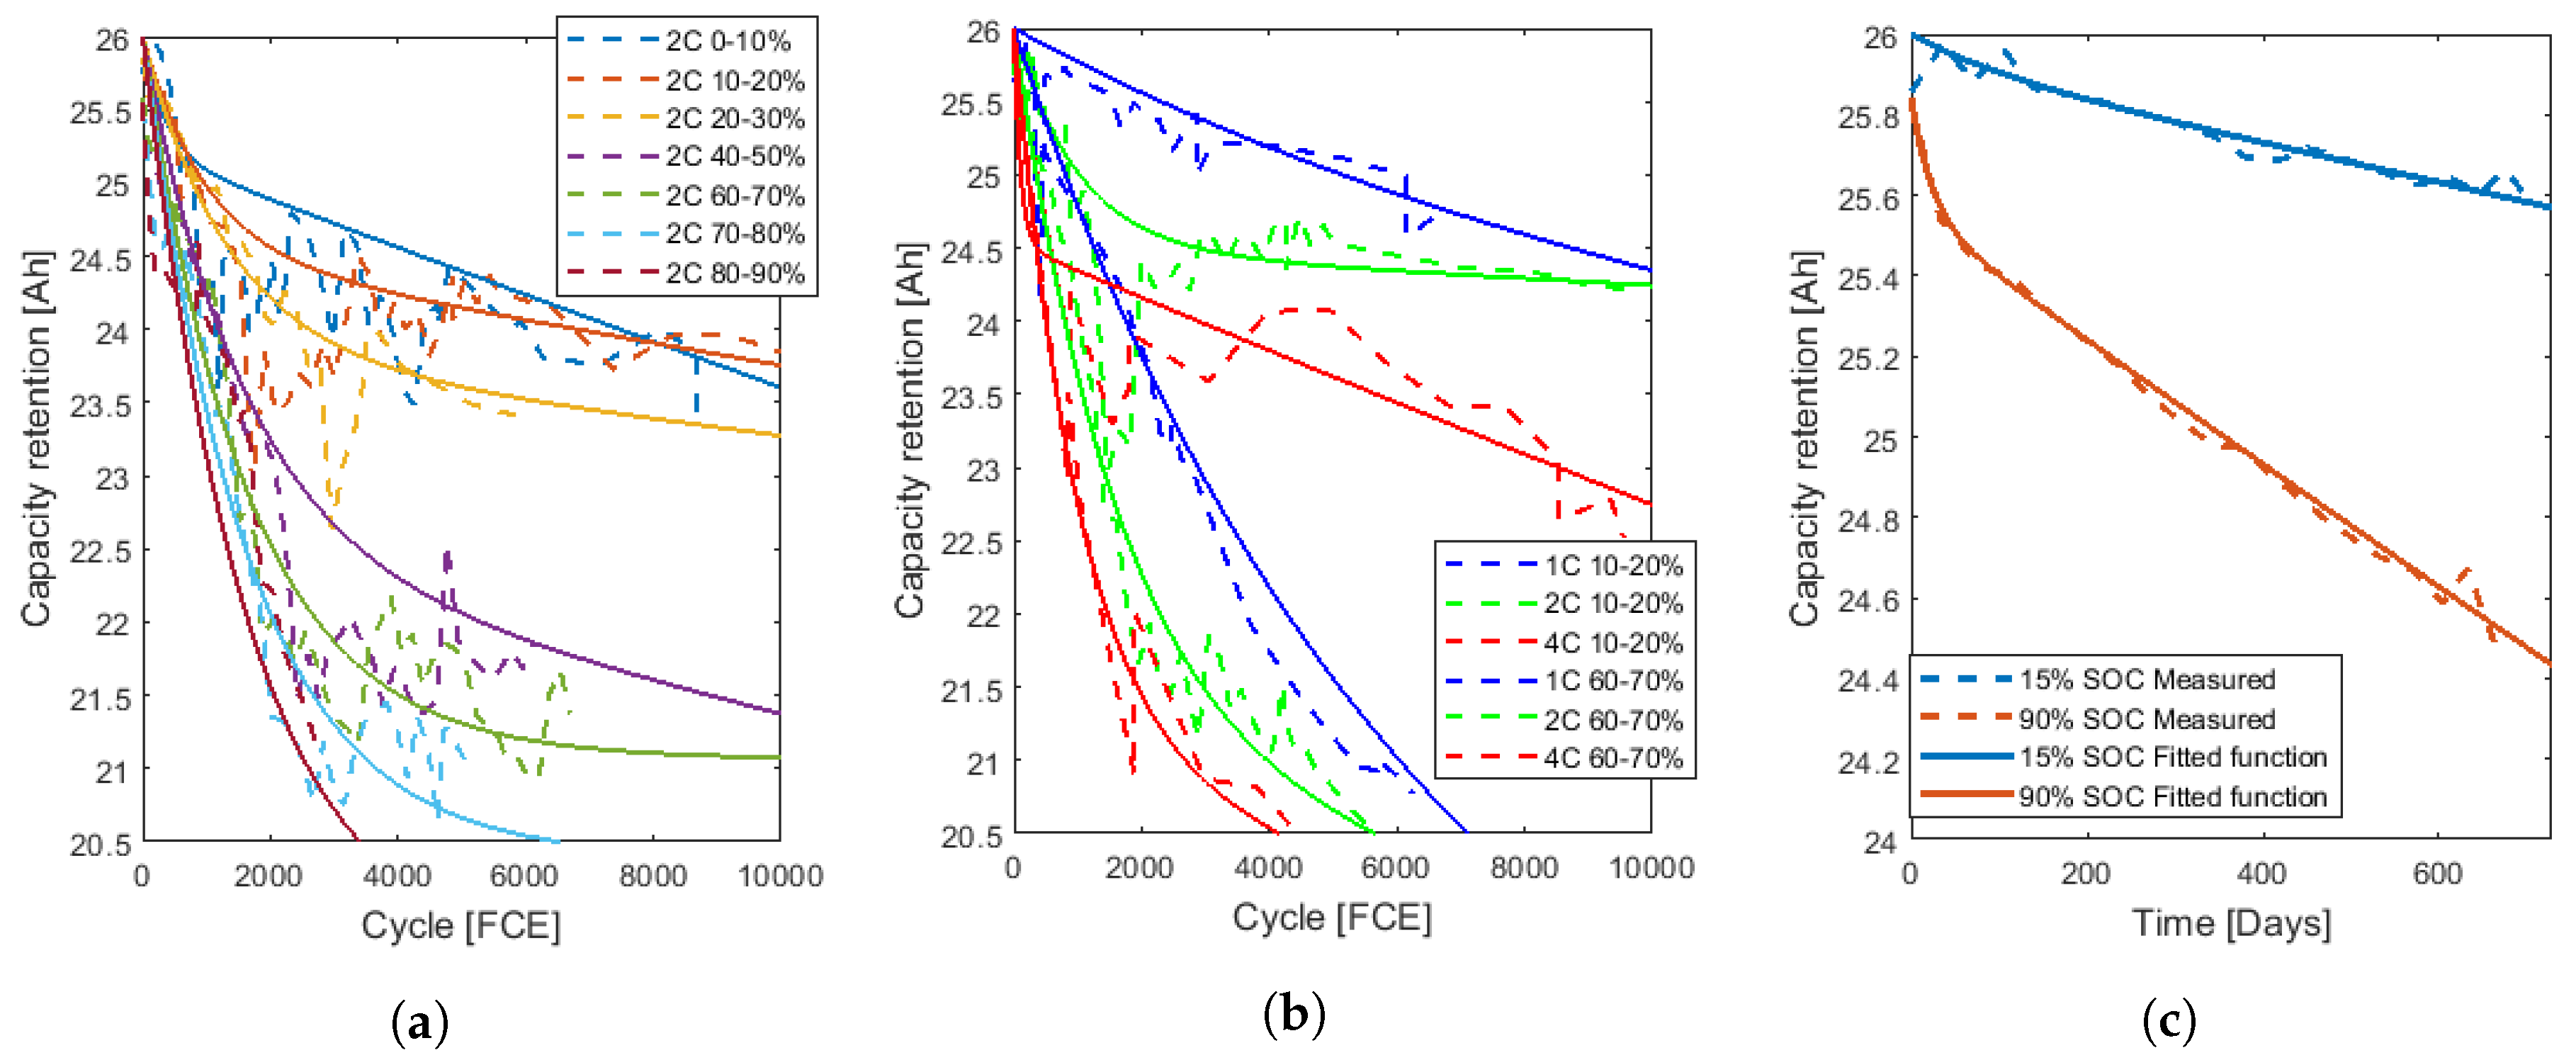
To be able to compare the tested cells, regardless of DOD used during the tests, all test cycles were normalised to FCEs. In Figure 2, the capacity retention with various SOC levels are given as function of FCE. The lifetime tests were performed over a three-year period. Tests in higher SOC levels and higher C-rates did not require as much test time as tests conducted in lower SOC levels and using lower C-rates.
During this long test period, maintenance of the test equipment had to be performed at several occasions. An RPT test was performed before and after a planned maintenance stop, thus showing two results for the same cycle number where some of the results showed rather big differences. One of this events is marked with a read ellipse in Figure 2b where a vertical drop can be seen in the capacity curve. During these rest periods, the cells are in most cases losing capacity, though in the case for the aggressive test using a 4C rate, the cell instead recovered capacity. The cells cycled at low SOC levels had an average of three of these planned stops, while the shorter tests conducted at high SOC levels only had two in average. Furthermore, the data have higher fluctuations than expected, compared to cycle tests conducted using a large DOD (see [6]). Too few reports have been published on testing in small DODs to explain this. Similar fluctuations, though not as large, can be seen in the data presented by Schmalstieg et al. [3], supporting that tests in small DODs introduce a behaviour not seen when cycled in a large DOD.
The data show two distinct ageing patterns, one for the lower SOC levels and one for the higher SOC levels. This has also been observed when performing post mortem on the investigated cells where two cells in 60–70% SOC and 10–20% SOC were studied. The study showed that cycling in 60–70% SOC generated greater loss of cathode material, thicker SEI (Solid Electrolyte Interface) layer, and higher resistance on the anode compared to the cell cycled in 10–20% SOC [12]. Surprisingly, in the lower SOC levels, even the 4C test is performing well. All the 10% DOD data were used to develop the empirical ageing model. The 0–30% SOC data was used as a verification case for the model.
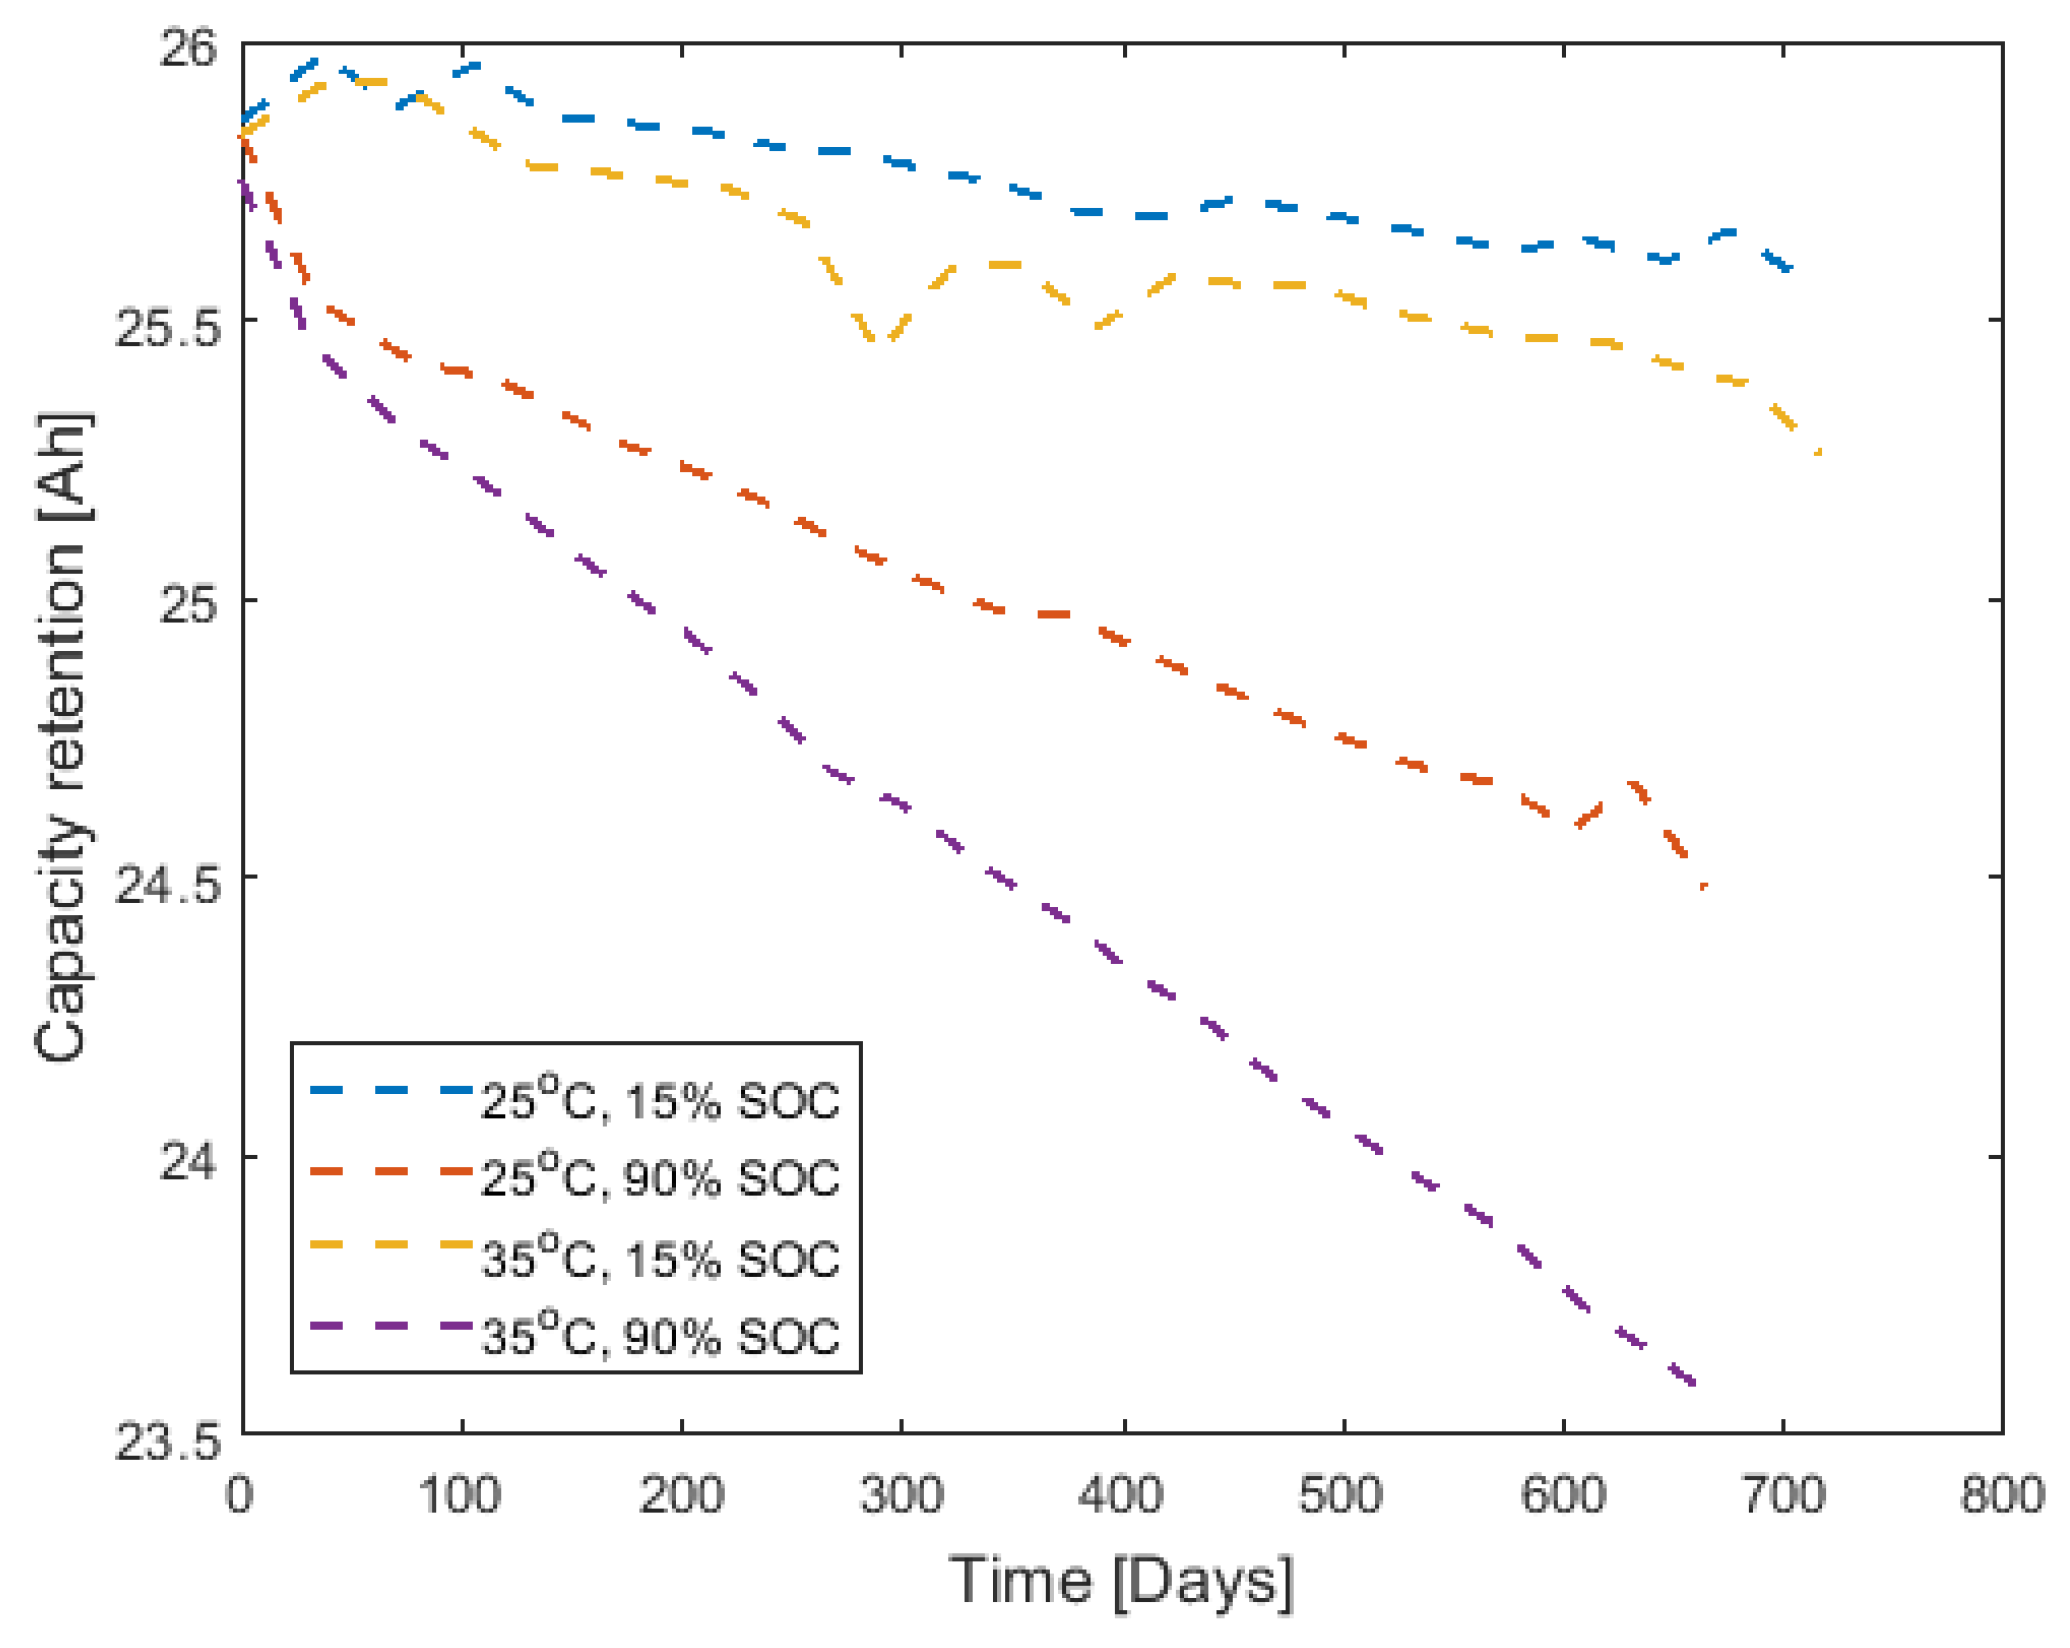
Calendar ageing in 25 C and 35 C at two SOC levels, 15 and 90% SOC, were performed for almost 700 days. The results, shown in Figure 3, clearly shows the difference between the low and high SOC levels, as well as the expected behavior for increased temperature.
3. Model Development
By studying the shape of the capacity degradation as a function of FCE for the tested cells, it was found that a second order exponential function could represent the behaviour in an adequate way. The following equation was thus used
The equation and its parameters are mathematical adaptations and can not be linked to a physical background. Since the initial capacity is known, the expression was simplified using .
Equation (1) was fitted to all the data tested in 2C for both temperatures and the trend in the a, b and d parameters were studied. From this, a linear relation for parameter a was established as a function of SOC
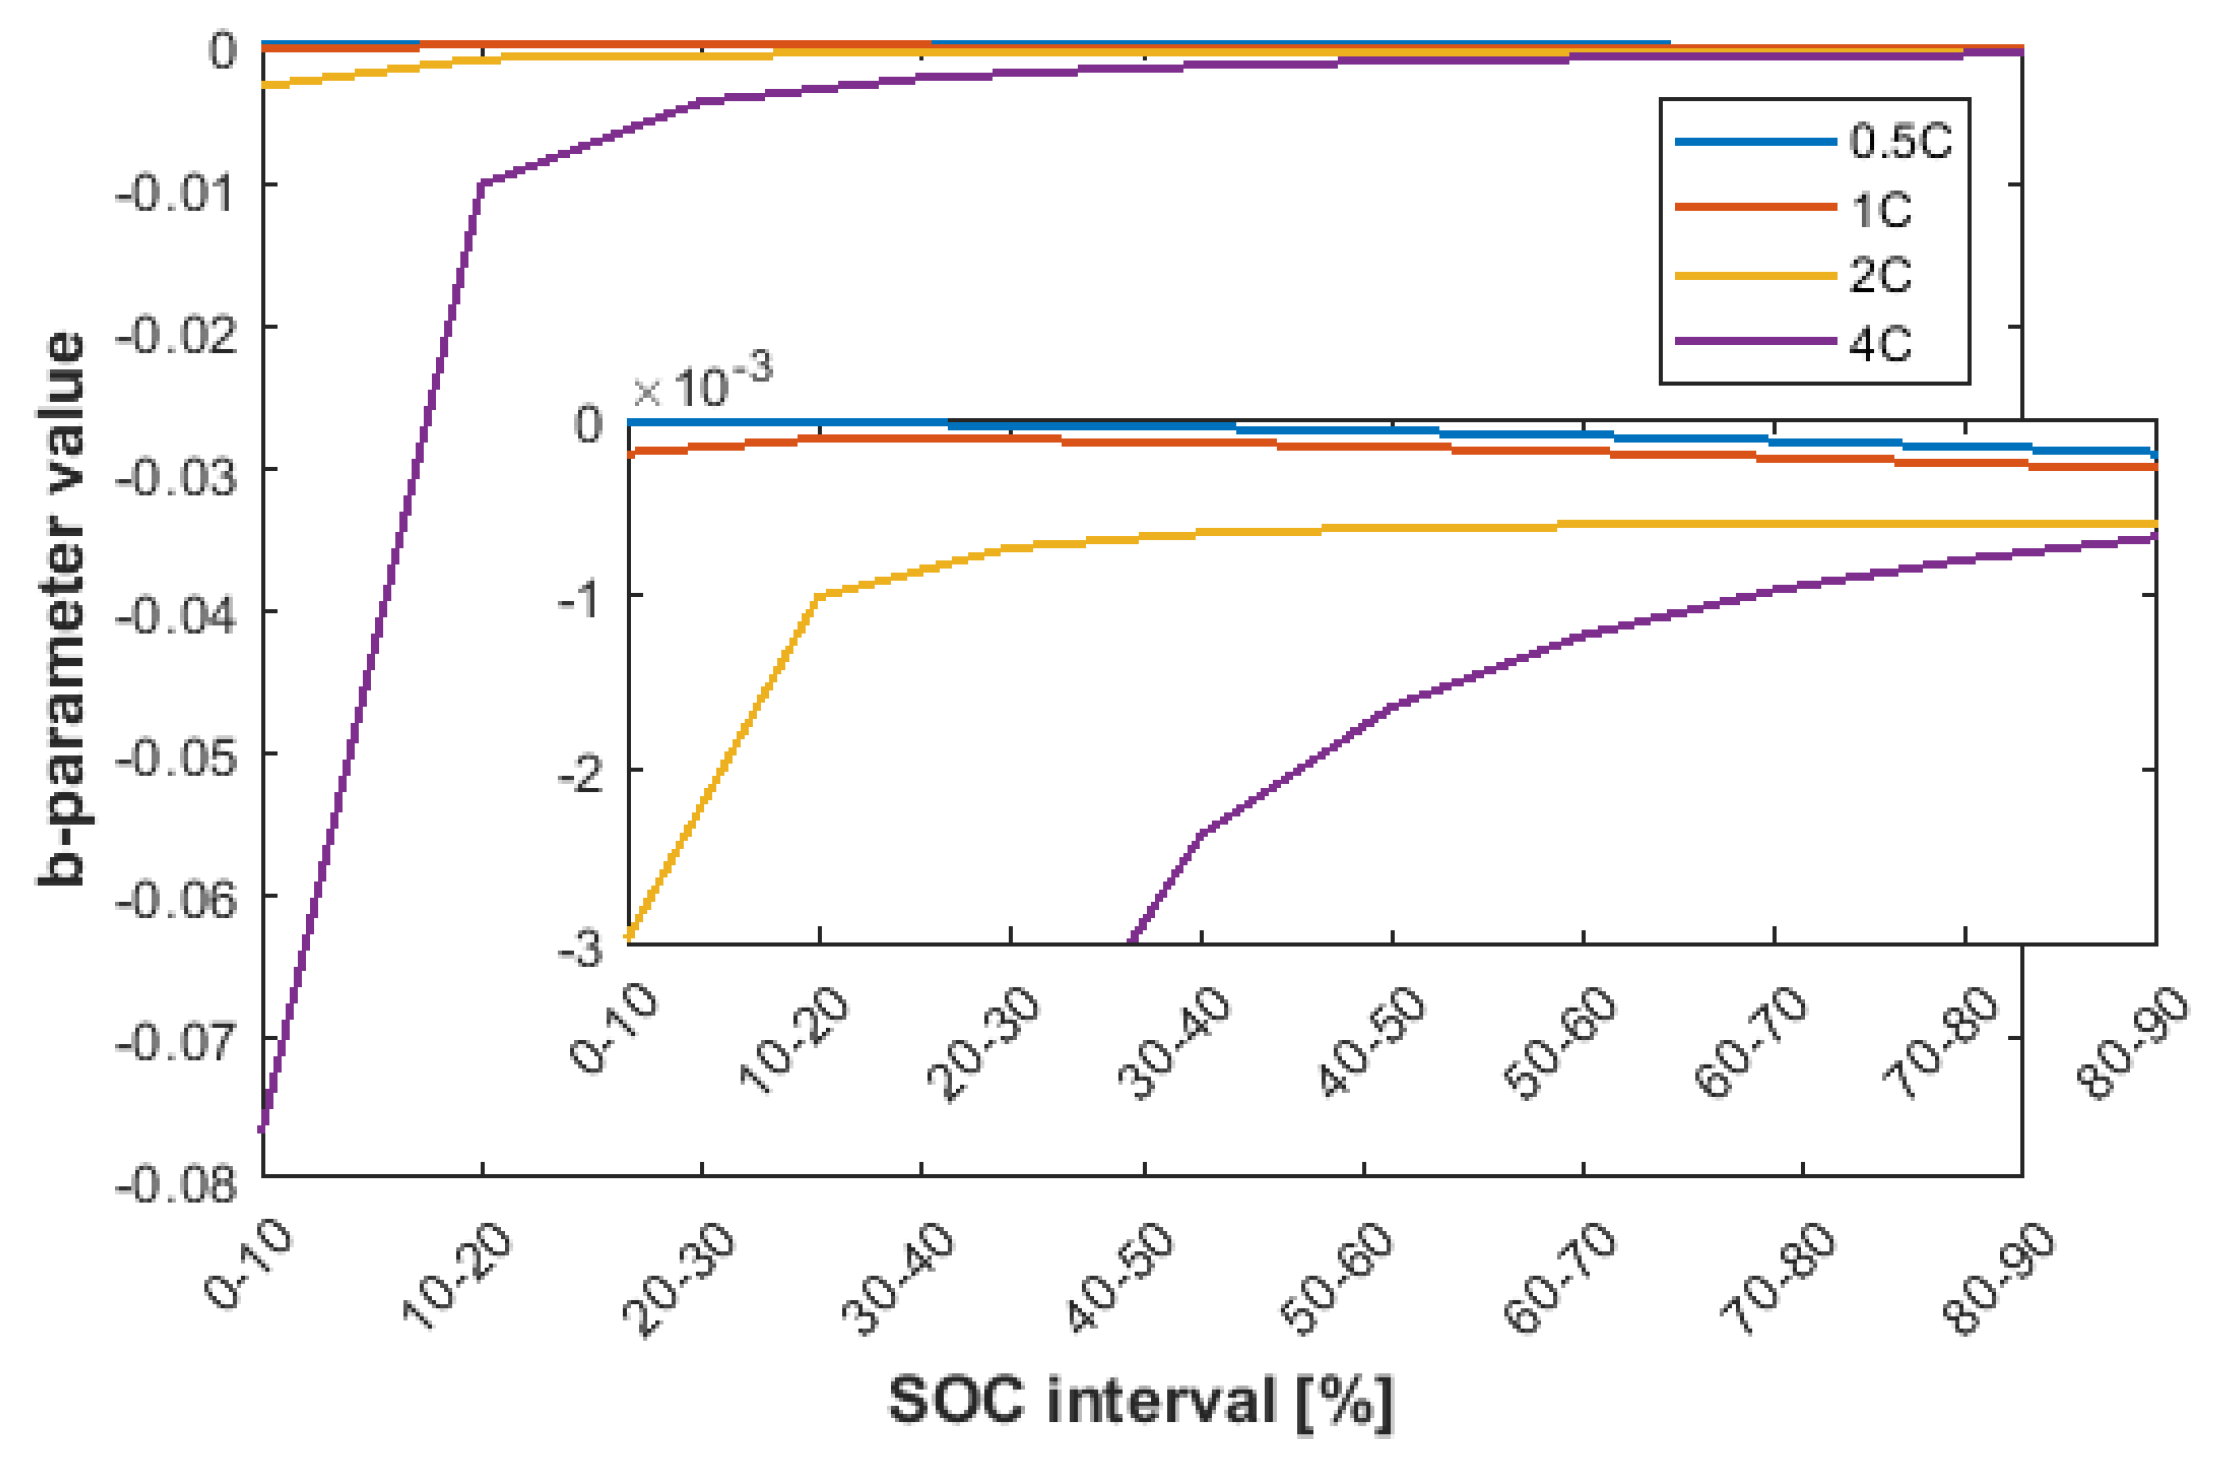
The fitting procedure was then repeated, now using a from Equation (2). Parameter b was found to be depending on SOC and C-rate as
and the value for the b parameter as function of SOC for different C-rates is presented in Figure 4.
Now, using the values calculated from Equations (2) and (3) for a and b in Equation (1), the data were fitted again. The behaviour for parameter d with its SOC and temperature dependency was more difficult to capture. A decent fit to the data could only be achieved with a 4th order polynomial for the SOC dependence, not including the temperature dependency. With an value of only 0.8 for the SOC dependency, it was decided to use a look-up table for the d parameter (see Table 2). For the SOC intervals missing in the test data, interpolation was used to estimate the d parameter. To calculate the d parameter at temperatures between 25 and 35 C, a linear relationship was used.
The parameter d showed also a dependency on C-rate. The difference between the , and values in 35 C was used to estimate the d value according to:
The resulting performance of the degradation function after its parametrisation is shown in Figure 5a for the SOC behavior towards the experimental data for 25 C, and in Figure 5b for 35 C. The parametrised functions represent the measured results well. Furthermore, it can be clearly noted that the battery will last much longer if used in the lower SOC intervals even when using higher C-rates.
For the calendar data, (1) was fitted to the data in 25 C, though now as a function of days. The results are shown in Figure 5c, using the corresponding equations
3.1. Cycling Ageing Model
To translate the ageing function of the cell model into a battery pack ageing model, the capacity of the cells were normalized and from here on all the capacity degradation will therefore be presented in %.
In vehicles, the full capacity of a battery pack is normally not utilised, in order to extend the lifetime of the battery. When 100% SOC is displayed in the vehicle, i.e., fully charged, this could typically correspond to the single cells being charged to about 90% of the upper SOC limit given by the manufacturer. In the same way, the 0% SOC indication in the vehicle are normally not the 0% rated SOC of the battery cells. Typically, this will be around 10–15% of the battery cell SOC.
For this model, we will disregard the lower limit and allow the use until 0% SOC for the battery cell. The model validity is limited to 90% SOC as an upper limit. With these limits, the model can be run in intervals up to 90% DOD.
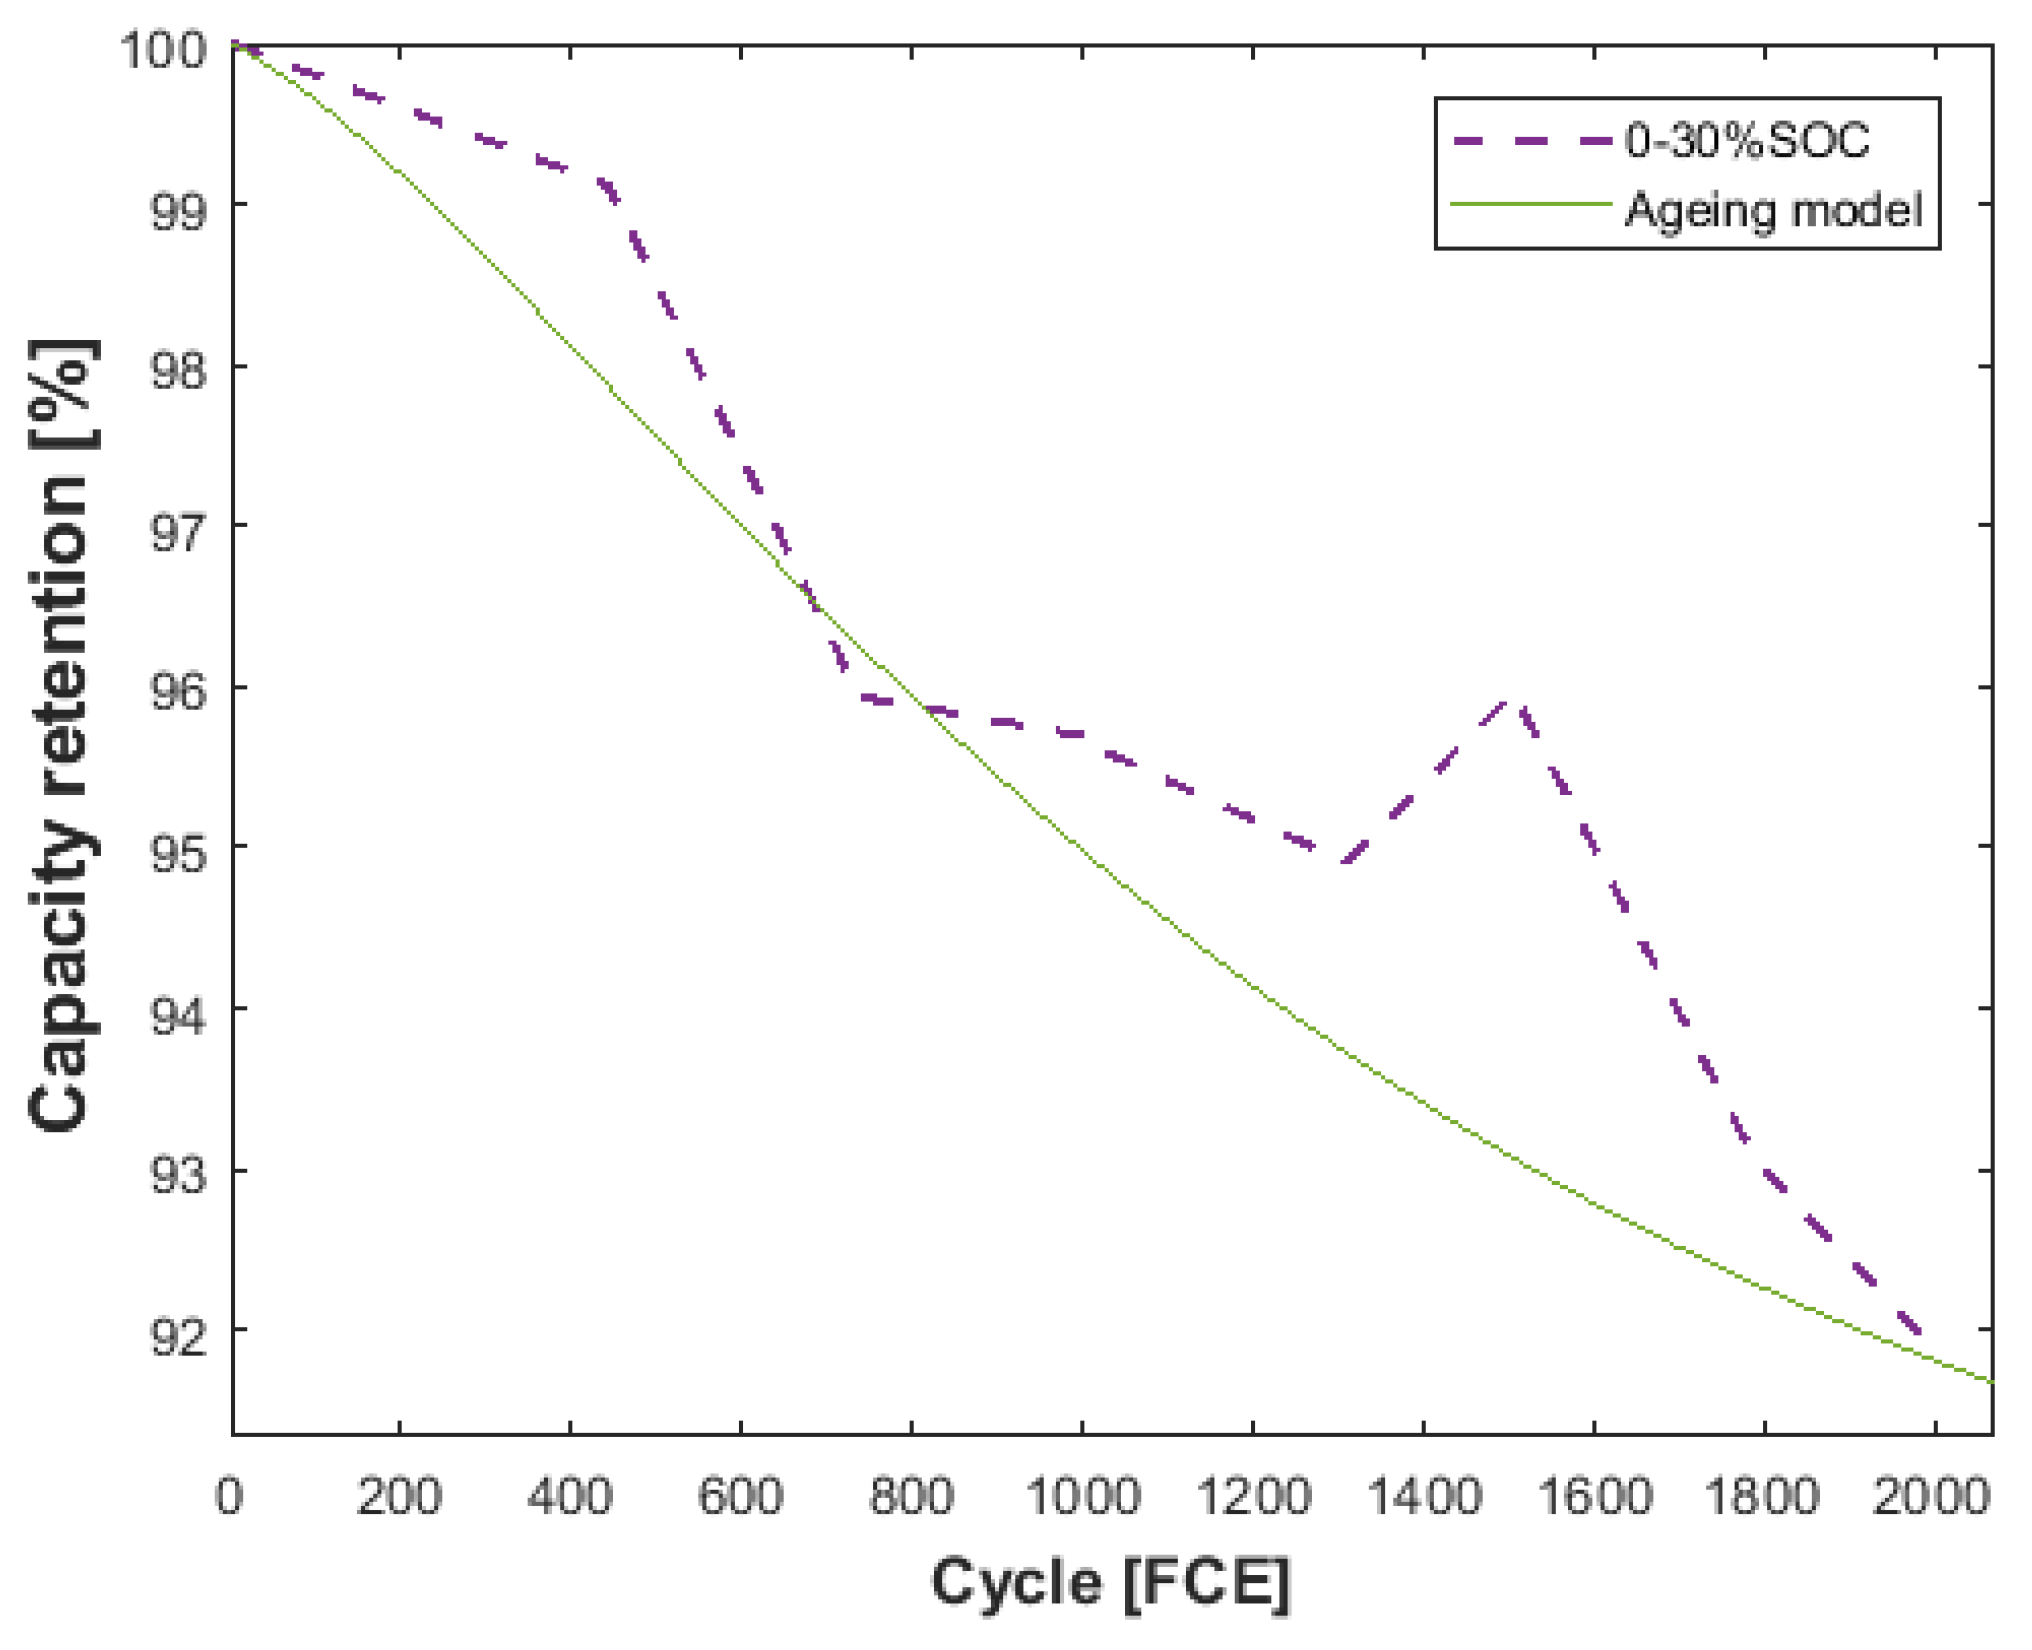
To calculate the capacity degradation in intervals larger than 10% DOD, the contributions from each 10% DOD were added together. For example, a 30% DOD in 0–30% SOC adds the contribution for 0–10%, 10–20% and 20–30% SOC. Figure 6 shows experimental data and the model results for this interval using a 2C rate in 35 C. As can be noted, the ageing function predicts the result well also for the 0–30% SOC case.
3.2. Vehicle Model and Vehicle Parameters
In order to investigate the impact in a vehicle application, three vehicles are designed and an energy consumption model is set up, based on the force balance of the vehicle according to
where the different forces are described as
where is the air density, the coefficient of aerodynamic resistance, A the frontal area of the vehicle, vehicle speed, wind speed, the rolling resistance coefficient, m the vehicle mass, g gravitation constant on earth, and road inclination. Both the wind speed and road inclination are set to 0, since this will only introduce small errors [10], and for this study these discrepancies will not affect the results.
The air drag force and rolling resistance force are always working against the direction of the movement. Many EVs have a regenerative braking system, though, for this study, the brake force is only considered to be a friction based brake system.
To account for the losses in the different components in the powertrain, an efficiency factor was used. The efficiency factor for an electric powertrain depends on all the efficiencies of the separate components in the powertrain, which, in turn, depend on their different working ranges, i.e., the vehicle speed and torque. The efficiency has been measured to be 0.6–0.9 [10], and for this work an efficiency factor of 0.8 has been used for the whole drivetrain.
Three vehicles are used representing a small Battery Electric Vehicle (BEV), Vehicle 1, a medium-sized BEV, Vehicle 2, and a Plugin Hybrid Electric Vehicle (PHEV), Vehicle 3. The data of the vehicles are presented in Table 3.
4. Drive Cycle and Drive Cases
4.1. Drive Cycle
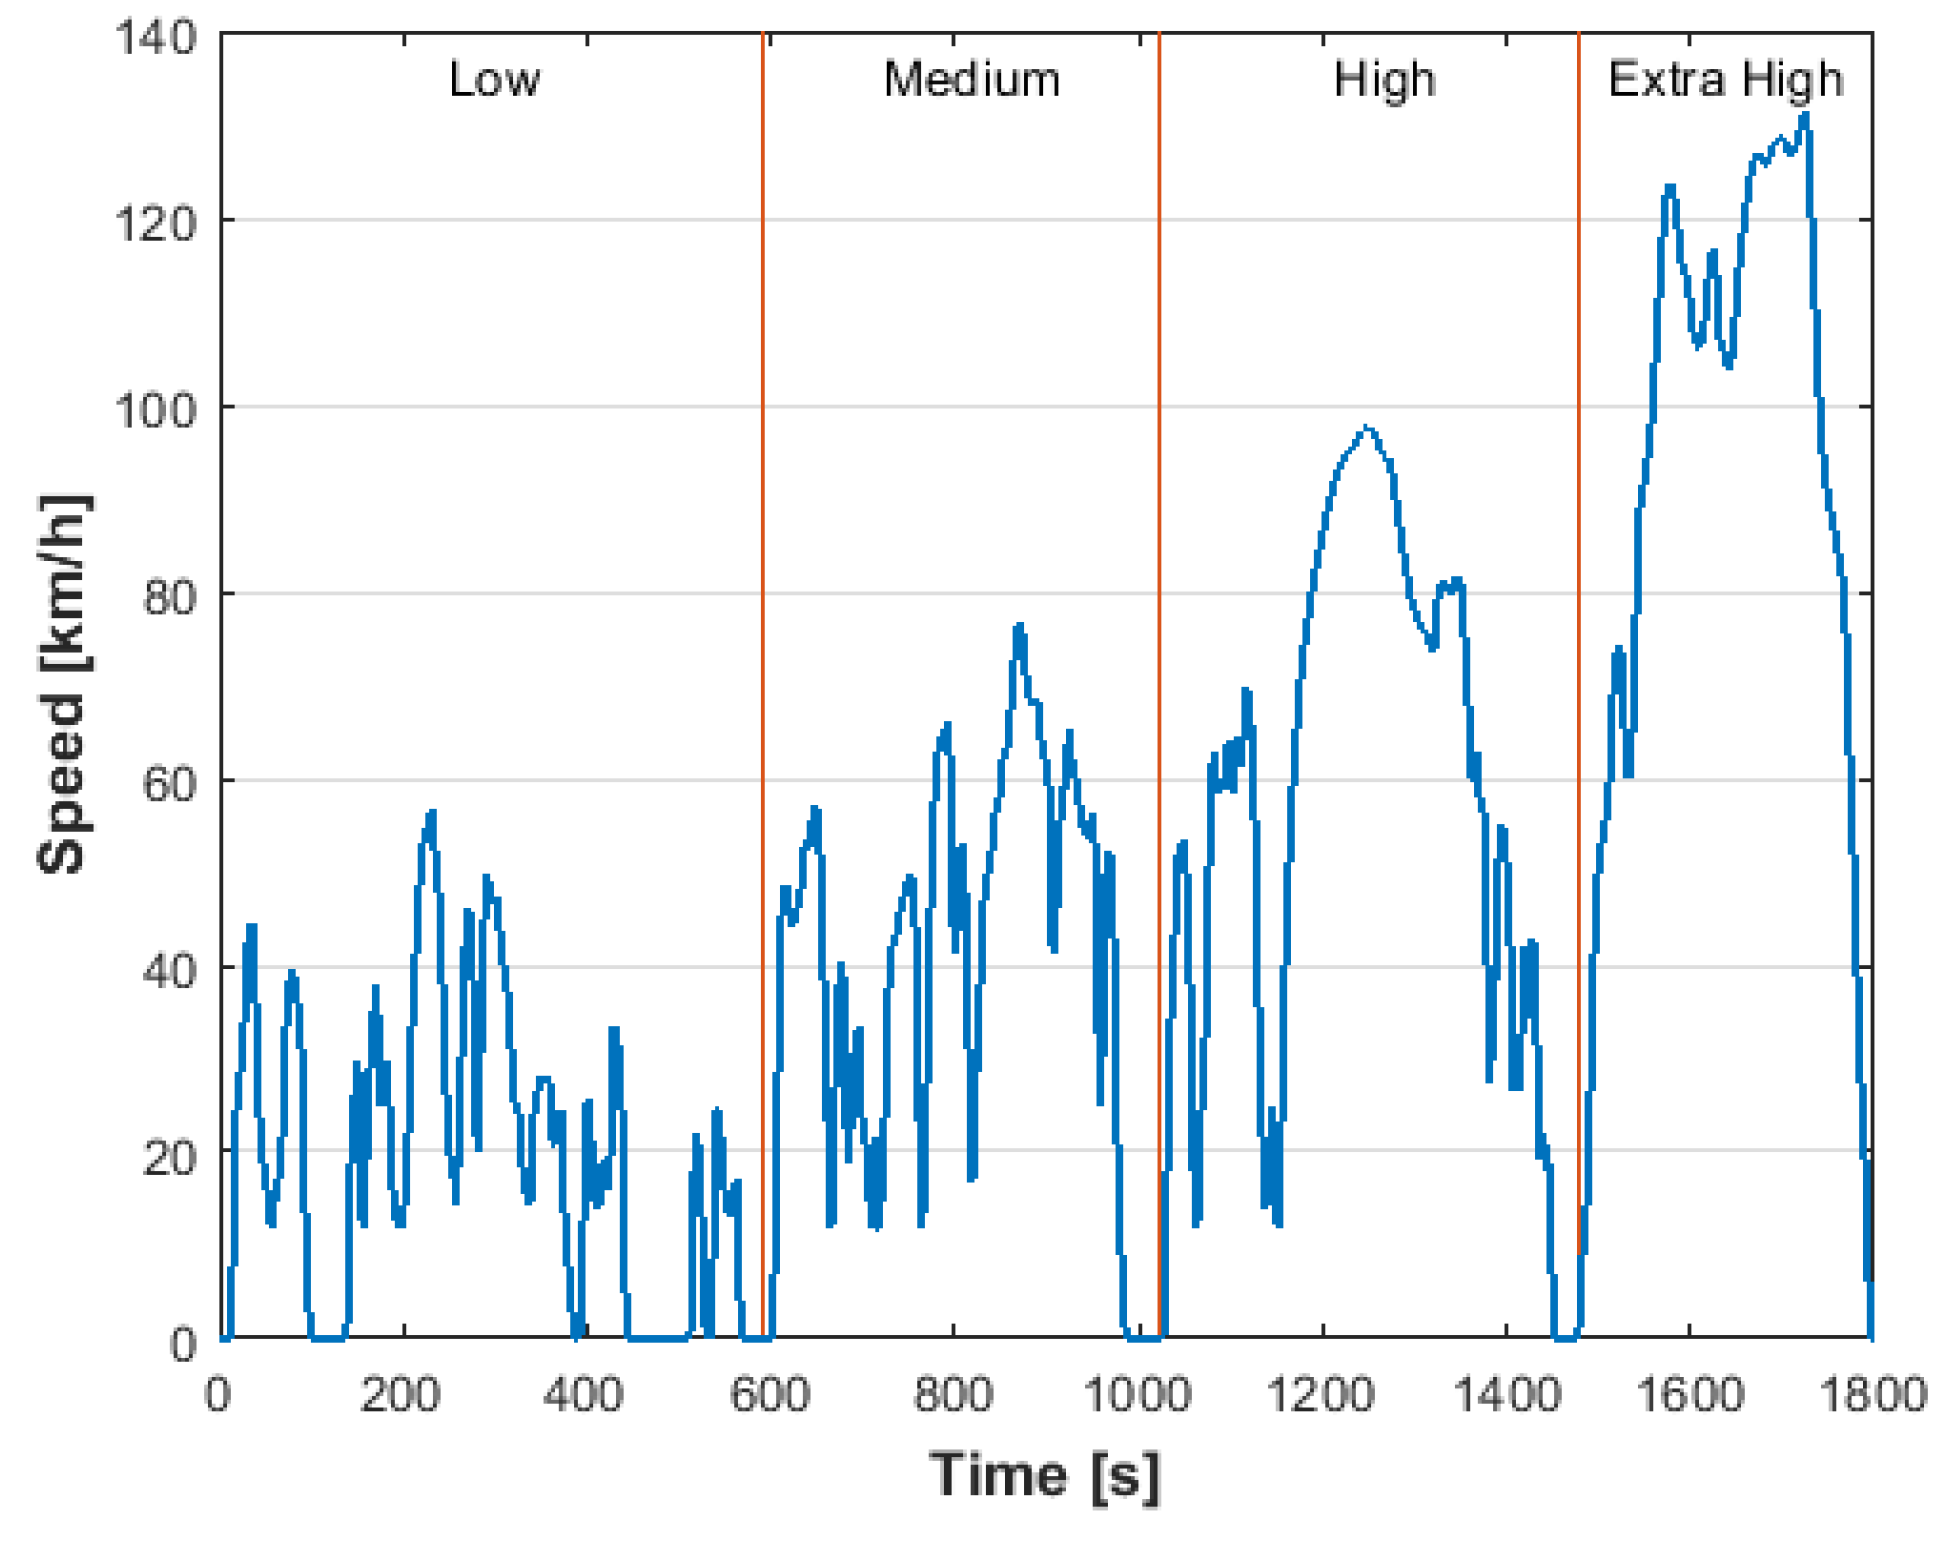
The drive cycle used to estimate the energy consumption for the vehicles is the Worldwide Harmonized Light Vehicles Test Cycle (WLTC) for class 3b vehicles. For mixed driving, the full WLTC is used, for city driving the medium WLTC, and the Extra-High for highway driving. Figure 7 shows the WLTC with its corresponding parts.
To achieve the distance in the two user cases, described in Section 4.4, the different drive cycles are repeated until the targeted distance is reached.
The C-rate required for the different drive cases is estimated by dividing the DOD required for the drive cycle with the operation time for the drive cycle according to
4.2. Synthetic Drive Cases
To easier separate the effect of driving in different SOC intervals, some synthetic drive cases were investigated. Table 4 shows the different synthetic cases studied.
The battery temperature was set to 30 C, since the temperature in the battery increases during usage and the battery cooling system often is designed to keep the temperature at or slightly below this temperature [14].
The benefit of using the synthetic drive cases is that they can provide very distinct and clear results. However, they are of course not fully representative towards real driving and in order to also provide some more realistic driving patterns, such cases were therefore also designed and investigated.
4.3. Drive Cycle Study
Table 5 displays the results from the vehicle model while running the different drive cycles with the different vehicles.
Based on these results, the three vehicles were tested to see how long lifetime they would achieve if only running full discharges, i.e., 90% DOD, for the three different drive cycles. Five full discharges/charges during one week (4.5 FCE/week) and a battery temperature of 30 C were assumed.
The vehicles will reach different distances where Vehicle 3 only has a short fully electric drive range. It should be mentioned that, in a real case, the hybrid mode would probably be used in the highway driving, unless a choice for pure electric mode exists. Still, for the sake of presenting the impact on battery ageing, we will assume only fully electric of a fully internal combustion engine (ICE) mode for this vehicle.
4.4. User Case Study
Going over to more realistic drive cases, two different cases for the three vehicles are investigated. Now, the drive distance is the same for all vehicles in order to show what lifetime the different vehicle batteries would achieve. In the case where the driving distance is too far for Vehicle 3, as mentioned before, fully electric drive is assumed until the battery is depleted, first after that is the ICE started.
User 1 has a driving distance of 25 km to work and works five days a week. During weekends, the user drives 75 km twice. All the trips are on highway and the WLTC Extra High is used to estimate the C-rate. The car is charged after each trip to 50% SOC (62% SOC for Vehicle 3) during weekdays and fully charged on weekends. The reference case is that the driver always charges fully whenever possible, and then leaves the vehicle with fully charged battery during parking.
User 2 has a driving distance of 25 km to work and works five days a week. During weekends, the user drives 75 km twice. The trips to work consist of mixed driving and the full WLTC is used to estimate the C-rate. For the longer trips in the weekend, the WLTC Extra High is used to estimate the C-rate. The car is charged after each trip to 50% SOC during weekdays and fully charged on weekends. The reference case is again that the driver always charges to full whenever possible.
The different cases with the parameters used as input to the ageing model for the three vehicles are shown in Table 6.
5. Results
The ageing model are in several cases extrapolated to C-rates lower than 1C. Although this means going outside the range where experiments could be used to calibrate the model, it is assumed that the trends regarding SOC- and temperature dependence are similar also for lower C-rates. By studying the calendar ageing data in Figure 3, it can be observed that, for 0 C-rate, the trend is very similar to the trend seen for the 1C results.
5.1. Synthetic Drive Cases
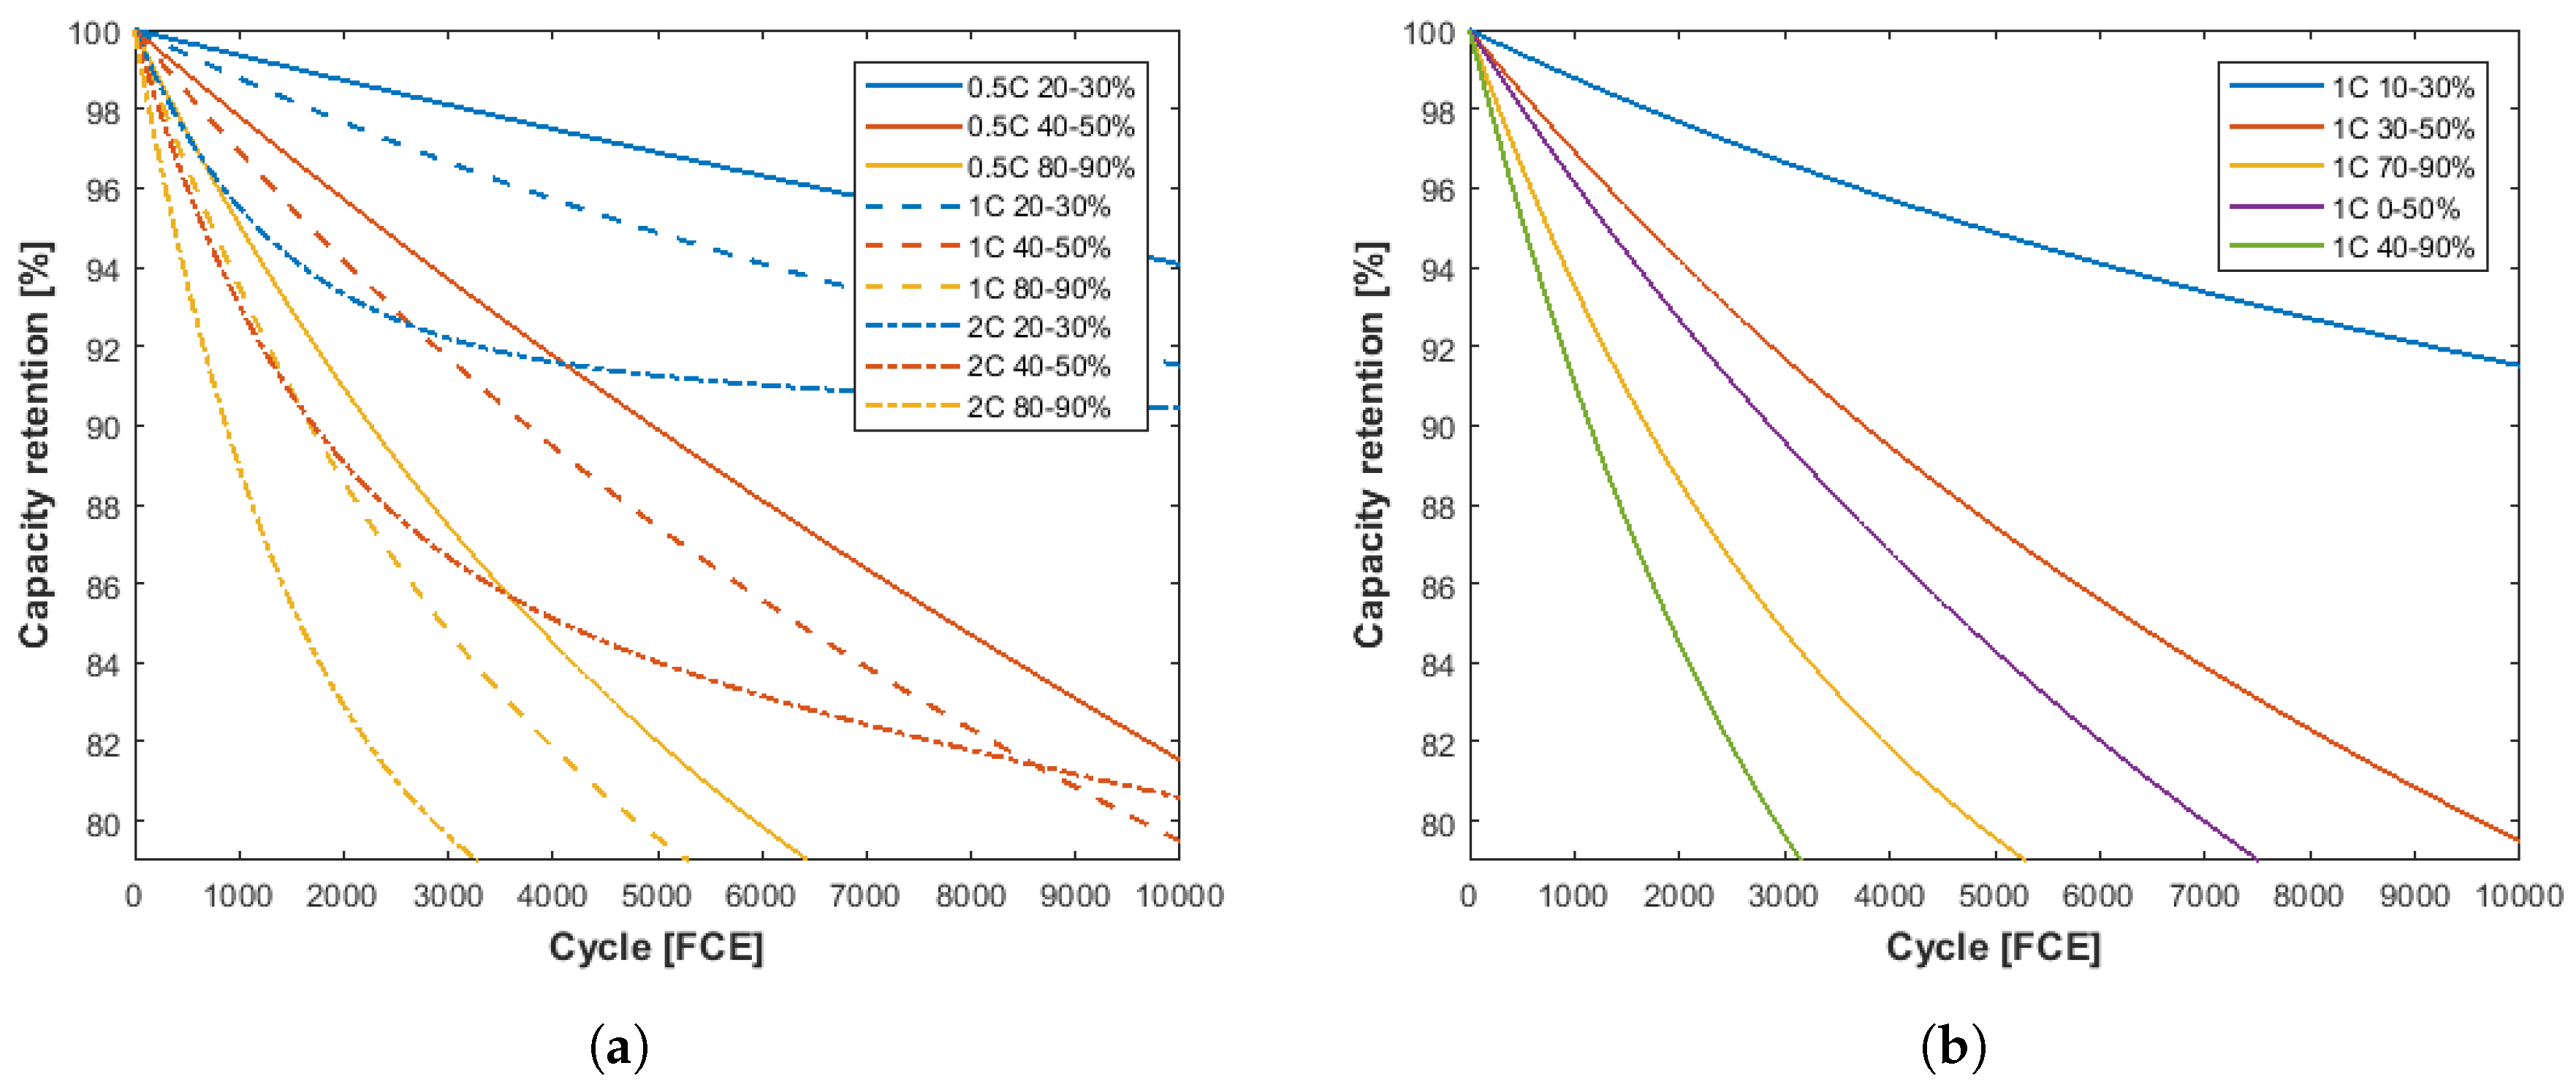
The result from the pure synthetic cases which were presented in Table 4 are given in Figure 8 as function of FCEs. The well known fact that increasing C-rate and increasing DOD are increasing the ageing can be seen. It also shows that the SOC level has a huge impact on the ageing, where higher C-rates in the lower SOC levels even generate less ageing than the lower C-rates in the higher SOC levels. As mentioned before, extrapolation was used for the lower C-rates seen in Figure 8a. The results produced are reasonable, although it would have been desirable to have experimental 0.5C cycling data.
5.2. Drive Cycle Study
The degradation of the battery as function of years for the three vehicles while running 90% DOD for the WLTC drive cycles are shown in Figure 9. Important to note is that these results only represent the impact of ageing due to driving and no consideration has been taken to the calendar ageing. The actual battery lifetime will therefore be shorter than the shown results. However, here the focus is on the comparison of the impact from different types of driving, calendar ageing will be investigated in Section 5.4.
The results show, as expected, that Vehicle 3 with the highest C-rate has the shortest lifetime in all three cycles. As the C-rate is reduced, this difference in lifetime is also reduced.
For the city driving, WLTC medium, see Figure 9a, all vehicles reach close to the same lifetime. Vehicles 1 and 2 show almost the same ageing trajectory. As expected, this is also the drive cycle that provides the longest lifetime.
5.3. User Case Study
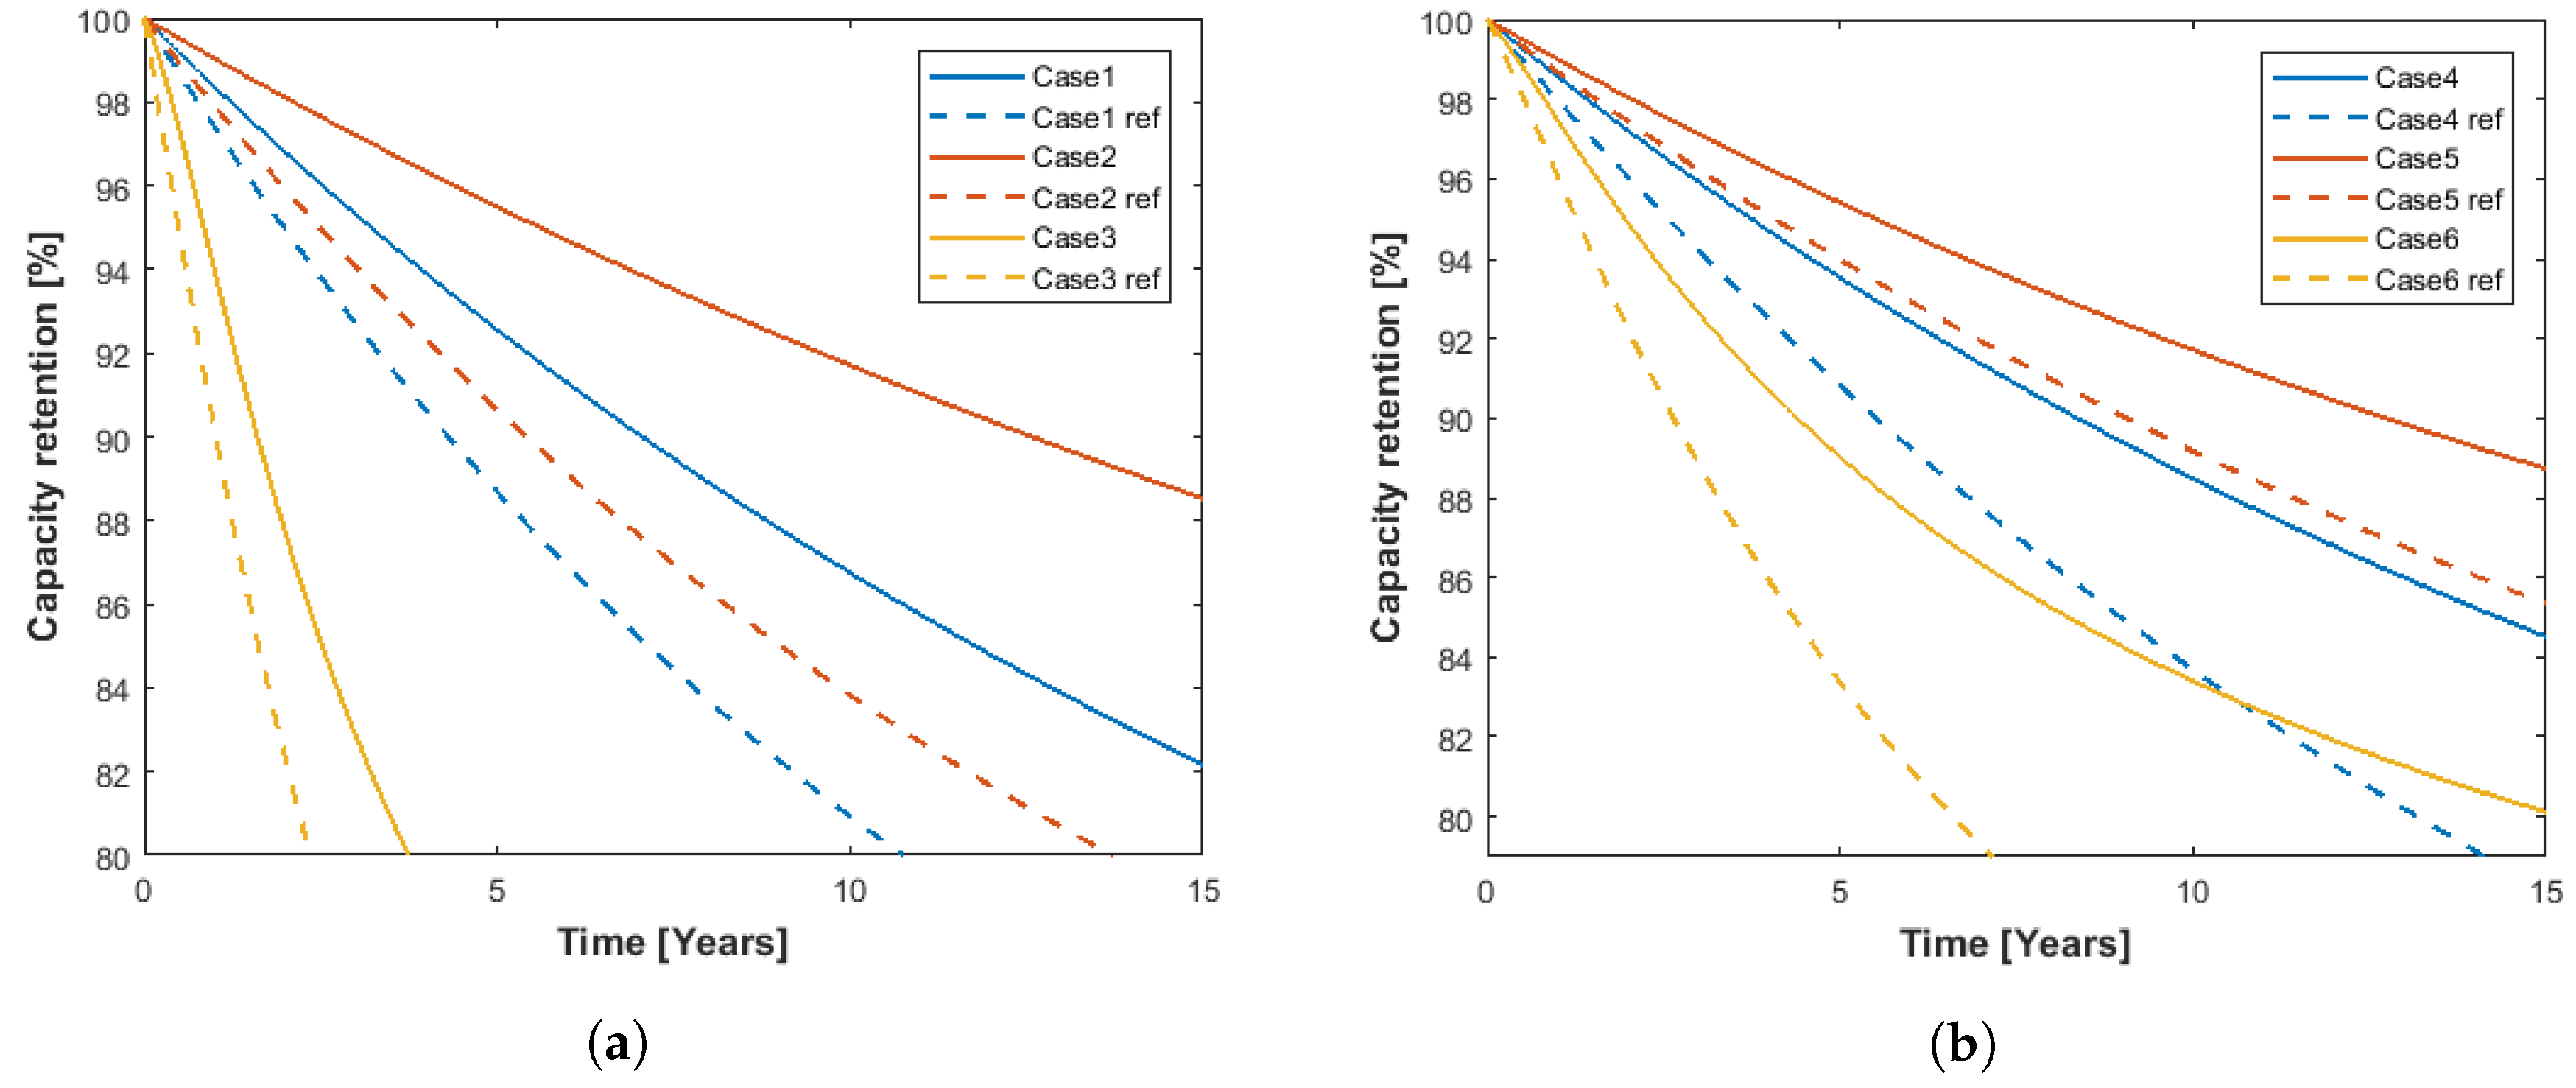
It is obvious that using a larger battery in relation to the vehicle size will increase the lifetime. The result of the lifetime from the two user cases, for the three different vehicles, is presented in Figure 10. As expected, the longest lifetime is achieved for Vehicle 2, which has the largest battery in relation to the vehicle size. Vehicle 3, which has the smallest battery, in relation to the vehicle size, ageing.
In Figure 10a, the spread in lifetime for the vehicles is very large. The difference is mainly related to the C-rate, though also to the DOD and the SOC placement of the DOD. Vehicle 3 has the highest C-rate, however by not fully charging the battery (only to 62% SOC) when driving the shorter trips, the lifetime can be improved with more that 1.4 years, 59%, compared to Case 3 ref. For Vehicles 1 and 2, this difference is even larger in number of years, showing that the placement of the DOD highly affects the lifetime, increasing the lifetime with 44% and 56%, respectively.
In the second user case, Figure 10b, the C-rates are lower as mixed driving is assumed for the trips during the weekdays. Here, the DOD is also smaller and all vehicles can start at 50% SOC. The improvement in lifetime by placing the DOD at a lower SOC level is even more prominent here, especially for Vehicle 3 with an improved lifetime of 130%. Vehicles 1 and 2 each have a 70% lifetime increase.
5.4. Cycling and Calendar Ageing
Until now, only cycling ageing has been considered. The next step is to add calendar ageing. The cycling and calendar ageing were added together by the number of FCE driven each day and the percentage of hours in storage per day, , according to
As can be seen in Figure 3, the temperature highly affects the ageing. The average temperature during a day is highly dependent on the location in the world and season; here, an average temperature of 25 C has been used.
From (5) and (6), the lifetime, until reaching 80% capacity retention, when only considering calender ageing, is 10 and 32 years, for 15 and 90%, respectively. According to this, storing the battery at 15% SOC instead of 90% SOC will triple the lifetime.
The calendar ageing combined with driving was studied in the WLTC and WLTC Extra High drive cycle case for Vehicles 1 and 3. It is assumed that a full charge of the vehicle battery takes 8 h and the vehicle is fully charged five times a week, i.e., 40 h/week. The driving time differs, depending on cycle and vehicle, between 2–12 h/week. This results in 69–75% calendar ageing time each day. For a simpler comparison the same calendar time, 72%, was used in the following.
In Table 7, the contribution from calendar ageing are presented as percent reduced lifetime compared to the pure cycle ageing. For Vehicle 1 driven according to WLTC, only a low C-rate is required and the cycling ageing is very moderate, resulting in an approximate lifetime of 16 years at 80% capacity retention. Including calendar ageing at 90% SOC, the lifetime is reduced to just above six years, a 61% lifetime reduction. Storing the battery in 15% SOC results in a lifetime of 11 years, a 35% lifetime reduction. For Vehicle 3, the lifetime reduction when including the calendar ageing for the WLTC drive case at 90% SOC is 55%, and only 29% at 15% SOC.
For the WLTC Extra High, the C-rates required are higher resulting in a shorter cycle lifetime. For Vehicle 3, the cycle lifetime is approximately 5 years and combining the calendar ageing reduces it to four and three years for 15% and 90% SOC, respectively. In this case, the contribution from the calendar ageing is much smaller, only reducing the lifetime with 13% and 32%. The corresponding values for Vehicle 1 is a reduction of 21 and 46%, respectively.
Now, considering one of the user cases, Case 1, where the vehicle is only used for 5 h/week and charged during 42.7 h/week, resulting in the vehicle battery being in storage 72% of the time.
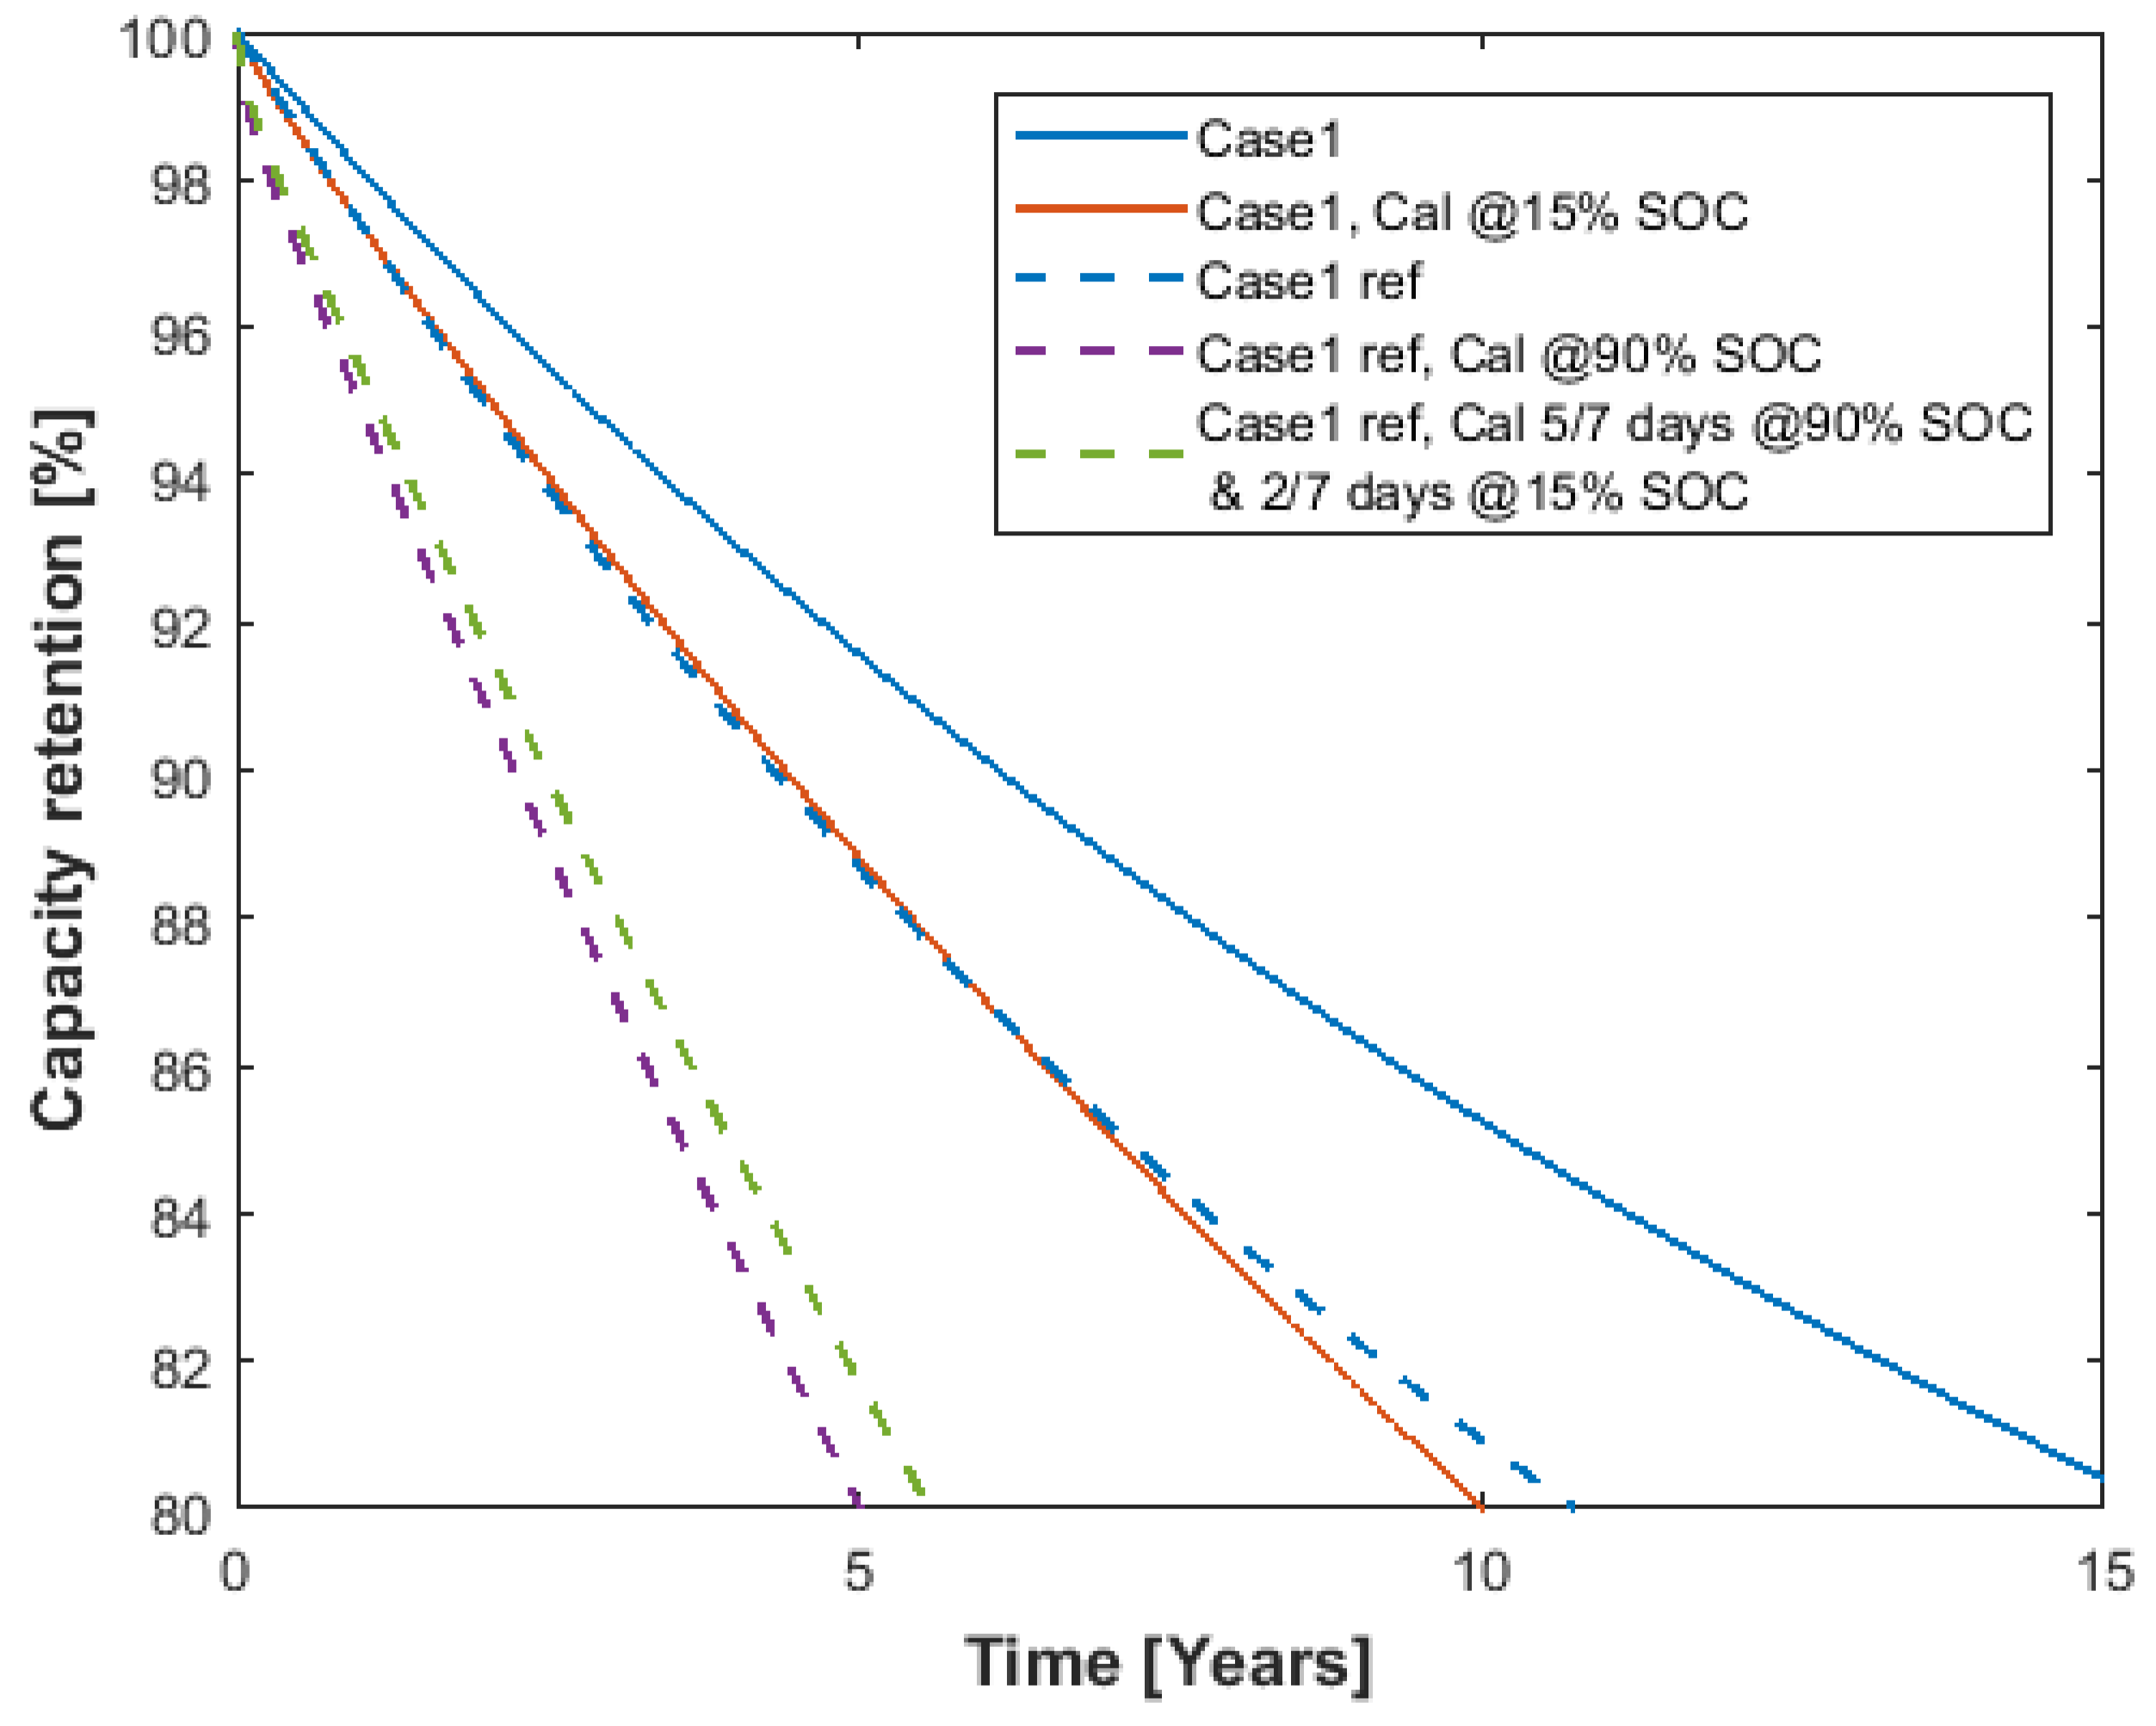
In Figure 11, the results from Case 1 and Case 1 ref is presented, and three calendar ageing examples are shown. In the first example, it is assumed that the battery is used in accordance with Case 1, stored at 15% SOC and that the charging is planned to be finished just before usage. In the second example, Case 1 reference, the battery is charged as soon as the driving is finished and then stored fully charged, i.e., 90% SOC. In the third example, a mixed charge behaviour is assumed. In the reference case, the cell is only discharged to 60% SOC during weekdays and the battery is therefore assumed to be charged to 90% after each drive, i.e., storing the battery at 90% SOC 5 days a week. During the two remaining days, the battery is assumed to be stored at low SOC, i.e., 15% SOC, and charged before the upcoming drive.
The effect of the calendar ageing is indeed important; in Case 1, keeping the battery at low SOC levels for as long as possible reduces the lifetime significantly, with 37%. In Case 1 ref, this impact is even larger. Storing the battery fully charged leads to a 52% reduction in lifetime. The small change by storing the battery at 15% SOC two days a week can prolong the lifetime with more than half a year, only reducing the lifetime due to calendar ageing with 47%.
All cases presented in Table 7 are not physically possible for Case 1 and Case 1 ref. However, by running the model according to the above stated examples for both cases, a clear trend can be seen; avoiding high SOC can prolong the lifetime by limiting the effects from the calender ageing.
6. Discussion
The lifetime tests on this cell showed, contradicting previous studies on LFP [1] and NMC cells [3], that the low SOC levels is less detrimental compared to higher SOC levels. Additionally, even higher C-rates show less ageing compared to the tests conducted in higher SOC levels. An important factor that needs to be pointed out is the definition of the SOC window. Schmalstieg et al. [3] defined the SOC window from 2.5–4.2 V, compared to the 2.8–4.15 V used for the here studied cells. If we consider the corresponding voltage level for the SOC intervals instead, the results produced by Schmalstieg [3] then prove to be similar to the ones presented in this study. From this, we can conclude that how we define the SOC window is important since the ageing is strongly linked to the SOC level, i.e. the voltage level of the cell.
Even though the impact of high SOC on ageing is a well known fact, few studies have focused on the impact of ageing when not using the full battery capacity. The costumers wishing for a longer driving range of EVs have controlled the research so far. As shown in the Swedish car movement data project [9], the most common trips are 30–50 km, and today the driving range of the EVs are longer than this, opening up the field for updated battery management strategies and, with this, the possibility of prolonging the battery lifetime.
The synthetic cases studied in Figure 8 show how the C-rate, DOD, and SOC level impact the ageing. The fastest ageing is achieved for S8, 1C 40–90%, while the same DOD, though in 0–50%, S7, manages more than double the number of FCE until reaching 80% capacity retention. Other cases showing faster ageing are S6, only using 20% DOD in 70–90% SOC, and all three C-rates for S3, 10% DOD in 80–90% SOC. These results indicates that the SOC level is more important than the C-rate.
The S1, S2 and S3 cases show even more clearly that the impact of SOC level is higher than the impact of C-rate. Important to point out is that, as the SOC level is increased, the impact of C-rate also seems to increase, S3 using 2C shows similar ageing as S8 though only using 10% DOD.
In S1-3, the model was extrapolated outside the available measured data, in order to estimate the ageing in 0.5C. Even if the trend seems fairly straightforward, the results for C-rates lower than 1C have to be treated with prudence.
For vehicle applications, the type of driving is very important for the ageing. Higher speeds require substantially higher C-rates, and the losses for the air drag grows with the square of the vehicle speed. If the battery is small, as for Vehicle 3, the required C-rate will be high, resulting in faster ageing.
For the three vehicles studied in this work, driving the distance of 25km on highway used 30, 26 and 62% DOD, respectively. When using mixed driving, only 21, 19, and 46% DOD were required to complete the trip. The highway driving required higher C-rate compared to the mixed driving, resulting in faster ageing. For all three vehicles, the choice to charge only up to 50% SOC highly improved the lifetime, for Vehicle 3 with 1.4 years. In the mixed driving case, the extension of the lifetime was even higher.
Including calendar ageing to the model showed that the lifetime could be reduced with more than 60% compared to the case only considering cycling ageing. This contribution could be reduced to 35% lifetime reduction by planning the charging, thus maintaining a low SOC level during parking.
Intuitively, the importance of calendar ageing is larger when the cycling ageing is moderate and the expected lifetime long. When the cycling ageing is rapid, the calendar ageing is less influential. For the most aggressive drive case, Vehicle 3 in WLTC Extra High, the lifetime reduction was as low as 13%, assuming storage of the battery at 15% SOC.
The consideration of DOD and the SOC placement needs to be studied further now that the BEV and PHEV becomes more common. Understanding the effects of this holds great potential for prolonging the lifetime of the battery in a vehicle application, as this study has shown.
In this study, it has been shown that much can be gained by taking a deeper look at the user pattern. If this is better understood, it can be used to reduce the costs of the vehicle through optimisation of the battery, and it can also give guidance to the user of how to better utilise the battery technology.
7. Conclusions
The final conclusion from this study is that there is a huge potential for prolonging the battery lifetime by avoiding high SOC values. Additional prolonging of the lifetime can also be reached by only charging the battery with the needed energy, using a small DOD, and to do this just before the driving. This strategic planning of the charging will limit the impact from the calendar ageing.
Author Contributions
Conceptualization, E.W. and T.T.; Methodology, E.W.; Software, E.W.; Validation, E.W.; Formal Analysis, E.W.; Investigation, E.W.; Resources, T.T.; Data Curation, E.W.; Writing—Original Draft Preparation, E.W.; Writing—Review and Editing, E.W. and T.T.; Visualization, E.W.; Supervision, T.T.; Project Administration, T.T.; Funding Acquisition, T.T.
Funding
This research was funded by the Swedish Energy Agency through the Battery Foundation, ABB Corporate Research, Västerås, Sweden, and Volvo Car Group, Göteborg, Sweden.
Acknowledgments
The authors would like to thank the Swedish Energy Agency, Volvo Car Group, Göteborg, Sweden, and ABB Corporate Research, Västerås, Sweden for the financing of this work.
Conflicts of Interest
The authors declare no conflict of interest.
Abbreviations
The following abbreviations are used in this manuscript:
| BEV | Battery Electric Vehicle |
| CC | Constant Current |
| C-rate | Current required to discharge the battery in 1 h |
| DOD | Depth of Discharge |
| EV | Electric Vehicle |
| FCE | Full Cycle Equivalent |
| ICE | Internal Combustion Engine |
| LFP | Lithium Iron Phosphate |
| LMO | Lithium Manganese Oxide |
| NMC | Lithium Nickel Manganese Cobalt Oxide |
| PHEV | Plugin Hybrid Electric Vehicle |
| RPT | Reference Performance Test |
| SEI | Solid Electrolyte Interface |
| SOC | State of Charge |
| WLTC | Worldwide Harmonized Light Vehicles Test Cycle |
References
- Groot, J. State-of-Health Estimation of Li-Ion Batteries: Cycle Life Test Methods. Licentiate Thesis, Chalmers University of Technology, Gothenburg, Sweden, 2012. [Google Scholar]
- Groot, J. State-of-Health Estimation of Li-Ion Batteries: Ageing Models. Ph.D. Thesis, Chalmers University of Technology, Gothenburg, Sweden, 2014. [Google Scholar]
- Schmalstieg, J.; Käbitz, S.; Ecker, M.; Sauer, D.U. From accelerated aging tests to a lifetime prediction model: Analyzing lithium-ion batteries. In Proceedings of the World Electric Vehicle Symposium and Exhibition (EVS27), Barcelona, Spain, 17–20 November 2013; pp. 1–12. [Google Scholar] [CrossRef]
- Ramadass, P.; Haran, B.; White, R.; Popov, B.N. Capacity fade of Sony 18650 cells cycled at elevated temperatures Part I. Cycling performance. J. Power Sources 2002, 112, 606–613. [Google Scholar] [CrossRef]
- Wright, R.B.; Motloch, C.G.; Belt, J.R.; Christophersen, J.P.; Ho, C.D.; Richardson, R.A.; Bloom, I.; Jones, S.A.; Battaglia, V.S.; Henriksen, G.L.; et al. Calendar-and cycle-life studies of advanced technology development program generation 1 lithium-ion batteries. J. Power Sources 2002, 110, 445–470. [Google Scholar] [CrossRef]
- Wikner, E. Lithium Ion Battery Aging: Battery Lifetime Testing and Physics-Based Modeling for Electric Vehicle Applications. Licentiate Thesis, Chalmers University of Technology, Gothenburg, Sweden, 2017. [Google Scholar]
- Wang, J.; Liu, P.; Hicks-Garner, J.; Sherman, E.; Soukiazian, S.; Verbrugge, M.; Tataria, H.; Musser, J.; Finamore, P. Cycle-life model for graphite-LiFePO4 cells. J. Power Sources 2011, 196, 3942–3948. [Google Scholar] [CrossRef]
- Ning, G.; Haran, B.; Popov, B.N. Capacity fade study of lithium-ion batteries cycled at high discharge rates. J. Power Sources 2003, 117, 160–169. [Google Scholar] [CrossRef]
- Karlsson, S. The Swedish Car Movement Data Project; Final Report; Chalmers University of Technology: Gothenburg, Sweden, 2013. [Google Scholar]
- Grunditz, E. Design and Assessment of Battery Electric Vehicle Powertrain, with Respect to Performance, Energy Consumption and Electric Motor Thermal Capability. Ph.D. Thesis, Chalmers University of Technology, Gothenburg, Sweden, 2016. [Google Scholar]
- Tesla. Model 3. Available online: https://www.tesla.com/sv_SE/model3 (accessed on 4 September 2018).
- Björklund, E.; Wikner, E.; Younesi, R.; Brandell, D.; Edström, K. Influence of state-of-charge in commercial LiNi0.33Mn0.33Co0.33O2/LiMn2O4-graphite cells analyzed by synchrotron-based photoelectron spectroscopy. J. Energy Storage 2017, 15, 172–180. [Google Scholar] [CrossRef]
- DiselNet, Emission Test Cycles. Worldwide Harmonized Light Vehicles Test Cycle (WLTC). Available online: https://dieselnet.com/standards/cycles/wltp.php (accessed on 3 September 2018).
- Damköhler, F. (Ed.) Thermal management in vehicles with electric drive system. Porsche Eng. Mag. 2011, 1, 34–36. [Google Scholar]
Figure 1.
Test cell with holder.

Figure 2.
The ageing data used to parameterise the empirical ageing model in (a) 25 C and (b) 35 C. In (b), the data is also used to verify the model included. The vertical changes in capacity indicates stops in the testing due to maintenance, i.e., a rest period.
Figure 2.
The ageing data used to parameterise the empirical ageing model in (a) 25 C and (b) 35 C. In (b), the data is also used to verify the model included. The vertical changes in capacity indicates stops in the testing due to maintenance, i.e., a rest period.

Figure 3.
Calendar ageing in 25 C and 35 C at 15% and 90% State of Charge (SOC).
Figure 4.
SOC and C-rate dependence for the b parameter in the ageing function.

Figure 5.
Parameterised ageing function together with input data, (a) 2C data in 25 C; (b) different C-rates in 35 C; and (c) calendar ageing in 25 C at 15% and 90% SOC and the corresponding degradation equations.
Figure 5.
Parameterised ageing function together with input data, (a) 2C data in 25 C; (b) different C-rates in 35 C; and (c) calendar ageing in 25 C at 15% and 90% SOC and the corresponding degradation equations.
Figure 6.
Capacity degradation in 0–30% SOC with 2C charge and discharge for the ageing function together with experimental data in 35 C.
Figure 6.
Capacity degradation in 0–30% SOC with 2C charge and discharge for the ageing function together with experimental data in 35 C.

Figure 7.
The Worldwide Harmonized Light Vehicles Test Cycle (WLTC) drive cycle for Class 3b vehicles used to estimate the energy consumption [13].
Figure 7.
The Worldwide Harmonized Light Vehicles Test Cycle (WLTC) drive cycle for Class 3b vehicles used to estimate the energy consumption [13].

Figure 8.
Model result at 30 C starting at different SOC levels in (a) 10% Depth of Discharge (DOD) with 0.5C, 1C and 2C; and (b) 20% and 50% DOD with 1C.
Figure 8.
Model result at 30 C starting at different SOC levels in (a) 10% Depth of Discharge (DOD) with 0.5C, 1C and 2C; and (b) 20% and 50% DOD with 1C.

Figure 9.
Ageing for the three vehicles while assuming driving according to, (a) WLTC medium; (b) WLTC; and (c) WLTC Extra High for five full charge/discharges per week all year around with a battery temperate of 30 C.
Figure 9.
Ageing for the three vehicles while assuming driving according to, (a) WLTC medium; (b) WLTC; and (c) WLTC Extra High for five full charge/discharges per week all year around with a battery temperate of 30 C.
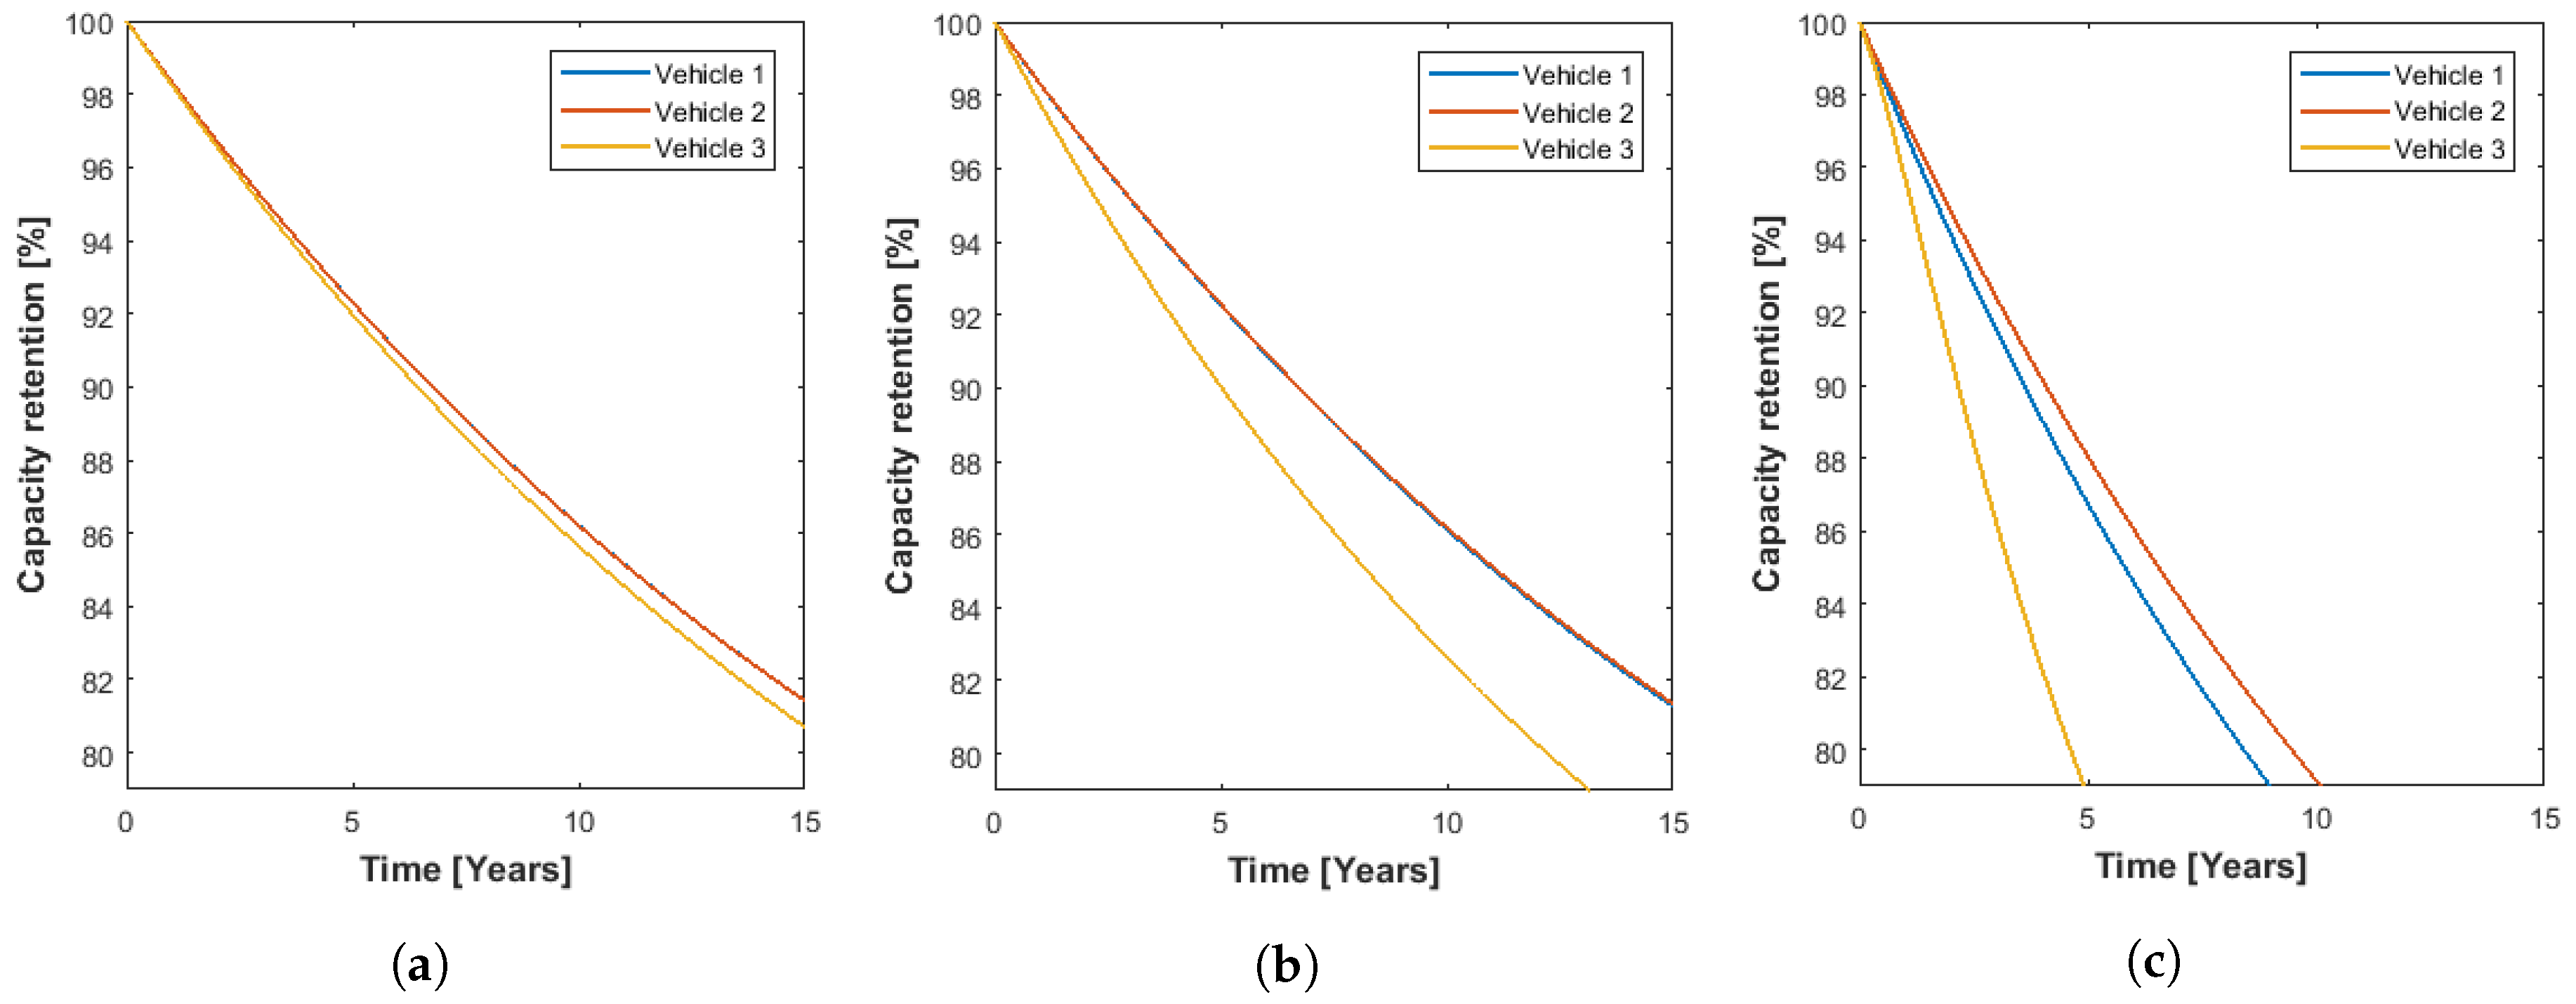
Figure 10.
Model result for the three different vehicles at 30 C while used according to (a) User 1; and (b) User 2.
Figure 10.
Model result for the three different vehicles at 30 C while used according to (a) User 1; and (b) User 2.
Figure 11.
Resulting capacity degradation when including calendar ageing in 25 C for user case 1 at 15%, case 1 reference at 90% SOC and a combination of 15% and 90%.
Figure 11.
Resulting capacity degradation when including calendar ageing in 25 C for user case 1 at 15%, case 1 reference at 90% SOC and a combination of 15% and 90%.


Table 1.
Cycling test matrix for developing and verifying the empirical model for various State of Charge (SOC) intervals, temperatures, and C-rates.
Table 1.
Cycling test matrix for developing and verifying the empirical model for various State of Charge (SOC) intervals, temperatures, and C-rates.
| SOC Interval (%) | 25 C | 35 C | ||||
|---|---|---|---|---|---|---|
| 1C | 2C | 4C | 1C | 2C | 4C | |
| 0–10 | - | x | - | - | x | - |
| 10–20 | x | x | - | x | x | x |
| 20–30 | - | x | - | - | - | - |
| 40–50 | - | x | - | - | x | - |
| 60–70 | x | x | x | x | x | x |
| 70–80 | - | x | - | - | - | - |
| 80–90 | - | x | - | - | - | - |
| 0–30 | - | - | - | - | x | - |
Table 2.
Look-up table for SOC and temperature dependency for parameter d.
| SOC Interval (%) | 0–10 | 10–20 | 20–30 | 30–40 | 40–50 | 50–60 | 60–70 | 70–80 | 80–90 |
|---|---|---|---|---|---|---|---|---|---|
| [−6.620 | −3.210 | −2.410 | −3.700 | −5.000 | −2.550 | −0.100 | −0.010 | −0.001] | |
| [−3.042 | −1.000 | −0.400 | −4.730 | −9.000 | −7.67 | −6.331 | −7.000 | −0.7] |
Table 3.
Vehicle data for the three different vehicles used in the different case studies [10].
Table 3.
Vehicle data for the three different vehicles used in the different case studies [10].
| Parameter | (kg/m) | (m) | (-) | (-) | (kg) | g (m/s) | r (-) | (deg) | (kWh) |
|---|---|---|---|---|---|---|---|---|---|
| Vehicle 1 | 1.225 | 2.13 | 0.35 | 0.015 | 1100 | 9.81 | 0.29 | 0 | 17 |
| Vehicle 2 | 1.225 | 2.32 | 0.35 | 0.015 | 1700 | 9.81 | 0.33 | 0 | 24 |
| Vehicle 3 | 1.225 | 2.32 | 0.35 | 0.015 | 1700 | 9.81 | 0.33 | 0 | 10 |
Table 4.
Synthetic drive cases at 30 C in various SOC, Depth of Discharge (DOD) and C-rates.
| Parameters Case | DOD (%) | C-Rate | T (C) | SOC (%) |
|---|---|---|---|---|
| S1 | 10 | 0.5, 1, 2 | 30 | 30 |
| S2 | 10 | 0.5, 1, 2 | 30 | 50 |
| S3 | 10 | 0.5, 1, 2 | 30 | 90 |
| S4 | 20 | 1 | 30 | 30 |
| S5 | 20 | 1 | 30 | 50 |
| S6 | 20 | 1 | 30 | 90 |
| S7 | 50 | 1 | 30 | 50 |
| S8 | 50 | 1 | 30 | 90 |
Table 5.
Results from the vehicle model for the three vehicles running the Worldwide Harmonized Light Vehicles Test Cycle (WLTC) drive cycles.
Table 5.
Results from the vehicle model for the three vehicles running the Worldwide Harmonized Light Vehicles Test Cycle (WLTC) drive cycles.
| Drive Cycle | WLTC | WLTC Medium | WLTC Extra High | |
|---|---|---|---|---|
| Distance (km) [13] | 23.3 | 4.8 | 7.2 | |
| Time (s) [13] | 1800 | 433 | 323 | |
| Vehicle 1 | C-rate | 0.39 | 0.23 | 1.09 |
| DOD (%) | 19 | 3 | 10 | |
| Vehicle 2 | C-rate | 0.35 | 0.22 | 0.95 |
| DOD (%) | 18 | 3 | 9 | |
| Vehicle 3 | C-rate | 0.85 | 0.53 | 2.27 |
| DOD (%) | 42 | 6 | 20 | |
Table 6.
Drive cases translated into DOD, inital State of Charge (SOC), C-rate, and Full Cycle Equivialent (FCE) per week to be used as ageing model input values.
Table 6.
Drive cases translated into DOD, inital State of Charge (SOC), C-rate, and Full Cycle Equivialent (FCE) per week to be used as ageing model input values.
| Parameters | DOD1 (%) | Trips | C-Rate | T (C) | DOD2 (%) | Trips | C-Rate | T (C) | FCE |
|---|---|---|---|---|---|---|---|---|---|
| Case: User, Vehicle | (SOC (%)) | Week | (SOC (%)) | Week | Week | ||||
| 1: User 1, Vehicle 1 | 30 (50) | 10 | 1.09 | 30 | 89 (89) | 2 | 1.09 | 30 | 4.8 |
| ref: User 1, Vehicle 1 | 30 (90) | 10 | 1.09 | 30 | 89 (90) | 2 | 1.09 | 30 | 4.8 |
| 2: User 1, Vehicle 2 | 26 (50) | 10 | 0.95 | 30 | 77 (77) | 2 | 0.95 | 30 | 4.1 |
| ref: User 1, Vehicle 2 | 26 (90) | 10 | 0.95 | 30 | 77 (90) | 2 | 0.95 | 30 | 4.1 |
| 3: User 1, Vehicle 3 | 62 (62) | 10 | 2.27 | 30 | 90 + ICE (90) | 2 | 2.27 | 30 | 8 |
| ref: User 1, Vehicle 3 | 62 (90) | 10 | 2.27 | 30 | 90 + ICE (90) | 2 | 2.27 | 30 | 8 |
| 4: User 2, Vehicle 1 | 21 (50) | 10 | 0.39 | 30 | 89 (89) | 2 | 1.09 | 30 | 3.9 |
| ref: User 2, Vehicle 1 | 21 (90) | 10 | 0.39 | 30 | 89 (90) | 2 | 1.09 | 30 | 3.9 |
| 5: User 2, Vehicle 2 | 19 (50) | 10 | 0.35 | 30 | 77 (77) | 2 | 0.95 | 30 | 3.4 |
| ref: User 2, Vehicle 2 | 19 (90) | 10 | 0.35 | 30 | 77 (90) | 2 | 0.95 | 30 | 3.4 |
| 6: User 2, Vehicle 3 | 46 (50) | 10 | 0.85 | 30 | 90 + ICE (90) | 2 | 2.27 | 30 | 6.4 |
| ref: User 2, Vehicle 3 | 46 (90) | 10 | 0.85 | 30 | 90 + ICE (90) | 2 | 2.27 | 30 | 6.4 |
Table 7.
Ageing reduction when adding calendar ageing at two different SOC levels to the cycling ageing for six different cases. The values in brackets are only included for comparison since the cases are physically not possible.
Table 7.
Ageing reduction when adding calendar ageing at two different SOC levels to the cycling ageing for six different cases. The values in brackets are only included for comparison since the cases are physically not possible.
| Case | Calendar Time (%) | Cycling and Charging Time (%) | @15% SOC (%) | @90% SOC (%) | 5/7 Days @90% and 2/7 Days @15% SOC (%) |
|---|---|---|---|---|---|
| WLTC, Vehicle 1 | 72 | 28 | 35 | 61 | 56 |
| WLTC, Vehicle 3 | 72 | 28 | 29 | 55 | 49 |
| WLTC Extra High, Vehicle 1 | 72 | 28 | 21 | 46 | 40 |
| WLTC Extra High, Vehicle 3 | 72 | 28 | 13 | 32 | 27 |
| Case 1 | 72 | 28 | 37 | (63) | (58) |
| Case 1 ref | 72 | 28 | (27) | 52 | 47 |
© 2018 by the authors. Licensee MDPI, Basel, Switzerland. This article is an open access article distributed under the terms and conditions of the Creative Commons Attribution (CC BY) license (http://creativecommons.org/licenses/by/4.0/).
Share and Cite
MDPI and ACS Style
Wikner, E.; Thiringer, T. Extending Battery Lifetime by Avoiding High SOC. Appl. Sci. 2018, 8, 1825. https://doi.org/10.3390/app8101825
AMA Style
Wikner E, Thiringer T. Extending Battery Lifetime by Avoiding High SOC. Applied Sciences. 2018; 8(10):1825. https://doi.org/10.3390/app8101825
Chicago/Turabian StyleWikner, Evelina, and Torbjörn Thiringer. 2018. "Extending Battery Lifetime by Avoiding High SOC" Applied Sciences 8, no. 10: 1825. https://doi.org/10.3390/app8101825
Note that from the first issue of 2016, this journal uses article numbers instead of page numbers. See further details here.