1. Introduction
The necessity of hybrid vehicles and electric vehicles is widely known for reasons such as fossil fuel depletion, climate change, emission norms mandated by regulations, and so on. With the addition of the electric motor, battery, and associated power electronics, the cost of powertrain and hence vehicles rise, often a hindrance for original equipment manufacturers (OEMs) and end-customers [
1].
The hybrid electric vehicle (HEV) is an alternative to reduce the high dependence on petroleum products, because HEVs retain characteristics attributed to conventional vehicles such as performance, safety and trustworthiness, and reduced fuel consumption. Some modifications are necessary in the vehicle longitudinal dynamics equation to provide a specific power management control system because of the electrical power source addition that complements conventional engine and powertrain systems [
2].
In 2017, the U.S. Environmental Protection Agency (EPA) approved fuel efficiency standards revealing high fuel efficiency levels. Expansion of the hybrid electric vehicle market is a realistic way to respond to fuel efficiency regulations. Recently, various technologies have been developed to improve efficiency of hybrid systems and reduce prices including configuration of a parallel mild hybrid system [
3].
The automotive vehicle market has seen an increase in the number of hybrid electric vehicles, and forecasts predict additional growth [
4].
Hybrid electric vehicles are continuously challenged to meet cross-attribute performance while minimizing energy usage and component cost in a highly competitive automotive market. As electrified vehicles become mainstream in the marketplace, hybrid customers are expecting more attribute refinements combined with the enhanced fuel economy benefits [
5].
Energy management of HEVs is a difficult task due to the complexity of the total system in terms of electrical, mechanical, and thermal behavior [
6]. HEVs are complex hardware systems often controlled by software that is complex to maintain, time-consuming to calibrate, and not always guaranteed to deliver optimal fuel economy. Hence, coordinated, systematic control of different subsystems of HEV is an attractive proposition [
7].
Current optimization strategy for a parallel hybrid requires much computational time and relies heavily on the drive cycle to accurately represent the driving conditions in the future [
8].
The ‘State of Charge’ of a battery is an estimation of remaining energy (percent). It is like a fuel gauge. Namely, SOC is the equivalent of a fuel gauge for the battery pack in a battery-driven electric vehicle. Measuring and knowing the SOC of a battery or battery bank is beneficial when applied towards alternative energy, or in any situation wherein we need to know its condition. It is critical to estimate and know the SOC of the secondary battery cells, defined as the available capacity (in Ah) and expressed as a percentage of its rated capacity.
With increasing application of lithium ion battery technology in the automotive industry, development processes and validation methods for the battery management system have attracted more attention. One fundamental function of the BMS is to continuously estimate the battery’s SOC and state of health (SOH) to guarantee a safe and efficient operation of the battery system. For SOC as well as SOH estimations of a BMS, there are certain nonideal situations in a real vehicle environment, such as measurement inaccuracies, variation of cell characteristics over time, and so forth, that will influence the outcome of battery state estimation in a negative way. Quantifying such influence factors demands extensive measurements [
9].
Dheenadhayalan, et al. presented a new approach to accurately estimate the state of charge of a lithium-ion battery based on an extended Kalman filter. This method uses equivalent circuits of a lithium-ion battery to develop state and observer equations of the extended Kalman filter [
10].
Zhang, et al. proposed a big data-based algorithm to build a battery pack dynamic model and a probabilistic model for energy consumption prediction [
11].
Arasaratnam, et al. revealed that to estimate the SOC of Li-ion batteries, we derive a normalized state-space model based on Li-ion electrochemistry and apply a Bayesian algorithm. Simulation results reveal that the PST can estimate SOC with accuracy higher than 95% without experiencing divergence. Bayesian algorithm is obtained by modifying Potter’s square root filter and naming the Potter SOC tracker (PST) in this paper [
12].
As a research on energy storage device for electric vehicles, Rukan Genc et al. expressed that super capacitor (SC) is suffering plenty of limitation factors: high leakage current, thermal aging, high equivalent series resistance (ESR), low voltage window, and so forth. To overcome such drawbacks, one should consider the variety of materials in a smart way. There are materials providing higher capacity values such as graphite. However, their performance in SC is limited and saturated. We believe new intelligent materials with alternative sources may have high impact in engineering to produce next-generation SC while there is plenty of space on the materials selection compared to Li-ion batteries. So, such hybrid SC can be used as a standard high-power source in electrical vehicles in the near future [
13].
Waiard Saikong et al. studied comparison of energy consumption of electric vehicles in three different energy storage systems consisting of lead-acid battery, lithium-ion battery, and hybrid energy storage system (HESS) incorporating lithium-ion battery and ultra-capacitor. As a result, lowest specific energy and power cause battery oversizing of the lead-acid type to use with an intermittent load. For city traffic under frequent stop-and-drive conditions, HESS is an appropriate solution. However, lithium-ion battery and HESS do not have a significant difference on the extra urban driving cycle route [
14].
In this study, the research target is to evaluate charging characteristics and propose a new algorithm for improving determination accuracy of SOC during the regenerative braking period of TMED type parallel hybrid electric vehicles.
2. Experimental Setup
In this study, vehicle dynamometer (EC Type, Jastec Co., Seongnam, Korea) and the hybrid electric vehicle (2011 YF Sonata HEV, Hyundai Motor Co., Seoul, Korea) were used for vehicle experiment, and data were acquired by the chassis dynamometer, current measurement device (PicoScope, Pico Technology, Cambridgeshire, UK), and OBD-II monitoring system (Cantalker, D&K Information Communication Technology, Anyang, Korea).
On-board diagnostics (OBD) is an automotive term referring to a vehicle’s self-diagnostic and reporting capability. OBD systems provide the vehicle owner or service technician access to the status of various vehicle subsystems. The amount of diagnostic information available via OBD has varied widely since its introduction in the early 1980s versions of on-board vehicle computers.
Modern OBD implementations use a standardized digital communications port to provide real-time data in addition to a standardized series of diagnostic trouble codes, or DTCs, that allow one to rapidly identify and remedy malfunctions within the vehicle.
2.1. Chassis Dynamometer and Experimental Vehicle
The test vehicle was operated on an EC system dynamometer as shown in
Figure 1. This method is a device for measuring driving force generated from the driving wheels of the vehicle by using the EC method. When the roller is rotated by the car wheel, the flywheel of the belt-connected brake (PAU) is rotated. When a current is applied to the coil of the brake PAU, it is magnetized and becomes an electromagnet, and a magnetic field is formed. This magnetic field generates an eddy current in the flywheel and forms an electromotive force in the direction opposite to rotational direction, and acts as a brake to measure power of the experimental vehicle [
15].
The chassis power-measuring device used in this study conforms to the US BAR97 (Bureau of Automotive Repair) certification standard and supports IM 240 (Inspection & Maintenance Driving Cycle), ASM 2525 (Acceleration Simulation Mode), and CVS 75 (Constant Volume Sampler) modes, which are test modes of gasoline and LPG (Liquefied Petroleum Gas) vehicles according to current South Korean regulations. It also supports diesel vehicle test modes KD147, LugDown3, and NEDC (New European Driving Cycle).
The TMED type hybrid vehicle is a domestic vehicle and uses a clutch between the engine and motor to control the engine. The engine uses only the motor when starting from stop state and low speed, and only the power of the engine with high efficiency at the constant speed with low load. In a state requiring a large output such as acceleration and gradeability, the engine and motor are used simultaneously to improve fuel economy.
Table 1 shows specifications of the hybrid electric vehicle used in this study.
2.2. Data Acquisition Device
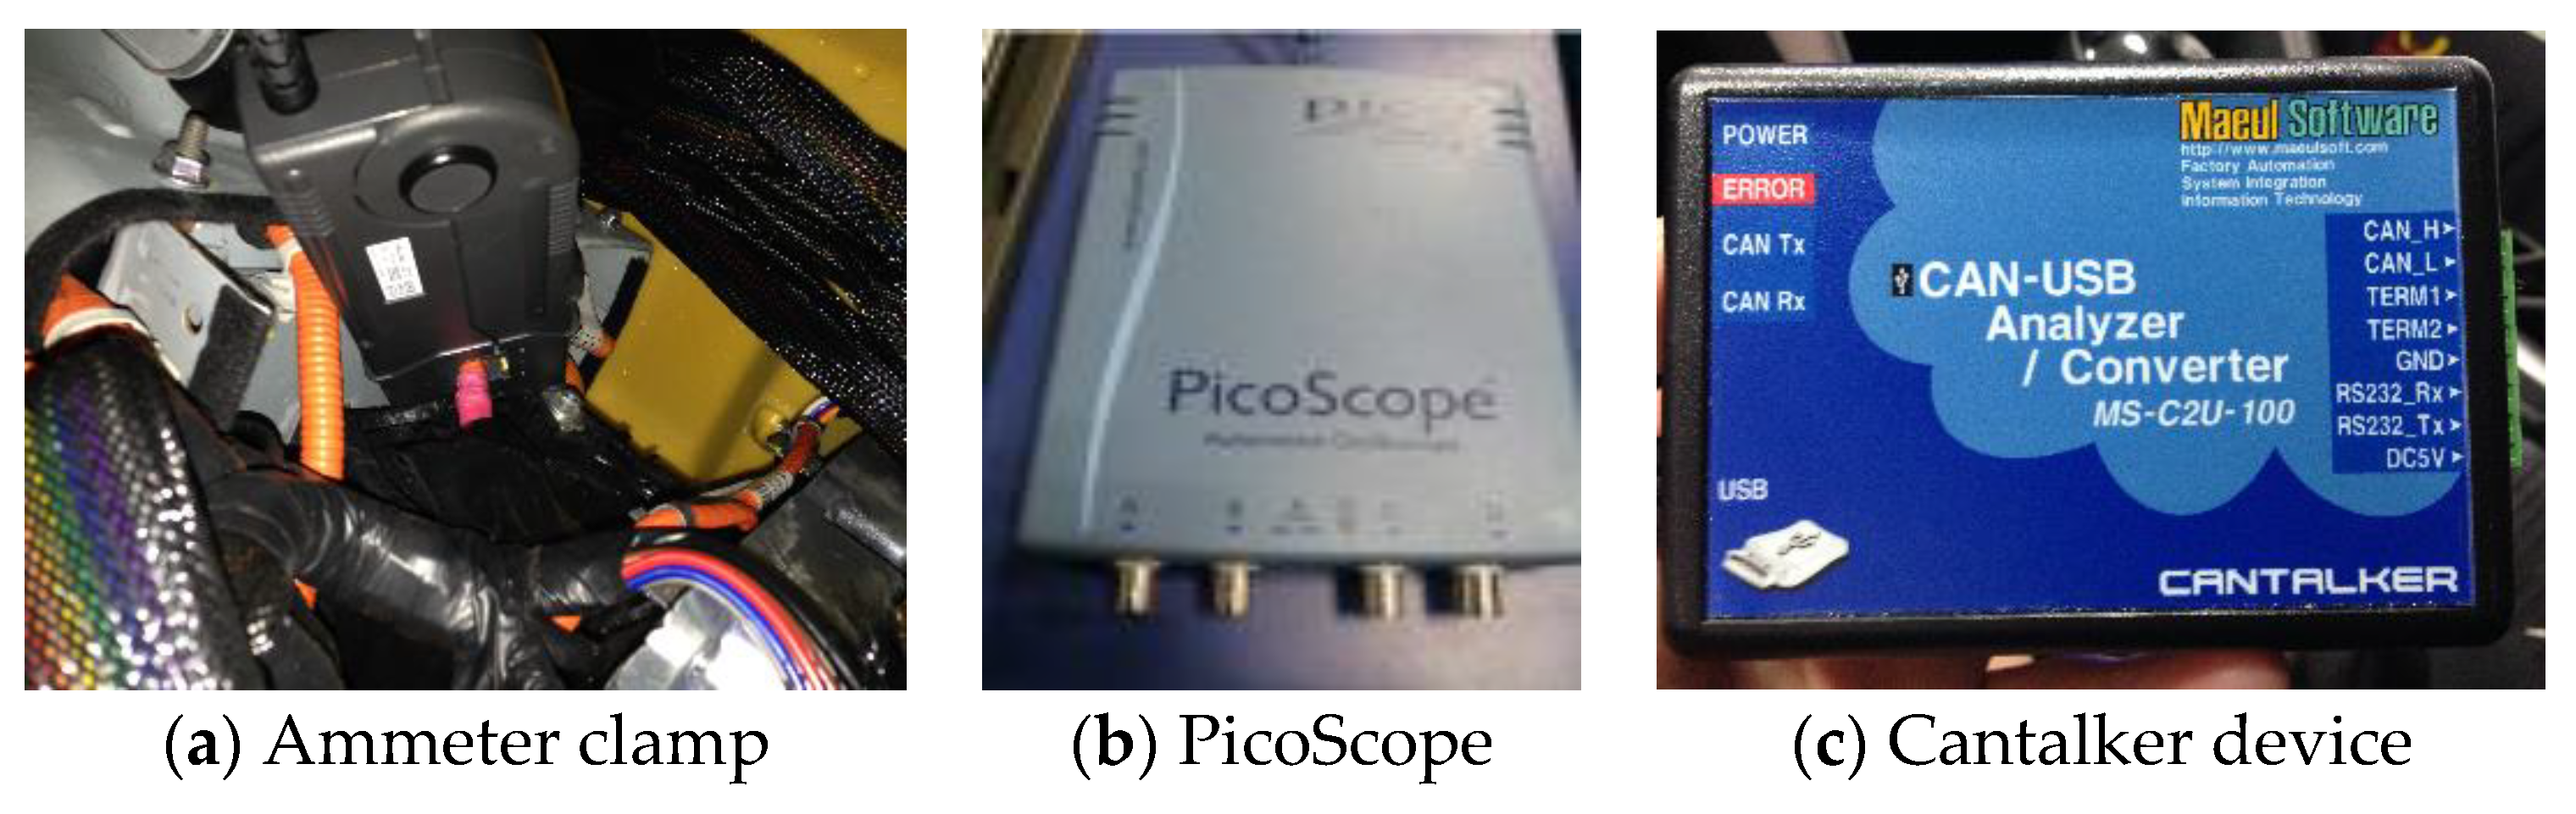
To measure actual current change in this experiment, a precise current measurement was performed using a high-battery battery ammeter clamp (9287 Universal Clamp on CT, Hioki Co., Nagano, Japan) as shown in
Figure 2a. An ammeter clamp was installed on high-voltage wire connected to the high-voltage battery and drive motor. Measured current data was stored through the PicoScope shown in
Figure 2b and charge and discharge states were analyzed by analyzing measurement data.
Figure 2c shows the real-time estimation of SOC, Motor RPM, Engine RPM, HSG RPM, Injection Duration, and Voltage. Specifications of the ammeter clamp are shown in
Table 2.
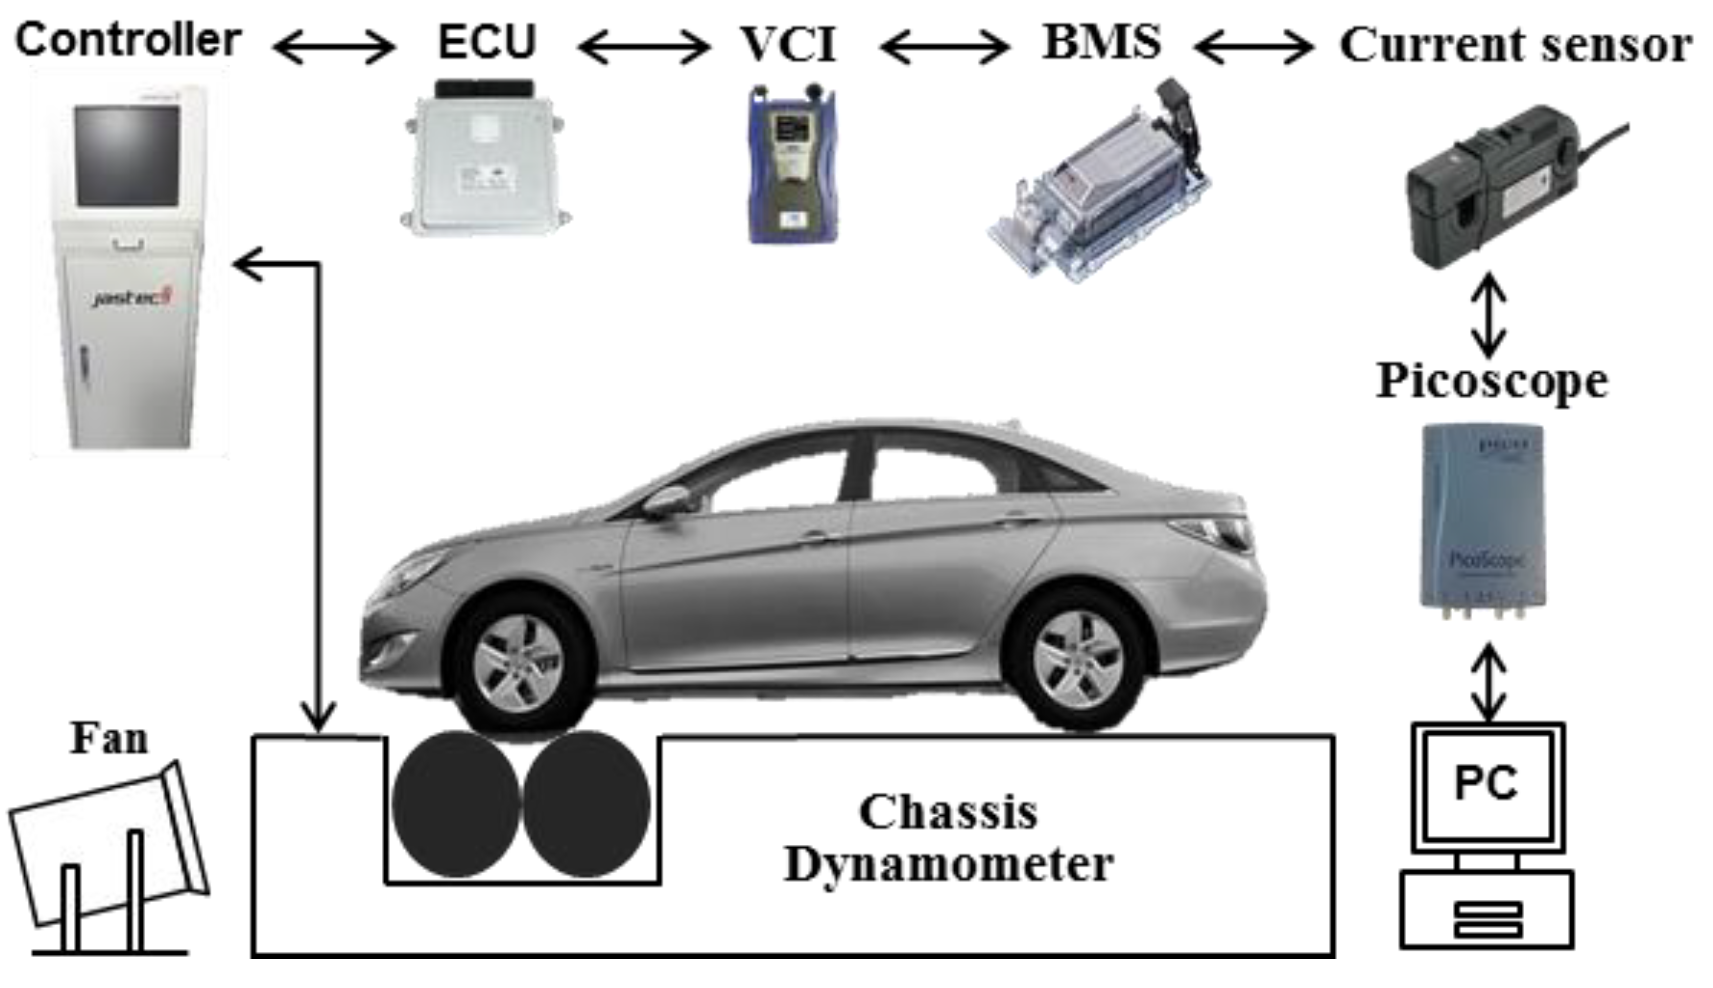
Figure 3 shows an overall schematic diagram of the experimental setup used in this study.
2.3. Vehicle Driving Cycle and Experimental Condition
IM240 mode was performed for the operating mode for analyzing charging characteristics in regenerative braking operation according to the initial SOC state as shown in
Figure 4. IM240 cycle is a chassis dynamometer schedule developed and recommended by the U.S. EPA for emission testing of in-use, light-duty vehicles in inspection and maintenance (I&M) programs implemented in a number of states. The EPA has also developed a guidance document specifying IM240 emission standards for use in I&M testing programs.
If the hybrid vehicle does not operate the accelerator pedal according to SOC management strategy, there is a situation wherein the battery is charged at the time of deceleration during inertia running. Since the deceleration section in the middle of the mode as shown in
Figure 4 is the deceleration section due to inertia running, in this study, it is not regenerative braking during braking, and is excluded from the target.
This is because regenerative braking due to brake actuation is a clear reference to characterizing battery charging separately from hybrid operating modes.
The energy of the hybrid vehicle used in this study is calculated by calculating
J (Joule, kWh) to calculate the actual charged electric energy
E (Energy, kWh), obtained by the following formula:
In this study, regenerative braking period is an energy recovery mechanism that slows a vehicle into a form that can be stored in a secondary battery, and is ranged to the point wherein the vehicle speed is 0 after the brake is applied. Data interval of SOC and current (OBD, PicoScope) are extracted and analyzed in 350 ms units.
Experimental conditions are shown in
Table 3, and initial SOC state was 35% and 65% (tolerance of IM240 mode is within ±3 km/h). IM240 is a 240 s test representing a 3.1 km route with an average speed of 47.3 km/h and a maximum speed of 91.2 km/h.
3. Results and Discussion
Figure 5 shows the section wherein vehicle speed is zero from the moment when braking signal is input as the result of the IM240 test under SOC 35% and 65% conditions. Characteristic of the hybrid vehicle that optimizes SOC is that the engine operates from the start, operating in low SOC state, and begins to charge and maintains constant charging state even after the vehicle stops. On the contrary, when SOC is 65%, only the output main motor is driven, and the engine is in the resting state in the regenerative braking period.
As the vehicle used in this study is applied to the algorithm that maintains the SOC standard at approximately 50%, it is judged that variation rate is low at the condition where SOC is relatively high.
A total of three experiments were performed with respect to two regenerative brakes (Sections A and B) under SOC 35% and 65% conditions. As shown in
Figure 5, A is a low-speed section for regenerative braking at approximately 50 km and B is a high-speed section for regenerative braking at approximately 90 km. In this study, all data in OBD and PicoScope were matched by Python’s spline interpolation model at 0.35 s intervals. Spline interpolation is a form of interpolation wherein the interpolant is a special type of piecewise polynomial called a spline. Spline interpolation is often preferred over polynomial interpolation because the interpolation error can be made small even when using low-degree polynomials for the spline. Spline interpolation prevents the problem of Runge’s phenomenon, when oscillation can occur between points interpolating using high-degree polynomials.
In the case of the OBD signal, SOC evaluation value is output based on calculated current after passing through the algorithm of the manufacturer’s own, but it can be inferred that the PicoScope is caused by directly calculating current charged in the battery.
3.1. Comparison of Estimated Battery Charge
Table 4 summarizes changes in charge level due to the SOC signal from the OBD of the vehicle and current measured directly from the battery for hybrid to the PicoScope. Error value, the difference between the previous two values, is shown, and charge amount is also calculated for the SOC 65% condition in the same method.
From error results shown in
Table 4 and
Table 5, current error measured in the PicoScope is larger than SOC fluctuation obtained through the OBD.
As a result of performing the experiment three times, error occurs in the result obtained with OBD and the PicoScope. After displaying measured charge in the repeated experiment according to each SOC condition, the difference between the OBD and the PicoScope was indicated. Although there is no consistent error in the specific measurement method, the difference according to the SOC reveals a larger error in the state of low charge (SOC 35%).
Figure 6 shows the error of each condition by linear fit, and absolute value of the slope was analyzed. Each case represents a total of three experiments with the hybrid vehicle under the same conditions. The slope of error between zone A and zone B is approximately 3.67 times under SOC 35% condition and 2.75 times under 65% condition. SOC error increased because charging is performed more frequently in low-SOC condition. The amount of recovered electric energy in the high-speed Section B is large, influencing increase of the charge amount error. So, algorithms and applications for SOC estimation with higher accuracy are needed.
3.2. Suggestion of SOC Calculation Algorithm
To improve accuracy for determining SOC, a complex experimental method is needed. To solve this problem, we propose an algorithm as shown in
Figure 7 that reduces error due to current integration by measuring and integrating charge current of the secondary battery by the SOC at each braking deceleration section (low speed, medium speed, high speed).
So, two charging states are defined for the secondary battery, that is, the charging lower limit value and the charging upper limit value. When charge state is between upper limit value and lower limit value, the secondary battery is charged with increased voltage during braking, and the secondary battery is no longer charged in the driving phase.
First, during braking, the battery SOC is estimated at corresponding deceleration per deceleration section, and battery current is measured at predetermined time intervals during braking period.
Thereafter, the SOC value is calculated based on accumulated current value measured for a predetermined time, and compared with the SOC of the immediately preceding same condition, it is determined if the SOC value is equal to or smaller than a particular value (a).
If it is not less than the particular value (a), it is judged as an error. If it is less than the particular value (a), this value is compared with the SOC value at the start of braking.
If it is not less than the specified value (a), it is judged an error. If it is less than the specified value (a), this value is compared with the SOC value at the start of braking. If the value is less than the specific value (b), the actual SOC calculation result is transmitted to determine the final SOC value. If it is more than the specific value (b), it is judged an error.
When it is determined as an error, the arithmetic mean value of the two values is calculated and stored as the final SOC value.


