Recent Advances in Brillouin Optical Correlation-Domain Reflectometry


Institute of Innovative Research, Tokyo Institute of Technology, 4259 Nagatsuta-cho, Midori-ku, Yokohama 226-8503, Japan
*
Author to whom correspondence should be addressed.
Appl. Sci. 2018, 8(10), 1845; https://doi.org/10.3390/app8101845
Submission received: 13 September 2018
/
Revised: 4 October 2018
/
Accepted: 5 October 2018
/
Published: 8 October 2018
(This article belongs to the Special Issue Optical Correlation-domain Distributed Fiber Sensors)
Abstract
:Featured Application
Structural health monitoring.
Abstract
Distributed fiber-optic sensing based on Brillouin scattering has been extensively studied and many configurations have been developed so far. In this paper, we review the recent advances in Brillouin optical correlation-domain reflectometry (BOCDR), which is known as a unique technique with intrinsic single-end accessibility, high spatial resolution, and cost efficiency. We briefly discuss the advantages and disadvantages of BOCDR over other Brillouin-based distributed sensing techniques, and present the fundamental principle and properties of BOCDR with some special schemes for enhancing the performance. We also describe the recent development of a high-speed configuration of BOCDR (slope-assisted BOCDR), which offers a beyond-nominal-resolution detectability. The paper is summarized with some future prospects.
1. Introduction
Since the Brillouin frequency shift (BFS) in optical fibers was found to be dependent on applied strain and ambient temperature [1,2,3,4], extensive research has been conducted to exploit Brillouin scattering to develop distributed fiber-optic sensors. The first demonstrations were performed by time-of-flight techniques; they are called Brillouin optical time-domain analysis (BOTDA) [5] and Brillouin optical time-domain reflectometry (BOTDR) [6]. In both techniques, optical pulses are injected into fibers under test (FUTs), and by measuring the time until the reflected signals are returned, the locations in the FUTs can be derived. In BOTDR, optical pulses are injected into only one end of the FUT, and they are partially returned via spontaneous Brillouin scattering. In contrast, in BOTDA, a continuous wave (probe) is injected into the other end of the FUTs in addition to the optical pulses (pump). The frequency of the probe light is downshifted by the BFS in advance, and then the pump and probe lights interact with each other, inducing stimulated Brillouin scattering (SBS). As SBS is much stronger than spontaneous Brillouin scattering, the signal-to-noise ratio (SNR) of BOTDA is much higher than that of BOTDR, leading to a shorter measurement time because of the reduced averaging count. However, unlike BOTDR with single-end accessibility, the two-end-access nature of BOTDA is not beneficial to users, because the degree of freedom in deploying the fiber is lowered and the measurement can no longer be continued if the fiber has one breakage point. Thus, BOTDR and BOTDA are in a trade-off relationship. The spatial resolution of these time-domain techniques is determined by the pulse width of the pump light. The basic limitation of the pulse width is known to be approximately 10 ns (corresponding to the spatial resolution of ~1 m) because of the spectral broadening of the Brillouin gain spectrum (BGS) and reduced accuracy of BFS detection [7]. It is noteworthy that the performance including the spatial resolution has been drastically enhanced with various schemes both in BOTDR [8,9,10,11] and in BOTDA [12,13,14,15,16,17,18,19,20]; refer to each reference for the details. Researchers have also developed Brillouin optical frequency-domain analysis (BOFDA) [21,22,23] and Brillouin optical frequency-domain reflectometry (BOFDR) [24], which seem to suffer from their relatively slow operation speed because of the large amount of calculation; their details are also out of the scope of this paper.
The other configurations of Brillouin-based distributed fiber-optic sensors are Brillouin optical correlation-domain analysis (BOCDA) [25,26,27,28,29,30,31,32,33,34,35] and Brillouin optical correlation-domain reflectometry (BOCDR) [36,37]. These techniques utilize not optical pulses but frequency-modulated continuous waves to achieve distributed measurements and thus possess so-called random accessibility to sensing points and high spatial resolution without specially configured implementations. BOCDA is a two-end-access system, which operates based on stimulated Brillouin scattering and thus has a relatively high SNR. The details of BOCDA will be fully described in other papers of this Special Issue. Although the SNR of BOCDR is lower than that of BOCDA, its single-end accessibility is beneficial to users as the degree of freedom in embedding the fiber is higher and distributed sensing can be continued even when the fiber is broken at a certain point during the measurement.
In this paper, we review the fundamentals and recent advances in BOCDR, with an emphasis on its high-speed configuration. In Section 2, we describe the basic principle of BOCDR and clarify its difference from that of BOCDA. In Section 3, we present some configurations for improving its performance. In Section 4, we focus on slope-assisted BOCDR and present its principle along with some unique features including the beyond-nominal-resolution effect. In Section 5, we provide a summary and discuss the future prospects of BOCDR technology.
2. Basic Principle of BOCDR
When a light beam is injected into an FUT, it interacts with acoustic phonons, generating backscattered light called Stokes light. This phenomenon is called spontaneous Brillouin scattering. Caused by the exponential decay of the acoustic phonons, the backscattered Brillouin light spectrum, known as BGS, takes the shape of a Lorentzian function with the bandwidth of several tens of megahertz. If the power of the pump light is higher than the Brillouin threshold power Pth, the Stokes light caused by spontaneous Brillouin scattering acts as a seed of stimulated scattering, and there occurs a transition from spontaneous Brillouin scattering to SBS; as a result, the Stokes light power is drastically enhanced. This transition can be promoted using a so-called pump-probe technique, in which a probe light beam (frequency-downshifted by the BFS) is additionally injected into the other end of the FUT. This is the reason why SBS-based distributed sensor configurations, such as BOTDA, BOFDA, and BOCDA, require light injection into both ends of the FUT.
In Brillouin scattering, whether it is spontaneous or stimulated, the frequency at which the peak power is obtained in the BGS is downshifted by several gigahertz from the incident light frequency, and the amount of this frequency shift is called BFS. In optical fibers, the BFS νB is given by [1]:
where n is the refractive index, νA is the acoustic velocity in the fiber, and λp is the wavelength of the incident pump light. If tensile strain is applied or temperature is changed in a standard silica single-mode fiber (SMF), the BFS shifts to higher frequency in proportion to the applied strain (+480 MHz/%) [3] and the temperature change (+1.18 MHz/K) [4] at 1.55 μm. In some specialty fibers, such as tellurite glass fibers and polymer optical fibers (POFs), it is known that the BFS moves to lower frequency with increasing applied strain (−230 MHz/% [38] and −122 MHz/% [39,40], respectively) and temperature (−1.14 MHz/K [41] and −4.09 MHz/K [39,40], respectively). In both cases, we can derive the strain amplitude and temperature change by measuring the BFS in the fiber.
One of the most essential features of Brillouin-based sensors is their distributed sensing capability. In BOCDR, distributed sensing is achieved using a technique called the synthesis of an optical coherence function (SOCF). The conceptual setup of BOCDR is schematically shown in Figure 1. The optical output from a laser diode is divided into pump and reference light beams. The pump light is injected into the FUT, and the Stokes light is directed into a photodiode (PD). The reference light is used as an optical local oscillator. The electrical beat signal of the two light beams is monitored using an electrical spectrum analyzer (ESA). Since there is a frequency difference of approximately 11 GHz between the Stokes light and the reference light, this configuration is called a self-heterodyne scheme. In order to resolve the position in the FUT, the optical frequency of the laser output is modulated in a sinusoidal waveform by directly modulating the injection current of the laser. From the viewpoint of temporal averaging, the coherence function is synthesized into a series of periodical peaks [25], of which the period is inversely proportional to the frequency of the sinusoidal modulation fm. We control fm to generate only one correlation peak within the range of the FUT, so that only the Brillouin scattering generated at the position correspondent to the peak has high correlation with the reference light, and then gives high heterodyne output. The peak frequency observed using the ESA gives the BFS caused at the position. By sweeping fm, the position of the correlation peak is scanned along the FUT, and thus the distribution of the BGS or the BFS is obtained. Note that a delay line is often inserted in the reference path so that the order of the correlation peak in the FUT may not be zero; the 0th-order correlation peak cannot be scanned along the FUT by controlling fm.
Here, we give another explanation of the operating principle of BOCDR using Figure 2. When the laser frequency is sinusoidally modulated, the frequencies of the reference light and the Stokes light at the PD are expressed by the equations shown in Figure 2, where φ and ψ are phase factors. While φ is a constant, ψ changes according to where, in the FUT, the pump light is reflected. For example, when the pump light is reflected at Position A and φ = ψ + 2 π n (n: integer), the frequency difference of the reference light and the Stokes light is always the same regardless of time, and so the beat signal can be detected. In contrast, when the pump light is reflected at Position B and φ ≠ ψ + 2 π n, the frequency difference of the two light beams changes according to time, and so the beat signal cannot be observed. From the viewpoint of time averaging, we interpret that a correlation peak is standing at Position A. Now the modulation of the laser frequency is a periodical sinusoidal waveform, these correlation peaks appear periodically along the FUT, so only one correlation peak should be located within the range of the FUT to resolve the position properly, resulting in the limited measurement range. The position of the correlation peak can be scanned along the fiber by adjusting the modulation frequency fm.
The spatial resolution Δz and the measurement range dm (distance between the neighboring correlation peaks) of BOCDR are given by the same equations as those for BOCDA [25,37]:
where vg is the group velocity of light, ΔνB is the Brillouin gain bandwidth (~30 MHz) in optical fibers, and Δf is the modulation amplitude of the light source. Equation (2) was originally derived for BOCDA, so it is not evident that the spatial resolution of BOCDR is also given by this expression; refer to Reference [37] for the derivation of Equation (2) in BOCDR. According to Equations (2) and (3), it is evident that Δz and dm are in a trade-off relationship, and thus their ratio (=dm/Δz) is often used to evaluate the performance of BOCDR. Considering that Δf is limited to a half of the BFS, the resolution-to-range ratio of silica-fiber-based BOCDR is limited to 570, which can be extended by some special configurations (refer to the next section). Note that the SNR of BOCDR cannot be simply given as a function of system parameters, such as Δf, fm, and fiber length.
Finally, we compare the operating principle between BOCDA and BOCDR as shown in Figure 3. In both systems, the pump light is reflected everywhere in the FUT due to spontaneous Brillouin scattering. In order to resolve the position, in BOCDA, stimulated Brillouin scattering is strongly induced at one specific position in the FUT by injecting the frequency-modulated pump and probe light beams into each end of the FUT. In contrast, in BOCDR, the Stokes light due to spontaneous Brillouin scattering from one specific position in the FUT is selectively observed by the heterodyne detection with the frequency-modulated reference light. As a consequence, the Stokes light from the FUT in one-end-access BOCDR becomes much smaller than that in two-end-access BOCDA. Hence, another point of BOCDR is to utilize the heterodyne detection not only to resolve the position but also to enhance the beat signal.
3. Various Configurations of BOCDR
Since the proposal of BOCDR, numerous special configurations have been developed to enhance its performance. For instance, in order to mitigate the trade-off relationship between the spatial resolution and the measurement range, a temporal gating scheme [42] and a double modulation scheme [43] were developed. In the temporal gating scheme (Figure 4a), the measurement range was extended while maintaining the spatial resolution by exploiting relatively long optical pulses generated using intensity modulators (IMs). Then, we can arbitrarily select a single correlation peak from multiple correlation peaks located in the FUT. In contrast, in the double modulation scheme (Figure 4b), by modulating the optical frequency at two different frequencies simultaneously, the spatial resolution is given by the higher frequency while the measurement range is given by the lower frequency. These techniques can be simultaneously employed.
Regarding the polarization, BOCDR was found to have an ability to measure the beat length distribution [44], while the polarization-dependent fluctuations of the Brillouin signals were suppressed by polarization scrambling [45,46]. Some specialty fibers, such as tellurite fibers [38,40], bismuth-oxide fibers [47], and polymer fibers [48], were used in BOCDR to make the most of their special features (high Brillouin gain coefficients, high flexibility, etc.). The influence of a ghost correlation peak was investigated and its suppression was shown to be extremely important [49]. Some simple configurations of BOCDR were developed to further reduce the system cost [50,51,52]. An apodization scheme based on synchronous intensity modulation [53] and a lock-in detection scheme [54] were also performed to suppress the noise floor and to enhance the strain dynamic range, etc. Finally, to achieve high-speed operation (the sampling rate was limited to <20 Hz in the standard configuration [55]), phase-detected BOCDR [56,57,58] and slope-assisted BOCDR were developed. In both schemes, the idea for high-speed operation is the same; namely, the omission of the frequency-scanning process for acquiring the BGS. In phase-detected BOCDR, the BGS is converted from a frequency domain into a time domain and approximated by a one-period sinusoidal waveform, the phase of which is detected at a high speed. The slope-assisted BOCDR is the main focus of this paper and will be detailed in the following section.
4. Development of Slope-Assisted BOCDR
In this section, we describe the fundamentals, unique features, and recent advances of the high-speed configuration of BOCDR, named slope-assisted BOCDR [59,60,61], with an emphasis on the so-called beyond-nominal-resolution effect.
4.1. Principle and Fundamental Operation
In the standard configuration of BOCDR, the BFS at a single sensing point is derived after acquiring the whole BGS. In contrast, the slope-assisted BOCDR provides the BFS information using the BGS slope. This idea has been already proposed for BOTDA [62,63,64]. As depicted in Figure 5a, the BFS is in one-to-one correspondence with the spectral power PB0 at a certain frequency νB0, which is set at the high-frequency point in the linear region (lower-frequency side) of the BGS slope. Then, when the BFS slightly shifts to higher frequency by strain, etc., PB0 decreases linearly; when the slight loss occurs in the FUT, the spectral power of the BGS entirely decreases, also leading to the reduction of PB0. Even if the BFS change is so large that νB0 gets out of the linear region, so long as PB0 is in one-to-one correspondence with the BFS, this system operates properly (with a reduced sensitivity) by simple nonlinear compensation. One may point out that the noise floor of correlation-domain techniques is influenced by the sidelobes of the correlation peak and that the slope-assisted configuration does not work properly in principle, but this issue can be mitigated if we accept the deterioration of the spatial resolution to some extent just in the same manner as in the phase-detected BOCDR [56].
Figure 5b,c schematically show the changes in the PB0 distributions when strain (or heat) and loss are locally applied, respectively. The strain and temperature effects cannot be separated in this method, but the loss effect can be discriminated from the locally applied strain (or temperature change) in most cases, because the decreased PB0 value does not return to the initial value. The PB0 change distributions (calculated by substituting the resultant PB0 distributions (solid curves) from their initial distributions (dotted lines)) are used as final measurement data.
To evaluate the optimal νB0 value and the bandwidth of the linear region, we analyzed a raw BGS with a BFS of 10.89 GHz (see Figure 6a), which was experimentally obtained when the FUT length L and experimental conditions (such as the modulation frequency fm and amplitude Δf) were set to the same values as those for the initial experiment (L = 5.0 m, fm = 8.0 MHz, Δf = 1.4 GHz) [59]. Here, we defined the linear region as the region where the change in the BGS slope was suppressed within 20% compared to its maximum. Based on the slope (i.e., differential coefficient) dependence on the frequency (Figure 6b) obtained by differentiating the BGS with respect to frequency, the optimal νB0 value to widen the linear region was found to be 10.85 GHz. The bandwidth of the linear region was approximately 50 MHz, which corresponds to the strain of up to ~1035 µε and the temperature change of ~45 K. In this linear region, the theoretical strain and temperature dependence coefficients were calculated to be 2.1 × 10⁻⁴ dB/µε and 4.3 × 10⁻³ dB/K, respectively.
The FUT employed in the initial experiment was a 5.0-m-long silica SMF with a BFS of 10.89 GHz at 1.55 μm at room temperature. The experimental setup of slope-assisted BOCDR is schematically shown in Figure 7, which is basically the same as Figure 1; the only essential difference lies in the final signal processing. The output light from a distributed-feedback laser diode at 1.55 μm was divided into two light beams, pump and reference. The pump light was amplified to ~24 dBm using an EDFA and injected into the FUT. After passing through a ~1-km-long delay line and another EDFA (amplified to ~5 dBm), the reference light was used for heterodyne detection with the Stokes light, which was amplified to ~2 dBm. The polarization-dependent fluctuations were suppressed using a polarization scrambler (PSCR). The heterodyned optical signal was converted into an electrical signal using a PD and was guided to an ESA. Using the narrowband-pass filtering function of the ESA, the PB0 change at a fixed frequency νB0 (=10.85 GHz) was sequentially output to an oscilloscope (OSC).
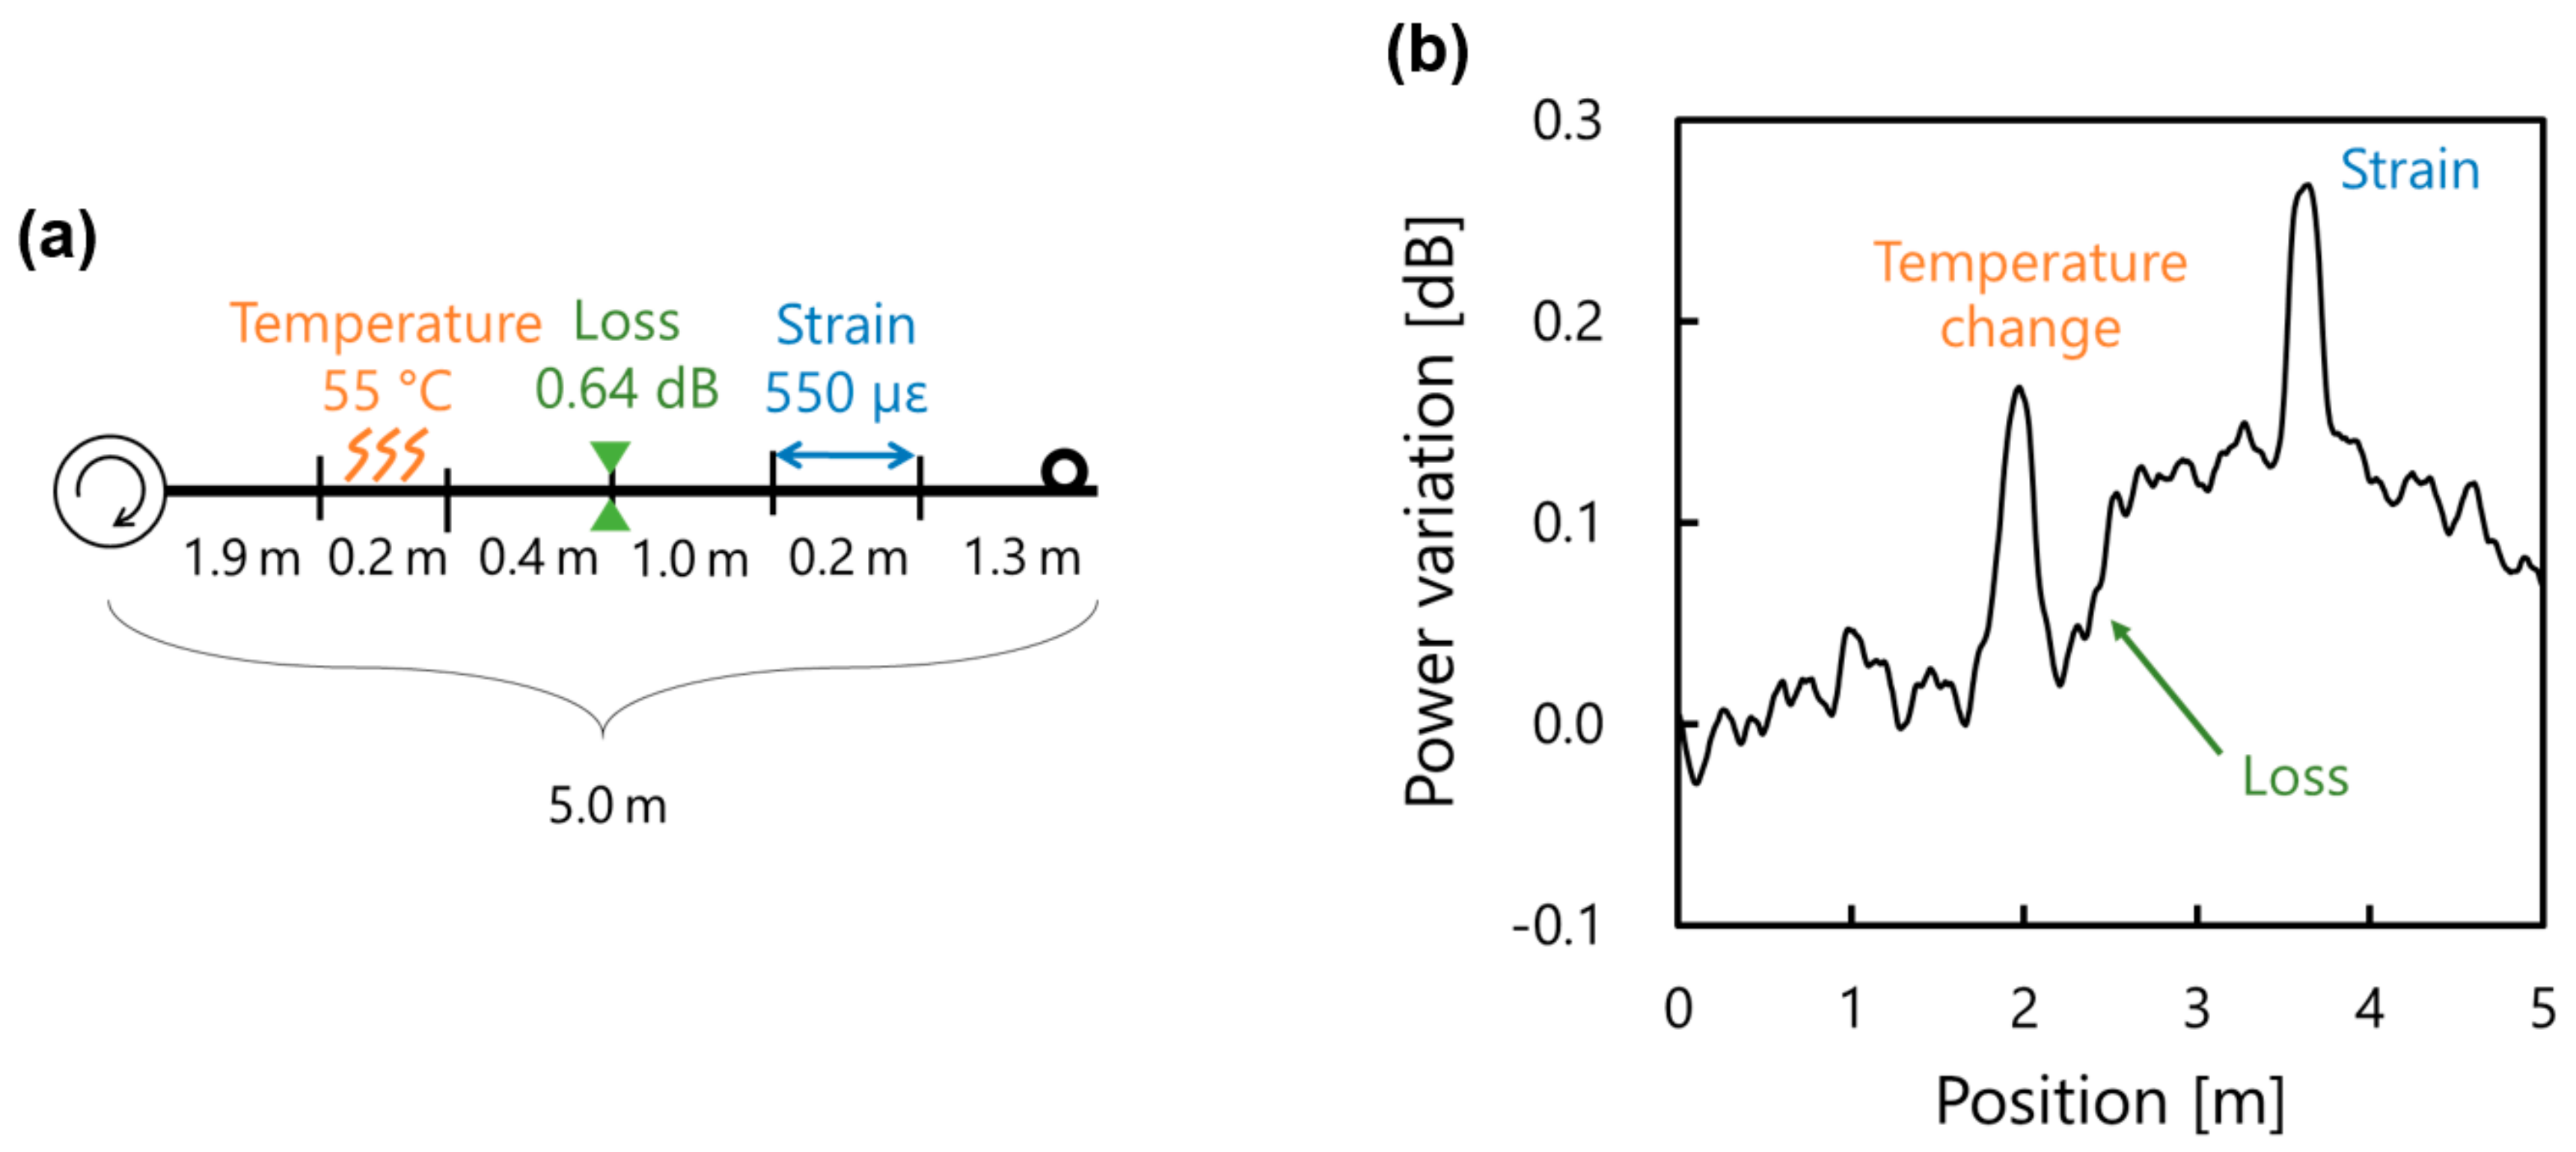
In the initial experiment, a 0.1-m-long section around the distal open end of the FUT was bent to suppress the Fresnel reflection. The modulation frequency fm and amplitude Δf were set to 7.975–8.055 MHz and 1.4 GHz, respectively, corresponding to the measurement range of 12.9 m and the theoretical spatial resolution of 88 mm. The repetition rate was 100 Hz, and averaging was performed 16 times on the OSC. The room temperature was 26 °C. The measured results of the fundamental characterization, i.e., the PB0 change dependencies on strain, temperature, and loss, are presented in Reference [59] (the data are not presented here because of the low SNR). The strain-, temperature-, and loss-dependence coefficients of the output signal were 1.95 × 10⁻⁴ dB/µε, 4.42 × 10⁻³ dB/K, and 0.191, respectively. A proof-of-concept demonstration of slope-assisted BOCDR was then performed by simultaneous measurement of strain, temperature, and loss. The structure of the 5.0-m-long FUT is shown in Figure 8a; the ambient temperature was changed to 55 °C along the 1.9–2.1-m section, a 0.64-dB loss was applied at the midpoint, and a 550 µε strain was applied to the 3.5–3.7-m section. Figure 8b shows the measured PB0 change distribution along the FUT. The PB0 changes corresponding to the temperature change, loss, and strain were observed at the expected sections. The amounts of the PB0 changes for the temperature change, loss, and strain were approximately 0.16, 0.14, and 0.12 (=0.26–0.14) dB (corresponding to the temperature change, loss, and strain of ~62 °C, ~0.73 dB, and ~615 µε, respectively). The measurement errors probably originate from the signal fluctuations and the resultant low SNR.
4.2. Beyond-Nominal-Resolution Effect
One fundamental issue that must be solved to characterize the slope-assisted BOCDR operation is the correspondence between the final system output (i.e., power-change distribution) and the actual BFS distribution. In standard BOCDR based on frequency information, these two distributions have been proven to be identical in principle; however, in slope-assisted BOCDR based on power information, no report has been made. Here, we theoretically and experimentally show that the final system output of slope-assisted BOCDR is generally different from the actual BFS distribution. We also show that, even when the strained section is shorter than the nominal resolution, some shift in the power change can be observed. This feature is unique to the slope-assisted BOCDR and useful for practical applications.
To start with, we simulated the system output of slope-assisted BOCDR. We assumed that one section of the FUT was uniformly strained. The magnitude of the strain was assumed to constantly lie below the upper limit of the linear region (~2000 µε). The lengths of the strained section were set to 0.25R, 0.5R, 0.75R, R, 2R, 5R, and 10R, where R indicates the nominal spatial resolution calculated using Equation (2). First, the simulation results for the strain distributions acquired using the standard BOCDR (deduced from the BFS distributions using the linear BFS-to-strain relationship) are shown in Figure 9a, which completely reproduce the actual BFS distributions. Next, the simulation results for the strain distributions obtained from the slope-assisted BOCDR (also deduced from the final power-change distributions simply based on the linear power-to-strain relationship) are shown in Figure 9b (strained: 0.5R, R, 2R, 5R, and 10R) and Figure 9c (strained: 0.25R, 0.5R, 0.75R, and R). Here, for simplicity, we neglected both the complicated longitudinal shape of the correlation peak and the influence of its sidelobes [65]; that is, the longitudinal shape of the correlation peak was approximated by a rectangular profile with a length of R. At the ends of the strained section (i.e., the boundaries between the strained and non-strained sections), the power change varied linearly with the length of R; consequently, each whole power-change distribution showed a trapezoidal shape (including triangular). Thus, we see that when the strained section is sufficiently longer than R, the power-change distribution almost reproduces the actual BFS distribution. In contrast, when the length of the strained section is approximately R or only a few times longer than R, the correct BFS distribution cannot be directly obtained (under the assumption that the strain is uniformly applied; however, the correct information can be easily derived). What is notable here is that, even when the strained section is shorter than R, we can observe a trapezoidal-shaped shift in the power change and thereby obtain the information that some irregularity has occurred at that point. For instance, when the length of the strained section is 0.5R, a trapezoidal shape with a maximal power-change shift (corresponding to half the amount obtained with a strained section longer than R) is observed.
Subsequently, the aforementioned simulation results including this “beyond-nominal-resolution” effect are experimentally verified (note that with this effect, we cannot distinguish two hot spots of which the distance is smaller than the nominal resolution, as the two hot spots are broadened; we can just detect an extremely short hot spot, and in this meaning, the spatial resolution of the system is not enhanced with this effect). The setup was basically the same as that in Figure 7; the change in the spectral power at 10.81 GHz was sequentially output to the OSC (owing to the difference in the video bandwidth of the ESA). The FUT was a 13.0-m-long silica SMF with a BFS of 10.86 GHz at 1.55 µm at room temperature (25 °C). Measurements were performed using two configurations: one for a relatively high spatial resolution and the other for a relatively low resolution (required to investigate the beyond-nominal-resolution effect). In the first configuration with a high resolution, strains of 750 µε and 1500 µε were applied to 5-cm-, 10-cm-, 20-cm-, 50-cm-, and 100-cm-long sections of the FUT, as depicted in Figure 10a. The modulation frequency fm and amplitude Δf were set to 7.11–7.31 MHz and 1.3 GHz, respectively, corresponding to the measurement range of 14.5 m and the theoretical spatial resolution of 9.5 cm according to Equations (2) and (3). In the second configuration with a low resolution, a strain of 1500 µε was applied to 5-cm-, 10-cm-, 15-cm-, and 20-cm-long sections of the FUT (see Figure 10b). The modulation frequency fm was swept in the same range (7.11–7.31 MHz), thus giving the same measurement range (14.5 m). The modulation amplitude Δf was reduced to 0.7 GHz, corresponding to a theoretical spatial resolution of 19.6 cm. In both configurations, the repetition rate was set to 100 Hz, and averaging was performed 64 times on the OSC to improve the SNR.
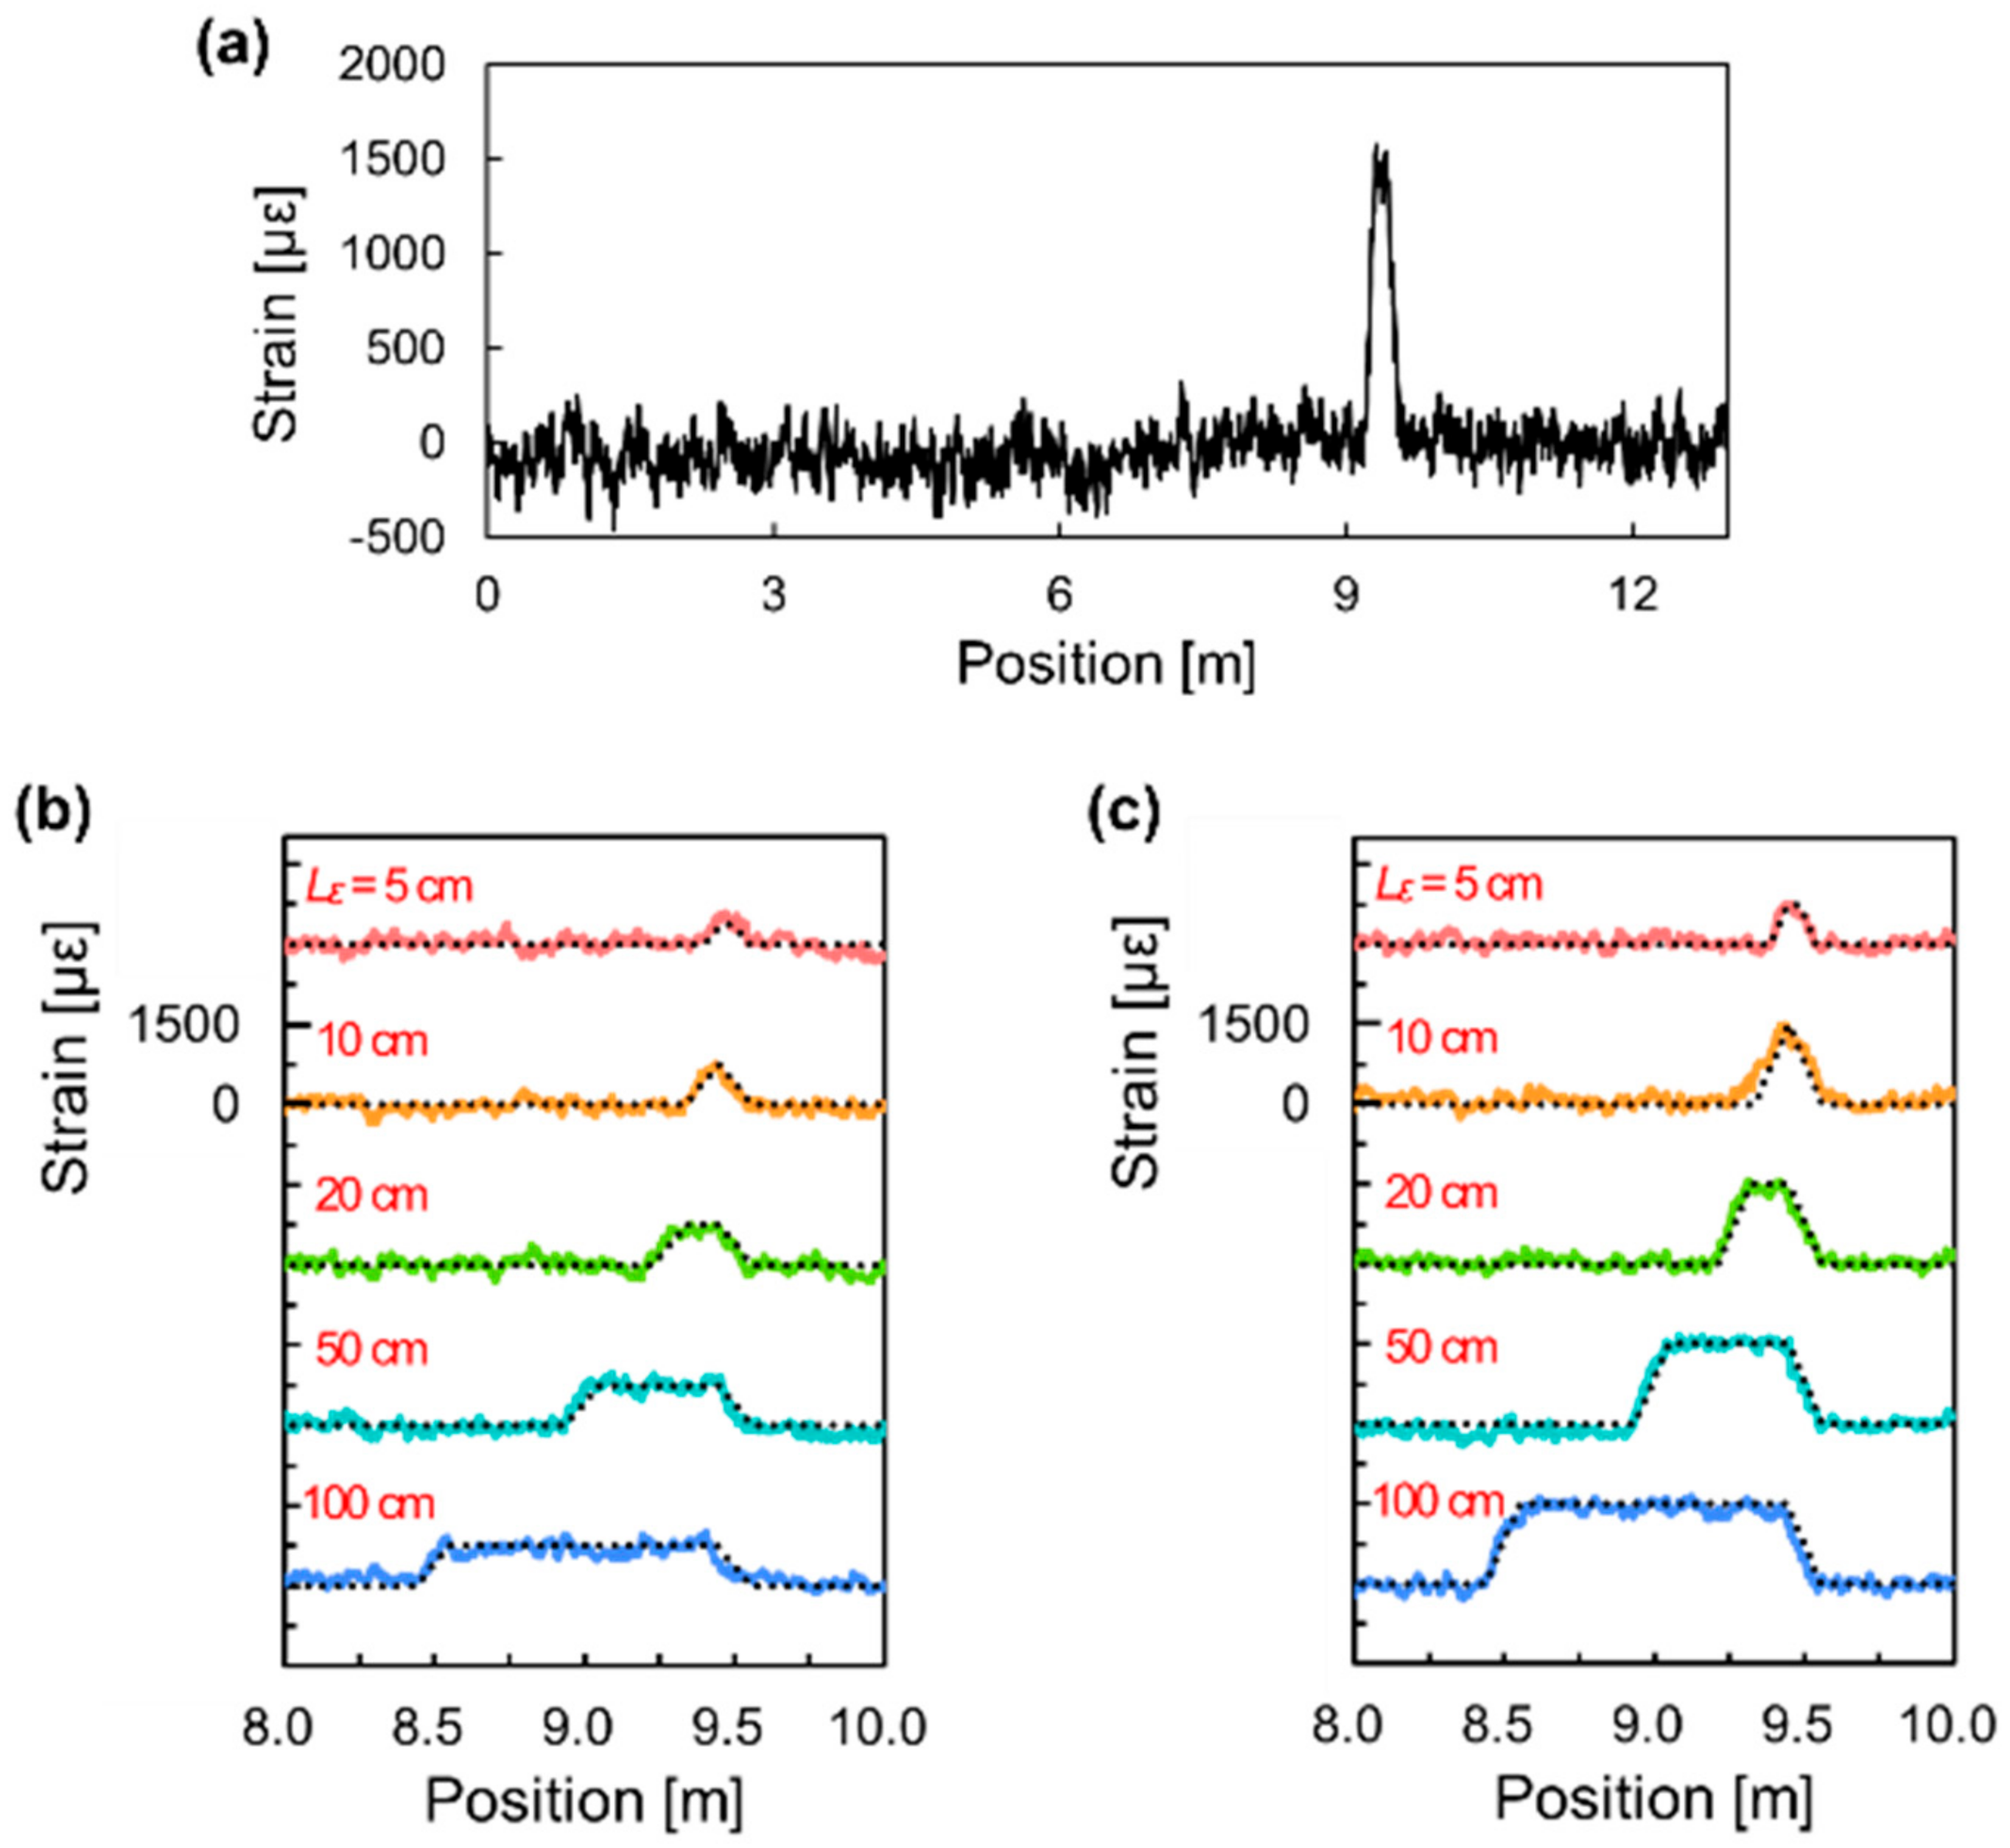
First, we present the experimental results with a relatively high spatial resolution (9.5 cm). An example of the measured power change distribution (converted into strain) along the whole length of the FUT (with a 1500 µε strain applied to a 20-cm-long section) is shown in Figure 11a. At this scale, it appears that the correct amount of strain was detected at the correct location. The strain distributions measured when strains of 750 µε and 1500 µε were applied (magnified views around the strained sections), simply deduced from the power-change distributions based on the linear power-to-strain relationship, are shown in Figure 11b,c, respectively. Each distribution is shifted by 3000 µε, and the simulated data are indicated by dotted lines. The trends in the measured distributions agree well with the simulation results, including the case where the strained section is half the nominal spatial resolution. This indicates that our relatively rough simulation is almost sufficient to predict the experimental results, which is beneficial from the viewpoint of simulation cost.
We then performed similar experiments with a relatively low spatial resolution (19.6 cm) to evaluate the beyond-nominal-resolution effect. The magnified views of the strain distributions (simply deduced from the power-change distributions), measured when a strain of 1500 µε was applied, are shown in Figure 12. As the strained section becomes shorter, the maximal power-change shift becomes smaller. The trend in the measured distributions is basically in good agreement with the simulation results. As the strained section is shortened further, the signal is buried by the noise. The standard deviation of the noise floor (power fluctuations corresponding to the strain of the non-strained sections) was calculated to be approximately 130 με in this measurement. This amount is theoretically obtained as the maximal strain when the strained section is 1.7 cm, which could be regarded as the shortest detectable length. Note that this value is influenced by various experimental parameters such as the amount of the actual strain, the number of averaging, the incident power, etc., the details of which are described in the following subsection.
4.3. Detection of Extremely Short Hot Spots
Here, we performed more detailed characterization of the beyond-nominal-resolution effect of slope-assisted BOCDR. First, using a silica SMF, we found that a strained section which is over 50 times shorter than the nominal spatial resolution can be detected. Then, we showed the usefulness of the beyond-nominal-resolution effect by detecting a 2-mm-long strained section along a silica SMF and a 5-mm-long heated section along a POF. These values are smaller than the world records previously reported, which are 3 mm [66] and 100 mm [67] for a silica SMF and a POF, respectively.
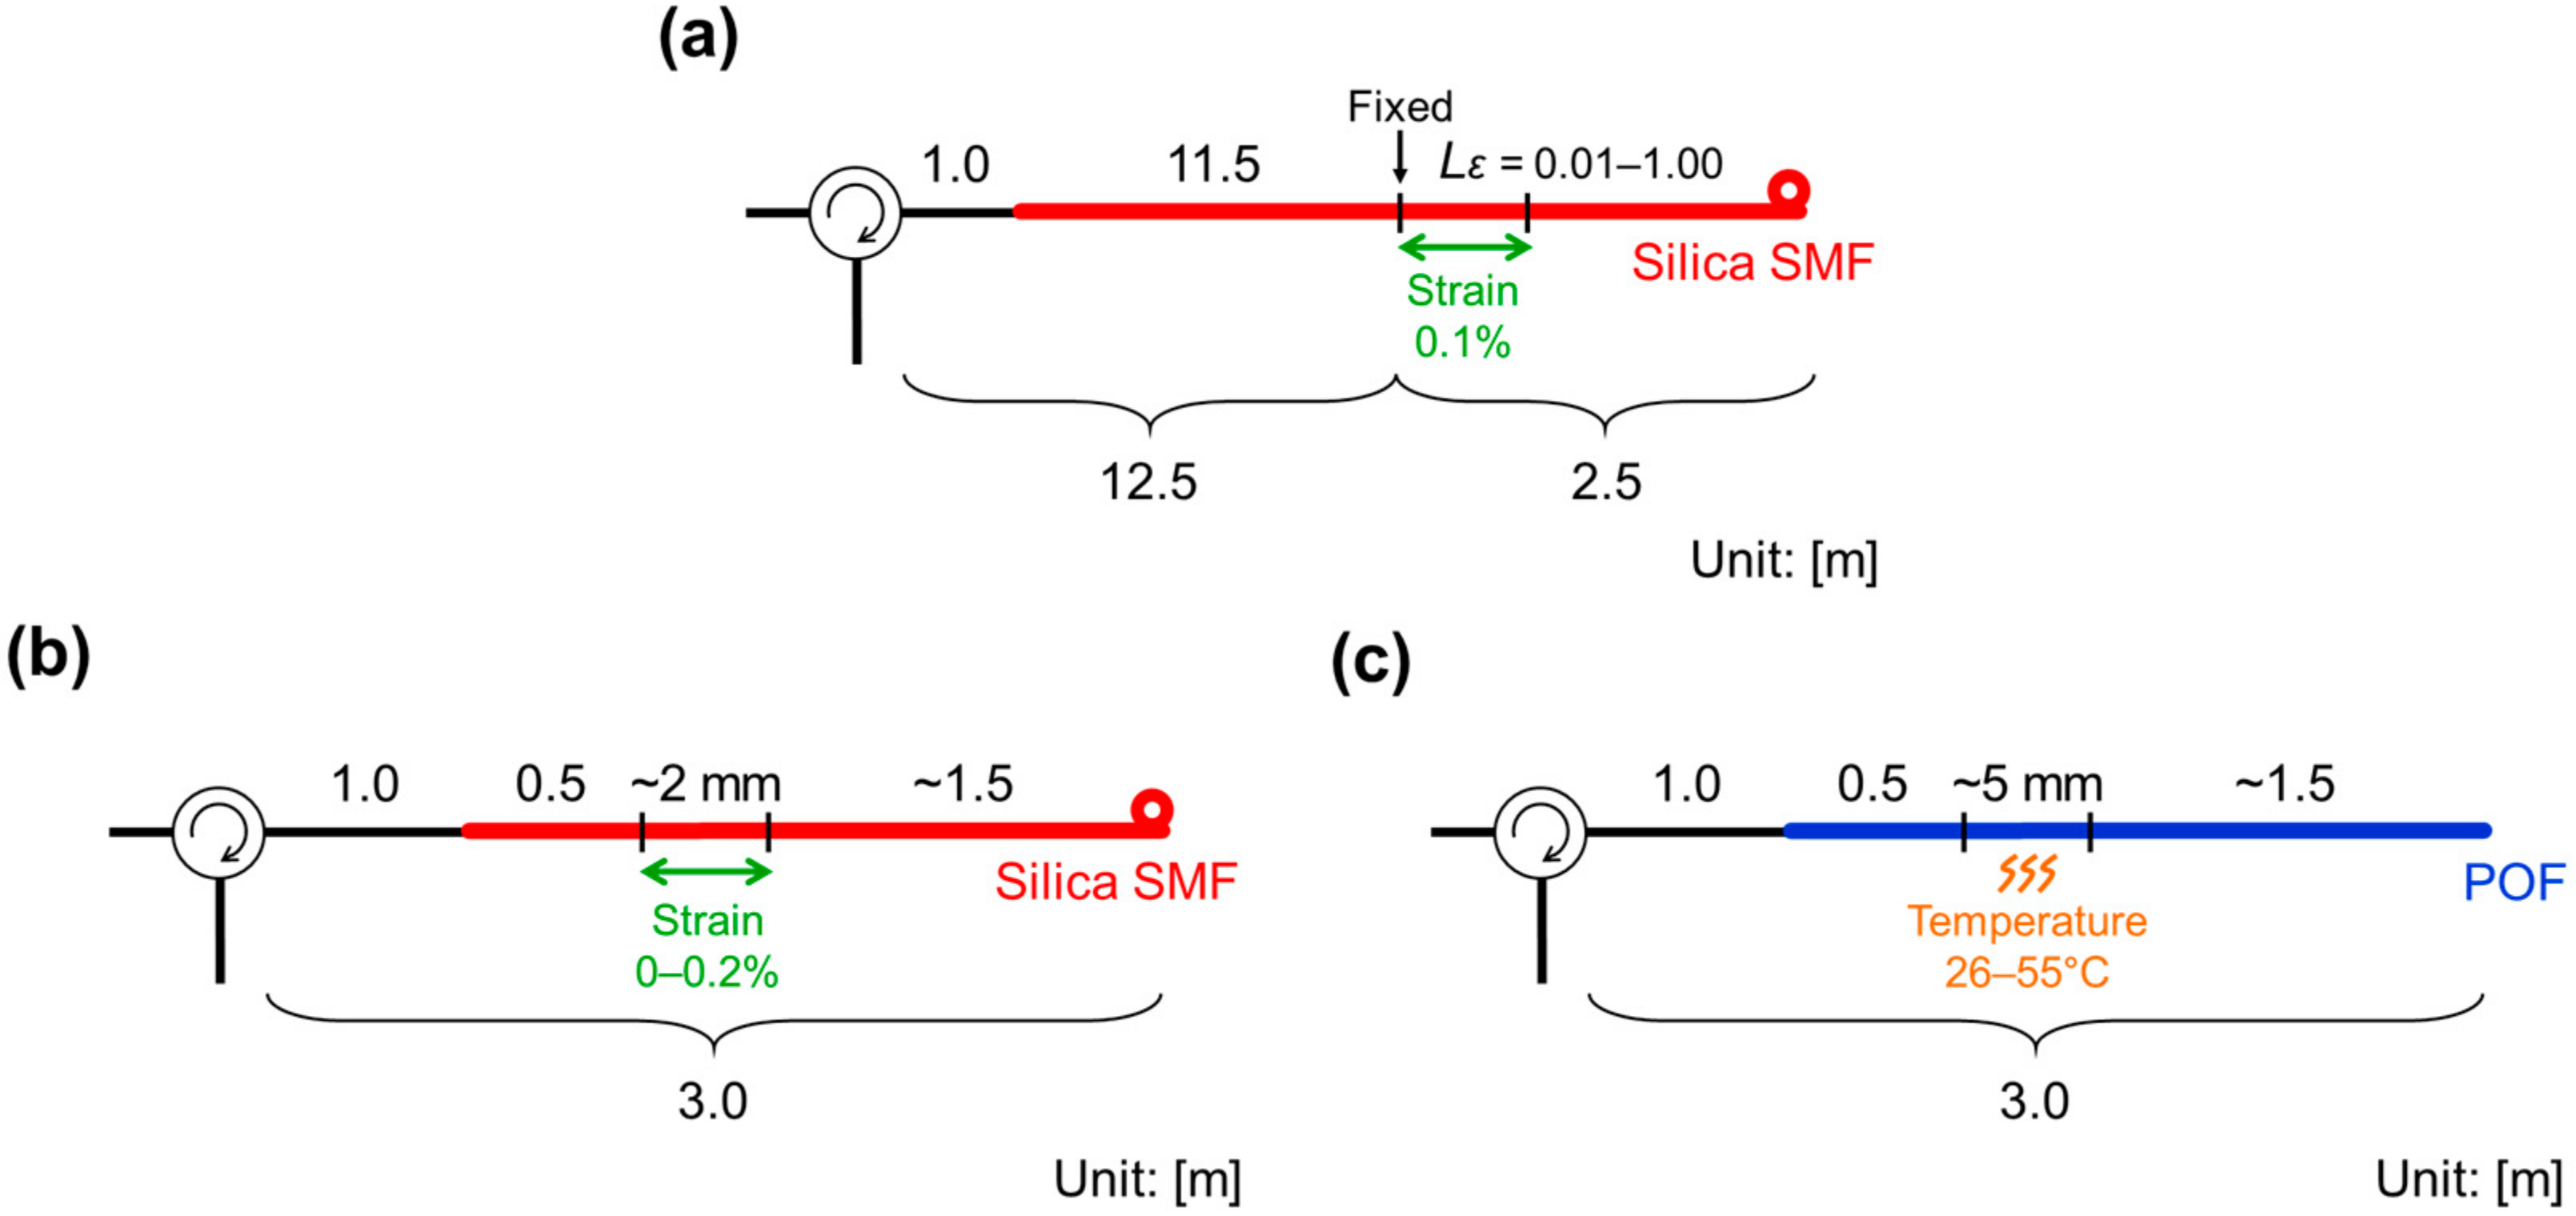
First, to characterize the beyond-nominal-resolution effect, we employed a 14.0-m-long silica SMF as an FUT. The output light from a laser was amplified to ~25 dBm using an EDFA and injected into the FUT. The BFS of the FUT was 10.89 GHz at 1.55 μm at 26 °C (room temperature). The open end of the FUT was bent to suppress the Fresnel reflection. The spectral power-change at 10.87 GHz (determined by differentiating the BGS) was monitored using an OSC. The modulation amplitude Δf and the modulation frequency fm were set to 0.19 GHz and 5.10–5.26 MHz, respectively, leading to the nominal spatial resolution of 1.01 m and the measurement range of 20.1 m. A strain of 0.1% was applied to 0.01-, 0.02-, 0.05-, 0.10-, 0.20-, 0.50-, and 1.00-m-long sections of the FUT, as shown in Figure 13a. When the length of the strained section was changed, the position of its proximal end was fixed. Averaging was performed 512 times on the OSC.
Subsequently, exploiting the beyond-nominal-resolution effect, we attempted to detect the shortest-ever strained and heated sections along a silica SMF and a POF. In this experiment, we injected ~28 dBm light to the FUTs to enhance the measurement sensitivity, and averaging was performed 1024 times. To begin with, we employed a 2.0-m-long silica SMF as an FUT, the BFS of which was 10.85 GHz at room temperature. We applied strains of 0.10, 0.15, and 0.20% to a 2-mm-long section (~55 times shorter than the nominal spatial resolution; see below), as depicted in Figure 13b. The nominal spatial resolution and the measurement range were 0.11 m and 7.64 m (Δf: 0.67 GHz; fm: 13.45–13.54 MHz), respectively. The change in the spectral power at 10.84 GHz was observed using the OSC. Then, a 2.0-m-long perfluorinated graded-index POF [39,68,69] (core diameter: 50 μm; propagation loss at 1.55 μm: 0.25 dB/m; BFS at room temperature: 2.75 GHz) was used as an FUT. A 5-mm-long section was heated to 35, 45, and 55 °C (see Figure 13c). The modulation amplitude Δf and the modulation frequency fm were set to 0.69 GHz and 24.70–24.84 MHz, respectively, resulting in the nominal spatial resolution of 0.21 m and the measurement range of 4.5 m. Note that the length of the heated section was over 40 times shorter than the nominal spatial resolution. The change in the spectral power at 2.78 GHz was monitored.
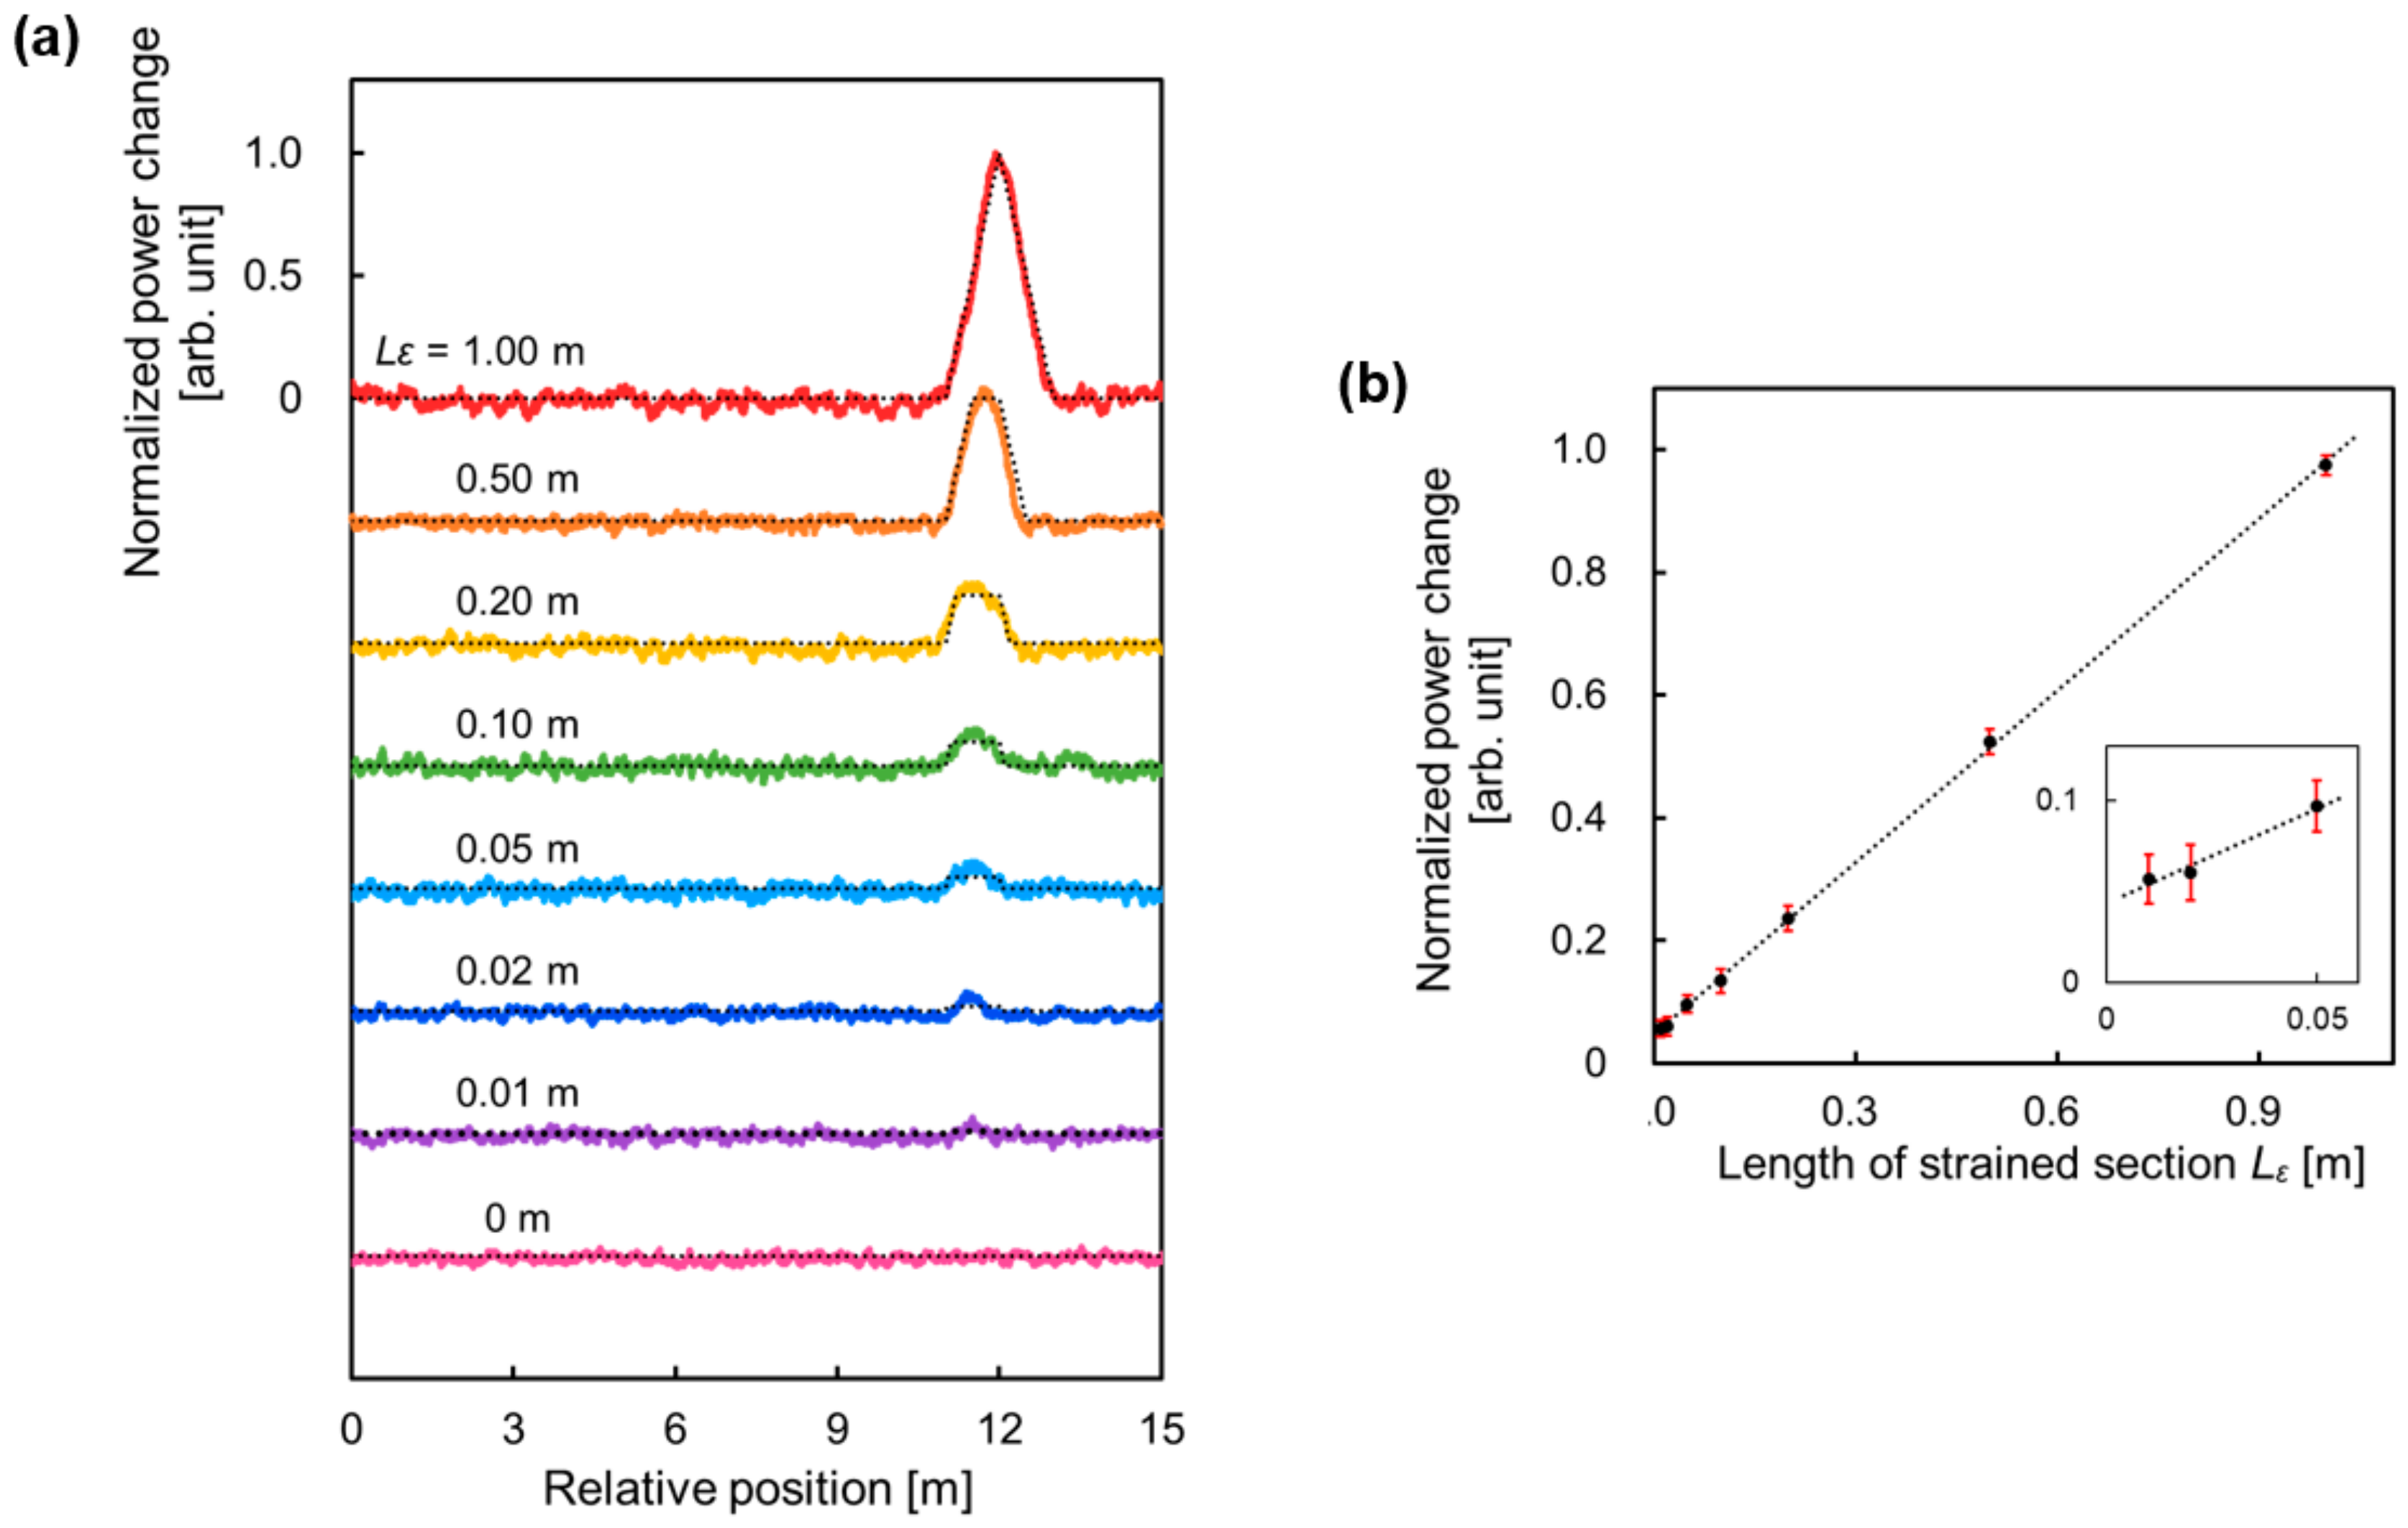
The power-change distributions measured when the length of the strained section Lε was reduced from 1.00 m to 0.01 m are shown in Figure 14a. Note that the nominal spatial resolution was 1.01 m throughout the measurement. The vertical axis was normalized so that the maximal power-change became 1 when Lε was 1.00 m. Each distribution was displayed with a vertical interval of 0.5. When Lε was 1.00 m, the power-change distribution showed a triangular shape. As Lε decreased, the maximal power-change also decreased. When Lε was 0.02 m, the power-change was still clearly detected, but it became almost comparable to the signal fluctuations when Lε was 0.01 m. Thus, in this experimental condition, a strained section, which was over 50 times shorter than the nominal spatial resolution, was shown to be detectable. Figure 14b shows the normalized maximal power-change plotted as a function of Lε. The error bars were standard deviations of the signal fluctuations at non-strained sections. The maximal power-change decreased almost linearly with decreasing Lε, which agrees well with the theory. The observed length of non-zero-power-change section was almost equal to the sum of the strained length Lε and the nominal spatial resolution, which also agrees with the theory.
Finally, exploiting the beyond-nominal-resolution effect verified above, we attempted to detect the shortest-ever strained and heated sections along a silica SMF and a POF. Figure 15a shows the normalized power-change distributions measured when the strain of 0.10, 0.15, and 0.20% were applied to a 2-mm-long section of the silica SMF. The local power-changes corresponding to the strain were observed at the correct position. The lengths of the power-changed sections appeared to be much longer than 2 mm; in theory, they should be almost the same as the nominal resolution (0.11 m), which moderately agrees with the measured results. The maximal normalized power-change of each distribution in Figure 15a was plotted as a function of applied strain in Figure 15b. With increasing strain, the power-change also increased almost linearly, which indicated the magnitude of the strain can be correctly measured in this strain range. Then, we performed a similar experiment using the POF. The normalized power-change distributions measured when the 5-mm-long section was heated to 26 (room temperature), 35, 45, and 55 °C are shown in Figure 16a. The abrupt power-changes were observed at the correct position along the POF. The lengths of the power-changed sections moderately agreed with the nominal resolution (0.21 m). The magnitude of the maximal power-change was in proportion to the temperature change, as shown in Figure 16b, indicating the potential feasibility of distributed temperature sensing.
4.4. Other Achievements
In addition to the detection of the extremely short hot spots using the beyond-nominal-resolution effect, a number of remarkable advances have been made in the slope-assisted BOCDR. First, by analyzing the BGS shape, the measurement sensitivity dependencies on the incident power and the spatial resolution were investigated [70]. The sensitivity was shown to be enhanced with higher incident power and/or lower spatial resolution; this result was verified through distributed temperature measurements. Then, we implemented slope-assisted BOCDR using a high-loss POF [71]. Owing to the gradual reduction in the transmitted power along the POF, the measurement sensitivities were found to depend on the sensing position. This unique effect was investigated experimentally, and a correct POF-based distributed measurement was performed by compensating this effect. We also demonstrated loss-insensitive operation by employing a special silica fiber with low bending loss [72]. We measured the coefficients of the power-change dependencies on strain and temperature, and by comparing the distributed strain and temperature measurement results using a standard silica fiber and the special fiber, showed that this configuration offers highly stable loss-insensitive operation. Another advance was made from a more practical viewpoint; we presented an example of diagnosis using a composite structure with carbon fiber-reinforced plastics [73]. A silica SMF was embedded in this composite structure during a vacuum-assisted resin transfer molding process. When the composite structure was bent, the system output agreed well with the actual compressive and tensile strain distributions. We were also able to detect the breakage of the embedded fiber, which indicated that the slope-assisted system is potentially beneficial for structural health monitoring. In addition, very recent advances include the enhancement of the stability and strain sensitivity using polarization-maintaining fibers [74] and the demonstration of the beyond-nominal-resolution effect with a long measurement range of over 10 km.
5. Conclusions
We reviewed the BOCDR technology from the basic principle to the recent advances. In Section 1, a variety of Brillouin-based distributed sensing techniques including BOCDR and BOTDA were introduced. In Section 2, the basic operating principle of BOCDR was presented. In Section 3, some configurations for improving the performance of BOCDR were described. In Section 4, the slope-assisted BOCDR was detailed; the operating principle and some unique features including the beyond-nominal-resolution effect were presented. Thus, significant technical advances have been achieved to enhance the performance of BOCDR. However, there still remain some important issues to be tackled. One unclarified point of this system is the measurement accuracy, which should be in a trade-off relationship with some parameters such as an average count (or measurement time), spatial resolution, incident optical power, etc. Full investigation of the measurement accuracy is extremely important in order for users to judge whether BOCDR can be employed or not for their purposes. Another point is the clarification of the maximal sampling rate, which is currently limited by the electronic devices used in the setup (in any configuration of BOCDR). The measurement instability caused by the power fluctuations is also a problem in the slope-assisted configuration, which could be mitigated using the ratio between the spectral powers at two frequencies; this push-pull scheme will provide another configuration for loss-insensitive operation. In addition, the dynamic range of slope-assisted BOCDR currently limited by the BGS shape could be extended by low-pass filtering the spectrum (at the cost of the sensitivity). Brillouin-based distributed sensing is, in general, constantly confronted with a problem of discriminative sensing of strain and temperature, and BOCDR is no exception. Combined use of some other sensing mechanisms [75,76,77,78,79,80,81,82,83,84] will be necessary. Finally, the current setup is not suitable for field tests outside the laboratory. The system portability should be improved by implementing the functions of the relatively large devices, such as the ESA, the EDFAs, the PSCR, and the frequency-modulated laser, using local electronic circuits and/or module-type devices. These replacements will also lead to reduction in the system cost. We hope that BOCDR will, in the near future, serve as one of the most promising Brillouin-based distributed sensing techniques for practical applications because of its single-end accessibility and many other advantages.
Author Contributions
Y.M. and H.L. performed the experiments, and Y.M., H.L. and K.N. analyzed the data. Y.M. wrote the review paper.
Funding
This work was supported in part by JSPS KAKENHI (17H04930, 17J07226) and the research grants from the Japan Gas Association, the ESPEC Foundation for Global Environment Research and Technology, the Association for Disaster Prevention Research, the Fujikura Foundation, and the Japan Association for Chemical Innovation.
Acknowledgments
The authors are indebted to Kazuo Hotate, the Toyota Technological Institute (formerly, the University of Tokyo), Japan, for his insightful comments and suggestions regarding the future prospects of BOCDR.
Conflicts of Interest
The authors declare no conflicts of interest.
References
- Agrawal, G.P. Nonlinear Fiber Optics, 4th ed.; Academic Press: San Diego, CA, USA, 1995; pp. 329–367. [Google Scholar]
- Ippen, E.P.; Stolen, R.H. Stimulated Brillouin scattering in optical fibers. Appl. Phys. Lett. 1972, 21, 539–541. [Google Scholar] [CrossRef]
- Horiguchi, T.; Kurashima, T.; Tateda, M. Tensile strain dependence of Brillouin frequency shift in silica optical fibers. IEEE Photonics Technol. Lett. 1989, 1, 107–109. [Google Scholar] [CrossRef]
- Kurashima, T.; Horiguchi, T.; Tateda, M. Thermal effects on the Brillouin frequency shift in jacketed optical silica fibers. Appl. Opt. 1990, 29, 2219–2222. [Google Scholar] [CrossRef] [PubMed]
- Horiguchi, T.; Tateda, M. BOTDA—Nondestructive measurement of single-mode optical fiber attenuation characteristics using Brillouin interaction: Theory. J. Lightw. Technol. 1989, 7, 1170–1176. [Google Scholar] [CrossRef]
- Kurashima, T.; Horiguchi, T.; Izumita, H.; Furukawa, S.; Koyamada, Y. Brillouin optical-fiber time domain reflectometry. IEICE Trans. Commun. 1993, E76-B, 382–390. [Google Scholar]
- Fellay, A.; Thévenaz, L.; Facchini, M.; Niklès, M.; Robert, P. Distributed sensing using stimulated Brillouin scattering: Towards ultimate resolution. In Proceedings of the 12th International Conference on Optical Fiber Sensors (OFS-12), Williamsburg, VA, USA, 28–31 October 1997. [Google Scholar]
- Alahbabi, M.N.; Cho, Y.T.; Newson, T.P. 100 km distributed temperature sensor based on coherent detection of spontaneous Brillouin backscatter. Meas. Sci. Technol. 2004, 15, 1544–1547. [Google Scholar] [CrossRef] [Green Version]
- Koyamada, Y.; Sakairi, Y.; Takeuchi, N.; Adachi, S. Novel technique to improve spatial resolution in Brillouin optical time-domain reflectometry. IEEE Photonics Technol. Lett. 2007, 19, 1910–1912. [Google Scholar] [CrossRef]
- Wang, F.; Zhu, C.; Cao, C.; Zhang, X. Enhancing the performance of BOTDR based on the combination of FFT technique and complementary coding. Opt. Express 2017, 25, 3504–3513. [Google Scholar] [CrossRef] [PubMed]
- Koizumi, K.; Kanda, Y.; Fujii, A.; Murai, H. High-speed distributed strain measurement using Brillouin optical time-domain reflectometry based-on self-delayed heterodyne detection. In Proceedings of the 41st European Conference on Optical Communication (ECOC2015), Valencia, Spain, 27 September–1 October 2015. [Google Scholar]
- Jia, X.H.; Rao, Y.J.; Chang, L.; Zhang, C.; Ran, Z.L. Enhanced sensing performance in long distance Brillouin optical time-domain analyzer based on Raman amplification: Theoretical and experimental investigation. J. Lightw. Technol. 2010, 28, 1624–1630. [Google Scholar]
- Zhou, D.; Dong, Y.; Wang, B.; Pang, C.; Ba, D.; Zhang, H.; Lu, Z.; Li, H.; Bao, X. Single-shot BOTDA based on an optical chirp chain probe wave for distributed ultrafast measurement. Light Sci. Appl. 2018, 7, 32. [Google Scholar] [CrossRef]
- Kito, C.; Takahashi, H.; Toge, K.; Manabe, T. Dynamic strain measurement of 10-km fiber with frequency-swept pulsed BOTDA. J. Lightw. Technol. 2017, 35, 1738–1743. [Google Scholar] [CrossRef]
- Soto, M.A.; Ramírez, J.A.; Thévenaz, L. Intensifying the response of distributed optical fibre sensors using 2D and 3D image restoration. Nature Commun. 2016, 7, 10870. [Google Scholar] [CrossRef] [PubMed] [Green Version]
- Dong, Y.; Zhang, H.; Chen, L.; Bao, X. 2 cm spatial-resolution and 2 km range Brillouin optical fiber sensor using a transient differential pulse pair. Appl. Opt. 2012, 51, 1229–1235. [Google Scholar] [CrossRef] [PubMed]
- Azad, A.K.; Wang, L.; Guo, N.; Tam, H.Y.; Lu, C. Signal processing using artificial neural network for BOTDA sensor system. Opt. Express 2016, 24, 6769–6782. [Google Scholar] [CrossRef] [PubMed]
- Motil, A.; Davidi, R.; Hadar, R.; Tur, M. Mitigating the effects of the gain-dependence of the Brillouin line-shape on dynamic BOTDA sensing methods. Opt. Express 2017, 25, 22206–22218. [Google Scholar] [CrossRef] [PubMed]
- Marini, D.; Iuliano, M.; Bastianini, F.; Bolognini, G. BOTDA sensing employing a modified Brillouin fiber laser probe source. J. Lightw. Technol. 2018, 36, 1131–1137. [Google Scholar] [CrossRef]
- Zhou, D.; Dong, Y.; Wang, B.; Jiang, T.; Ba, D.; Xu, P.; Zhang, H.; Lu, Z.; Li, H. Slope-assisted BOTDA based on vector SBS and frequency-agile technique for wide-strain-range dynamic measurements. Opt. Express 2017, 25, 1889–1902. [Google Scholar] [CrossRef] [PubMed]
- Garus, D.; Krebber, K.; Schliep, F.; Gogolla, T. Distributed sensing technique based on Brillouin optical-fiber frequency-domain analysis. Opt. Lett. 1996, 21, 1402–1404. [Google Scholar] [CrossRef] [PubMed]
- Zeni, L.; Catalano, E.; Coscetta, A.; Minardo, A. High-pass filtering for accurate reconstruction of the Brillouin frequency shift profile from Brillouin optical frequency domain analysis data. IEEE Sens. J. 2018, 18, 185–192. [Google Scholar] [CrossRef]
- Kapa, T.; Schreier, A.; Krebber, K. 63 km BOFDA for temperature and strain monitoring. Sensors 2018, 18, 1600. [Google Scholar] [CrossRef] [PubMed]
- Minardo, A.; Bernini, R.; Ruiz-Lombera, R.; Mirapeix, J.; Lopez-Higuera, J.M. Proposal of Brillouin optical frequency-domain reflectometry (BOFDR). Opt. Express 2016, 24, 29994–30001. [Google Scholar] [CrossRef] [PubMed]
- Hotate, K.; Hasegawa, T. Measurement of Brillouin gain spectrum distribution along an optical fiber using a correlation-based technique—Proposal, experiment and simulation. IEICE Trans. Electron. 2000, E83-C, 405–412. [Google Scholar]
- Song, K.Y.; Kishi, M.; He, Z.; Hotate, K. High-repetition-rate distributed Brillouin sensor based on optical correlation-domain analysis with differential frequency modulation. Opt. Lett. 2011, 36, 2062–2064. [Google Scholar] [CrossRef] [PubMed]
- Zhang, C.; Kishi, M.; Hotate, K. 5,000 points/s high-speed random accessibility for dynamic strain measurement at arbitrary multiple points along a fiber by Brillouin optical correlation domain analysis. Appl. Phys. Express 2015, 8, 042501. [Google Scholar] [CrossRef]
- Wang, B.; Fan, X.; Fu, Y.; He, Z. Dynamic strain measurement with kHz-level repetition rate and centimeter-level spatial resolution based on Brillouin optical correlation domain analysis. Opt. Express 2018, 26, 6916–6928. [Google Scholar] [CrossRef] [PubMed]
- Zou, W.; Jin, C.; Chen, J. Distributed strain sensing based on combination of Brillouin gain and loss effects in Brillouin optical correlation domain analysis. Appl. Phys. Express 2012, 5, 082503. [Google Scholar] [CrossRef]
- Ryu, G.; Kim, G.; Song, K.Y.; Lee, S.B.; Lee, K. Brillouin optical correlation-domain analysis enhanced by time-domain data processing for concurrent interrogation of multiple sensing points. J. Lightw. Technol. 2017, 35, 5311–5316. [Google Scholar] [CrossRef]
- Denisov, A.; Soto, M.A.; Thévenaz, L. Going beyond 1000000 resolved points in a Brillouin distributed fiber sensor: Theoretical analysis and experimental demonstration. Light Sci. Appl. 2016, 5, e16074. [Google Scholar] [CrossRef] [PubMed]
- London, Y.; Antman, Y.; Preter, E.; Levanon, N.; Zadok, A. Brillouin optical correlation domain analysis addressing 440,000 resolution points. J. Lightw.Technol. 2016, 34, 4421–4429. [Google Scholar] [CrossRef]
- López-Gil, A.; Martin-Lopez, S.; Gonzalez-Herraez, M. Phase-measuring time-gated BOCDA. Opt. Lett. 2017, 42, 3924–3927. [Google Scholar] [CrossRef] [PubMed]
- Zhang, J.; Zhang, M.; Zhang, M.; Liu, Y.; Feng, C.; Wang, Y.; Wang, Y. Chaotic Brillouin optical correlation-domain analysis. Opt. Lett. 2018, 43, 1722–1725. [Google Scholar] [CrossRef] [PubMed] [Green Version]
- Preter, E.; Ba, D.; London, Y.; Shlomi, O.; Antman, Y.; Zadok, A. High-resolution Brillouin optical correlation domain analysis with no spectral scanning. Opt. Express 2016, 24, 27253–27267. [Google Scholar] [CrossRef] [PubMed]
- Mizuno, Y.; Zou, W.; He, Z.; Hotate, K. Proposal of Brillouin optical correlation-domain reflectometry (BOCDR). Opt. Express 2008, 16, 12148–12153. [Google Scholar] [CrossRef] [PubMed]
- Mizuno, Y.; Zou, W.; He, Z.; Hotate, K. Operation of Brillouin optical correlation-domain reflectometry: Theoretical analysis and experimental validation. J. Lightw. Technol. 2010, 28, 3300–3306. [Google Scholar] [CrossRef]
- Mizuno, Y.; He, Z.; Hotate, K. Distributed strain measurement using a tellurite glass fiber with Brillouin optical correlation-domain reflectometry. Opt. Commun. 2010, 283, 2438–2441. [Google Scholar] [CrossRef]
- Mizuno, Y.; Nakamura, K. Potential of Brillouin scattering in polymer optical fiber for strain-insensitive high-accuracy temperature sensing. Opt. Lett. 2010, 35, 3985–3987. [Google Scholar] [CrossRef] [PubMed]
- Mizuno, Y.; Hayashi, N.; Nakamura, K. Opto-Mechanical Fiber Optic Sensors, 1st ed.; Butterworth-Heinemann: Oxford, UK, 2018; pp. 97–135. [Google Scholar]
- Mizuno, Y.; He, Z.; Hotate, K. Dependence of the Brillouin frequency shift on temperature in a tellurite glass fiber and a bismuth-oxide highly-nonlinear fiber. Appl. Phys. Express 2009, 2, 112402. [Google Scholar] [CrossRef]
- Mizuno, Y.; He, Z.; Hotate, K. Measurement range enlargement in Brillouin optical correlation-domain reflectometry based on temporal gating scheme. Opt. Express 2009, 17, 9040–9046. [Google Scholar] [CrossRef] [PubMed]
- Mizuno, Y.; He, Z.; Hotate, K. Measurement range enlargement in Brillouin optical correlation-domain reflectometry based on double-modulation scheme. Opt. Express 2010, 18, 5926–5933. [Google Scholar] [CrossRef] [PubMed]
- Mizuno, Y.; He, Z.; Hotate, K. Polarization beat length distribution measurement in single-mode optical fibers with Brillouin optical correlation-domain reflectometry. Appl. Phys. Express 2009, 2, 046502. [Google Scholar] [CrossRef]
- Mizuno, Y.; He, Z.; Hotate, K. Stable entire-length measurement of fiber strain distribution by Brillouin optical correlation-domain reflectometry with polarization scrambling and noise-floor compensation. Appl. Phys. Express 2009, 2, 062403. [Google Scholar] [CrossRef]
- Hayashi, N.; Minakawa, K.; Mizuno, Y.; Nakamura, K. Polarization scrambling in Brillouin optical correlation-domain reflectometry using polymer fibers. Appl. Phys. Express 2015, 8, 062501. [Google Scholar] [CrossRef]
- Mizuno, Y.; He, Z.; Hotate, K. Dependence of the Brillouin frequency shift on temperature in a tellurite glass fiber and a bismuth-oxide highly-nonlinear fiber. Appl. Phys. Express 2009, 2, 112402. [Google Scholar] [CrossRef]
- Hayashi, N.; Mizuno, Y.; Nakamura, K. Distributed Brillouin sensing with centimeter-order spatial resolution in polymer optical fibers. J. Lightw. Technol. 2014, 32, 3999–4003. [Google Scholar] [CrossRef]
- Hayashi, N.; Mizuno, Y.; Nakamura, K. Suppression of ghost correlation peak in Brillouin optical correlation-domain reflectometry. Appl. Phys. Express 2014, 7, 112501. [Google Scholar] [CrossRef]
- Hayashi, N.; Mizuno, Y.; Nakamura, K. Simplified configuration of Brillouin optical correlation-domain reflectometry. IEEE Photonics J. 2014, 6, 6802807. [Google Scholar] [CrossRef]
- Hayashi, N.; Mizuno, Y.; Nakamura, K. Alternative implementation of simplified Brillouin optical correlation-domain reflectometry. IEEE Photonics J. 2014, 6, 6803108. [Google Scholar] [CrossRef]
- Hayashi, N.; Mizuno, Y.; Nakamura, K. Simplified Brillouin optical correlation-domain reflectometry using polymer optical fiber. IEEE Photonics J. 2015, 7, 6800407. [Google Scholar] [CrossRef]
- Manotham, S.; Kishi, M.; He, Z.; Hotate, K. 1-cm spatial resolution with large dynamic range in strain distributed sensing by Brillouin optical correlation domain reflectometry based on intensity modulation. Proc. SPIE 2012, 8351, 835136. [Google Scholar]
- Yao, Y.; Kishi, M.; Hotate, K. Brillouin optical correlation domain reflectometry with lock-in detection scheme. Appl. Phys. Express 2016, 9, 072501. [Google Scholar] [CrossRef]
- Mizuno, Y.; Zou, W.; He, Z.; Hotate, K. One-end-access high-speed distributed strain measurement with 13-mm spatial resolution based on Brillouin optical correlation-domain reflectometry. IEEE Photonics Technol. Lett. 2009, 21, 474–476. [Google Scholar] [CrossRef]
- Mizuno, Y.; Hayashi, N.; Fukuda, H.; Song, K.Y.; Nakamura, K. Ultrahigh-speed distributed Brillouin reflectometry. Light Sci. Appl. 2016, 5, e16184. [Google Scholar] [CrossRef] [PubMed]
- Mizuno, Y.; Hayashi, N.; Fukuda, H.; Nakamura, K. Single-end-access distributed strain sensing with wide dynamic range using higher-speed Brillouin optical correlation-domain reflectometry. Jpn. J. Appl. Phys. 2017, 56, 072501. [Google Scholar] [CrossRef]
- Mizuno, Y.; Hayashi, N.; Fukuda, H.; Nakamura, K. Phase-detected Brillouin optical correlation-domain reflectometry. Opt. Rev. 2018, 25, 473–485. [Google Scholar] [CrossRef]
- Lee, H.; Hayashi, N.; Mizuno, Y.; Nakamura, K. Slope-assisted Brillouin optical correlation-domain reflectometry: Proof of concept. IEEE Photonics J. 2016, 8, 6802807. [Google Scholar] [CrossRef]
- Lee, H.; Hayashi, N.; Mizuno, Y.; Nakamura, K. Operation of slope-assisted Brillouin optical correlation-domain reflectometry: Comparison of system output with actual frequency shift distribution. Opt. Express 2016, 24, 29190–29197. [Google Scholar] [CrossRef] [PubMed]
- Lee, H.; Mizuno, Y.; Nakamura, K. Detection of 2-mm-long strained section in silica fiber using slope-assisted Brillouin optical correlation-domain reflectometry. Jpn. J. Appl. Phys. 2018, 57, 020303. [Google Scholar] [CrossRef]
- Peled, Y.; Motil, A.; Yaron, L.; Tur, M. Slope-assisted fast distributed sensing in optical fibers with arbitrary Brillouin profile. Opt. Express 2011, 19, 19845–19854. [Google Scholar] [CrossRef] [PubMed]
- Tu, X.; Luo, H.; Sun, Q.; Hu, X.; Meng, Z. Performance analysis of slope-assisted dynamic BOTDA based on Brillouin gain or phase-shift in optical fibers. J. Opt. 2015, 17, 105503. [Google Scholar] [CrossRef]
- Minardo, A.; Coscetta, A.; Bernini, R.; Zeni, L. Heterodyne slope-assisted Brillouin optical time-domain analysis for dynamic strain measurements. J. Opt. 2016, 18, 025606. [Google Scholar] [CrossRef]
- Song, K.Y.; He, Z.; Hotate, K. Effects of intensity modulation of light source on Brillouin optical correlation domain analysis. J. Lightw. Technol. 2007, 25, 1238–1246. [Google Scholar] [CrossRef]
- Song, K.Y.; He, Z.; Hotate, K. Distributed strain measurement with millimeter-order spatial resolution based on Brillouin optical correlation domain analysis. Opt. Lett. 2006, 31, 2526–2528. [Google Scholar] [CrossRef] [PubMed]
- Hayashi, N.; Mizuno, Y.; Nakamura, K. Distributed Brillouin sensing with centimeter-order spatial resolution in polymer optical fibers. J. Lightw. Technol. 2014, 32, 3999–4003. [Google Scholar] [CrossRef]
- Koike, Y.; Asai, M. The future of plastic optical fiber. NPG Asia Mater. 2009, 1, 22–28. [Google Scholar] [CrossRef] [Green Version]
- Mizuno, Y.; Nakamura, K. Experimental study of Brillouin scattering in perfluorinated polymer optical fiber at telecommunication wavelength. Appl. Phys. Lett. 2010, 97, 021103. [Google Scholar] [CrossRef]
- Lee, H.; Mizuno, Y.; Nakamura, K. Measurement sensitivity dependencies on incident power and spatial resolution in slope-assisted Brillouin optical correlation-domain reflectometry. Sens. Actuat. A Phys. 2017, 268, 68–71. [Google Scholar] [CrossRef]
- Lee, H.; Hayashi, N.; Mizuno, Y.; Nakamura, K. Slope-assisted Brillouin optical correlation-domain reflectometry using polymer optical fibers with high propagation loss. J. Lightw. Technol. 2017, 35, 2306–2310. [Google Scholar] [CrossRef]
- Lee, H.; Ma, T.; Mizuno, Y.; Nakamura, K. Bending-loss-independent operation of slope-assisted Brillouin optical correlation-domain reflectometry. Sci. Rep. 2018, 8, 7844. [Google Scholar] [CrossRef] [PubMed]
- Lee, H.; Ochi, Y.; Matsui, T.; Matsumoto, Y.; Tanaka, Y.; Nakamura, H.; Mizuno, Y.; Nakamura, K. Distributed strain measurement and possible breakage detection of optical-fiber-embedded composite structure using slope-assisted Brillouin optical correlation-domain reflectometry. Appl. Phys. Express 2018, 11, 072501. [Google Scholar] [CrossRef]
- Lee, H.; Mizuno, Y.; Nakamura, K. Highly sensitive slope-assisted BOCDR utilizing polarization-maintaining fiber. In Proceedings of the 23rd OptoElectronics and Communications Conference (OECC2018), Jeju, Korea, 2–6 July 2018. [Google Scholar]
- Alahbabi, M.N.; Cho, Y.T.; Newson, T.P. Simultaneous temperature and strain measurement with combined spontaneous Raman and Brillouin scattering. Opt. Lett. 2005, 30, 1276–1278. [Google Scholar] [CrossRef] [PubMed]
- Zou, W.; He, Z.; Hotate, K. Complete discrimination of strain and temperature using Brillouin frequency shift and birefringence in a polarization-maintaining fiber. Opt. Express 2009, 17, 1248–1255. [Google Scholar] [CrossRef] [PubMed]
- Ding, M.; Mizuno, Y.; Nakamura, K. Discriminative strain and temperature measurement using Brillouin scattering and fluorescence in erbium-doped optical fiber. Opt. Express 2014, 22, 24706–24712. [Google Scholar] [CrossRef] [PubMed]
- Li, A.; Wang, Y.; Fang, J.; Li, M.J.; Kim, B.Y.; Shieh, W. Few-mode fiber multi-parameter sensor with distributed temperature and strain discrimination. Opt. Lett. 2015, 40, 1488–1491. [Google Scholar] [CrossRef] [PubMed]
- Weng, Y.; Ip, E.; Pan, Z.; Wang, T. Single-end simultaneous temperature and strain sensing techniques based on Brillouin optical time domain reflectometry in few-mode fibers. Opt. Express 2015, 23, 9024–9039. [Google Scholar] [CrossRef] [PubMed]
- Zhao, Z.; Dang, Y.; Tang, M.; Duan, L.; Wang, M.; Wu, H.; Fu, S.; Tong, W.; Shum, P.P.; Liu, D. Spatial-division multiplexed hybrid Raman and Brillouin optical time-domain reflectometry based on multi-core fiber. Opt. Express 2016, 24, 25111–25118. [Google Scholar] [CrossRef] [PubMed]
- Xie, H.; Sun, J.; Feng, D. Simultaneous measurement of strain and temperature based on hybrid EDF/Brillouin laser. Opt. Express 2016, 24, 11475–11482. [Google Scholar] [CrossRef] [PubMed]
- Xu, Y.; Ren, M.; Lu, Y.; Lu, P.; Lu, P.; Bao, X.; Wang, L.; Messaddeq, Y.; LaRochelle, S. Multi-parameter sensor based on stimulated Brillouin scattering in inverse-parabolic graded-index fiber. Opt. Lett. 2016, 41, 1138–1141. [Google Scholar] [CrossRef] [PubMed]
- Hayashi, N.; Mizuno, Y.; Nakamura, K.; Set, S.Y.; Yamashita, S. Experimental study on depolarized GAWBS spectrum for optomechanical sensing of liquids outside standard fibers. Opt. Express 2017, 25, 2239–2244. [Google Scholar] [CrossRef] [PubMed]
- Minardo, A.; Coscetta, A.; Catalano, E.; Zeni, L. Simultaneous strain and temperature measurements by dual wavelength Brillouin sensors. IEEE Sens. J. 2017, 17, 3714–3719. [Google Scholar] [CrossRef]
Figure 1.
Conceptual schematic of BOCDR. AC, alternating current; DC, direct current; ESA, electrical spectrum analyzer; FUT, fiber under test; PD, photodiode.
Figure 1.
Conceptual schematic of BOCDR. AC, alternating current; DC, direct current; ESA, electrical spectrum analyzer; FUT, fiber under test; PD, photodiode.

Figure 2.
Operating principle of basic BOCDR.

Figure 3.
Comparison of the operating principles of BOCDA and BOCDR.

Figure 4.
Special BOCDR configurations with extended measurement ranges. (a) Temporal gating scheme and (b) double modulation scheme. AC, alternating current; DAQ, data acquisition; DC, direct current; DFB-LD, distributed-feedback laser diode; EDFA, erbium-doped fiber amplifier; ESA, electrical spectrum analyzer; FUT, fiber under test; GPIB, general-purpose interface bus; IM, intensity modulator; PC, polarization controller; PD, photodiode; PSCR, polarization scrambler. [42,43]. Copyright (2009,2010) OSA.

Figure 5.
Schematic illustrations of the operating principle of slope-assisted BOCDR. (a) One-to-one correspondence between the BFS and the spectral power PB0 at frequency νB0. The dotted curve is the initial BGS, and the solid curve is the BGS shifted to higher frequency because of strain and/or heat. (b) PB0 distributions along the FUT with (solid curve) and without (dotted line) partial strain and heat. (c) PB0 distributions along the FUT with (solid curve) and without (dotted line) a point loss. Reproduced with permission from [59]. Copyright (2016) IEEE.

Figure 6.
(a) Measured BGS and (b) its differential coefficient at each frequency. The linear region of the lower-frequency side is indicated. Reproduced with permission from [59]. Copyright (2016) IEEE.
Figure 6.
(a) Measured BGS and (b) its differential coefficient at each frequency. The linear region of the lower-frequency side is indicated. Reproduced with permission from [59]. Copyright (2016) IEEE.

Figure 7.
Experimental setup of slope-assisted BOCDR. AMP, amplifier; EDFA, erbium-doped fiber amplifier; ESA, electrical spectrum analyzer; FUT, fiber under test; LD, laser diode; OSC, oscilloscope; PD, photodiode; PSCR, polarization scrambler. Reproduced with permission from [59]. Copyright (2016) IEEE.

Figure 8.
(a) Structure of the FUT. (b) Measured PB0 change distribution. Reproduced with permission from [59]. Copyright (2016) IEEE.
Figure 8.
(a) Structure of the FUT. (b) Measured PB0 change distribution. Reproduced with permission from [59]. Copyright (2016) IEEE.

Figure 9.
Deduced strain distributions directly obtained from the final power outputs of (a) standard BOCDR and (b,c) slope-assisted BOCDR. Note that the traces in (a) give the correct strain distributions. Reproduced with permission from [60]. Copyright (2016) OSA.
Figure 9.
Deduced strain distributions directly obtained from the final power outputs of (a) standard BOCDR and (b,c) slope-assisted BOCDR. Note that the traces in (a) give the correct strain distributions. Reproduced with permission from [60]. Copyright (2016) OSA.

Figure 10.
(a) Structure of an FUT with a relatively high spatial resolution (9.5 cm); and (b) structure of an FUT with a relatively low spatial resolution (19.6 cm). Reproduced with permission from [60]. Copyright (2016) OSA.
Figure 10.
(a) Structure of an FUT with a relatively high spatial resolution (9.5 cm); and (b) structure of an FUT with a relatively low spatial resolution (19.6 cm). Reproduced with permission from [60]. Copyright (2016) OSA.

Figure 11.
Deduced strain distributions with a spatial resolution of 9.5 cm: (a) example measurement along the whole length of the FUT when a 1500 µε strain was applied to a 20-cm-long section, and magnified views when strains of (b) 750 µε and (c) 1500 µε were applied to 5-cm- to 100-cm-long sections. In (b,c), each distribution was shifted by 3000 µε, and the dotted lines indicate the simulated data. Reproduced with permission from [60]. Copyright (2016) OSA.

Figure 12.
Magnified views of the deduced strain distributions with a spatial resolution of 19.6 cm; a 1500 µε strain was applied to 5-cm- to 20-cm-long sections. Each distribution was shifted by 3000 µε, and the dotted lines indicate the simulated data. Reproduced with permission from [60]. Copyright (2016) OSA.

Figure 13.
(a) Structure of a silica SMF under test. The length of the strained section Lε was set to 0.01, 0.02, 0.05, 0.10, 0.20, 0.50, and 1.00 m. (b) Structure of a silica SMF under test, which was locally strained for 0, 0.10, 0.15, and 0.20%. (c) Structure of a POF under test, which was locally heated to 26, 35, 45, and 55 °C. Reproduced with permission from [61]. Copyright (2016) JSAP.

Figure 14.
(a) Normalized power-change distributions measured when the length of the strained section Lε was reduced from 1.00 m to 0.01 m; each distribution was shifted by 0.5. Dotted lines indicate the theoretical trends. (b) Maximal power-changes plotted as a function of Lε. The error bars were calculated as standard deviations of the signal fluctuations at non-strained sections. The dotted line is a linear fit. The inset shows the magnified view at Lε shorter than 0.1 m. Reproduced with permission from [61]. Copyright (2016) JSAP.

Figure 15.
(a) Normalized power-change distributions along a silica SMF measured at four strains. (b) Maximal power-changes plotted as a function of strain. The dotted line is a linear fit. Reproduced with permission from [61]. Copyright (2016) JSAP.
Figure 15.
(a) Normalized power-change distributions along a silica SMF measured at four strains. (b) Maximal power-changes plotted as a function of strain. The dotted line is a linear fit. Reproduced with permission from [61]. Copyright (2016) JSAP.

Figure 16.
(a) Normalized power-change distributions along a POF measured at four temperatures. (b) Maximal power-changes plotted as a function of temperature. The dotted line is a linear fit. Reproduced with permission from [61]. Copyright (2016) JSAP.
Figure 16.
(a) Normalized power-change distributions along a POF measured at four temperatures. (b) Maximal power-changes plotted as a function of temperature. The dotted line is a linear fit. Reproduced with permission from [61]. Copyright (2016) JSAP.

© 2018 by the authors. Licensee MDPI, Basel, Switzerland. This article is an open access article distributed under the terms and conditions of the Creative Commons Attribution (CC BY) license (http://creativecommons.org/licenses/by/4.0/).
Share and Cite
MDPI and ACS Style
Mizuno, Y.; Lee, H.; Nakamura, K. Recent Advances in Brillouin Optical Correlation-Domain Reflectometry. Appl. Sci. 2018, 8, 1845. https://doi.org/10.3390/app8101845
AMA Style
Mizuno Y, Lee H, Nakamura K. Recent Advances in Brillouin Optical Correlation-Domain Reflectometry. Applied Sciences. 2018; 8(10):1845. https://doi.org/10.3390/app8101845
Chicago/Turabian StyleMizuno, Yosuke, Heeyoung Lee, and Kentaro Nakamura. 2018. "Recent Advances in Brillouin Optical Correlation-Domain Reflectometry" Applied Sciences 8, no. 10: 1845. https://doi.org/10.3390/app8101845
Note that from the first issue of 2016, this journal uses article numbers instead of page numbers. See further details here.