Article

Investigation of Microscopic Structure and Ion Dynamics in Liquid Li(Na, K)EutecticCl Systems by Molecular Dynamics Simulation

1
School of Resources and Environmental Engineering, East China University of Science and Technology, Shanghai 200237, China
2
National Engineering Research Center for Integrated Utilization of Salt Lake Resource, East China University of Science and Technology, Shanghai 200237, China
*
Author to whom correspondence should be addressed.
Appl. Sci. 2018, 8(10), 1874; https://doi.org/10.3390/app8101874
Submission received: 21 August 2018 / Revised: 27 September 2018 / Accepted: 27 September 2018 / Published: 10 October 2018

Abstract

:
Molten chloride salts are the main components in liquid metal batteries, high-temperature heat storage materials, heat transfer mediums, and metal electrolytes. In this paper, interest is centered on the influence of the LiCl component and temperature on the local structure and transport properties of the molten LiCl-NaCl-KCl system over the temperature range of 900 K to 1200 K. The liquid structure and properties have been studied across the full composition range by molecular dynamics (MD) simulation of a sufficient length to collect reliable values, such as the partial radial distribution function, angular distribution functions, coordination numbers distribution, density, self-diffusion coefficient, ionic conductivity, and shear viscosity. Densities obtained from simulations were underestimated by an average 5.7% of the experimental values. Shear viscosities and ionic conductivity were in good agreement with the experimental data. The association of all ion pairs (except for Li-Li and Cl-Cl) was weakened by an increasing LiCl concentration. Ion clusters were formed in liquids with increasing temperatures. The self-diffusion coefficients and ionic conductivity showed positive dependences on both LiCl concentration and temperature, however, the shear viscosity was the opposite. By analyzing the hydrodynamic radii of each ion and the coordination stability of cation-anion pairs, it was speculated that ion clusters could be the cation-anion coordinated structure and affected the macro properties.

1. Introduction

Molten chloride salts have been widely used in liquid metal batteries [1,2,3], high-temperature heat storage materials, heat transfer mediums [4], and metal electrolytes, owing to their favorable characteristics, such as wide operating temperature range, low vapor pressure, moderate heat capacity, low cost, and high thermal stability [5]. Both the structure and properties of molten chloride salts are hard to measure due to the extreme high-temperature, corrosive, and volatile conditions, needless to consider the accuracy of testing. Fortunately, computer simulation methods have been developed rapidly in recent years, which could give deep insight into the microstructure and the properties of molten salts.
The mixtures of molten salts have been investigated intensively in the past years, and the composition dependence of properties has often been the central topic. Endoh and Okada [6] firstly studied the internal mobility of molten (Li, Na, K)Cl of its nearly eutectic composition at 773 K, 873 K, and 973 K by molecular dynamics (MD) simulation. Molecular dynamics simulation had been carried out on molten quaternary systems (Li, Na, K, Cs)Cl at 625 K and (Li, Na, K, Cs)F at 727 K to investigate the composition dependence of electrical properties, which was taken as the fundamental study for the pyrochemical reprocessing of spent metallic fuels in molten salts [7]. Later, Matsumiya et al. [8] simulated the electric properties in a temperature range of 800–1100 K for molten ternary mixtures (Li, Na, Cs)Cl. The temperature dependence of Chemla crossing points and the limit of Cs enrichment were discussed.
Recently, more attention was paid to the correlation between the structure and properties in liquids. Okamoto et al. [9] studied the local structure around La3+ ions in molten LaCl3 and its mixtures with alkali and alkaline earth chlorides for the electrochemical reprocessing of nuclear fuels. Rollet et al. [10] investigated the electrical conductivities of molten LiF-YF3 and LiF-NaF-ZrF4 by impedance measurements and MD simulation. They found that conductivity decreases with the addition of MFn (Mn+ = Y3+ or Zr4+) due to the formation of MF x n x units. The molecular dynamics simulations on mixtures composed of MCl3 (where M3+ is Y3+, Tb3+, La3+, and U3+) in (LiCl-KCl)eut were conducted, and the correlation between the viscosity and structure was discussed in depth [11]. Manga et al. [12] investigated a molten ZnCl2-NaCl-KCl system by MD, and the interplay between the extent of the network structure, composition, and transport properties (viscosity, thermal conductivity, and diffusion) was characterized. The network modification due to the addition of K ions leads to the formation of non-bridging terminal Cl ions, and leads to a positive temperature dependence of thermal conductivity in these melts, a valuable property for heat transfer fluid design.
Most of the work concentrated on complex multi-valent molten salts, neglecting the essential study of molten alkali chlorides, which are the solvent or main components in many applications. The alkali chlorides ternary system has a much lower melting point compared to the corresponding pure ones. There are few systematic reports on the study of ternary alkali metal chlorides systems in a temperature range of 900–1200 K and no comprehensive analysis on the correlation between the local structure and properties. In this context, our group determined to systematically investigate the ternary systems. This paper aimed to study the LiCl effect on eutectic NaCl-KCl systems (molar ration NaCl:KCl = 0.506:0.494).
In this paper, molecular dynamics simulation was carried out to investigate the influence of LiCl concentration and temperature (900 K to 1200 K) on the local structure and properties of a molten LiCl-NaCl-KCl system. Correlations between the structure and properties were also analyzed. The paper is organized as follows: Section 1 is the Introduction. In Section 2 the simulation details and theoretical methods are introduced, as well as experimental details. In Section 3, we analyze and discuss the simulation results, with the available experimental results. Partial radial distribution function, coordination numbers distribution, and angular distribution functions are displayed to explore the local structure. Then, the density, shear viscosity, and ionic conductivity of ternary salts are listed and compared with experiments. Density and viscosity experimental data are used to evaluate the simulated results. The effects of the temperature and concentration on the micro-structure and properties are also discussed. In the end of this section, the correlation between the local structure and transport properties is intensively discussed. Lastly, conclusions are made in Section 4.

2. Methodology

2.1. Simulations

Molecular dynamics simulations have been carried out on ternary systems composed of LiCl (where LiCl concentration ranged from 0% to 100% with a 20% interval) and (NaCl-KCl)eutectic (mole fraction ratio of NaCl:KCl is 0.506:0.494) in the temperature range from 900 to 1200 K. The simulation studies were based on the Born-Mayer-Huggins-Tosi-Fumi (BMHFT) rigid-ion (RI) interionic potential for the molten salts.
The BMHFT force field reproduces the properties of molten salts well, and the formula is listed below:
  U i j = q i q j r i j + B i j e x p ( σ i j r i j ρ ) C i j r i j 6 D i j r i j 8  
where the detailed implications of these symbols are presented in nomenclature and full exposition has been provided in a previous work [13]. It should be noted that a correction factor of 0.92 was multiplied by the original calculated ρ values in the chloride melts because the parameters given by Tosi and Fumi yield shorter distances by 10–30 pm for the first peak position of the cation-anion pair correlation functions in molten ternary chlorides [6,7]. The potential parameters used in this paper are listed in Table 1.
The open source software, Large-scale Atomic/Molecular Massively Parallel Simulator (LAMMPS) [14], was chosen to conduct all the simulation. A cubic box with 2000 ions (1000 cation and 1000 anion) was adopted to perform the simulation. The ion numbers of simulated compositions with a 20% interval are listed in Table 2, and were mainly discussed throughout the paper to explore the composition and temperature effect. The periodic boundary conditions method (PBC) was used to eliminate the boundary effect and keep the particle numbers constant. The cutoff radius was r c = L / 2 where L indexed the box length. For faster calculation, the particle-particle particle-mesh solver method was employed and the precision was set as 1 × 10⁻⁴. The Newton’s equation of motion was solved by the Verlet algorithm, and the timestep during the simulation was Δt = 1 fs. More details of the simulated set up can be found in our previous paper [13].
For initial isothermal-isobaric ensemble (NPT) simulations, the liquid densities could be determined with the following equation:
  ρ s i m = N L i C l M L i C l + N N a c l M N a c l + N K C l M K C l v E N A  
where N is the number of different alkali chlorides, M is the molar mass of each salt, NA denotes the Avogadro constant, and vE is the equilibrated volume of the simulation cell at the given temperature in the NPT ensemble simulations. For the structure and transport properties’ collection, a random velocity according to the Gaussian distribution was assigned to the ions at the desired temperature. Then, an equilibration process for the system was conducted in NPT ensemble under a pressure fixed at 0 GPa at the desired temperature for 3 ns. The production runs were performed in a canonical ensemble (NVT) with the Nose-Hoover thermostat method at the equilibrated cell volume. The damping parameters, which determined how rapidly the temperature and pressure were relaxed, were set to be 0.1 ps and 0.5 ps, respectively. The NVT stages lasted more than 10 ns for each system to ensure good statistics for the computation of the transport coefficients. During the production stages, the pair distribution functions, coordination numbers distribution, angular distribution, and self-diffusion coefficients were calculated.

2.2. Evaluated Properties

Theoretical methods of calculating the partial radial distribution function (RDF), angular distribution function, coordination distribution function, density, diffusion coefficient, and ionic conductivity were introduced in our previous reports [15,16,17]. The angular distribution function and coordination numbers distribution function were processed based upon the trajectory files by python.
The shear viscosity, η, is a measure of the resistance of a fluid to be deformed by shear stress. The reverse non-equilibrium molecular dynamics (RNEMD) method has been shown to be more accurate and efficient than equilibrium molecular dynamics simulation (EMD) and non-equilibrium molecular dynamics simulation (NEMD) [18,19,20]. Here, the shear viscosity was calculated through the RNEMD method based on linear response theory:
j z ( p x ) = η v x z
where j z ( p x ) is the momentum flux, which is the x component of the momentum transported in z direction per given time and per unit area. The term v x z , is the velocity gradient built up in z direction, which is also denoted as the shear rate. p x is the total momentum transferred in a simulation. In this method, momentum swaps were conducted between the middle and bottom bin of the simulation box, and the generated velocity gradient was measured. The viscosity was then calculated as the ratio of the total flux transferred and the velocity gradient as a follower:
  η = transfer m ( v xhot v xcold ) 2 tL x L y < v x / z >  

2.3. Experiments

The density and viscosity of molten LiCl-NaCl-KCl were measured to test the simulation results. Three different materials were used in the experiments: Lithium chloride, sodium chloride, and potassium chloride. All the materials were analytical reagents and the main contents were ≥99.5% (Sinopharm Chemical reagent Co. Ltd., Shanghai, China). All the mixture samples were prepared in the glove box (Mikrouna (China) Co., Ltd., Shanghai, China), then pre-melted in a muffle furnace (Y-feng furnace Co., Ltd., Shanghai, China) at the desired temperature, which is higher than the melting point. The pre-melting process was for at least one hour to ensure the sample mixing was uniform. After cooling in the drier, the samples were ground into a powder for testing. A self-designed device for molten salts based on the Archimedes method was used for density experiments. The density self-designed device was constructed following Cheng et al.’s work [21], and the set-up is illustrated in Figure 1. The Anton Paar Rheology EC-twist502 (Anton Paar GmbH, Graz, Austria) and furnace CTD1000 (Anton Paar GmbH, Graz, Austria) were used to measure the viscosity by the coaxial cylinders method. The shear rate was selected to be 20 s−1 after shear rate scanning.

3. Results

In this section, the addition of LiCl to a eutectic proportion (Na, K) Cl system has been investigated across the full composition range from 900 to 1200 K with a 25 K temperature interval. Furthermore, a higher temperature of 1500 K for the extreme condition was also investigated.

3.1. Liquid Structure

3.1.1. Partial Radial Distribution Function

(a) The LiCl concentration dependence
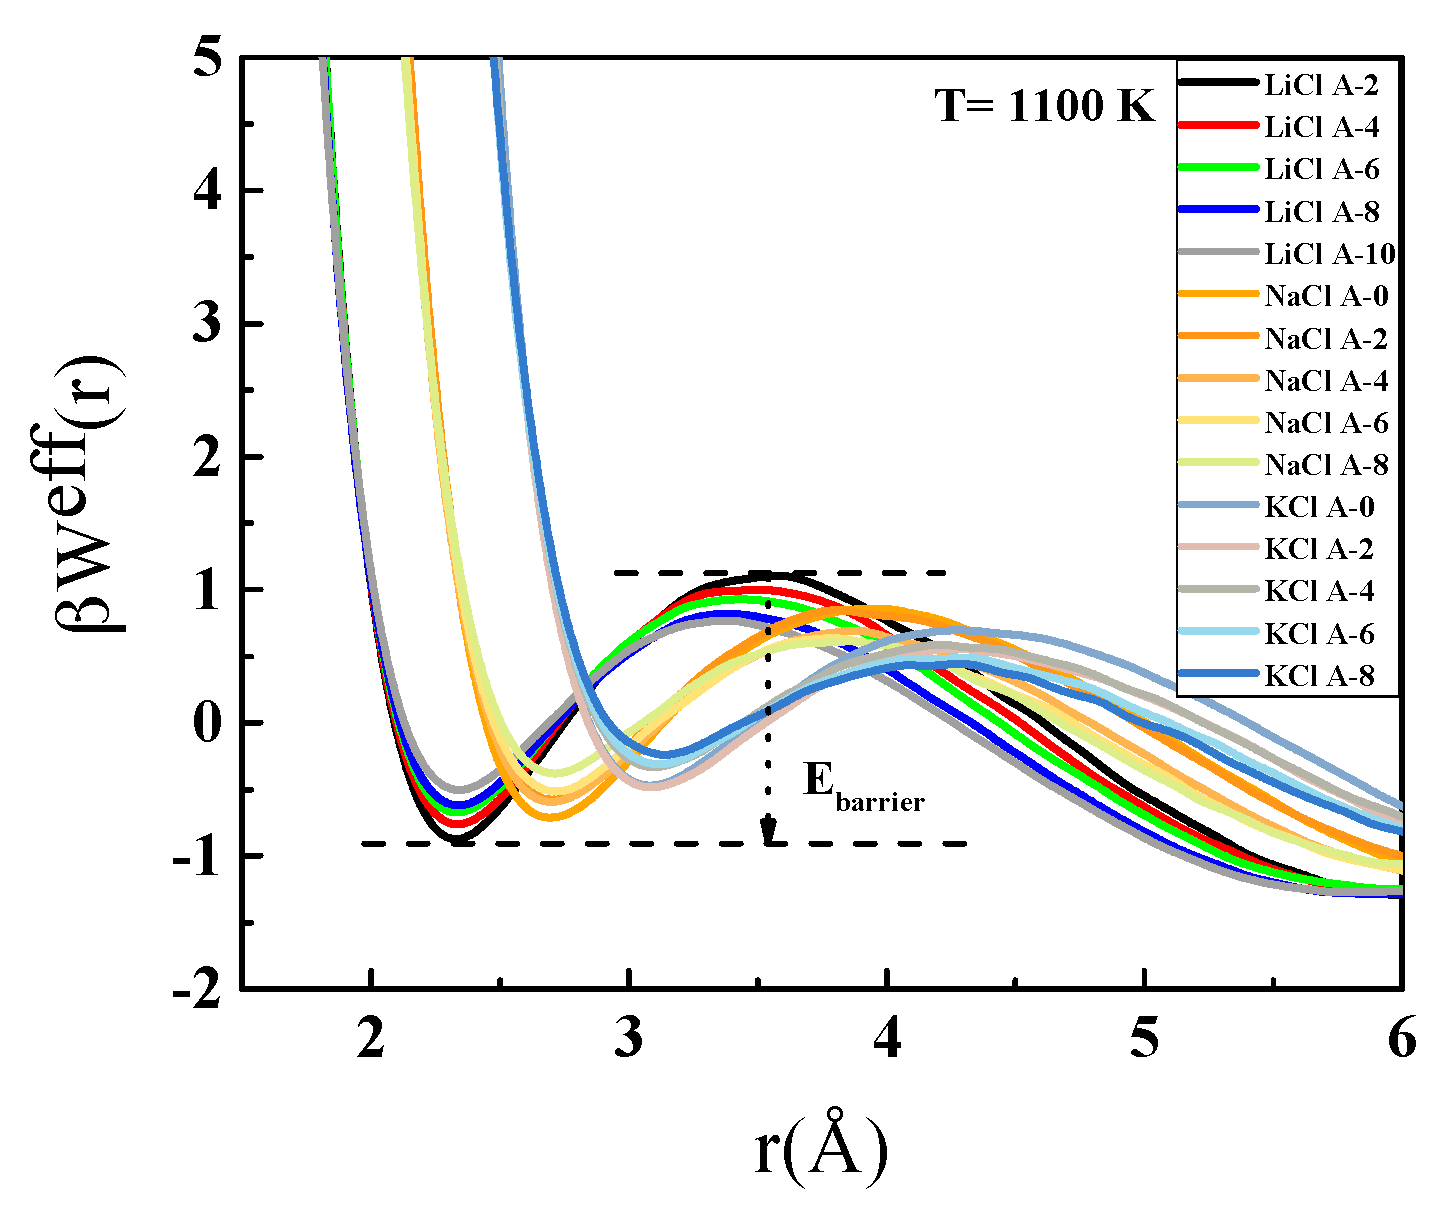
Partial radial distribution function (PDF) is calculated in histogram form by binning pairwise distances into 200 bins from 0.0 to the maximum force cutoff (defined as r
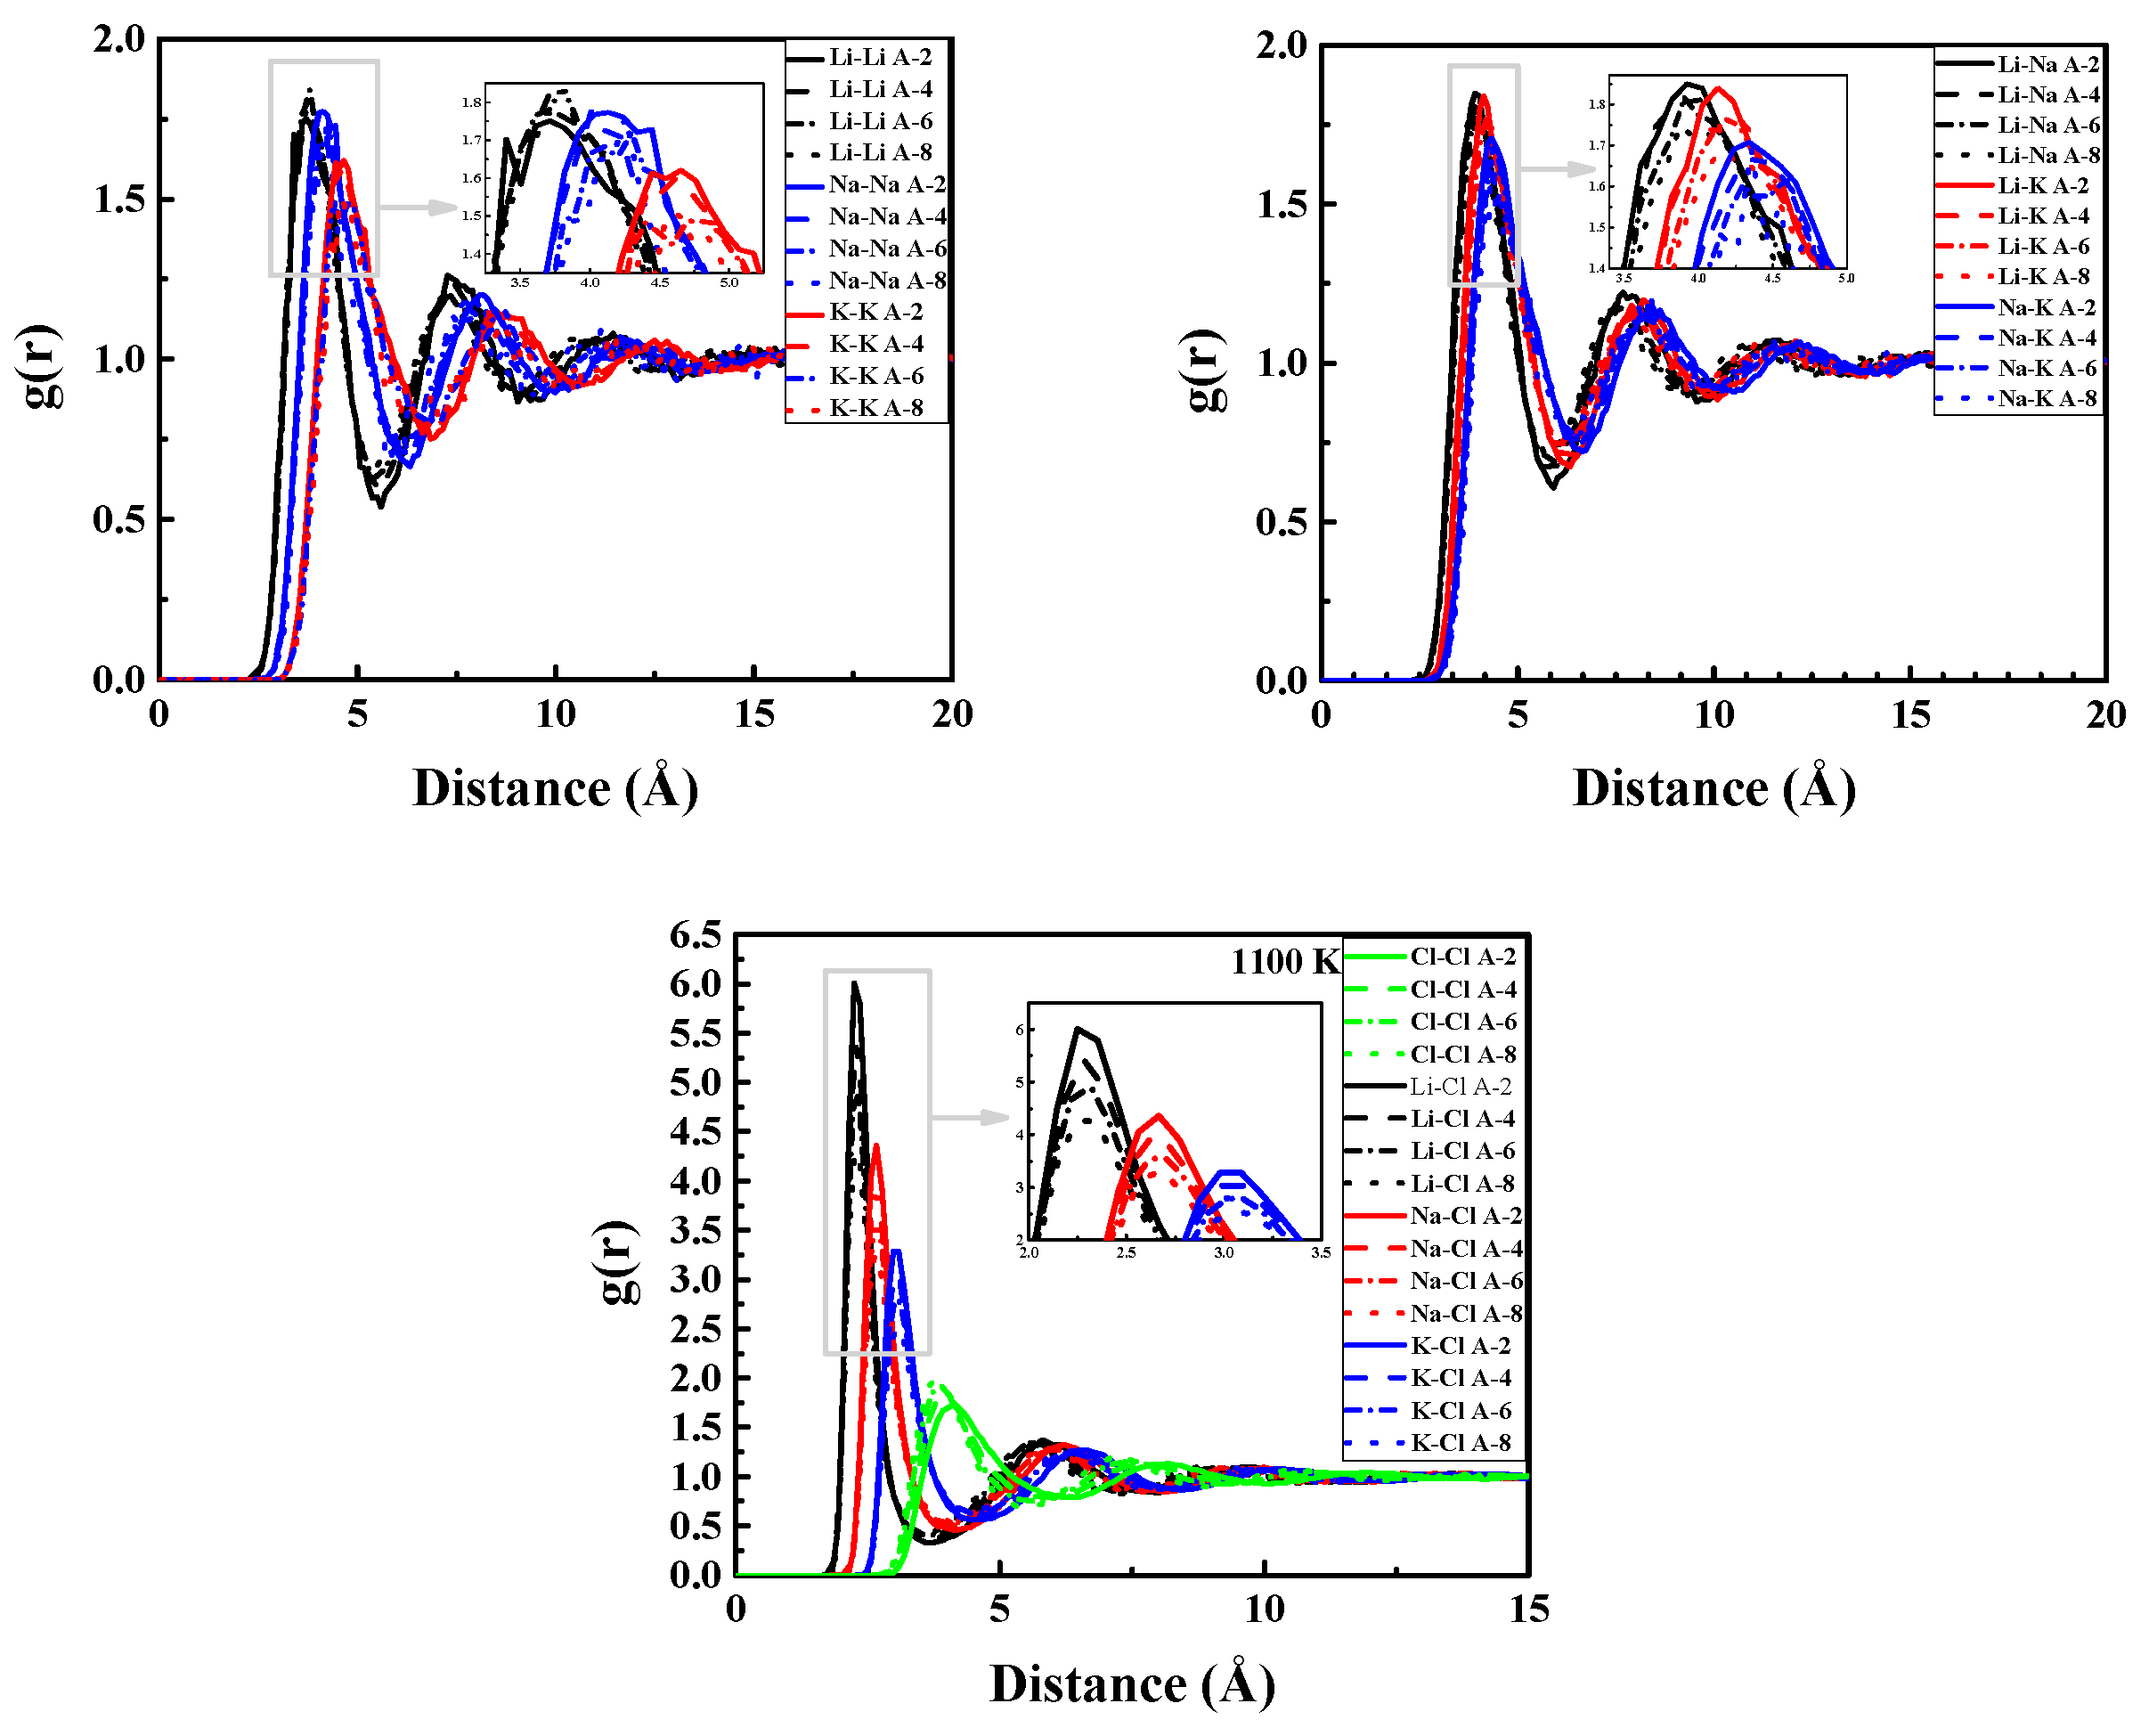
c = L/2). The bins are of uniform size in a radial distance. Thus, a single bin encompasses a thin shell of distances in 3d and a thin ring of distances in 2d. PDFs of A-2, A-4, A-6, and A-8 at 1100 K are shown in Figure 2 to illustrate the influence of the LiCl concentration on the structure of ternary systems. The quantitatively structural information containing the first peak position, rmax, the first peak height, hmax, the first valley position, rmin, and running integral coordination number, N(rmin) are summarized in Table 3, which were determined by fitting PDFs (R2 = 1.0). The running integral coordination number was obtained by a spherical integration of g(r) from 0 to rmin. The structural parameters of the ternary systems were in good agreement with results of a similar composition [22].
For cation-anion pairs, though the variations of the first peak positions of potassium are a little greater than lithium sodium ions across the concentration, the changes (maximum change was 0.05 Å) were subtle. However, the first peak heights all decreased distinctively, while the heights of the first minimum increased with an increasing LiCl. This indicated the degree of unlike charged ions’ association decreased with LiCl addition. The coordination numbers were roughly 4, 5, and 6 for Li+, Na+, and K+, respectively. With an increasing LiCl molar fraction, the coordination numbers of the cation-anion pairs all increased, which suggested that cations tended to accommodate more anions.
For cation-cation pairs, as shown in Figure 2, the PDF curves of the cation-cation pairs are not as smooth as the ones of cation-anion pairs for the relatively weak association between like charge ions. The first peak positions shifted right and the corresponding height decreased with LiCl addition (except for Li-Li). For Li-Li, rmax showed an overall increasing tendency, but hmax increased up to 60% of the LiCl concentration then decreased. The LiCl concentration had more influence on the structure of cation-cation pairs than the cation-anion pairs. The changing rates of rmax and hmax for Li-Na and Li-K pairs were smaller than those for Na-Na, Na-K, and K-K pairs, which indicated a larger cation radius difference was a more stable structure even in cation-cation pairs.
For anion-anion pairs, the first peak positions shifted from 4.22 Å to 3.75 Å across the concentration, while the first peak heights rose from 1.73 to 2.04. The equilibrium distance of Cl-Cl was shortened and the association between Cl-Cl was strengthened. The coordination number of Cl-Cl decreased as LiCl increased, which indicated the closed pack between anions was inhibited. This could be attributed to the significant anion-anion overlap in LiCl salts relative to the other alkali chlorides [23].
(b) Temperature dependence
The influence of temperature for each pair at different concentrations are shown in Appendix A (Figure A1, Figure A2, Figure A3 and Figure A4). The equilibrium distances between all pairs were essentially constant in the temperature range of 900 K to 1200 K. The increasing temperature led to a lower hmax and an increase of the minima offset, which indicated the looser coordination structure.
However, for 1500 K, the rmax of cation-cation pairs obviously shifted to the right, while the second peak became weaker, which revealed the structure of ions became more liquid-like and disordered. However, the rmax of cation-anion pairs unexpectedly shifted left. The equilibrium distances of cation-cation pairs increased, however, the cation-anion was the opposite, which means ion clusters were formed. The increasing temperature caused free space in melts to become larger, thus cations drifted apart. Meanwhile, the distances of cations and anions became shorter, thus the ion clusters were likely to be cation-anion clusters. Another possibility for this phenomenon could be that the free space became larger in melts with an ascending temperature, so less correlated, similarly charged ion pairs drifted apart, and only the more tightly coordinated anions around the cations were left.
The temperature influence on Cl-Cl pairs was similar with the cation-cation pairs. At 1500 K, the rmax of Cl-Cl pairs shifted right slightly and the corresponding hmax became weaker. However, it is interesting to note that with the LiCl concentration increasing, the Cl-Cl pairs were less affected by the temperature. We assumed that this was caused by the stronger interactions between Li-Cl pairs.
In conclusion, though the ternary system is chemically simple, there are complicated changes in the association of each ion with its first coordination shell with the composition changing. The addition of LiCl to molten ternary systems decreases the association between ion pairs, except for Li-Li and Cl-Cl pairs. It is worthy to note that the addition of LiCl strengthened the Cl-Cl association, and the closed pack between anions was inhibited. Ion clusters were formed in liquid and the distance of ion clusters became larger with an increasing temperature, which has great influence on the macro-properties. To further study the local structure, PDFs must be combined with the coordination numbers distribution and angular distribution function.

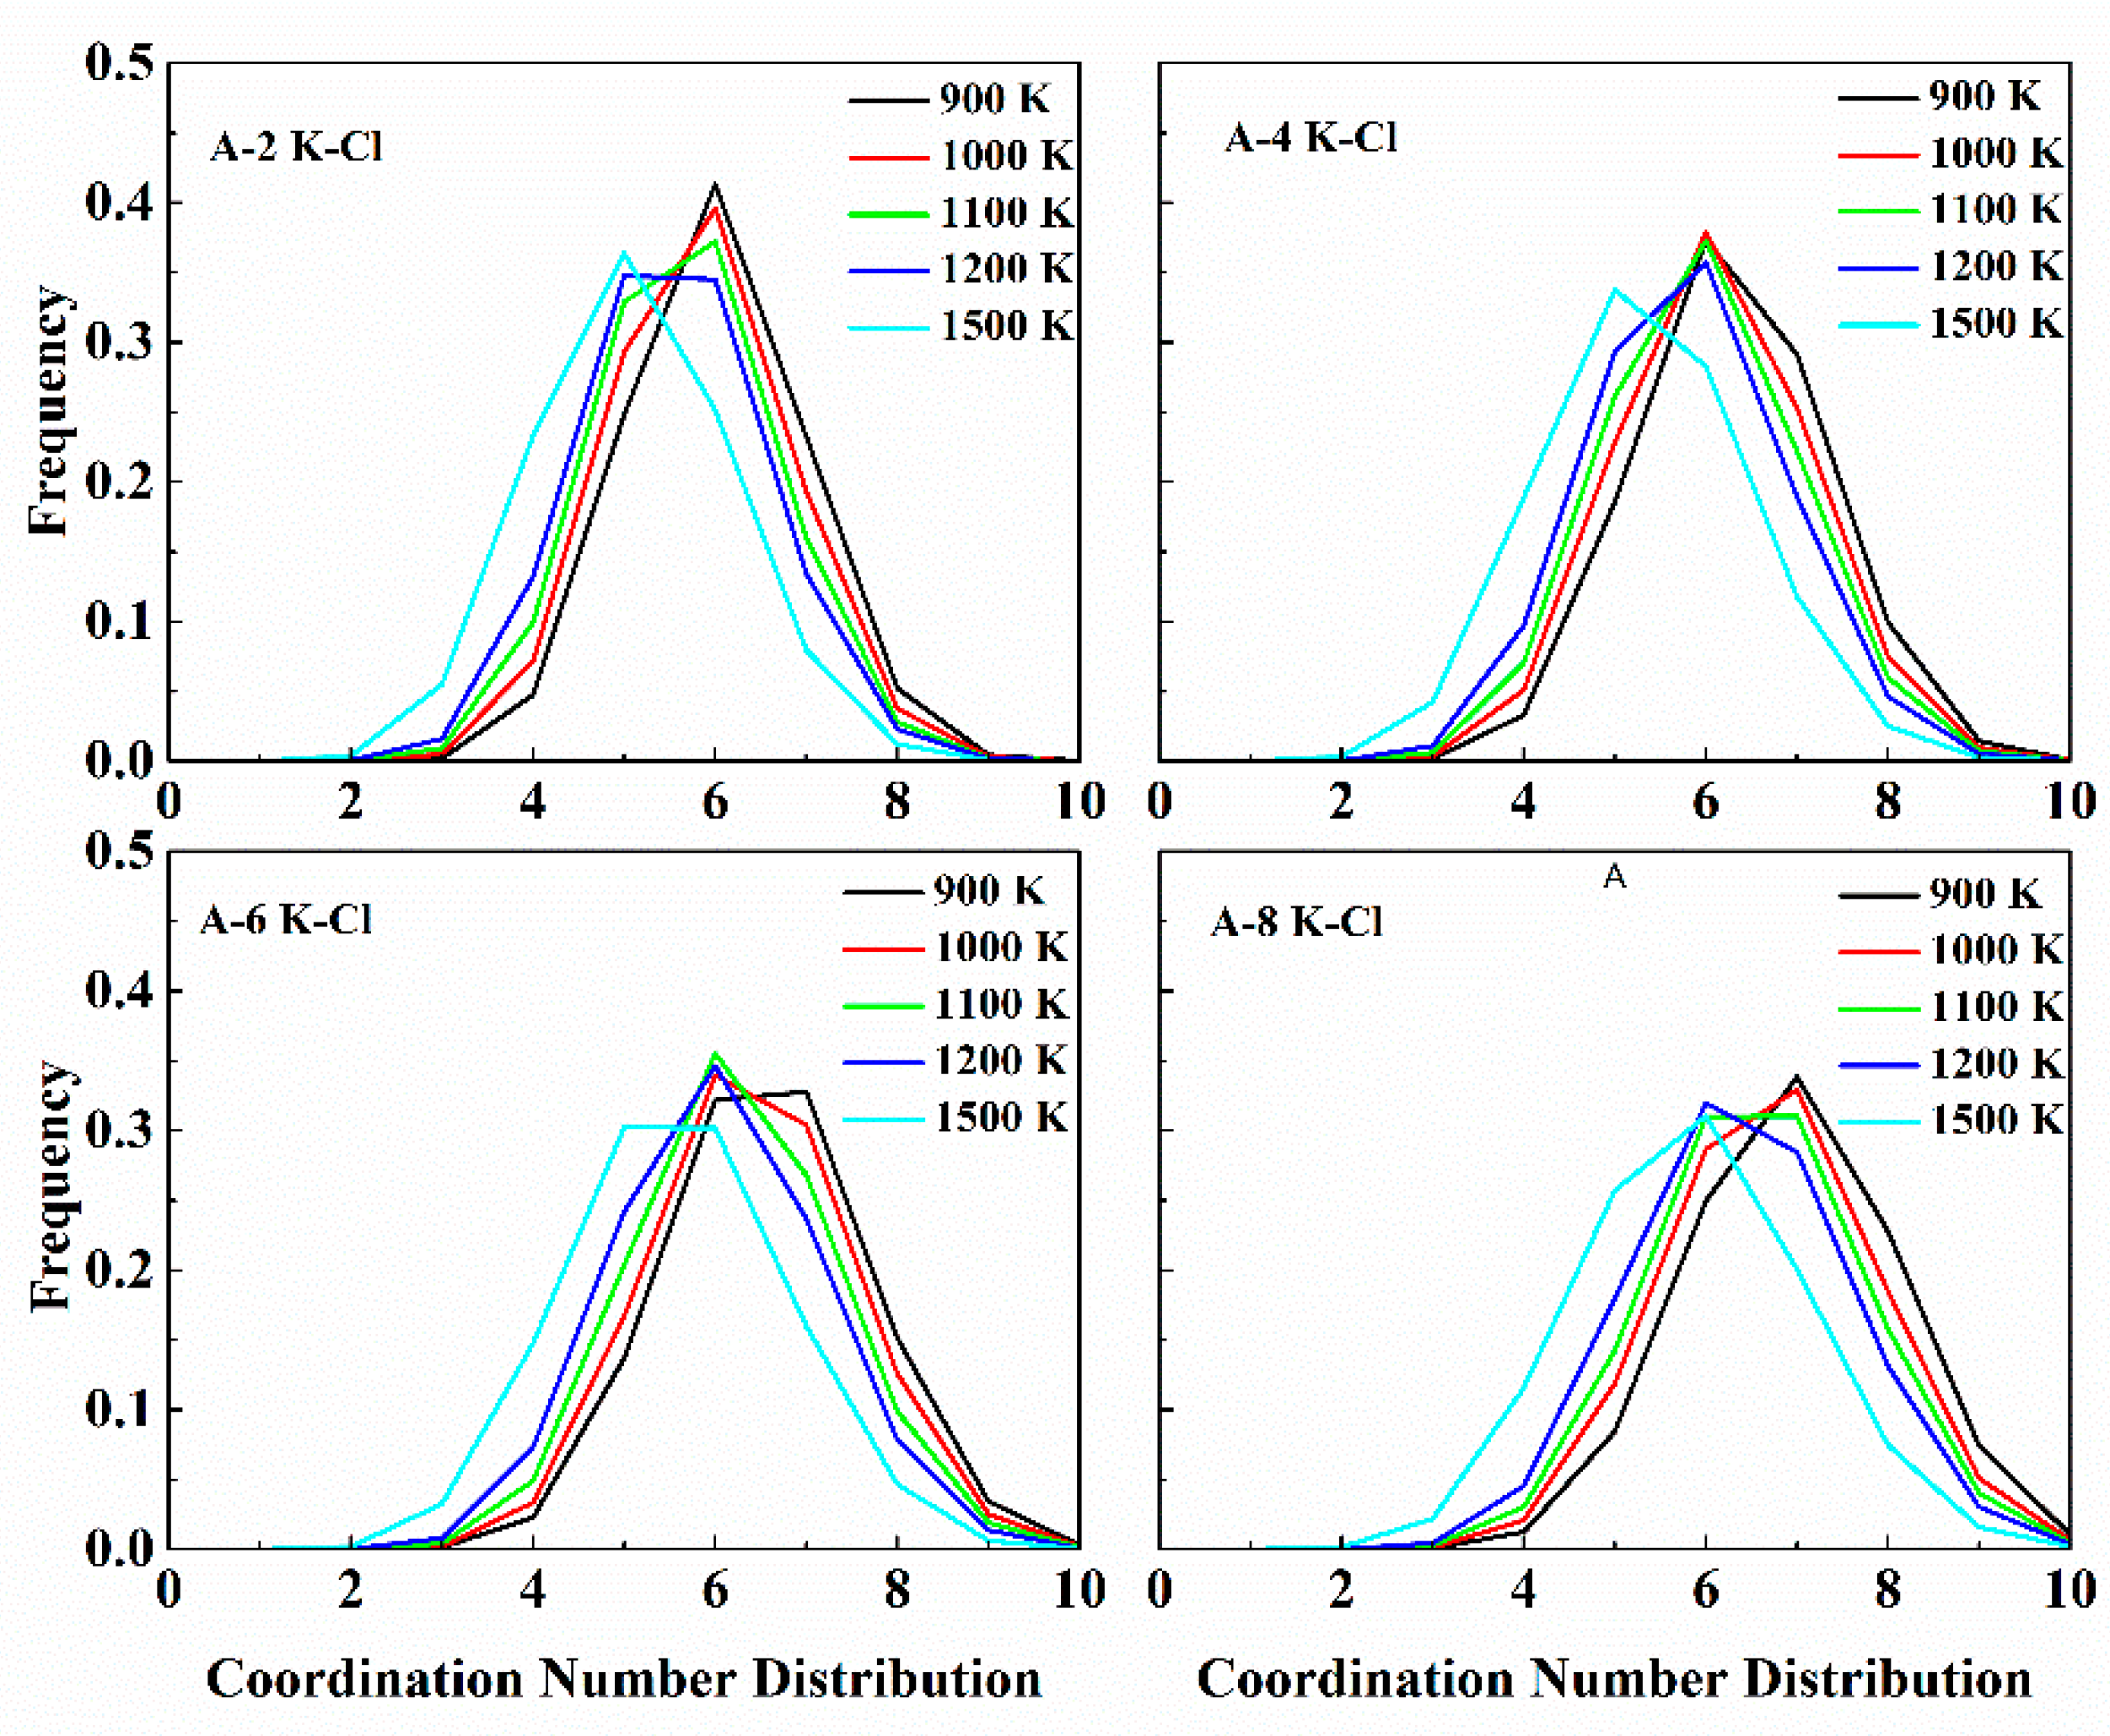
3.1.2. Coordination Numbers Distribution

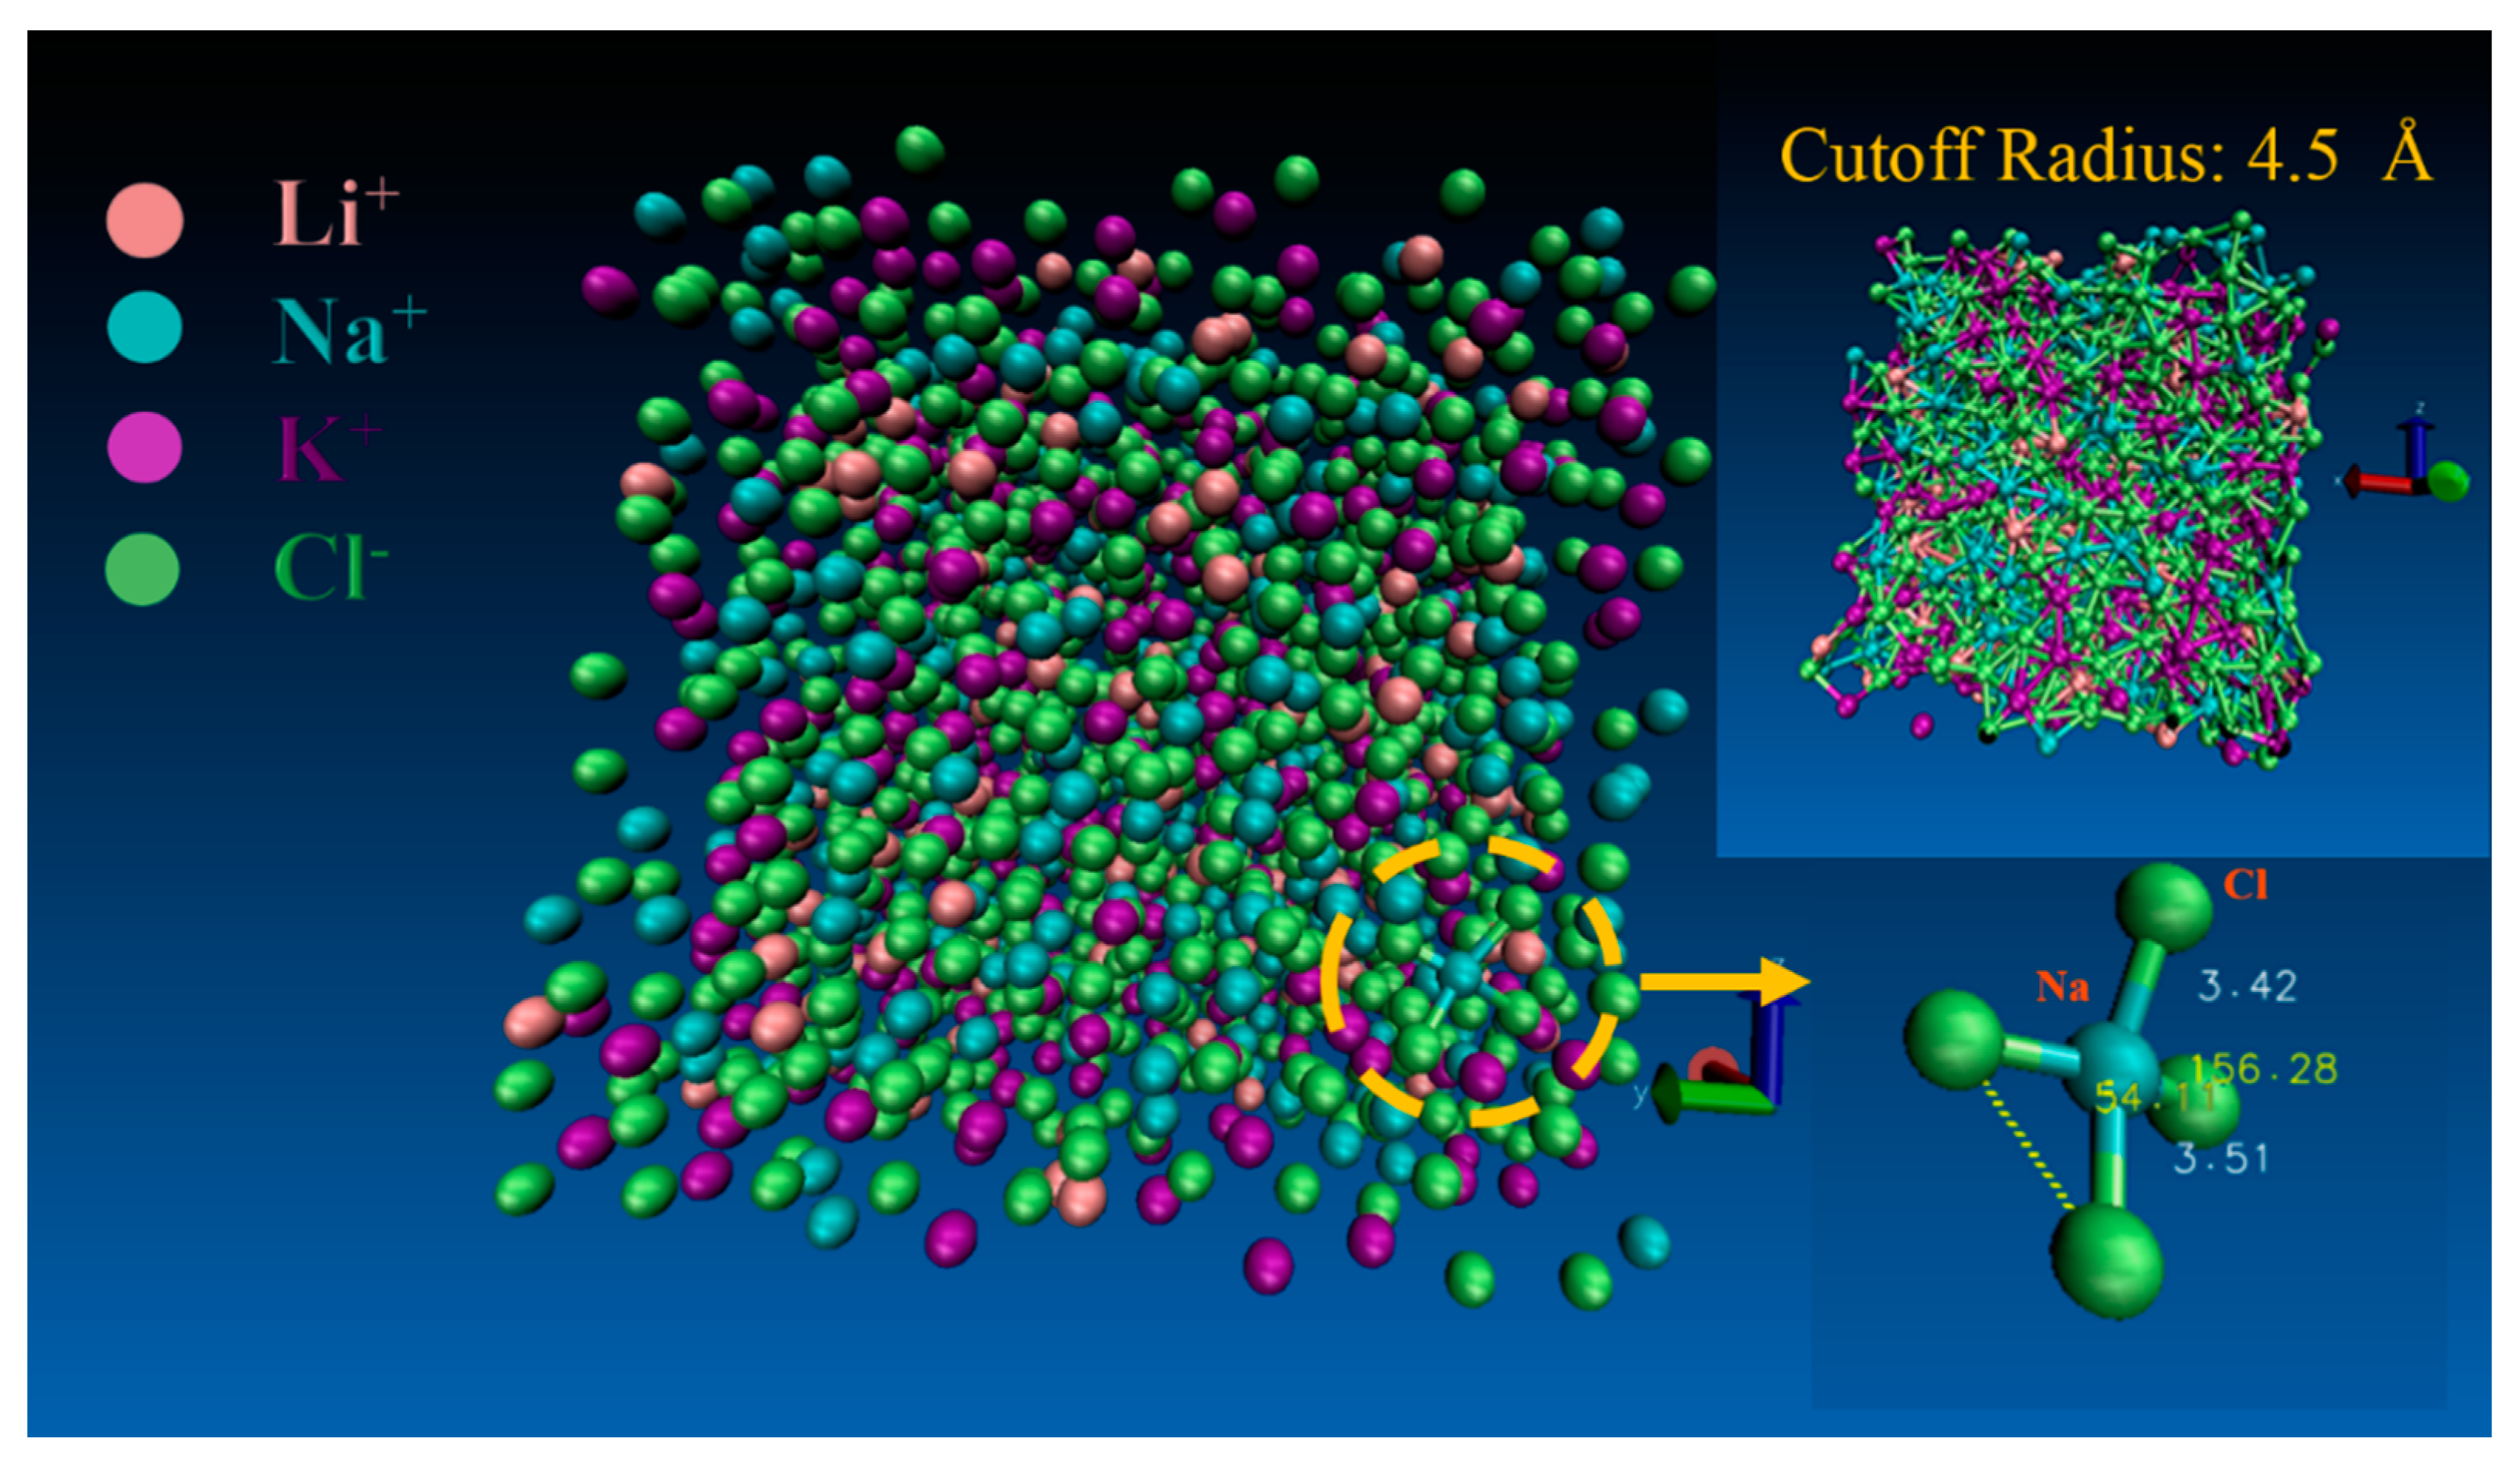
The simulation enabled deep insight into the numbers of anions in the coordination shell. We determined the number of anions within a spherical shell by collection of every step ions’ position and the shell radius was set to the position of the minimum (rmin) in the PDFs. This constitutes an instantaneous coordination number for that cation.
Figure 3 shows the coordination numbers distribution around each cation at 1100 K across the concentration. In the ternary melts, there coexisted 3- to 8-fold coordination, with different proportions. The coordination numbers distribution of Li+ are mainly located in 4 and coexisted with 3-fold and 5-fold coordination. With an increasing LiCl composition, the mainly located 4-fold coordination of Li+ slightly decreased. Meanwhile, the proportion of 3-fold distribution decreased, and the proportion of 5-fold coordination number increased. For Na-Cl, the coordination numbers, mainly located in 5, coexisted with 4-fold and 6-fold coordination. The 5-fold coordination almost remained constant, with no regard to the composition. However, with an increasing LiCl concentration, the 4-fold coordination largely decreased and 6-fold coordination increased. For K-Cl, the coordination numbers of K+ were mainly 4, 5, 6, 7, and 8. When x LiCl     60 % , the coordination numbers were mainly located in 6. However, when x LiCl   >   60 % , the 6-fold and 7-fold dominated. With an increasing LiCl, the 4-fold and 5-fold coordination of K+ all decreased, while the higher coordination 7-fold and 8-fold increased.
The results showed that the proportion of higher coordination numbers for each cation increased as the LiCl molar fraction increased. Combined with our previous study [13,15], the local structure of Li-Cl in melts is an anomalous, distorted tetrahedron, while Na-Cl and K-Cl are a distorted octahedron. It can be clearly seen that the tendency to form an octahedron became stronger for Na-Cl with an increasing LiCl addition. The anions coordination numbers distribution of K+ were the most complex. Though sexadentate dominated, the tendency of accommodating more anions for K+ became stronger. As for Li-Cl, though the portion of 5-fold coordination increased, the tetrahedron structure still dominated. The sharp peak in the PDF indicates a tight coordination of Li-Cl and its height decreases with LiCl addition. It can be found from Table 3 that when the equilibrium distance between the cation and anion gets longer, the coordination numbers of the cation become greater. Combined with PDFs analysis, the LiCl addition increased the mobility of Cl-, so the tighter coordination structure (the relatively lower coordinated structure) reduced. With the temperature increasing, the coordination became amorphous (the temperature influence on the coordination numbers distribution is provided in Appendix A Figure A5, Figure A6 and Figure A7). In Figure 4, there is a snapshot of the A-2 system at 1100 K, and the coordinates around different cations were in a dynamic equilibration.

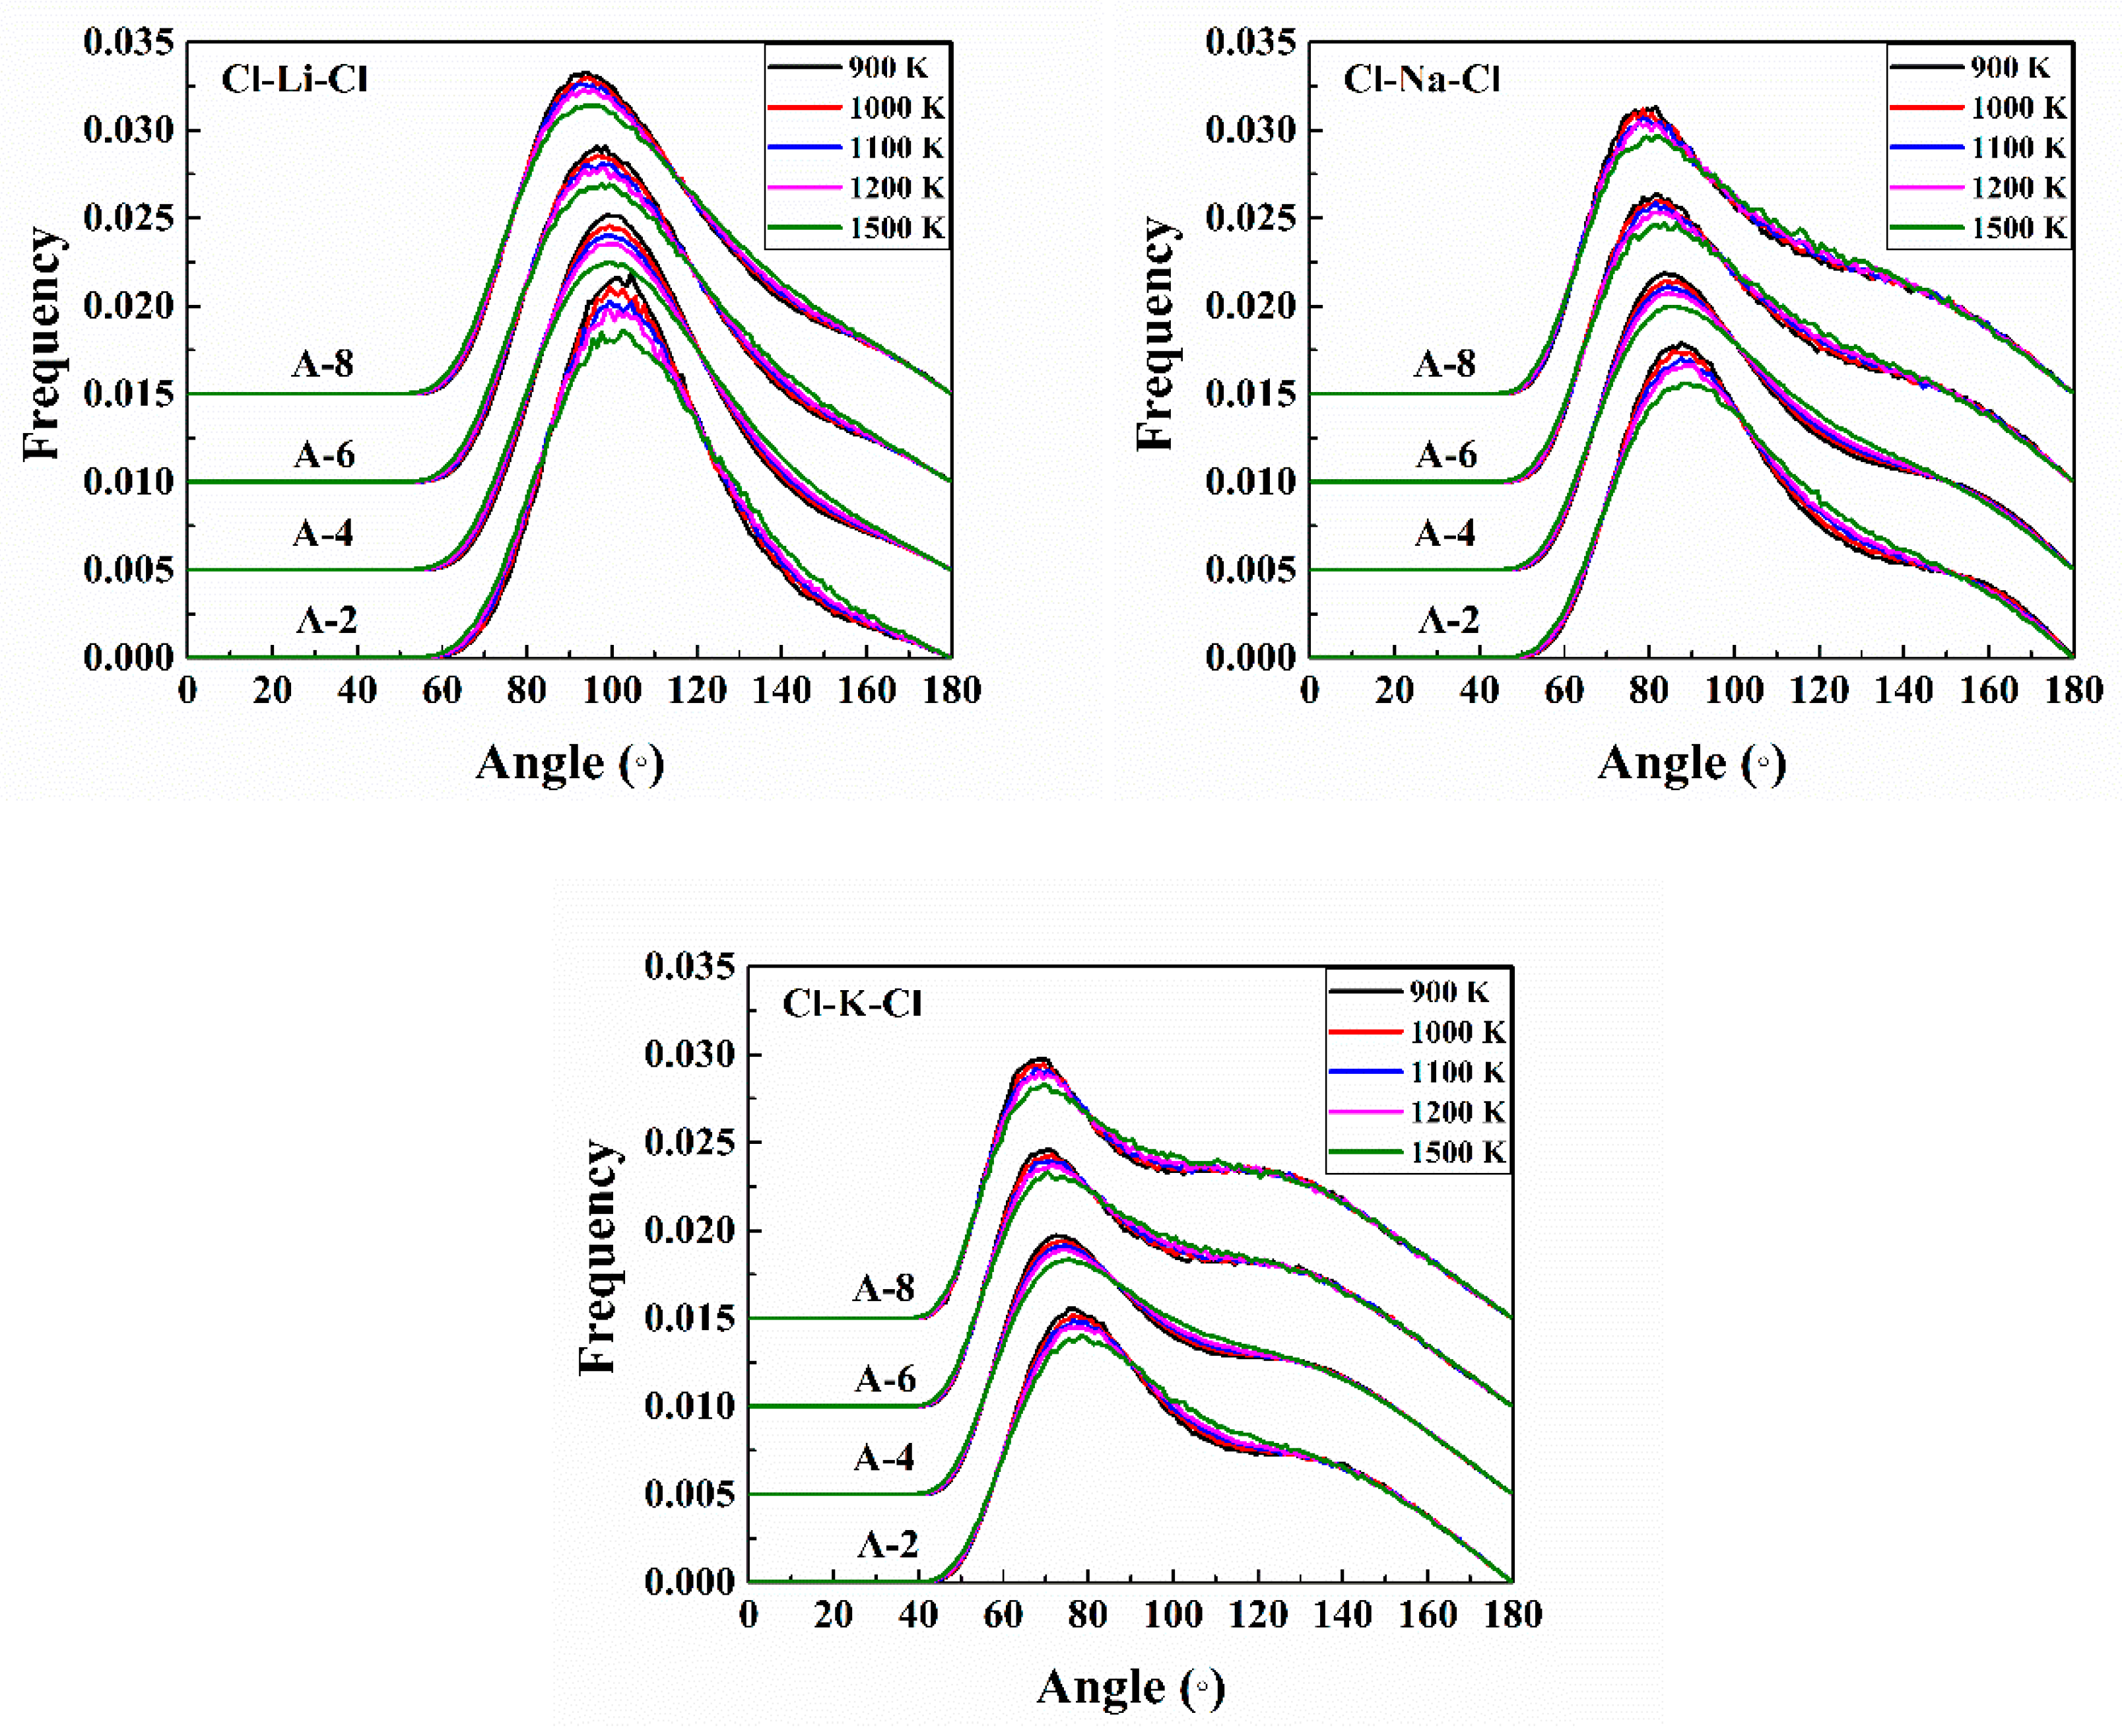
3.1.3. Angular Distribution Function

The angular distribution function (ADF) of Cl-A-Cl (A = Li, Na, K) from A-2 to A-8 at 1100 K is shown in Figure 5. Here, “bond” does not mean a real chemical bond, but just an atom pair within some distance. In the ternary melts, the Cl-A-Cl bond angles were distributed between 60° and 150°, all showing a broad peak and a smearing phenomenon, which indicates that the coordination bonds are orientated randomly.
With an increasing LiCl addition, the peak values of the bond angle for Cl-Li-Cl shifted from 100º to 93°, for Cl-Na-Cl, shifted from 88° to 79°, and for Cl-K-Cl, shifted from 78° to 68°. The angles become smaller with an increasing LiCl concentration. The corresponding bond angles for pure melts of LiCl, NaCl, and KCl were 98.18°, 87.27°, and 83.64°, respectively [15]. The bond angles of the corresponding pure alkali chloride crystal were mainly distributed in 90° and 180° [24] because the three salts in the crystal type were a face-centered cubic structure and sexadentate. Though the long-range order disappears in melts, at the micro-level, there was still some tendency to keep the crystal structure. Considering the coordination numbers of each cation become larger and the bond angles become smaller, we assumed that the deforming in the micro-level structure was larger than in that of the pure [15] and binary melt systems [25]. The ADFs were broader and no peak shifting was observed as the temperature increased (the temperature influence on the ADFs is provided in Appendix A Figure A8).

3.2. Properties

3.2.1. Density

The comparison of simulated and experimental densities for A-2, A-4, A-6, and A-8 systems are plotted in Figure 6. The experimental results were 6.3%, 8.1%, 3.8%, and 4.5% larger than the simulated results from A-2 to A-8. The discrepancies can be contributed to the selected force field and experimental error. Despite many efforts to keep the samples pure before testing, the LiCl should be hydrated and this affected the results. The BMHFT potential underestimated the density by about 5.3%, 6.3%, and 9.0% for pure molten LiCl, NaCl, and KCl, respectively [26]. Thus, it seems that the BMH pair potential, Larsen combination rule, and correction factors do a reasonable job of capturing molten phase properties.
Densities across the whole composition and temperature range are shown in Figure 7. It decreased linearly with the ascending temperature and Li+ addition. A database has been built for the ternary system across the full concentration, and the fitting expression is shown below:
  ρ d e n s i t y =   0.00164 x     8.14236   ×   10 4 T     1.51351   ×   10 6 x 2   +   1.94672   ×   10 7 T 2     1.94938   ×   10 9 x 3      4.86205   ×   10 11 T 3 + 1.24708   ×   10 6 xT   +   4.17543 × 10 13 x 2 T 2   +   2.13573  
where x is the concentration of LiCl. Neglecting the minor terms and fitting again:
  ρ d e n s i t y =   0.00172 x     6.58567   ×   10 4 T     1.34192   ×   10 6 x 2   +   4.29788   ×   10 8 T 2   +   1.33476   ×   10 6 xT   +   2.08316  
As listed in Table 4, the absolute values of the slopes of fitted lines become smaller with the addition of lithium ions, which indicated that the slope decreased slower with ascending temperature as the LiCl addition increased. Derived from Wang et al.’s [15] work, pure LiCl has the smallest slope in LiCl, NaCl, and KCl. Therefore, the higher LiCl concentration was, the more slowly the density changed along the temperature.

3.2.2. Self-Diffusion Coefficient

The self-diffusion coefficient is an important parameter in electrokinetics, metal extraction, and pyrochemical processing of nuclear waste; it is important to understand how the diffusion coefficient value is affected by changes in the solvent, and how it depends on the ionic charge and size.
The self-diffusion coefficients were calculated from the slope of the mean square displacement in the linear region for each ion in the melt. The simulated data are presented in Table 5. The results were in good agreement with corresponding experiments’ data of pure salts [27,28]. The values fluctuated as the component changed, and showed an overall positive dependence on the LiCl concentration and temperature. The fluctuation may be attributed for two reasons: First, according to Fürth hole theory [29], holes were formed by the action of the irregular thermal movement. Larger holes increased as the temperature increased. Second, ion clusters may form and the very short existence of ion clusters influences the mobility of ions.
It could be observed from Table 5 that ions in melts were less diffused in ternary systems than in the corresponding pure melt [28,30] and the binary systems (LiCl-KCl [30] and LiCl-NaCl [16]). The Li ions’ diffusivity was smaller than the Na ions’ and K ions’ at a low LiCl concentration and exceeded them at a higher concentration, which indicated the chemla effect. The diffusion coefficient of each ion exhibited an overall increase tendency as the LiCl concentration increased, which was consistent with the hmax decrease in PDFs. The increasing rate of D(Li+) become greater when the molar fraction of LiCl was beyond 60%. The anions’ mobility incensement was smaller than the cations’.

3.2.3. Ionic Conductivity

The ionic conductivity was computed based on the Green-Kubo correlation [31] via a programme compiled by language C in LAMMPS [13,15]. The ionic conductivity, λz, can be calculated from the time integral of the charge flux autocorrelation function through the EMD method:
  λ z = 1 3 V k B T 0 J z ( 0 ) J z ( t ) d t  
where the charge flux vector, JZ(t), is defined as:
  J Z ( t ) = i = 1 n z i e v i ( t )  
where zie and vi are the charge and velocity of atom i, respectively. Each of the three independent components (i.e., Jxz, Jyz, and Jzz) of the charge flux vector provides an independent estimate of the ionic conductivity, and the averaged value is taken as the final ionic conductivity value.
Figure 8a shows the time evolution of the normalized charge flux auto-correlation function (ACF) and the running integral (integration of charge flux ACF) for a molten A-6 system at 900 K. The normalized ACFs all decayed to zero quickly. The running integrals reached a plateau after about 0.5 ps for all the systems. During ionic conductivity calculations, a time of 5 ps was adopted for the charge flux ACFs calculation.
Figure 8b shows the simulated ionic conductivity results of ternary melts and the available experimental data. The ionic conductivities obtained here were in good agreement with the experiment, especially for molten LiCl. Matiasovsky and coworkers [32] investigated the specific electrical conductivity of LiCl-NaCl-KCl experimentally, and the results are plotted in Figure 8b (marked in line and symbols). In the experimental temperature range, the results of the calculation agreed with the experimental data within the error of 8–12%. Further research, including the polarization effect, should improve the accuracy of the calculated results. Besides, take A-6 system as an example, the Nernst-Einstein fitting [33,34], which neglects ionic correlations, was used to validate the simulation results here. The Nernst-Einstein relation, unlike the Einstein-Helfand relation, which is equivalent to the Green-Kubo relation at a long-time limit, is missing the cross term: D+D- [35]. Most of the ionic conductivity fitting for molten salts used the Nernst-Einstein formula, and the formula used here [33] is listed below:
  λ Z N E = e 2 k B T V ( N C l q C l 2 D C l + N L i q L i 2 D L i + N N a q N a 2 D N a + N K q K 2 D K )  
In Figure 8b, when the LiCl addition was less than 60%, the ionic conductivity increased slightly. When LiCl addition was more than 60%, the ionic conductivity increased rapidly. Therefore, in practical industrial applications, it should be noted that the addition of LiCl largely increased ionic conductivity beyond a certain concentration. Furthermore, it also showed that the ionic conductivities of molten ACl increased with the ascending temperature.

3.2.4. Shear Viscosity

Viscosities were calculated by the RNEMD method. The systems were divided into 20 slabs in the z axis, and the velocities in the “x” direction were swapped between the 1st and 11th bins [19,20,25]. Velocity profiles were equilibrated for 1 ns. Next, the momentum transferred and velocity gradient were accumulated over 10 ns to ensure the average of the velocity equilibrium. Once the system relaxed, the velocity gradient in the “x” direction was almost linear.
Different swap rates’ effect on the linearity of velocity profiles, z direction lengths’ effect on the viscosities, and the temperature dependence of velocity profiles were investigated, and the simulation conducted with optimized RNEMD parameters. It was found that momentum swap rates between 20 and 150 time steps showed good linearity velocity gradients, as illustrated in Figure 9a, and 100 was chosen. The larger ones caused a large deviation from the experimental values, as shown in Figure 9b. The z direction box length effect on the results was tested at 900 K. In Figure 10a, all the velocity profile linearity is acceptable (a slightly nonlinear of the velocity gradients will not affect the accuracy of the calculated viscosity values [19]). In Figure 10b, the results showed no obvious change beyond the 2z length in the z direction, and, taking the computation efficiency into account, 2z was picked. The temperature dependence of the velocity gradient was testified, and there is a minor effect of temperature on the linearity of the velocity gradient, as illustrated in Figure 11.
The viscosities obtained from experiments and simulations are plotted in Figure 12. Viscosities calculated by the RNEMD method are in good agreement with the experimental values. The uncertainties of simulated viscosities for A-0, A-2, A-6, and A-8 were under 7%. Since the RNEMD method underestimated viscosities by about 5.8%, 5.2%, and 5.7% for pure molten LiCl, NaCl, and KCl, respectively [26], the simulation results were satisfying. The relatively large discrepancies of A-4 and A-10 (about 20% discrepancy) could be caused by experimental errors, since the A-4 sample corroded the crucible badly and there were slags in the salts during testing. The viscosity monotonously decreased with the increasing temperature.

3.3. The Correlation between Local Structures and Properties

The hydrodynamic radius was calculated from the correlation between the self-diffusion coefficient and shear-viscosity of ionic liquids, which was an effective radius that takes solvation and coordination into account. It can be calculated according to the Stokes-Einstein correlation [39]:
  D i j = k B T 4 π η σ i j  
The results are listed in Table 6 (the crystal radii is from Ref. [40]). The hydrodynamic radius of each cation decreased significantly with LiCl addition, which indicated the hydrodynamic radius was influenced by the concentration. It seems the hydrodynamic radii of cations appeared to decrease when the imagined strength of the correlation of the cation with its coordination shell of anions weakened. With an ascending temperature, the variation in the hydrodynamic radius of each ion showed an overall increase.
It was found that for the larger, singly charged K+ and Cl- ions, which could be anticipated to be most weakly coordinated to their surroundings, the calculated radii were similar to their crystal radii. For the remaining ions, the calculated radii were significantly larger than the bare ions under a 60% LiCl concentration, and became similar beyond 60%. At an 80% LiCl concentration, the hydrodynamic radius for Li+ was still larger than for bare ions, but for Na+, it was smaller than the crystal radius under 1150 K. For the analysis, we speculated that the ions were diffusing with an intact coordination shell of the central cation, which was in agreement with the hypothesis of Morgan [34] that Li+ moves with the surrounding Cl-. Additionally, some of the coordinates were broken apart by LiCl increasing.
Next, we attempted to identify the strength of the A-Cl ionic “bonds”. Many microscopic events can contribute to the local structure, and the breaking apart of the A+ coordination shells should be involved. The stability of the ‘bond’ could be estimated using the potential of the mean force that determines the exchange of Cl with the first solvation shell of A+, and can be evaluated by [11]:
  β W e f f ( r ) = lng A Cl ( r ) 2 ln ( r r min )  
where β = 1 / k B T , and r m i n is the minimum of RDF as a constant.
As shown in Figure 13, deep first minimums appeared at the position of the corresponding first peak position of the RDF. The height between the minimum and maximum was called the energy barrier (Ebarrier), which was the energy that a coordinated Cl anion must overcome to escape. The barrier to dissociation is higher for the smaller cation, which indicates the stability as follows: Li-Cl > Na-Cl > K-Cl. The heights almost all decreased with an increasing concentration of LiCl, which is reflected in the higher self-diffusion coefficients and ionic conductivity, and smaller viscosity.

4. Conclusions

In this paper, comprehensive molecular dynamics simulations have been carried out to calculate local structure and transport properties of molten alkali chlorides ternary systems. Densities of the liquid phases obtained from simulations were underestimated by 5.7% of the experimental values. Shear viscosities calculated by the RNEMD method, as well as the ionic conductivity, were in good agreement with experimental data. The BMHFT force field combined with the Larsen combination rule and the correction factor used in this study did a reasonable job of capturing the molten phase properties of the ternary salts.
The liquid structures were fully calculated to analyze the influence of the temperature and component on the local structures of molten salts. The result suggested that ion clusters were formed in liquid as temperature increased, which has an influence on the macro-properties. The association of all ion pairs (except for Li-Li and Cl-Cl) was weakened by an increasing LiCl concentration. Therefore, the self-diffusion coefficients and ionic conductivity showed positive dependences on both the LiCl concentration and temperature, however, the shear viscosity was the opposite. By analyzing the hydrodynamic radius of each ion and the coordination stability of cations, it was speculated that ion clusters could be the cation-anion coordinated structure and affected the macro properties. In the system, the properties changed significantly beyond a 60% LiCl concentration, which should be noted in applications.

Author Contributions

Conceptualization, J.W. (Jie Wu), J.W. (Jia Wang), H.N.; Methodology, J.W. (Jie Wu); Software, J.W. (Jie Wu); H.N.; Validation, J.W. (Jia Wang), H.N.; Formal Analysis, J.W. (Jie Wu); Investigation, J.W. (Jie Wu); Resources, G.L.; Data Curation, J.W. (Jie Wu); Writing-Original Draft Preparation, J.W. (Jie Wu); Writing-Review & Editing, J.W. (Jia Wang), H.N.; Visualization, J.W. (Jie Wu); Supervision, G.L., J.Y.; Project Administration, G.L.; Funding Acquisition, G.L.

Funding

This research was funded by National Natural Science Foundation Project of China (Grant U1407202 and Grant U1407126).

Conflicts of Interest

The authors declare no conflict of interest.

Nomenclature

U ij Born-Mayer-Huggins-Tosi-Fumi potential
q i ,   q j Charge of ion i, j
r ij Distance between particle i and j
B ij ,   A ij Born-Mayer-Huggins repulsive parameters
ρ The hardness parameter
σ i ,   σ j Born-Mayer-Huggins repulsive parameters-crystal ionic radii
MAtomic mass
TTemperature of the system (units: K)
ρ density The density of the system (units: g/cm3)
k B The Boltzmann constant
D The self-diffusion coefficient
vxX component of velocity
η The shear viscosity
σ The hydrodynamic radius
iParticle i
jParticle j
rmaxThe first peak position of pair radial distribution function(units: Å)
hmaxThe first peak height of pair radial distribution function
rminThe first minimum of pair radial distribution function(units: Å)
NAverage coordination numbers

Appendix A

The temperature influence of each ion pair in different compositions systems.
Figure A1. PDFs of like cation-cation pairs in the four ternary systems (A-2, A-4, A-6, and A-8) at 900 K, 1000 K, 1100 K, 1200 K, and 1500 K.
Applsci 08 01874 g0a1
Figure A2. PDFs of unlike cation-cation pairs in the four ternary systems (A-2, A-4, A-6, and A-8) at 900 K, 1000 K, 1100 K, 1200 K, and 1500 K.
Applsci 08 01874 g0a2
Figure A3. PDFs of unlike charge pairs in the four ternary systems (A-2, A-4, A-6, and A-8) at 900 K, 1000 K, 1100 K, 1200 K, and 1500 K.
Applsci 08 01874 g0a3
Figure A4. PDFs of Cl-Cl pairs in the four ternary systems (A-2, A-4, A-6, and A-8) at 900 K, 1000 K, 1100 K, 1200 K, and 1500 K.
Applsci 08 01874 g0a4
Figure A5. The coordination numbers distribution of four compositions at various temperatures: Li-Cl.
Applsci 08 01874 g0a5
Figure A6. The coordination numbers distribution of four compositions at various temperatures: Na-Cl.
Applsci 08 01874 g0a6
Figure A7. The coordination numbers distribution of four compositions at various temperatures: K-Cl.
Applsci 08 01874 g0a7
Figure A8. ADF samples of Cl-Li-Cl, Cl-Na-Cl, and Cl-K-Cl of four typical systems at different temperatures.
Applsci 08 01874 g0a8

References

  1. Kim, H.; Boysen, D.A.; Newhouse, J.M.; Spatocco, B.L.; Chung, B.; Burke, P.J.; Bradwell, D.J.; Jiang, K.; Tomaszowska, A.A.; Wang, K. Liquid metal batteries: Past, present, and future. Chem. Rev. 2012, 113, 2075–2099. [Google Scholar] [CrossRef] [PubMed]
  2. Suo, L.; Hu, Y.S.; Li, H.; Armand, M.; Chen, L. A new class of Solvent-in-Salt electrolyte for high-energy rechargeable metallic lithium batteries. Nat. Commun. 2013, 4, 1481. [Google Scholar] [CrossRef] [PubMed] [Green Version]
  3. Salanne, M. Ionic Liquids for Supercapacitor Applications. Top. Curr. Chem. 2017, 375, 63. [Google Scholar] [CrossRef] [PubMed]
  4. Myers, P.D.; Goswami, D.Y. Thermal energy storage using chloride salts and their eutectics. App. Therm. Eng. 2016, 109, 889–900. [Google Scholar] [CrossRef]
  5. Rollet, A.-L.; Salanne, M. Studies of the local structures of molten metal halides. Annu. Rep. Sec. C 2011, 107, 88–123. [Google Scholar] [CrossRef]
  6. Endoh, A.; Okada, I. Internal Cation Mobilities in the Molten Ternary System (Li,Na,K)Cl of the Eutectic Composition. Zeitschrift Für Naturforschung A 1988, 43, 638–642. [Google Scholar] [CrossRef]
  7. Matsumiya, M.; Shin, W.; Izu, N.; Murayama, N. Investigation on the electrical properties of molten quaternary systems (Li, Na, K, Cs)Cl and (Li, Na, K, Cs)F by MD simulation. J. Electroanal. Chem. 2002, 528, 103–113. [Google Scholar] [CrossRef]
  8. Matsumiya, M.; Takagi, R. Temperature dependence of the electric properties of molten ternary chlorides by MD simulation. J. Electroanal. Chem. 2002, 529, 28–33. [Google Scholar] [CrossRef]
  9. Okamoto, Y.; Suzuki, S.; Shiwaku, H.; Ikedaohno, A.; Yaita, T.; Madden, P.A. Local Coordination about La3+ in Molten LaCl3 and Its Mixtures with Alkali Chlorides. J. Phys. Chem. A 2010, 114, 4664–4671. [Google Scholar] [CrossRef] [PubMed]
  10. Rollet, A.-L.; Salanne, M.; Groult, H. Structural effects on the electrical conductivity of molten fluorides: Comparison between LiF–YF3 and LiF–NaF–ZrF4. J. Fluor. Chem. 2012, 134, 44–48. [Google Scholar] [CrossRef]
  11. Corradini, D.; Madden, P.A.; Salanne, M. Coordination numbers and physical properties in molten salts and their mixtures. Faraday Discuss. 2016, 190, 471–486. [Google Scholar] [CrossRef] [PubMed]
  12. Manga, V.R.; Swinteck, N.; Bringuier, S.; Lucas, P.; Deymier, P.; Muralidharan, K. Interplay between structure and transport properties of molten salt mixtures of ZnCl2-NaCl-KCl: A molecular dynamics study. J. Chem. Phys. 2016, 144, 094501. [Google Scholar] [CrossRef] [PubMed]
  13. Wu, J.; Wang, J.; Ni, H.; Lu, G.; Yu, J. The influence of NaCl concentration on the (LiCl-KCl) eutectic system and temperature dependence of the ternary system. J. Mol. Liq. 2018, 253, 96–112. [Google Scholar] [CrossRef]
  14. Plimpton, S. Fast Parallel Algorithms for Short-Range Molecular Dynamics. J. Comput. Phys. 1995, 117, 1–19. [Google Scholar] [Green Version]
  15. Wang, J.; Sun, Z.; Lu, G.; Yu, J. Molecular dynamics simulations of the local structures and transport coefficients of molten alkali chlorides. J. Phys. Chem. B 2014, 118, 10196–10206. [Google Scholar] [CrossRef] [PubMed]
  16. Wang, J.; Wu, J.; Sun, Z.; Lu, G.; Yu, J. Molecular dynamics study of the transport properties and local structures of molten binary systems (Li, Na)Cl, (Li, K)Cl and (Na, K)Cl. J. Mol. Liq. 2015, 209, 498–507. [Google Scholar] [CrossRef]
  17. Wang, J.; Wu, J.; Lu, G.; Yu, J. Molecular dynamics study of the transport properties and local structures of molten alkali metal chlorides. Part III. Four binary systems LiCl-RbCl, LiCl-CsCl, NaCl-RbCl and NaCl-CsCl. J. Mol. Liq. 2017, 238, 236–247. [Google Scholar] [CrossRef]
  18. Tenney, C.M.; Maginn, E.J. Limitations and recommendations for the calculation of shear viscosity using reverse nonequilibrium molecular dynamics. J. Chem. Phys. 2010, 132, 014103. [Google Scholar] [CrossRef] [PubMed]
  19. Müller-Plathe, F. Reversing the perturbation in nonequilibrium molecular dynamics: An easy way to calculate the shear viscosity of fluids. Phys. Rev. E 1999, 59, 4894–4898. [Google Scholar] [CrossRef] [Green Version]
  20. Ding, J.; Pan, G.; Du, L.; Lu, J.; Wang, W.; Wei, X.; Li, J. Molecular dynamics simulations of the local structures and transport properties of Na2CO3 and K2CO3. Appl. Energy 2017. [Google Scholar] [CrossRef]
  21. Cheng, J.H.; Zhang, P.; An, X.H.; Wang, K.; Zuo, Y.; Yan, H.W.; Li, Z. A device for measuring the density and liquidus temperature of molten fluorides for heat transfer and storage. Chin. Phys. Lett. 2013, 30, 126501. [Google Scholar] [CrossRef]
  22. Lv, X.; Dong, A.; Dai, Y.; Wang, J.; Shu, D.; Sun, B. Temperature and concentration dependence of the physical properties and local structures of molten NaCl-KCl-LiCl mixtures. J. Mol. Liq. 2017, 229, 330–338. [Google Scholar] [CrossRef]
  23. Fairbanks, M.; McGreevy, R.L.; Mitchell, E.W.J. Depolarisation ratios for Raman scattering from molten alkali and alkaline-earth halides. J. Phys. C Solid State Phys. 1986, 19, L53. [Google Scholar] [CrossRef]
  24. Kittel, C. Introduction to Solid State Physics; Wiley: New York, NY, USA, 2005. [Google Scholar]
  25. Ding, J.; Pan, G.; Du, L.; Lu, J.; Wei, X.; Li, J.; Wang, W.; Yan, J. Theoretical prediction of the local structures and transport properties of binary alkali chloride salts for concentrating solar power. Nano Energy 2017, 39, 380–389. [Google Scholar] [CrossRef]
  26. Pan, G.C.; Ding, J.; Wang, W.; Lu, J.; Li, J.; Wei, X. Molecular simulations of the thermal and transport properties of alkali chloride salts for high-temperature thermal energy storage. Int. J. Heat Mass Transf. 2016, 103, 417–427. [Google Scholar] [CrossRef]
  27. Bockris, J.O.M.; Hooper, G.W. Self-diffusion in molten alkali halides. Discuss. Faraday Soc. 1961, 32, 218–236. [Google Scholar] [CrossRef]
  28. Bockris, J.O.M.; Richards, S.R.; Nanis, L. Self-Diffusion and Structure in Molten Group II Chlorides1. J. Phys. Chem. 1965, 69, 1627–1637. [Google Scholar] [CrossRef]
  29. Fürth, R. On the theory of the liquid state: I. The statistical treatment of the thermodynamics of liquids by the theory of holes. Math. Proc. Cambridge Phil. Soc. 1941, 37, 252–275. [Google Scholar] [CrossRef]
  30. Bengtson, A.; Nam, H.O.; Saha, S.; Sakidja, R.; Morgan, D. First-principles molecular dynamics modeling of the LiCl–KCl molten salt system. Comput. Mater. Sci. 2014, 83, 362–370. [Google Scholar] [CrossRef]
  31. Frenkel, D.; Smit, B. Understanding Molecular Simulation: From Algorithms to Applications; Academic Press, Inc.: New York, NY, USA, 1996. [Google Scholar]
  32. Chrenková-Paučírová, M. Electrical conductivity of molten LiCl—NaCl—KCl and LiCl—NaCl—KCl—AICImixtures. Chem. Pap. 1979, 34, 433–440. [Google Scholar]
  33. Dewan, L.C.; Simon, C.; Madden, P.A.; Hobbs, L.W.; Salanne, M. Molecular dynamics simulation of the thermodynamic and transport properties of the molten salt fast reactor fuel LiF–ThF4. J. Nucl. Mater. 2013, 434, 322–327. [Google Scholar] [CrossRef]
  34. Morgan, B.; Madden, P.A. Ion mobilities and microscopic dynamics in liquid (Li,K)Cl. J. Chem. Phys. 2004, 120, 1402–1413. [Google Scholar] [CrossRef] [PubMed]
  35. Ma, J.; Zhang, Z.; Xiang, Y.; Cao, F.; Sun, H. On the prediction of transport properties of ionic liquid using 1-n-butylmethylpyridinium tetrafluoroborate as an example. Mol. Simul. 2017, 43, 1–11. [Google Scholar] [CrossRef]
  36. Janz, G.J.; Dampier, F.W.; Lakshminarayanan, G.R.; Lorenz, P.K.; Tomkins, R.P.T. Molten salts: Volume i. electrical conductance, density, and viscosity data. J. Phys. Chem. Ref. Data 1968, 6, 409–596. [Google Scholar] [CrossRef]
  37. Janz, G.J.; Tomkins, R.P.T.; Allen, C.B.; Downey, J.R.; Garner, G.L.; Krebs, U.; Singer, S.K. Molten salts: Volume 4, part 2, chlorides and mixtures—Electrical conductance, density, viscosity, and surface tension data. J. Phys. Chem. Ref. Data 1975, 4, 871–1178. [Google Scholar] [CrossRef]
  38. Wakao, M.; Minami, K.; Nagashima, A. Viscosity measurements of molten LiCl in the temperature range 886–1275 K. Int. J. Thermophys. 1991, 12, 223–230. [Google Scholar] [CrossRef]
  39. Brookes, R.; Davies, A.; Ketwaroo, G.; Madden, P.A. Diffusion coefficients in ionic liquids: Relationship to the viscosity. J. Phys. Chem. B 2005, 109, 6485–6490. [Google Scholar] [CrossRef] [PubMed]
  40. Tosi, M.P.; Fumi, F.G. Ionic sizes and born repulsive parameters in the NaCl-type alkali halides—II. J. Phys. Chem. Solids 1964, 25, 45–52. [Google Scholar] [CrossRef]
Figure 1. The experimental set-up for density.
Applsci 08 01874 g001
Figure 2. PDFs of four ternary systems (A-2, A-4, A-6, A-8) at 1100 K.
Applsci 08 01874 g002
Figure 3. The coordination numbers distribution of four compositions at 1100 K for Li-Cl, Na-Cl, K-Cl, respectively.
Applsci 08 01874 g003
Figure 4. Snapshot of A-2 at 1100 K from molecular dynamics (MD) simulation.
Applsci 08 01874 g004
Figure 5. Angular distribution function (ADF) samples of Cl-A-Cl of four typical systems at 1100 K.
Applsci 08 01874 g005
Figure 6. Comparison of simulated and experimental liquid densities with the linear fit formula of simulated density appending.
Applsci 08 01874 g006
Figure 7. Surface map of simulated density results.
Applsci 08 01874 g007
Figure 8. (a) Time evolution of the charge flux auto-correlation function (ACF) and the running integral for molten A-6 systems at 900 K. (b) The ionic conductivity of six typical systems compared with the pure salts experimental values [36] and Nerst-Einstein equation fitting [33].
Applsci 08 01874 g008
Figure 9. The swap rate influence on the A-0 at 1200 K. (a) Velocity profile of different swap rates. (b) The corresponding viscosities (Exp-fit data was obtained from [37].)
Applsci 08 01874 g009
Figure 10. The influence of the z direction length on A-0 at 900 K. (a) Velocity profile of different z lengths. (b) The corresponding viscosities (Exp-fit is fitting by the Arrhenius equation based on the data obtained from [37], R2 = 1.00).
Applsci 08 01874 g010
Figure 11. Velocity profile of A-0 at different temperatures.
Applsci 08 01874 g011
Figure 12. The experimental and simulated values for A-0, A-2, A-4, A-6, A-8 and A-10 at different temperature(Ref * indexed [37]; Ref ** indexed [38]).
Applsci 08 01874 g012
Figure 13. The potential of the mean force for breaking the A+-Cl ‘bond’ in the various systems at 1100 K.
Applsci 08 01874 g013
Table 1. Potential parameters for different pairs in the ternary systems.
Ion PairsLi-LiLi-NaLi-KLi-ClNa-NaNa-KNa-ClK-KK-ClCl-Cl
B/eV0.44250.33380.33380.29050.26410.26410.21130.26410.21130.1584
σ/Å1.6321.9862.2792.4012.3402.6332.7552.9263.0483.170
C/eV·Å60.045630.21890.83241.2501.0503.9937.00015.1930.00See below
D/eV·Å60.018750.093750.53131.5000.50002.7388.68815.0045.63
Mol Fraction of LiCl (%)020406080100
ρ/Å0.30030.30320.30610.30910.31210.3151
CCl-Cl/eV·Å675.1273.9872.8371.6970.5369.38
DCl-Cl/eV·Å6150.9148.6146.3144141.7139.4
Table 2. Systems of different components.
Mol Fraction of LiCl 0 (A–0)0.2 (A–2)0.4 (A–4)0.6 (A–6)0.8 (A–8)1 (A–10)
Total number of ions200020002000200020002000
Number of Li+02004006008001000
Number of Na+5064043022001000
Number of K+4943962982001000
Number of Cl100010001000100010001000
Table 3. Structural parameters for six typical ternary systems at 1100 K.
1100 KxLiClLi-ClNa-ClK-ClLi-LiLi-NaLi-KNa-NaNa-KK-KCl-Cl
rmaxA-0-2.643.03---4.054.364.434.22
A-22.292.653.033.743.954.134.134.344.564.13
A-42.292.643.043.713.934.134.114.424.623.91
A-62.282.663.063.803.904.194.184.554.813.85
A-82.292.653.083.773.964.144.214.554.783.79
A-102.30--3.85-----3.75
hmaxA-0-4.753.62---1.811.741.661.73
A-26.114.373.351.751.851.841.771.711.621.74
A-45.403.993.091.821.811.761.721.671.601.84
A-64.953.612.811.841.821.761.691.601.501.92
A-84.363.272.531.771.741.691.731.511.441.98
A-104.62--1.74-----2.04
rminA-0-4.224.54---6.246.606.996.63
A-23.614.134.555.565.876.336.336.646.946.23
A-43.713.914.525.535.846.146.166.556.865.94
A-63.674.054.425.495.886.156.136.667.025.63
A-83.634.044.465.435.806.335.926.276.655.44
A-103.57--5.46-----5.39
N(rmin)A-0-4.745.54---6.487.468.5515.02
A-23.894.815.811.904.725.655.686.377.1813.23
A-44.104.706.124.163.764.345.735.035.6312.67
A-64.165.046.076.592.693.123.043.724.2611.82
A-84.275.316.559.351.421.811.481.691.9411.64
A-104.21--12.38-----12.38
Table 4. Linear fit of the simulated density for six typical systems (900 K–1200 K).
CompositionSlopeInterceptPureSlopeIntercept
A-0−5.66 × 10−42.03415LiCl−4.32 × 10−41.79683
A-2−5.41 × 10−42.00025
A-4−5.15 × 10−41.96612NaCl−5.00 × 10−41.99361
A-6−4.89 × 10−41.92813
A-8−4.62 × 10−41.89015KCl−5.43 × 10−41.94981
A-10−4.33 × 10−41.84863
Table 5. Self-diffusion coefficients for six typical compositions at various temperatures.
Temp/Comp900 K950 K1000 K1050 K1100 K1150 K1200 K
All (10−9 m2/s)A-03.654.225.056.026.988.339.19
A-23.614.385.276.247.068.159.31
A-44.034.945.866.677.528.599.61
A-64.465.216.327.148.239.8010.09
A-84.815.926.787.858.6010.1511.45
A-105.546.527.808.949.9811.2712.32
Li+ (10−9 m2/s)A-23.374.645.306.217.298.667.91
A-44.155.076.026.987.958.969.45
A-64.495.536.717.708.7310.8210.32
A-85.396.867.419.079.4911.3012.64
A-106.257.709.4610.0411.4113.2314.42
Na+ (10−9 m2/s)A-03.434.314.915.936.878.049.08
A-23.564.205.236.057.168.329.57
A-44.195.066.496.567.679.829.92
A-64.555.636.367.189.6510.319.87
A-86.236.947.699.0010.3110.1612.06
K+ (10−9 m2/s)A-03.714.225.116.026.808.309.00
A-23.734.114.997.146.958.209.58
A-43.945.165.926.397.748.679.78
A-64.955.736.177.377.3610.299.96
A-85.295.818.307.258.4410.1712.46
Cl (10−9 m2/s)A-03.744.185.106.067.128.499.34
A-23.644.505.395.987.027.959.38
A-43.964.805.596.677.248.049.53
A-64.334.846.116.747.838.9810.03
A-84.165.086.046.817.739.2210.32
A-104.825.356.137.858.549.3110.22
Table 6. Hydrodynamic radii of the ions in different systems at different temperatures.
IonsCrystal Radius (Å)Temperature (K)Hydrodynamic Radius (Å)
A-0A-2A-4A-6A-8A-10
Li+0.816900-1.5081.3521.2571.0790.931
950-1.3651.2431.2831.0720.908
1000-1.5011.3481.2301.1560.898
1050-1.4731.4061.2441.1091.001
1100-1.5141.4381.3431.2401.011
1150-1.4901.5291.2361.1861.016
1200-1.9561.6091.5151.2081.070
Na+1.1709001.3731.4301.3391.2390.933-
9501.3611.5071.2471.2601.060-
10001.5051.5201.2501.2971.113-
10501.4811.5111.4981.3331.117-
11001.5301.5421.4901.2151.142-
11501.5131.5511.3961.2971.319-
12001.6271.6161.5321.5841.266-
K+1.4639001.2691.3621.4241.1381.098-
9501.3881.5391.2211.2371.265-
10001.4461.5931.3711.3371.032-
10501.4591.2811.5361.3001.386-
11001.5451.5891.4771.5931.394-
11501.4661.5731.5821.2991.318-
12001.6411.6141.5551.5691.225-
Cl1.5859001.2591.3991.4181.3011.3971.208
9501.4031.4081.3141.4661.4461.306
10001.4481.4761.4521.3511.4181.385
10501.4511.5291.4731.4201.4761.281
11001.4771.5731.5781.4981.5231.351
11501.4331.6221.7041.4891.4531.445
12001.5821.6481.5951.5581.4791.509

