Multidimensional Optimal Droop Control for DC Microgrids in Military Applications


1
Department of Electrical & Computer Engineering, Michigan Technological University, Houghton, MI 49931, USA
2
Rocky Mountain Institute, Boulder, CO 80302, USA
3
Depatment of Mechanical Engineering & Engineering Mechanics, Michigan Technological University, Houghton, MI 49931, USA
*
Author to whom correspondence should be addressed.
Appl. Sci. 2018, 8(10), 1966; https://doi.org/10.3390/app8101966
Submission received: 30 September 2018
/
Revised: 12 October 2018
/
Accepted: 16 October 2018
/
Published: 18 October 2018
(This article belongs to the Special Issue DC & Hybrid Micro-Grids)
Abstract
:Reliability is a key consideration when microgrid technology is implemented in military applications. Droop control provides a simple option without requiring communication between microgrid components, increasing the control system reliability. However, traditional droop control does not allow the microgrid to utilize much of the power available from a solar resource. This paper applies an optimal multidimensional droop control strategy for a solar resource connected in a microgrid at a military patrol base. Simulation and hardware-in-the-loop experiments of a sample microgrid show that much more power from the solar resource can be utilized, while maintaining the system’s bus voltage around a nominal value, and still avoiding the need for communication between the various components.
1. Introduction
The microgrid concept is increasingly being investigated and implemented in military contexts. Research has been conducted on the topic of implementing microgrids at fixed military installations within the United States [1,2]. This paper will focus on the application of microgrid technologies in support of overseas military expeditionary or contingency operations. Specific examples include intermediate staging bases (ISB), forward operating bases (FOB), combat outposts (COP), observation posts (OP), and patrol bases (PB) [3,4,5]. These may be permanent or temporary bases used by the military while on assignment in foreign countries. This paper will include a demonstration of a COP with a size of 20–40 people, so this type of microgrid will be considered here.
There are several challenges when considering microgrids for military applications. First, the COPs may be somewhat temporary, so equipment that can be easily transported to the location, then moved to future locations is important to consider for equipment selection, but the energy cost of transportation is outside the scope of this paper. Reliability is especially important in military microgrids, since many lives depend on the consistent operation of the electrical equipment at the COP [6]. Minimizing the use of fuel is also critical, as transporting fuel to the COP can cost $400 per gallon [7], and can be dangerous, resulting in the loss of one life for every 24 fuel convoys in Iraq and Afghanistan in 2007 [8].
Including renewable resources can help reduce the amount of fuel needed, and energy storage can be included to increase the reliability of the system. Assessing the amount of storage needed for energy surety has been previously studied [9,10]. Using the improved droop control methods presented in this paper can allow a military microgrid to utilize as much renewable resources as possible, without relying on a communication link between the microgrid components—this eliminates the electrical system communications as a single source of failure that would be especially vulnerable in a military setting.
Previous work has demonstrated the use of multidimensional [11] optimal [12] droop control with wind resources, in a residential microgrid setting. This paper expands upon previous work, applying multidimensional optimal droop control with solar resources. A load model for a typical patrol base is presented, and used in simulation of a military microgrid example to demonstrate the proposed controller.
2. Load Modeling
In a military setting, the load on the microgrid is different than in a residential or commercial setting. A load model for a patrol base (PB) was developed with the help of an experienced member of the military [13]. First, three load tiers were identified to distinguish between loads that may be connected at a PB. Tier 1 includes loads that are critical to the mission, while Tier 2 includes loads that are important for extended operations. Tier 3 includes loads for improving quality of life and boosting morale. The loads in Tier 3 are important for maintaining the living conditions and overall attitudes for the PB members, however they could be disconnected during some time periods in order to ensure that Tier 1 and 2 loads are met. Table 1 lists some examples of equipment that might be included in each load tier.
The amount of load needed in each tier varies based on time (day vs. night) as well as on activity (patrol vs. non-patrol). Table 2 shows the estimated load for a 20–40 person PB in each of these scenarios.
The estimates shown in Table 2 are for the total load used in each different type of scenario. The actual load is stochastic and will vary, so it was modeled using a compound Poisson process. A Poisson process is defined as
where is the rate parameter. The Poisson process is then implemented in a compound Poisson process as
where are independent and identically distributed (iid) random variables [14]. A compound Poisson process is an appropriate method for approximating the distribution of electrical loads, since they are discrete, independent random variables [15].
Along with the load changing stochastically within each time and activity, the operation of the PB will also vary. In any combat environment, varying patrol patterns (route, length of patrol, time of departure, etc.) are used in order to limit the enemy’s ability to execute a coordinated attack. Therefore, this load model also randomizes the number of patrols per day, their length, and the length of rest during both day and night. Some days may then include no patrols, to allow for debriefing or rest. Other days may include a high number of patrols, designed to limit the enemy’s ability to operate. An example patrol schedule for two squads during one day and one night is shown in Table 3; the patrol schedule is randomized for other days and nights.
A load model incorporating all of these aspects was created using Matlab. Figure 1 shows the load at a PB over one day, based on a changing patrol schedule and using a compound Poisson process to randomize the load. Each load tier is displayed in the figure. This load model is implemented in simulation and HIL in the following sections.
3. Source Modeling
For a military application, it is likely that solar would be included as a renewable resource, instead of wind. Like wind resources, solar resources are intermittent and depend on weather conditions. The accurate prediction of solar irradiance is currently an important research area [16].
For military applications, portability is a key consideration [17], and the use of solar resources fits this requirement. Previous research has been completed on the inclusion of solar resources in military forward operating bases [18]. In this section, the proposed optimal high dimension droop control will be applied with a solar resource; only applications with wind resources have been demonstrated in previous chapters.
Solar irradiance measurements are taken each minute by the National Renewable Energy Laboratory (NREL). These are recorded at their Golden, CO location and stored as part of the Baseline Measurement System (BMS). The data for 1 June 2012 is used in simulation and HIL in the following sections, and is shown in Figure 2 [19].
4. Simulation Results
The sample microgrid used in simulation for a PB is shown in Figure 3. Three sources are included; one is a solar resource, one is a conventional resource such as a diesel generator, and one is an energy storage source such as a battery. In the simulation, these sources are modeled as variable voltage sources, and droop control is implemented for each. The numeric values used for this microgrid model are shown in Table 4.
A simulation was completed to represent one full day at the PB. The power available from solar energy at each minute of the day is shown in Figure 4a. The data described in the previous section is used, assuming that there are 4 square meters of solar panels available. The required load at each minute is shown in Figure 4b, with the three load tiers described above added together to form the total required load.
The system was first simulated using traditional, linear droop control for each of the three sources, where the reference current is defined as
The droop control settings for each of the three sources are shown in Table 5.
The power supplied by each of the three sources during the simulated one day period is shown in Figure 5. When it is sunny during the day, the solar source operates with traditional droop control, and does not use all of the available power. The conventional source is required to meet most of the load demand. The storage source supplies and absorbs power throughout the day as the load changes.
The simulation was then repeated using optimal high dimension droop control for the solar resource. Its reference current is defined as [12]
where s is the solar irradiance in W/m multiplied by the 4 m of panels. The conventional and storage sources kept the same droop settings as in Table 5 for the second simulation.
The power supplied by each of the three sources during the simulated one day period is shown in Figure 6. With optimal high dimension droop control, all of the available power from the solar resource is utilized. This means that the conventional source is required to provide less power to the system. The storage source changes during the sunny part of the day, and supplies power as needed during the night.
A comparison of Figure 5 and Figure 6 shows that the use of traditional linear droop control limits the amount of power that can be utilized from the solar resource, while the use of optimal high dimension droop control allows all of the available power from that resource to be utilized. This also means that the conventional source is needed less, and the storage source is able to charge during times of high irradiance, and use that stored energy during cloudy periods or at night.
The bus voltage during each of the two simulations is shown in Figure 7. While the bus voltage varies more when optimal high dimension droop control is used, it stays well within a bound of 5% around the reference value of 300 V.
5. Hardware-In-The-Loop Results
In order to validate the simulation results presented in the previous section, the example microgrid shown in Figure 8 was implemented using a hardware-in-the-loop (HIL) system, allowing the system to be emulated in software, and connected with real world hardware in real time [20]. Using an HIL approach allows the system to be built and tested virtually with new proposed control methods, while interfacing with real hardware [21].
The same component values were implemented in the simulation, and in a Typhoon HIL600 unit. The HIL experimental apparatus is shown in Figure 9. The Typhoon HIL600 has 32 channels of ±5 V analog output (AO) that can be mapped to data points in the HIL circuit. The microgrid control board then offsets and scales these signals to 0 V to V that are read by the 12-bit analog to digital converters on all three DSPs. For this example, only 5 channels of analog signals are needed to implement the proposed control. The analog signals and the scaling from the HIL are shown in Table 6.
The microgrid control board has BNC connectors linked with the first four analog output channels that are convenient to connect to an oscilloscope. For this work, the first three channels were used to view the first three signals in Table 6, and capture the results in oscilloscope traces.
The controller for each source was implemented on a separate Texas Instruments F28335 DSP ContolCARD [22] programmed through the Embedded Coder toolbox in MATLAB/Simulink. The control card for Source 1 implements (4), while the card for Source 2 implements (3), each using a PID control loop. By using separate control cards for each of the two sources, decentralized control is ensured; each source uses only local information, and the proposed control method does not require a communication link between the sources and/or the other components in the microgrid.
This microgrid has the same topology as the one implemented in the simulation. However, for the HIL experiment, power electronics were included, along with parasitic inductances and capacitances. To represent the variable load, a controllable current source was included. This type of load is comparable to an inductive or motor load in an actual system. The numeric values used for the circuit parameters are shown in Table 7 and Table 8.
The system was implemented on a Typhoon HIL600 unit using distributed control through Texas Instruments F28335 DSP ContolCARDs. Each of the three sources is controlled using a separate TI card, using only local sensors. The circuit schematic used in the Typhoon software is shown in Figure 10.
The controllers implemented for each of the three sources are shown in Figure 11, Figure 12 and Figure 13. Sources 2 and 3, representing a conventional and energy storage source, respectively, are controlled using traditional linear droop control. Source 1, representing a solar source, is controlled using optimal high dimension droop control as in (4).
Due to the limitations of the HIL system, a short overall time period was used, and the per-minute solar and load information was scaled. The profiles for power available from the solar resource and required load current are shown in Figure 14. The solar irradiance data is taken from the NREL BMS measurements from 1 June 2012, starting at 11:00 a.m.
The results of implementing these profiles in the HIL system are shown in Figure 15. The bus voltage is shown, along with the current supplied from each of the three sources—all three use the same zero point on the oscilloscope trace. As the power available from the sun and the required load change, the conventional and storage sources change their output based on traditional linear droop control. Source 1 changes its output based on optimal high dimension droop control, where the reference current is determined by (4).
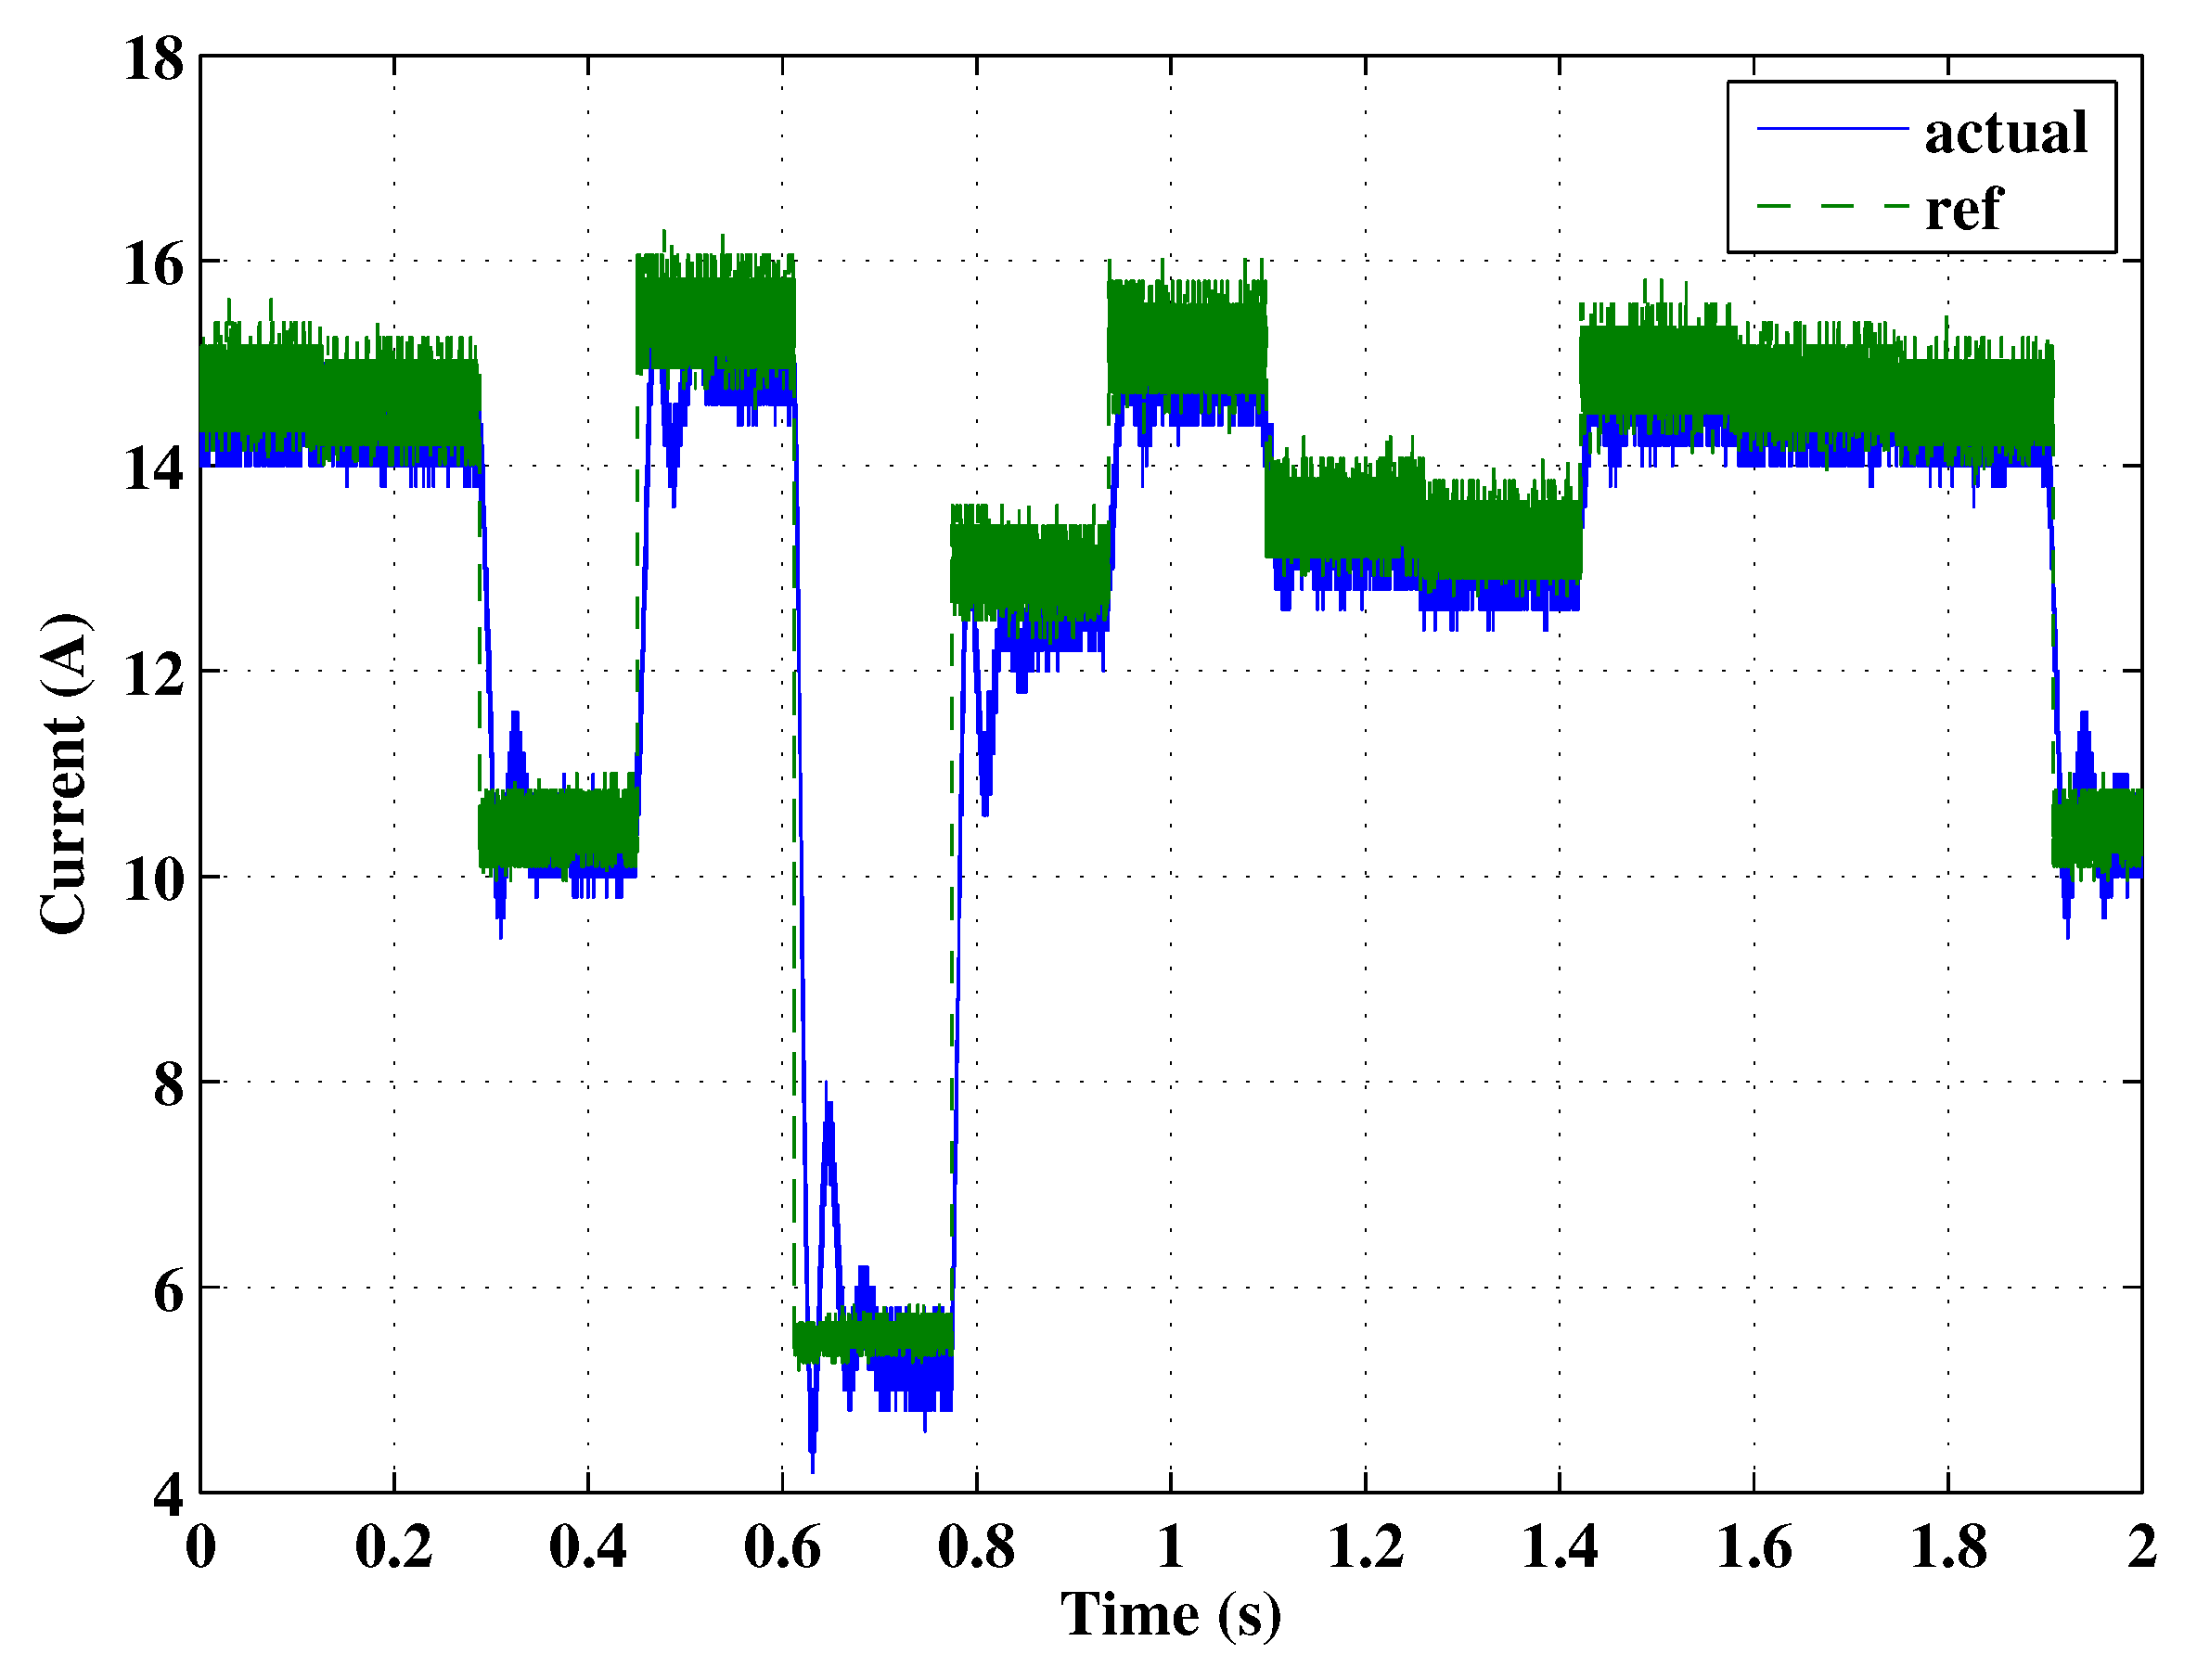
In order to verify that the proposed controller is operating as desired, data from the oscilloscope trace in Figure 15 was imported and plotted using MATLAB. The bus voltage and solar power available were used in (4) to calculate the reference current that Source 1 should be supplying. This reference current is plotted with the actual Source 1 current in Figure 16. The source output does match the desired reference value calculated using optimal high dimension droop control.
6. Conclusions
The results presented in this paper show that the droop control relationship for a source in a DC microgrid can be optimized to meet a given objective. An example microgrid was simulated and demonstrated through HIL, and the results show that a droop control relationship can be chosen to allow the power supplied by a source to match the power available from the solar PV resource.
This control method retains the advantages of traditional droop control, and does not require a communication link between the system components. It also allows all of the power available from solar PV resource to be utilized, which is an improvement over traditional droop control, and over high dimension droop control using a plane. The droop control surface is optimized for general operation of the system—it is not necessary to know the expected solar irradiance and load profiles in order to determine the surface shape.
Author Contributions
Conceptualization, K.J.B., M.D.C., W.W.W. and G.G.P.; Formal analysis, K.J.B.; Investigation, K.J.B. and M.D.C.; Methodology, K.J.B., M.D.C., W.W.W. and G.G.P.; Supervision, W.W.W.; Writing—original draft, K.J.B.; Writing—review & editing, M.D.C., W.W.W. and G.G.P.
Funding
This work was supported by a National Science Foundation Graduate Research Fellowship (DGE-1051031), and the Army Research Laboratory (W911NF-13-2-0024).
Conflicts of Interest
The authors declare no conflict of interest.
References
- Johnson, M.D.; Ducey, R.A. Overview of U.S. Army microgrid efforts at fixed installations. In Proceedings of the 2011 IEEE Power and Energy Society General Meeting, Detroit, MI, USA, 24–29 July 2011. [Google Scholar]
- Skowronska-Kurec, A.G.; Eick, S.T.; Kallio, E.T. Demonstration of microgrid technology at a military installation. In Proceedings of the 2012 IEEE Power and Energy Society General Meeting, San Diego, CA, USA, 22–26 July 2012. [Google Scholar]
- United States Army Corps of Engineers. Base Camp Development in the Theater of Operations. EP 1105-3-1; 2009. Available online: https://www.publications.usace.army.mil/Portals/76/Publications/EngineerPamphlets/EP_1105-3-1.pdf (accessed on 16 October 2018).
- United States Army; United States Marine Corps. Base Camps; ATP 3-37.10/MCRP 3-17.7N; CreateSpace Independent Publishing Platform: Scotts Valley, CA, USA, 2013.
- United States Army. Infantry Small-Unit Mountain Operations. ATTP 3-21.50; 2011. Available online: https://www.adlibris.com/fi/kirja/infantry-small-unit-mountain-operations-attp-3-2150-9781480119932 (accessed on 16 October 2018).
- Hartranft, T.J.; Yeboah, F.; Grady, D.; Ducey, R. Energy Security and Independence for Military Installations: Candidate Mission-Focused Vision and Policy Measures. In Proceedings of the 1st Army Installation Energy Security and Independence Conference, Long Beach, CA, USA, 27–30 June 2007; pp. 1–28. [Google Scholar]
- Rosenthal, U.S. Military Orders Less Dependence on Fossil Fuels. 2010. Available online: http://www.nytimes.com/2010/10/05/science/earth/05fossil.html (accessed on 16 October 2018).
- Eady, D.S.; Siegel, S.B.; Bell, R.S.; Dicke, S.H. Sustain the Mission Project: Casualty Factors for Fuel and Water Resupply Convoys; Army Environmental Policy Institute: Herndon, VI, USA, 2007; pp. 1–28. [Google Scholar]
- Vallem, M.R.; Jensen, D.; Mitra, J. Reliability evaluation and need based storage assessment for surety microgrids. In Proceedings of the 2006 38th North American Power Symposium, Carbondale, IL, USA, 17–19 September 2006; pp. 29–33. [Google Scholar]
- Mitra, J.; Vallem, M.R. Determination of storage required to meet reliability guarantees on island-capable microgrids with intermittent sources. IEEE Trans. Power Syst. 2012, 27, 2360–2367. [Google Scholar] [CrossRef]
- Bunker, K.J.; Weaver, W.W. Multidimensional droop control for wind resources in dc microgrids. IET Gener. Trans. Distrib. 2017, 11, 657–664. [Google Scholar] [CrossRef]
- Bunker, K.J.; Weaver, W.W. Multidimensional droop control for wind resources in dc microgrids. Energies 2018, 11, 1818. [Google Scholar] [CrossRef]
- Cook, M. Preliminary report on ARL project. In Proceedings of the 6th Northumbria International Conference on Performance Measurement in Libraries and Information Services, Northumbria, UK, 22–25 July 2013; pp. 1–10. [Google Scholar]
- Bowers, N.L.; Gerger, H.U.; Hickman, J.C.; Jones, D.A.; Nesbitt, C.J. Actuarial Mathematics; Society of Actuaries: Schaumburg, IL, USA, 2007. [Google Scholar]
- Hu, Z.; Wang, X. A probabilistic load flow method considering branch outages. IEEE Trans. Power Syst. 2006, 21, 507–514. [Google Scholar] [CrossRef]
- Salcedo-Sanz, S.; Casanova-Mateo, C.; Munoz-Mari, J.; Camps-Valls, G. Prediction of daily global solar irradiation using temporal gaussian processes. IEEE Geosci. Remote Sens. Lett. 2014, 11, 1936–1940. [Google Scholar] [CrossRef]
- Trautz, K.M.; Jenkins, P.P.; Walters, R.J.; Scheiman, D.; Hoheisel, R.; Tatvarti, R.; Chan, R.; Miyamoto, H.; Adam, J.G.J.; Elarde, V.C.; et al. Mobile solar power. IEEE J. Photovolt. 2013, 3, 535–541. [Google Scholar] [CrossRef]
- Tyner, J.; Coates, M.; Holloway, D.; Goldsmith, K.; Daniels, C.; Vranicar, T.; Roling, J.; Jensen, D.; Mundy, A.; Peterson, B. The design of a portable and deployable solar energy system for deployed military applications. In Proceedings of the Systems and Information Engineering Design Symposium (SIEDS), Charlottesville, VI, USA, 29 April 2011; pp. 50–53. [Google Scholar]
- National Renewable Energy Laboratory. Solar Radiation Research Laboratory Historical Data. 2014. Available online: http://www.nrel.gov/midc/srrl_bms/ (accessed on 16 October 2018).
- Ivanovic, Z.R.; Adzic, E.M.; Vekic, M.S.; Grabic, S.U.; Celanovic, N.L.; Katic, V.A. HIL evaluation of power flow control strategies for energy storage connected to smart grid under unbalanced conditions. IEEE Trans. Power Electron. 2012, 27, 4699–4710. [Google Scholar] [CrossRef]
- Yousefpoor, N.; Azidehak, A.; Bhattacharya, S.; Parkhideh, B.; Celanovic, I.; Genic, A. Real-time hardware-in-the-loop simulation of convertible static transmission controller for transmission grid management. In Proceedings of the 2013 IEEE 14th Workshop on Control and Modeling for Power Electronics (COMPEL), Cantabria, Spain, 23–26 June 2013; pp. 1–8. [Google Scholar]
- Texas Instruments. TMS320F28335 Controlcard. 2014. Available online: http://www.ti.com/tool/tmdscncd28335 (accessed on 16 October 2018).
Figure 1.
Stochastic load at a Patrol Base microgrid for (a) Tier 1; (b) Tier 2; and (c) Tier 3 loads.
Figure 1.
Stochastic load at a Patrol Base microgrid for (a) Tier 1; (b) Tier 2; and (c) Tier 3 loads.

Figure 2.
Solar irradiance measured each minute on 1 June 2012.

Figure 3.
Example microgrid used in simulation for patrol base (PB) demonstration of droop control methods.
Figure 3.
Example microgrid used in simulation for patrol base (PB) demonstration of droop control methods.

Figure 4.
(a) Solar power available and (b) load profiles for simulated 1440 min period.

Figure 5.
Power supplied by solar, conventional, and storage sources when traditional droop control is used.
Figure 5.
Power supplied by solar, conventional, and storage sources when traditional droop control is used.

Figure 6.
Power supplied by solar, conventional, and storage sources when optimal high dimension droop control is used.
Figure 6.
Power supplied by solar, conventional, and storage sources when optimal high dimension droop control is used.

Figure 7.
Bus voltage using traditional vs. optimal high dimension droop control.

Figure 8.
Example microgrid used in hardware-in-the-loop (HIL) for PB demonstration of droop control methods.
Figure 8.
Example microgrid used in hardware-in-the-loop (HIL) for PB demonstration of droop control methods.

Figure 9.
Typhoon HIL600 with microgrid control board and three TI-F28335 DSP ControlCards (two cards were used for this paper).
Figure 9.
Typhoon HIL600 with microgrid control board and three TI-F28335 DSP ControlCards (two cards were used for this paper).

Figure 10.
Hardware-in-the-loop schematic for PB microgrid example.

Figure 11.
HIL controller for Source 1 (solar)–optimal high dimension droop.

Figure 12.
HIL controller for Source 2 (conventional)–traditional droop.

Figure 13.
HIL controller for Source 3 (storage)–traditional droop.

Figure 14.
(a) Solar power available and (b) load profiles for HIL implementation.

Figure 15.
Hardware-in-the-loop results with optimal high dimension droop control: Ch1 Bus Voltage; Ch2 Source 1 Current; Ch3 Source 2 Current; Ch4 Source 3 Current.
Figure 15.
Hardware-in-the-loop results with optimal high dimension droop control: Ch1 Bus Voltage; Ch2 Source 1 Current; Ch3 Source 2 Current; Ch4 Source 3 Current.

Figure 16.
Reference and actual current supplied by solar resource using optimal high dimension droop control.
Figure 16.
Reference and actual current supplied by solar resource using optimal high dimension droop control.


Table 1.
Equipment included in each load tier at a Patrol Base.
| Load Tier | Equipment |
|---|---|
| One to ten 80 W Panasonic Toughbooks | |
| Tier 1 | Charging station for radios capable of recharging (30) 15 W radios |
| (Mission | One or two AC units |
| Critical) | One–Two TVs/projectors used as large monitors for the Blue Force Tracker |
| Three to five 100 W bulbs ( 26 W CFL) | |
| Power tools and charging station if the platoon is equipped with vehicles | |
| Tier 2 | ISR video feeds |
| (Extended Operations) | Portable lights powered via rechargeable battery pack |
| One to three hotplates/coffee pots | |
| One to three personal electronic devices (iPod, laptop, camera, etc.) | |
| Tier 3 | 30–80 gallon hot water heater |
| (Morale Boosting) | Three to five additional AC/heater units for berthing |
| One to three flat panel TVs or projectors |
Table 2.
Amount of load in each tier based on time and activity.
| Load Tier | Activity | Day | Night |
|---|---|---|---|
| Tier 1 | Patrol | 2–3 kW | 2–3 KW |
| Non-Patrol | 1–2.5 kW | 1–2.5 kW | |
| Tier 2 | Patrol | 1–2 kW | 1–2 KW |
| Non-Patrol | 2–3 kW | 1–2 kW | |
| Tier 3 | Patrol | 2–3 kW | 2–3 KW |
| Non-Patrol | 0.5–1.5 kW | 0.5–1 kW |
Table 3.
Example patrol schedule.
| Day 1 Patrol Schedule | |
| 0725–0800 | Squad 1 |
| 1110–1325 | Squad 2 |
| 1610–1800 | Squad 1 |
| Night 1 Patrol Schedule | |
| 1910–1955 | Squad 1 |
| 2140–2225 | Squad 2 |
| 2340–0050 | Squad 1 |
| 0300–0400 | Squad 2 |
Table 4.
Patrol base microgrid parameter values.
| Component | Value | Unit |
|---|---|---|
| 0.1 | ||
| 1 | mH | |
| 0.2 | ||
| 2 | mH | |
| 0.12 | ||
| 1 | mH | |
| 1 | mF | |
| 1 | ||
| 10 |
Table 5.
Traditional droop control settings for patrol base (PB) simulation.
| Source | ||
|---|---|---|
| Solar | 300 | 2.5 |
| Conventional | 300 | 0.4 |
| Storage | 295 | 1.0 |
Table 6.
Hardware-in-the-loop (HIL) Analog Output Configuration.
| AO Channel | Model Parameter | Scaling |
|---|---|---|
| 1 | 100 V | |
| 2 | 10 A | |
| 3 | 10 A | |
| 4 | 10 A | |
| 5 | 100 V 1 | |
| 6 | 100 V 1 | |
| 7 | 100 V 1 |
Table 7.
Source 1 and Source 2 parameter values.
| Source 1 | Source 2 | ||||
|---|---|---|---|---|---|
| Component | Value | Unit | Component | Value | Unit |
| 400 | V | 380 | V | ||
| 0.2 | 0.2 | ||||
| 0.2 | mF | 0.2 | mF | ||
| 1.5 | mH | 1.5 | mH | ||
| 0.08 | F | 0.08 | F | ||
| 5 | mH | 5 | mH | ||
| 0.1 | 0.23 | ||||
| 1.2 | mH | 0.8 | mH | ||
| 300 | V | 300 | V | ||
| 0.9 | 0.8 |
Table 8.
Energy storage parameter values.
| Component | Value | Unit |
|---|---|---|
| 1 | mF | |
| 0.2 | mH | |
| 0.08 | F | |
| 1 | mH | |
| 1 | ||
| 1.2 | mH | |
| 293 | V | |
| 1.5 |
© 2018 by the authors. Licensee MDPI, Basel, Switzerland. This article is an open access article distributed under the terms and conditions of the Creative Commons Attribution (CC BY) license (http://creativecommons.org/licenses/by/4.0/).
Share and Cite
MDPI and ACS Style
Bunker, K.J.; Cook, M.D.; Weaver, W.W.; Parker, G.G. Multidimensional Optimal Droop Control for DC Microgrids in Military Applications. Appl. Sci. 2018, 8, 1966. https://doi.org/10.3390/app8101966
AMA Style
Bunker KJ, Cook MD, Weaver WW, Parker GG. Multidimensional Optimal Droop Control for DC Microgrids in Military Applications. Applied Sciences. 2018; 8(10):1966. https://doi.org/10.3390/app8101966
Chicago/Turabian StyleBunker, Kaitlyn J., Michael D. Cook, Wayne W. Weaver, and Gordon G. Parker. 2018. "Multidimensional Optimal Droop Control for DC Microgrids in Military Applications" Applied Sciences 8, no. 10: 1966. https://doi.org/10.3390/app8101966
Note that from the first issue of 2016, this journal uses article numbers instead of page numbers. See further details here.