Article

Ore Composition’s Impact on Smelting Profitability: An Optimum Pricing Index Model for Long-Term Nickel Ore Feedstock Purchasing Agreements

1
SNNC (Special Purpose Company), 2148-139 Jecheol-Ro, Gwangyang 57812, Korea
2
Graduate Institute of Ferrous Technology (GIFT) & Industrial and Management Engineering Department, Pohang University of Science and Technology (POSTECH), 77 Cheongam-Ro, Nam-Ku, Pohang 37673, Korea
3
Construction Engineering and Management, Department of Civil, Environmental and Architectural Engineering, University of Colorado, Boulder, CO 80309, USA
*
Author to whom correspondence should be addressed.
Appl. Sci. 2018, 8(11), 2100; https://doi.org/10.3390/app8112100
Submission received: 6 September 2018 / Revised: 22 October 2018 / Accepted: 25 October 2018 / Published: 1 November 2018
(This article belongs to the Special Issue Applied Engineering to Lean Manufacturing Production Systems)

Abstract

:
Global Nickel (Ni) smelters’ have been experiencing profit losses for nearly a decade due to the 2008 recession still impacting the industry, oversupply, and fluctuating ore quality. This paper proposes to aid the Ni smelters with the lattermost issue, presenting an optimum pricing index model for purchasing raw Ni ore materials. The model is developed using data from a major Ni smelter in operation in Korea, including parameters such as revenues, investment expenses, and ore purchasing costs and the impact Ni and Iron (Fe) content variation has on them. In contrast, existing published Ni price forecasting models are based on external variables (e.g., GDP) and are intended for profit forecasting versus contractual agreements. In executing a Monte-Carlo simulation of 1000 possible life-cycle costs analysis with and without the use of the proposed model, the model increased the likelihood of the smelter earning a profit by approximately 5% with an average approximate increase of $50 million. As such, the proposed index model provides new Ni and nonferrous metals smelters material quality fluctuation risk mitigation. Although this model is presented for the Ni smelting process, the findings could theoretically be applied to any long-term procurement activity with variable quality and market conditions.

1. Introduction

The steel industry has never fully recovered from the 2008 global economic crisis. Existing industry practices such as continuous investments in old and new facilities has equated to a global oversupply of steel. Furthermore, high-quality Ni has all but been exhausted worldwide. As a result, the price of Nickel (Ni) is the lowest it has been within the last decade. Many smelters have responded by using low-priced and low-quality raw materials in their production [1]. While this solution has kept Ni smelters in business, using low-grade Ni ore often increases costs due to ore deterioration. The Ni smelting industry is currently at a risk of global failure [1]. Failure within in this industry would have significant global impacts as steel, and therefore Ni, is arguably the “building blocks” of industrial progress. To avoid stressing the global steel industry, there is a need to improve the profitability of the Ni smelting industry. This paper proposes an optimum pricing index model to apply to the purchasing of raw Ni materials with the concept of the raw material (feedstock) supplier and smelter sharing in the risks of worsening Ni ore compositions.
The pricing model presented introduces a risk sharing model for deteriorating raw material caused by resource exhaustion, non-existent in literature. While this study is focused on Ni and stainless-steel manufacturing, it could feasibly be used for any raw material of declining quality. This paper begins with brief descriptions of the Ni smelting process, manufacturing process, organizational structures, and an overall analysis of the Ni market to educate the reader on the background of the problem. The existing relevant literature is then presented to support this paper’s added value to the general body of knowledge. Finally, the proposed model is presented, and its efficacy supported through a life cycle cost analysis.

1.1. Extraction, Smelting, and Manufacturing Process

The most common smelting Ni process is pyrometallurgical. This process is used to smelt a high-quality nickel ore consisting of saprorite. The process is as follows:
  • Drying: Remove the moisture from the saprorite.
  • Calcine/Reduction: Partially restore the nickel oxide through mixing with the restoring agent.
  • Smelting: Produce Ni and Fe through this restoration process.
  • Refining: Perform a final refining process to remove sulfur, phosphorus, carbon, etc. The FeNi is transformed into an ingot or a granule as FeNi or matte [2].
The Ni extracted in this process comes from the oxidation of either the limonite or saprorite ore. Limonite contains 0.8–1.5% Ni, 40–50% Iron (Fe), and approximately 50–60% other gangue components. Alternatively, saprorite has 1.8–3.0% Ni, 10–25% Fe, and a mixed layer in which limonite and saprorite coexist. Processing ores with a high nickel content is more economically viable. However, even when using the same limonite and saprorite ore, Ni and Fe content can vary widely impacting the manufacturing cost accordingly [3]. The feedstock’s selling price is generally priced at the net Ni weight. Fewer impurities, such as carbon, sulfur, and phosphorus, also increase the pricing. The smelting of Ni typically falls into two categories, high-power and low-power Ni ratio, which results in a high-grade and low-grade manufacturing. It is generally considered to be profitable for the high-power ratio if the Ni content of the ore is 2.1% or more and 1.7% Ni content for the low-power ratio. Although high-grade Ni ores ensure sustainable profits, smelters are often unable to acquire them due to worldwide scarcity [4].
The Ni and Fe content also impact the manufacturing costs. A decrease in Ni content can lead to low productivity and low quality of Ni in the final product, stainless steel. This results in a profit decrease as consumers desire high-quality Ni to minimize their risk of product failure. It also impacts productivity, as stainless steel manufacturers experience a decrease of about 6000 tons/year when the Ni content in the ore decreases from 2.0% to 1.5%. Alternatively, an increase of Fe in the ores leads to a higher manufacturing cost. One study found that an increase in Fe content of 10% reduced the manufacturers profit approximately 2% [2].

1.2. Organization of Project Based Company and Ore Procurement

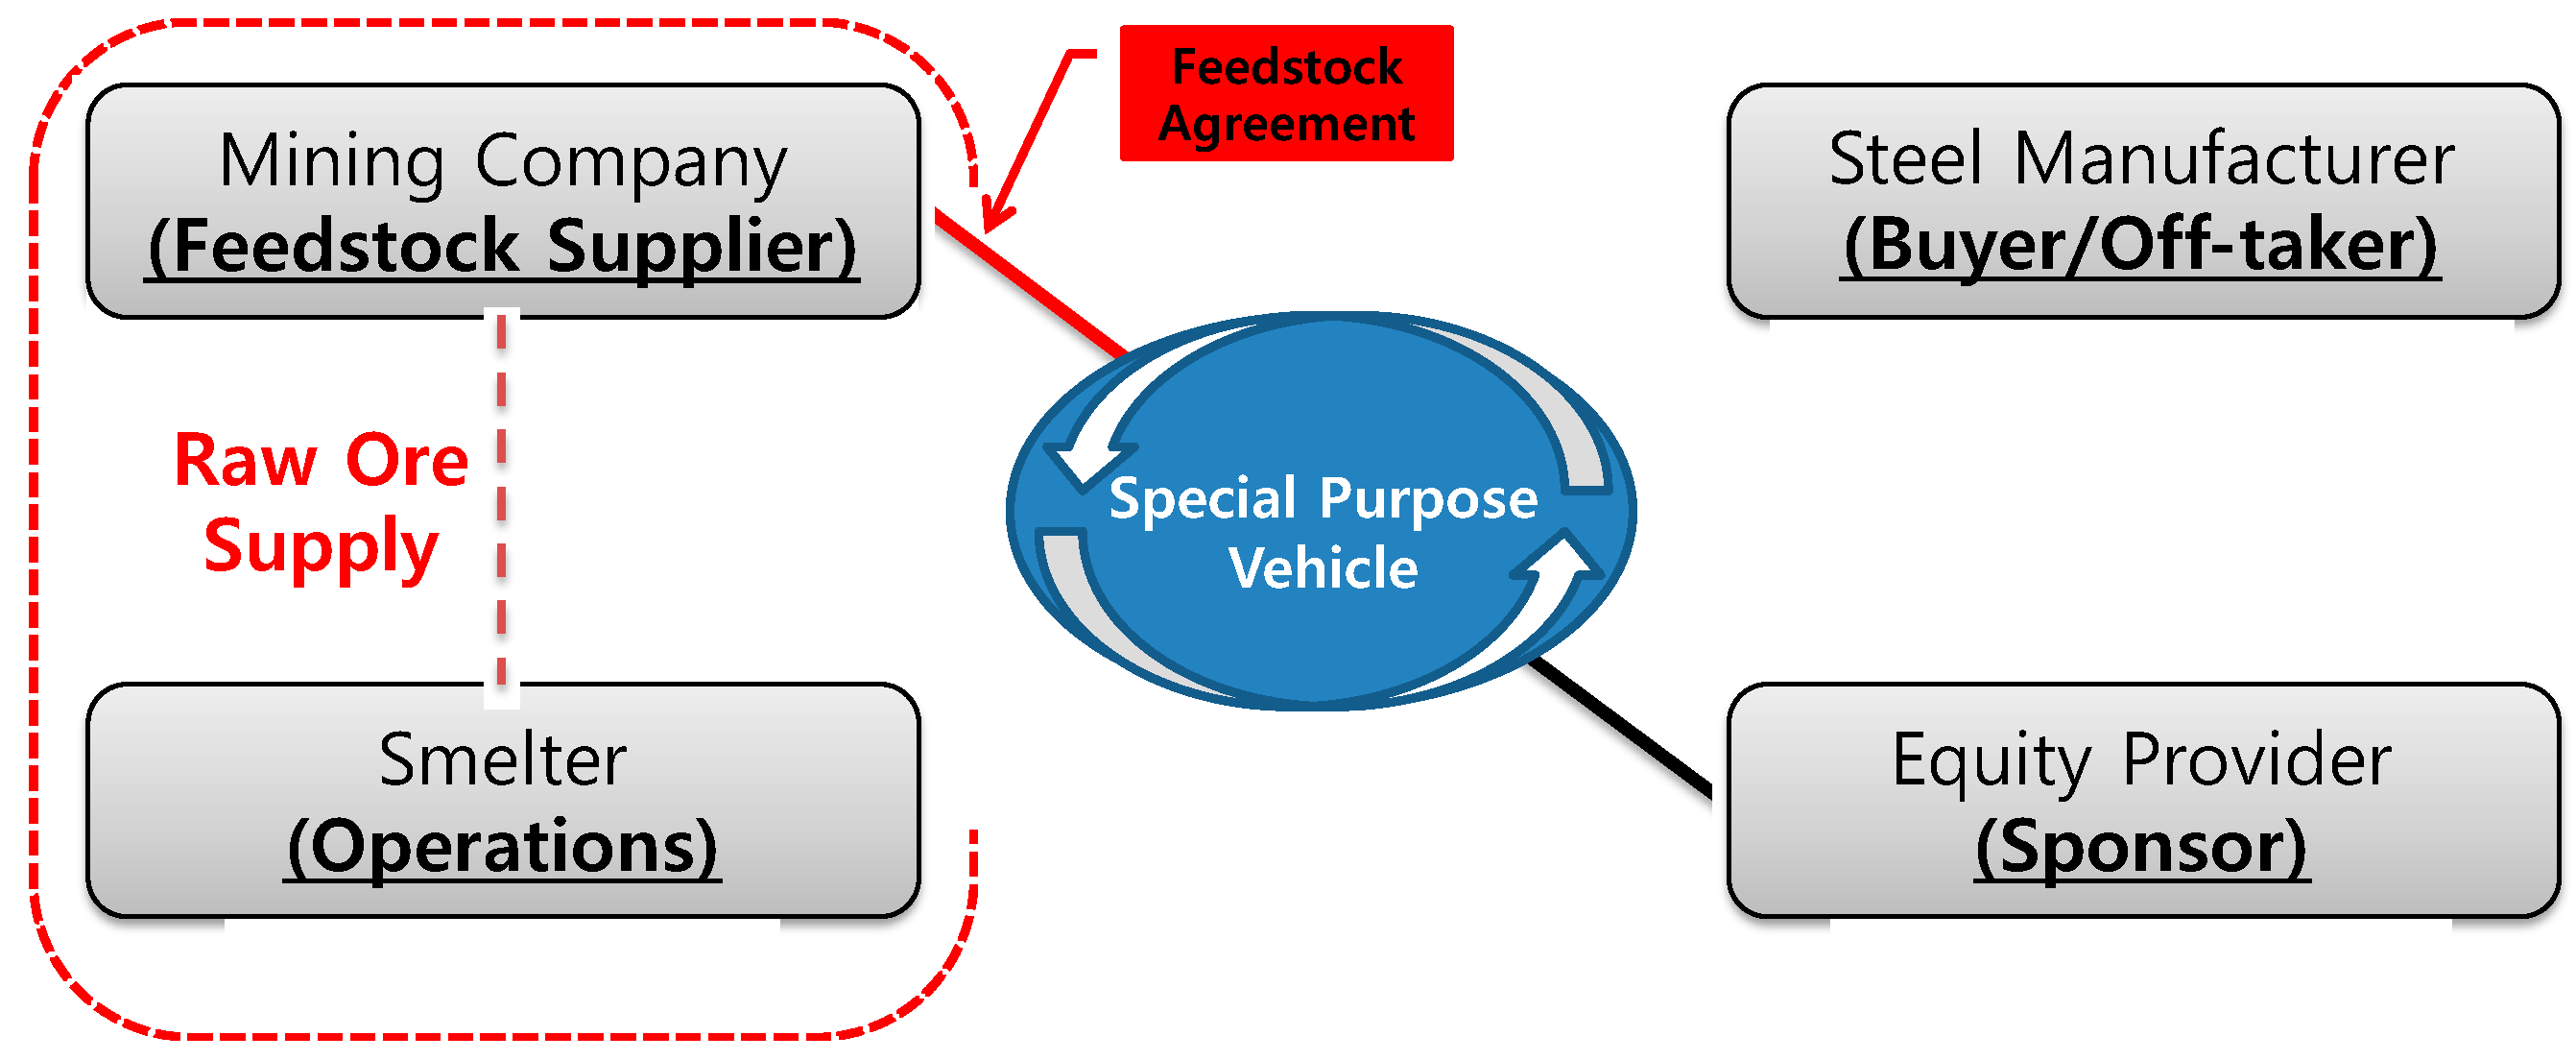
Due to the enormity of required investment, most Ni smelting operations require a special purpose company (SPC). The SPC is a legal entity encompassing a combination of organizations involved in the manufacturing of Ni who share all risks and project profitability. For this paper, the SPC consists of an equity provider, mining company, smelter, and steel manufacturer. Of the many agreements required to create this arrangement is the procurement of raw materials for stainless steel manufacturing. This is the focus of this paper and is also known as the feedstock agreement. Figure 1 displays the SPC used for this paper, specifically identifying the feed stock supply agreement.
At the inception of the project, the feedstock agreement is executed, ensuring a stable supply of mined ores throughout the duration of the project. Theoretically any losses due to low-grade ores is borne by all organizations. However, often, the SPC contract does not provide for fluctuations in the ore Fe and Ni content which becomes the smelting company’s responsibility [5]. Often, a set Ni ore price is determined for the duration of the project based on a bilateral negotiation executed at the start of the project. The price calculation considers the supply period, quantity, and market price without a global standard. The supply period, quantity and price of the ore, ore supply rate, and quotation are specified within the feedstock supply agreement. An “as-is” practice is the most common practice for calculating the Ni purchasing price, with the following formula [5]:
Ni   Ore   P r i c e = N e t   N i   W e i g h t L M E   N i   P r i c e P r i c e   R a t i o
where
LME Ni Price = London Metal Exchange (LME) Ni price as a reference point
Price   Ratio = N i   C o n t e n t   G r a d e N i   P r i c e   i n   C o m m o d i t y   E x c h a n g e   M a r k e t
Equation (1) uses a constant price ratio is a poor practice due to both the potential for variation in the ore’s Ni content and price within the current market [5]. Equation (1) also does not consider the Fe content which has a negative impact on the manufacturing price. With these inadequacies of the current process, this paper suggests an alternative solution: sharing the smelter’s profitability fluctuation risk depending on the changes in the Ni and Fe content.

2. Literature Review

Within Ni smelting literature, most studies focus on improving Ni smelting profitability through process efficiencies. For example, Oxley [4] proposed pre-processing ores used for Ni smelting to produce high quality raw materials. They performed a net present value (NPV) analysis for the quantitative impact on manufacturing costs. The results of pre-processing ores included a reduction in cost per ton of Ni production, reduced energy consumption, and increase in Ni grade [4]. The studies of Pournaderi [6] and Li et al. [7] on Ni smelting are used to support this paper’s development of associated manufacturing costs. Pournaderi [6] studied the impact composition and yield of metals change according to the reduction conditions of Laterite Ni ore. Li et al. [7] studied the Rotary Kiln-Electric Furnace method applied to Laterite Ni. In this method, the reduction characteristics change depending on the conditions of reducing material, temperature, and time [7]. As stated, studies on improving the Ni smelting efficiencies are vast and the above are just the most relevant examples. While these are valid measures to increase profitability, they do not aid smelters in reducing the risk of ore price/quality volatility.
One method of mitigating price volatility risk existent in the literature is to perform future to predict pricing fluctuations. Wårell [8], Pustov et al. [9], Morandi et al. [10], Labson [11], and Sverdrup and Ragnarsdottir [12] are all examples of attempted to predict the future costs of material ores based on different identified variables. Both Wårell and Marandi et al. identified the main factors indicating future of material ore pricing [8,10]. Pustov et al. [9] used a marginal cost approach and incentive pricing, supplemented with a Monte-Carlo simulation, to present confidence intervals of future material ore pricings. Labson [11] developed an econometric trade model that evaluates the dynamics of the world steel market, forecasting future market demands. Sverdrup and Ragnarsdottir [12] combined mining, ore grade changes, trade markets, price mechanisms, supply and demand, estimates of stock-in-use, waste, and recycling into a comprehensive model which also forecasted future market demands through 2080. Their findings emphasize the importance of recycling and metal conversation to secure long-term sustainable supply chains [12]. While the resultant models from these research endeavors could be integrated into feedstock agreements, they are highly complex in execution, require data that SPCs may not have access to, and have a wide range of accuracy. Another strategy to mitigate price fluctuations in research is flexible operating strategy to mitigate Ni ore price uncertainties (e.g., [13,14,15,16,17]). The strategic flexibility to expand, contract, defer, or abandon production has historically been one of the more popular ways to mitigate market demand and price fluctuations [13]. While valid, there are many reasons companies may not have flexible operations (e.g., labor availability, market demands, finance terms, and contractual agreements).
Alternative to reacting to the market, Liu et al. [18], Deng et al. [19], Ma [20], Sukagawa [21], and Wårell [22] studied alternative solutions to reducing the erratic pricing trends of commodities. Liu et al. [18] found using price reforms to artificially increase commodity pricing had disastrous impacts to the downstream organizations. Deng et al. [19] studied the feasibility and related efficiency of a national commodity pricing mechanism, finding current methods of Chinese pricing to be inadequate, largely due to the long duration between adjustment periods. In response to these fluctuating pricing, many organizations have begun to rely on the concept of “spot iron ore pricing”. Ma [20] examined the variables that impact iron ore spot prices within the global market and what factors minimize its volatility. Sukagawa [21] presented the evolution of past and current iron ore negotiation practices, ending with this concept. Wårell [22] found that market pricing is actually more volatile after the introduction of spot market.
The above solutions could be considered to be a part of a larger research topic, supply chain management. Supply chain management is a collection of approaches used to efficiently integrate suppliers, manufacturers, storage facilities, and vendors to minimize systemwide costs [23]. Researchers have suggested the use of a price cap for material contracts [24]; a supply chain that is as lean as possible [25], agile in its ability to fluctuate with minimal impacts to cost [26], and a combination of the two [27]; and managerial methods to predict and manage the supply chain risks of a turbulent market [28,29,30]. Most relevant to this research is the proposed use of option pricing [31] and flexible and risk-sharing supply contracts [32] under uncertainty. Burnetas and Ritchken [31] proposed the use of an option contract when there are fluctuations in the profitability of the supply chain [31]. The publication presents a model which predicts the conditions under which the options can be used. Li and Kouvelis [32] presented a flexible, risk-sharing option for general supply contracts. Within their solution are contracts which promote flexible time, unit quantities, and purchasing pricing given the status of selected variables. The lattermost is the goal of the Ni smelting fluctuating price ratio solution, described below.
Finally, the literature has also previously assessed the life-cycle profitability of different supply chains. Within power generation literature, Hong and Lee [33] used a life-cycle approach with Monte-Carlo to perform an economic analysis of a steam-cycle optimization model. Kannan et al. [34] performed a life cycle cost analysis (LCCA) on the fiscal viability of electricity generation from a typical oil-fired steam turbine plant in Singapore. Kannan et al. [35] performed a life cycle assessment of solar PV systems in Singapore. Life-cycle analysis have also been performed to assess the profitability of metal recover chains. Xu et al. [36] presented a model to predict the resiliency of a supply chain based on random supply disruptions. Kibira and Jain [37] assessed the profitability of recycling vehicle parts including the financial, environmental, social, and manufacturing domains. Wang et al. [38] presented a quick and effective model to aid manufacturers in maximizing profitability through recycling, reusing, and remanufacturing electrical and electronic equipment. Rosa and Terzi [39] reviewed 35 studies that focus on decision-support methods for the profitability of metal recovery chains. However, most of these studies focus on the recovery of machinery and none discuss new or recovered steel or Ni supply chains, or how the pricing negotiations are managed.

3. Point of Departure

Existing literature has identified long-term iron ore pricing agreements as a major problem, being too rigid and failing to reflect market demand [40,41]. While literature has acknowledged the difficulties associated with long-term iron ore contractual agreements [19], research within this area has been limited to models calculating future iron pricings [8,9,10,11,12]. These solutions do not consider the integration of fluctuating iron ore pricing into contractual arrangements. This paper’s findings fulfill this research gap and opportunity, providing a model that is both flexible and reflects the current market and allows for the inclusion of fluctuating pricing within a Ni feedstock agreement. These findings most significantly build off of the proposed flexible pricing model proposed by Li and Kouvelis [32]. This paper uses the generic supply chain management principles presented in Li and Kouvelis’s [32] paper and apply them specifically to the Ni mining-smelting contractual relationship.

4. Research Methodology

The research methodology was performed in three steps. These steps, along with their data inputs and outputs, are illustrated below in Figure 2 and explained in greater detail below.

4.1. Data Collection

The data used to develop the pricing index model come from a Korean smelting company in operation for over 10 years. This company is referred to as “Company A” throughout the paper. Company A has an operational capacity of over 30,000 tons of Ni per year. This equates to the purchasing, production, and selling costs of hundreds of thousands of tons of Ni, providing a rich database to develop the paper’s model.

4.2. Cost Impacts of Nickel and Iron Content in Ore

The authors collected historical smelting data from Company A operations including the typical ore Ni and Fe content, FeNi production quality, and the annual sales and revenues based on said ore qualities. Figure 3 shows the recovery rates for Ni and Fe as well as the changes in the metal content of Ni depending on the amount of reducing agent [6,7]. Figure 4 depicts the Ni/Fe ratio regression model based on Company A historical ores.
From Company A’s historical ore content data and Li et al.’s [7] associated recovery rates, the authors performed the following calculation to derive Company A’s Ni and Fe percentage ranges within the ores. The output from this formula [7] is shown in Figure 5 and Figure 6.
Metal   Ni % = R ( C ) A R ( A ) A R ( A ) + B R ( B )
Metal   Fe % = R ( C ) B R ( B ) A R ( A ) + B R ( B )
R ( D ) = 1 Metal   Ni % Metal   Fe %
where R(C) is the ratio of Ni and Fe (%), A is the Ni grade (%), B is the Fe grade (%), R(A) is the Ni recovery ratio (%), R(B) is the Fe recovery ratio (%), and R(D) is the residual component ratio (typically 4% per Company A’s experience) after the Ni/Fe recovery (%).
As shown in Figure 5, the Ni content decreases from 2.0% to 1.5% as the Ni composition decreases from 17% to 13%. The Fe composition alternatively rises from 79% to 83%. As the ore degrades in quality, the Ni contents reduce producing less Ni composition/more Fe composition.
Figure 6 shows that, when the Fe content in the Ni ore supply increases from 15% to 25%, the Fe composition increases from 79% to 85%. The Ni composition alternatively decreases from 17% to 11%. As the ore degrades in quality, the Fe contents increase and productivity decreases.
Using the results in Figure 5 and Figure 6, the authors calculated the amount of slag and metal production using the following Equation [7]:
FeNi   production amount = [ C a l   I n C a l   N i % S l a g   o u t S l a g   N i % M e t a l   N i   %   C a l   N i % C a l   N i % + C a l   F e % ] + [ C a l   I n C a l   F e % S l a g   o u t S l a g   F e % M e t a l   F e   %   C a l   F e % C a l   N i % + C a l   F e % ]
where
Variable DescriptionVariable Comes From:
Cal in=Calcine volumeProduction Volume Quantity
Slag out=Slag volume Cal   In × Cal   MgO Slag   MgO
Cal Ni %=Ni content in CalcineEquation (2)
Cal Fe %=Fe content in CalcineEquation (3)
Slag Ni %=Ni content in SlagEquation (2)
Slag Fe %=Fe content in SlagEquation (3)
Metal Ni %=Ni content in Metal Cal   Ni % Cal   in +   Slag   Ni % Slag   out
Metal Fe %=Fe content in Metal Cal   Fe % Cal   in +   Slag   Fe % Slag   out
In executing Equation (5), the authors found the production rate of the slag to be 76.9% and the metal 11.6%. Figure 7 depicts Company A’s sales and profit data associated with the metal production ranges calculated above. For these calculations, the following variables values were used per above calculations and Company A’s production data: 96% Ni recovery, 60% Fe recovery, 4% non-Ni/Fe, and an annual Ni production of 26,000 tons/year. As shown in Figure 7, 1.75% Ni content is the approximate break-even point.

4.3. Establish a Purchasing Cost Index Model

Using the above findings, three cost index models are developed for comparison: (1) model using a constant price ratio; (2) model using a fluctuating price ratio based on Ni content variation; and (3) model using a fluctuating price ratio based on Fe content variation. All models assume an LME of 25% and annual ore production of 26,000 based on Company A’s experiences. For the price ratios, the following are used:
Modle 1.
The base scenario uses a constant price ratio of 0.25, based on Company A’s experiences.
Modle 2.
For the fluctuating price ratios, the authors chose to use data from China’s ore price to Ni% ratios from 2016 [42]. From this dataset, a correlation of price ratio to Ni% content was found with a R2 of 0.98 resulting in the following Equation (6):
Percent   of   Price   Ratio = 81.163 N i   %   C o n t e n t 64.311
where Percent of Price Ratio is the percentage of “base case” price ratio of 0.25.
Table 1 depicts price ratios as the Ni content decreases from 2.0% to 1.5%.
Modle 3.
The Fe content increases from 15% to 25%, as shown in Table 2. To achieve these values, the Ni% is calculated from the Fe% by using the relationship shown in Figure 4. Then, a price ratio is calculated from the Ni% value using Equation (6).
From these findings, the purchasing costs are calculated using a revised Equation (1):
Ni   Ore   P r i c e   ( N i %   v a r i a t i o n ) = N e t   N i   W e i g h t L M E   N i   P r i c e N i   P r i c e   R a t i o
Ni   Ore   P r i c e   ( F e %   v a r i a t i o n ) = N e t   N i   W e i g h t L M E   N i   P r i c e F e   P r i c e   R a t i o
where
  • LME Ni Price = London Metal Exchange Ni price as a reference point
  • Ni Price Ratio = Values as shown in Table 1
  • Fe Price Ratio = Values as shown in Table 2

4.4. Life-Cycle Cost Analysis

To explore the financial efficiency of the model, the authors performed a LCCA comparing the “as-is” constant price ratio versus the use of the ore purchase index model (Equation (6)). The economic analysis was performed for a best (high-grade ore), worse (mid-grade ore), and worst (low-grade ore) case of Ni and Fe content. These cases are shown in Table 3.
The authors performed a LCCA for these two cases, using a Monte Carlo simulation for data analysis. The three cases in Table 3 are used to calculate the operational profit from the manufacturing costs and revenue. These are calculated using cost Models 1, 2, or 3 as applicable and Company A’s associated manufacturing costs, sales, and revenues represented in Figure 7. After the operational profits are calculated, uncertainty is incorporated using a triangular distribution and standard deviation from the best, worse, and worst cases, as shown in Equation (9) and (10) [43]:
t e = t o + 4 t m + t p 6
where te denotes the weighted average of expected profit (in millions of US dollars, M USD); to denotes the best expected profit (M USD); tm denotes the worse expected profit (M USD); and tp denotes the worst expected profit (M USD).
σ = t p t o 6
where σ denotes the standard deviation (M USD); to denotes the best expected profit (in percentage); and tp denotes the worst expected profit (M USD).
The investment cost, operational cost, operational sales, depreciation, and taxes are all assumed and included in the LCCA. Table 4 shows the variables used for the LCCA, as experienced by Company A.
From these variables, an LCCA analysis was performed with and without using the model under their three cases. Utilizing LCCA calculation best practices [44,45,46,47,48,49,50], the NPV, internal rate of return (IRR), and profitability index (PI) are calculated using the formulas below:
NPV = t = 1 T C t ( 1 + r ) t C 0
where NPV denotes the net present value (M USD); t denotes number of time periods (in years from 1 to “T” years); Ct denotes net cash inflow during period t (M USD); C0 denotes initial investment costs (M USD); and r denotes the discount rate (in percentage).
I R R = r   w h e n   N P V = 0
where IRR denotes the internal rate of return (in percentage); NPV denotes Equation (11); and r denotes the discount rate (in percentage).
P I = N P V + I n i t i a l   I n v e s t m e n t I n i t i a l   I n v e s t m e n t
where PI denotes the profitability index (in percentage); NPV denotes the net present value (M USD); and Initial Investment denotes the initial investment costs (M USD).
These calculations were performed using the Excel @Risk Monte Carlo analysis for both the case of not using a model and using a model. The findings are presented as distribution curves depicting the likelihoods of certain NPV, IRR, and PIs occurring.

5. Results and Discussions

Table 5 depicts the estimated ore purchasing cost and decrease in profit as the Ni% reduces from 2.0% to 1.5% in 0.1% intervals. As can be seen, when the ore content is reduced by 0.1%, the price of the ore will decrease by $3.6 M USD/ton.
Using the price ratios for Model 2, defined in Table 1, Table 6 depicts the ore price, ore purchasing cost, and profit decrease. With a set price ratio, the purchase cost of ore is reduced as the Ni content within the ore is reduced due to a reduction in the “Net Ni Weight”. However, due to the reduction of quality of the ore, it can also be seen that the profit decreases significantly from 2.0% to 1.5% Ni. This reduction is caused by the increased production costs of poor-quality ores. With Model 1, this risk is transferred 100% to the manufacturer. Alternatively, with a fluctuating price ratio, the risk is shared between the supplier and manufacturer, as seen in the higher profits at 1.5% Ni content.
Although the increase in the Fe content in the ore is not a purchasing decision variable in feedstock agreement, it results in a decrease in profits. With the “as-is” scenario, the ore price remains unchanged as the Fe content increases. Using the price ratios defined in Table 2, Table 7 depicts the ore price, ore purchasing cost, and profit decrease.
By applying an ore purchase price patio that varies according to the Ni or Fe content, the manufacturer’s risk is mitigated. The above is an illustrative example of this. To validate this model’s risk sharing potential (in comparison to the existing model), a LCCA was performed. The LCCA was performed using the @Risk Monte Carlo software, with the calculations and assumptions outlined in Equations (10)–(14). The outputs are the smelter’s NPV, IRR, and PI when the model is and is not used. As can be seen in Figure 8, using the model equates to an NPV average increase of 16 M USD. However, it should be noted that the results of using the model depict lower minimum and maximum profits.
Figure 9 depicts the IRR results, showing that using the model equates to an approximate increase to the internal rate of return of 5%.
Figure 10 depicts the PI results, showing an improved PI range of −0.9% to 13.3% in using the model compared to a −1.6% to 12.6% range without the model.
As can be seen in Table 8, the NPV, IRR, and PI are all superior when the proposed model is used. According to the results of the probabilistic economic evaluation using @Risk, the probability of the NPV > 0 and IRR > 0 increases when a fluctuating price ratio model is used. Alternatively, the distribution range of the PI is also higher. The probabilistic model’s findings confirm that the proposed price index model equates to a reduction in the smelter’s ore quality fluctuation risk.
This model successfully mitigates the cited weaknesses of the existing long-term iron ore pricing model [40,41] used in contractual feedstock agreements between the material supplier and smelter. It also negates the need for complex iron ore pricing modeling [10,11,12,13,14]. Although this model is presented for the Ni smelting process, the findings could theoretically be applied to any long-term procurement activities with variable quality and market conditions.

6. Conclusions

This paper presents a price index model to be applied to the long-term Ni ore feedstock agreements between manufacturers and smelters which considers the fluctuating ore quality and market conditions. Based on the LCCA, the authors found the “as-is” practice of using a constant price ratio to be unsuited to fluctuating and worsening ores (low-grade ores are low in Ni and high in Fe). The developed model increases the smelter’s likelihood of making a profit by 5% (NPV > 0, IRR > 0) with an approximate 15 M USD in savings.
Although the model represents an advance in the current state of practice, some limitations exist within this study. First, the actual purchase with the ore purchase index model of the dry Ni smelter was not applied. Second, only data for a dry Ni smelter were applied as operational information of the ore purchase index model. In the case of a feedstock supply agreement, it is usually difficult to confirm the condition of the ores at the initial stage of the project. It is also difficult to confirm the aforesaid with no quantitative operational data of the ore’s composition and impact on manufacturing cost. Furthermore, since the Ni smelting industry is private and competitive, there are few interactions between companies. There is little sharing of knowledge, know-how, and information disclosure of operational technologies. If data were acquired on the effect of ore ingredients on the manufacturing cost of Ni smelting from various smelters, future research could provide a more reliable ore purchase index model. Additional practical research with actual cases and operational information of the smelter companies are needed. To that point, the presented ore purchase index model is expected to be applied as a guideline for a new project in the future as conditions of renewal of the ore purchase contract for Company A. This real-life application of the proposed model will allow future case studies to see the efficacy of the proposed model in practice.

Author Contributions

H.H.J. developed the research contents based on the analysis and simulations and drafted the manuscript. D.S.A. provided academic feedback on the study and revised the manuscript. E.B.L. directed the research process and supervised the overall work. All authors read and approved the final manuscript.

Funding

The authors acknowledge that this research was sponsored by the Ministry of Trade Industry and Energy (MOTIE/KEIT) Korea through the Technology Innovation Program funding (Developing Intelligent Project Management Information Systems (i-PMIS) for Engineering Projects; Grant number = 10077606).

Acknowledgments

This work was supported a Ni smelter SNNC in Korea by providing some industry practice and information for Ni production. The authors would like to thank J.W.C. (a graduate student at POSTECH University) for his support on the manuscript preparation.

Conflicts of Interest

The authors declare no conflicts of interest.

Abbreviations

NiNickel
FeIron
SPCSpecial Purpose Company
LCCALife-Cycle Cost Analysis
LMELondon Metal Exchange
IRRInternal Rate of Return
NPVNet Present Value
PIProfitability Index

References

  1. InvestmentMine. Historical Nickel Prices and Price Chart. Available online: http://www.infomine.com/investment/metal-prices/nickel/all/ (accessed on 25 June 2018).
  2. Dalvi, A.K.; Bacon, W.G.; Osborne, R.C. The fast and future of Nickel Laterites-INCO Limited. In Proceedings of the PADC 2004 International Convention, Tradeshow and Investors Exchange, Toronto, Canada, 7–10 March 2004. [Google Scholar]
  3. Lee, S.H. A Study on the Optimum Slag Formation to Improve Nickel Reduction Rate. Master’s Thesis, Suncheon University, Suncheon, Korea, 2015. [Google Scholar]
  4. Oxley, A.; Barcza, N. Hydro-pyro integration in the processing of Nickel laterites. Miner. Eng. 2013, 54, 2–13. [Google Scholar] [CrossRef]
  5. Bae, I.S. International Project Finance; Bumseo Books: Seoul, Korea, 2014; pp. 53–57. ISBN 979-1-19529-640-8. [Google Scholar]
  6. Pournaderi, S. Optimization of Ferronickel Production from Sivrihisar Nickel Laterite Ore. Ph.D. Thesis, Middle East University, Çankaya/Ankara, Turkey, 2014. [Google Scholar]
  7. Li, G.; Jia, H.; Luo, J.; Peng, Z.; Zhang, Y.; Jiang, T. Ferronickel Preparation from Nickeliferous Laterite by Rotary Kiln-Electric Furnace Process. In Characterization of Minerals, Metals, and Materials; Springer: New York, NY, USA, 2016; pp. 143–150. [Google Scholar]
  8. Wårell, L. An analysis of iron ore prices during the latest commodity boom. Miner. Econom. 2018, 31, 203–216. [Google Scholar] [CrossRef] [Green Version]
  9. Pustov, A.; Malanichev, A.; Khobotilov, I. Long-term iron ore price modelling Marginal costs vs. incentive price. Resour. Policy 2013, 38, 558–567. [Google Scholar] [CrossRef]
  10. Morandi, M.I.W.M.; Rodrigues, L.H.; Lacerda, D.P. Foreseeing Iron Ore Prices Using System Thinking and Scenario Planning. Syst. Pract. Action Res. 2014, 27, 287–306. [Google Scholar] [CrossRef]
  11. Labson, B.S. Changing patterns of trade in the world iron ore and steel market: An econometric analysis. J. Policy Model. 1997, 19, 237–251. [Google Scholar] [CrossRef]
  12. Sverdrup, H.U.; Ragnarsdottir, K.V. A system dynamics model for platinum group metal supply, market price, depletion of extractable amounts, ore grade, recycling and stocks-in-use. Resour. Conserv. Recycl. 2016, 114, 130–152. [Google Scholar] [CrossRef]
  13. Bao, C.; Mortazavi-Naeini, M.; Northey, S.; Tarnopolskaya, T.; Monch, A.; Zhu, Z. Valuing flexible operating strategies in nickel production under uncertainty. In Proceedings of the MODSIM2013: 20th International Congress on Modelling and Simulation, Adelaide, South Australia, 1–6 December 2013; Volume 16. [Google Scholar]
  14. Brennan, M.J.; Schwartz, E.S. Evaluating natural resource investment. J. Bus. 1995, 58, 135–157. [Google Scholar] [CrossRef]
  15. Tsekrekos, A.E.; Shackleton, M.B.; Wojakowski, R. Evaluating natural resource investment under different model dynamics: Managerial insights. Eur. Financ. Manag. 2012, 18, 543–577. [Google Scholar] [CrossRef]
  16. Ndiaye, A.A.; Armstrong, M. Evaluating a small deposit next to an economically viable gold mine in West Africa from the points of view of the mining company, the government and the local community. Resour. Policy 2013, 38, 113–122. [Google Scholar] [CrossRef]
  17. Dimitrakopoulos, R.G.; Abdel Sabour, S.A. Evaluating mine plans under uncertainty: Can the real options make a difference? Resour. Policy 2007, 32, 116–125. [Google Scholar] [CrossRef]
  18. Liu, Y.; Li, F.Y.; Yu, X. Gas Supply, Pricing Mechanism and the Economics of Power Generation in China. Energies 2018, 11, 1058. [Google Scholar] [CrossRef]
  19. Deng, C.; Jiang, Z.; Sun, C. Estimating the Efficiency and Impacts of Petroleum Product Pricing Reforms in China. Sustainability 2018, 10, 1080. [Google Scholar] [CrossRef]
  20. Ma, Y. Iron ore spot price volatility and change in forward pricing mechanism. Resour. Policy 2013, 38, 621–627. [Google Scholar] [CrossRef] [Green Version]
  21. Sukagawa, P. Is iron ore priced as a commodity? Past and current practice. Resour. Policy 2010, 35, 54–63. [Google Scholar] [CrossRef]
  22. Wårell, L. The effect of a change in pricing regime on iron ore prices. Resour.Policy 2014, 41, 16–22. [Google Scholar] [CrossRef]
  23. Lummus, R.R.; Vokurka, R.J. Defining supply chain management: A historical perspective and practical guidelines. Ind. Manag. Data Syst. 1999, 99, 11–17. [Google Scholar] [CrossRef]
  24. Ng, F.P.; Björnsson, H.C.; Chiu, S.S. Valuing a price cap contract for material procurement as a real option. Construct. Manag. Econom. 2004, 22, 141–150. [Google Scholar] [CrossRef]
  25. Bruce, M.; Daly, L.; Towers, N. Lean or agile: A solution for supply chain management in the textiles and clothing industry? Int. J. Oper. Prod. Manag. 2004, 24, 151–170. [Google Scholar] [CrossRef]
  26. Christopher, M. The agile supply chain: Competing in volatile markets. Ind. Mark. Manag. 2000, 29, 37–44. [Google Scholar] [CrossRef] [Green Version]
  27. Mason-Jones, R.; Naylor, B.; Towill, D.R. Engineering the leagile supply chain. Int. J. Agile Manag. Syst. 2000, 2, 54–61. [Google Scholar] [CrossRef]
  28. Trkman, P.; McCormack, K. Supply chain risk in turbulent environments—A conceptual model for managing supply chain network risk. Int. J. Prod. Econom. 2009, 119, 247–258. [Google Scholar] [CrossRef]
  29. Christopher, M.; Holweg, M. “Supply Chain 2.0”: Managing supply chains in the era of turbulence. Int. J. Phys. Distrib. Logist. Manag. 2011, 41, 63–82. [Google Scholar] [CrossRef]
  30. Giunipero, L.C.; Aly Eltantawy, R. Securing the upstream supply chain: A risk management approach. Int. J. Phys. Distrib. Logist. Manag. 2004, 34, 698–713. [Google Scholar] [CrossRef]
  31. Burnetas, A.; Ritchken, P. Option pricing with downward-sloping demand curves: The case of supply chain options. Manag. Sci. 2005, 51, 566–580. [Google Scholar] [CrossRef]
  32. Li, C.L.; Kouvelis, P. Flexible and risk-sharing supply contracts under price uncertainty. Manag. Sci. 1999, 45, 1378–1398. [Google Scholar] [CrossRef]
  33. Hong, C.S.; Lee, E.B. Power Plant Economic Analysis: Maximizing Lifecycle Profitability by Simulating Preliminary Design Solutions of Steam-Cycle Conditions. Energies 2018, 11, 2245. [Google Scholar] [CrossRef]
  34. Kannan, R.; Tso, C.P.; Osman, R.; Ho, H.K. LCA–LCCA of oil-fired steam turbine power plant in Singapore. Energy Convers. Manag. 2004, 45, 3093–3107. [Google Scholar] [CrossRef]
  35. Kannan, R.; Leong, K.C.; Osman, R.; Ho, H.K.; Tso, C.P. Life cycle assessment study of solar PV systems: An example of a 2.7 kWp distributed solar PV system in Singapore. Sol. Energy 2006, 80, 555–563. [Google Scholar] [CrossRef]
  36. Xu, M.; Wang, X.; Zhao, L. Predicted supply chain resilience based on structural evolution against random supply disruptions. Int. J. Syst. Sci. Oper. Logist. 2014, 1, 105–117. [Google Scholar] [CrossRef]
  37. Kibira, D.; Jain, S. Impact of hybrid and electric vehicles on automobile recycling infrastructure. In Proceedings of the Winter Simulation Conference, Phoenix, AZ, USA, 11–14 December 2011; pp. 1072–1083. [Google Scholar]
  38. Wang, L.; Wang, X.V.; Gao, L.; Váncza, J. A cloud-based approach for WEEE remanufacturing. CIRP Ann. Manuf. Technol. 2014, 63, 409–412. [Google Scholar] [CrossRef] [Green Version]
  39. Rosa, P.; Terzi, S. Improving end of life vehicle’s management practices: An economic assessment through system dynamics. J. Clean. Prod. 2018, 184, 520–536. [Google Scholar] [CrossRef]
  40. Musacchio, A.; Khanna, T.; Bernhardson, J. In the Spotlight: The Market for Iron Ore; Harvard Business Review: Boston, MA, USA, 2010. [Google Scholar]
  41. Bhattacharyya, S.S.; Deepak, P.K. Comprehending the changing global iron ore trade service system and the dynamics of pricing. Int. J. Bus. Glob. 2012, 9, 70–89. [Google Scholar] [CrossRef]
  42. SMM. China Nickel Monthly; No.57; China. Available online: http://www.metal.com (accessed on 16 March 2016).
  43. Cottrell, W.D. Simplified program evaluation and review technique (PERT). J. Constr. Eng. Manag. 1999, 125, 16–22. [Google Scholar] [CrossRef]
  44. Son, W.P.; You, I.K. Life Cycle Cost Method of Pavement. Korea Highway Assoc. 2001, 3, 61–71. [Google Scholar]
  45. Park, C.S. An Introduction to Engineering Economy; ChungRam: Seoul, Korea, 2014; ISBN 978-8-95972-365-2. [Google Scholar]
  46. Lee, D.H. Steel Plant with NPV at Risk. Master’s Thesis, Pohang University of Science and Technology, Graduate School of Engineering Mastership, Pohang, Korea, 2015. [Google Scholar]
  47. Jeon, K.S. A Study on the Decision-Making Methodology of Economic Evaluation Considering Uncertainty in Steel Plant Project. Master’s Thesis, Pohang University of Science and Technology, Graduate School of Engineering Mastership, Pohang, Korea, 2014. [Google Scholar]
  48. Lee, J.H. A Comparative Study on the Optimization Models for Steel Projects using LCCA. Master’s Thesis, Pohang University of Science and Technology, Graduate School of Engineering Mastership, Pohang, Korea, 2016. [Google Scholar]
  49. Breidenbach, D.D.P. Life Cycle Cost Analysis. In Proceedings of the Aerospace and Electronics Conference, Dayton, OH, USA, 22–26 May 1989; pp. 1216–1220. [Google Scholar]
  50. Kim, D.H. Developing and Applying Tolling Model to Steel Plant Project. Master’s Thesis, Pohang University of Science and Technology, Graduate School of Engineering Mastership, Pohang, Korea, 2015. [Google Scholar]
Figure 1. SPC stakeholders’ interactions and agreements.
Applsci 08 02100 g001
Figure 2. Research methodology flow.
Applsci 08 02100 g002
Figure 3. Ni and Fe recovery rate and recovery ratio (modified from [7]).
Applsci 08 02100 g003
Figure 4. Ni and Fe content in metal ore (Ni/Fe Ratio).
Applsci 08 02100 g004
Figure 5. Effect of Metal Composition when Ni Composition Decreases.
Applsci 08 02100 g005
Figure 6. Effect of Metal Composition when Fe Composition Increases.
Applsci 08 02100 g006
Figure 7. Effect of sales and profits by decrease of Ni composition.
Applsci 08 02100 g007
Figure 8. NPV probabilistic analysis (a) without model and (b) with model.
Applsci 08 02100 g008
Figure 9. IRR probabilistic analysis (a) without model and (b) with model.
Applsci 08 02100 g009
Figure 10. PI Probabilistic Analysis Comparison of Case with and without Model.
Applsci 08 02100 g010
Table 1. Model 2′s fluctuating price ratios per change in Ni content.
Ore Ni Percent2.01.91.81.71.61.5
Variable
Price Ratio0.250.2470.2370.2270.2150.201
Table 2. Model 3′s fluctuating price ratios per decrease in Fe Content.
Ore Fe Percent151719212325
Variable
Price Ratio0.250.2460.2420.2380.2340.230
Table 3. With and without ore purchase index model LCCA: best, worse, and worst cases.
Condition
Not-Applying Ore Purchase Index ModelCase 1 (Best)Ni content 2.0%, Fe content 15% in an Ore
Case 2 (Worse)Ni content 1.9%, Fe content 17% in an Ore
Case 3 (Worst)Ni content 1.8%, Fe content 19% in an Ore
Applying Ore Purchase Index ModelCase 1 (Best)Ni content 2.0%, Fe content 15% in an Ore
Case 2 (Worse)Ni content 1.9%, Fe content 17% in an Ore
Case 3 (Worst)Ni content 1.8%, Fe content 19% in an Ore
Table 4. Assumptions for Economic Analysis.
VariableValueUnit
Construction Duration *2Years
Project Operation Duration15Years
Depreciation Duration15Years
Tax Rate24.2%
Discount Rate7%
Investment Cost260$ million
Operation (maintenance) CostPartially **
Operational ProfitsVaries ***$ million
Ni Production26,000Tons
Ni LME Price15,000$/ton
* The construction duration of Ni production facility was estimated to be two years based on Company A’s past experience with Ni smelters. This value is used for the capital expenditure investment timeline in the cash flow and NPV. ** Operation cost for equipment maintenance is assumed about 1.5% of investment cost per year. Other operational costs (e.g., operation man-hour) are not included, as they are common cost components for all scenarios (therefore cancelled out in a LCCA comparison). *** Operational profits include operational costs and sales derived from Ni and Fe ore content.
Table 5. Cost and profit with Ni content variation (constant price ratio).
Ni Content2.01.91.81.71.61.5
Variable
Ore Price ($ M USD /ton)72.068.464.861.257.654.0
Ore Purchasing Cost ($ M USD *)112.1106.5100.995.389.784.1
Profit Decrease ($M USD *)-16.533.149.666.182.6
* Currency conversion from KRW (Korean Won) to USD was made based on the average exchange rate of 1 USD = 1000 KRW in 2018.
Table 6. Cost and profit with Ni content variation (fluctuating price ratio).
Ni Content2.01.91.81.71.61.5
Variable
Ore Price ($M USD /ton)72.067.561.555.549.543.5
Ore Purchasing Cost ($M USD *)112.1105.195.786.477.167.8
Profit Decrease ($ M USD *) 15.127.940.753.566.3
* Currency conversion from KRW (Korean Won) to USD was made based on the average exchange rate of 1 USD = 1000 KRW in 2018.
Table 7. Cost and profit with Fe content variation (fluctuating price ratio).
Ni Content2.01.91.81.71.61.5
Variable
Ore Price ($M USD /ton)72.070.869.768.567.466.2
Ore Purchasing Cost ($ M USD *)112.1110.3108.5106.7104.9103.1
Profit Decrease ($ M USD *) 00000
* Currency conversion from KRW (Korean Won) to USD was made based on the average exchange rate of 1 USD = 1000 KRW in 2018.
Table 8. Analysis result.
VariableNot Applying Index ModelApplying Index ModelVariation
IRR > Internal Rate31.1%35.9%4.8
NPV > 028.8%33.8%5
PI (Range)−1.6~12.6%−0.9~13.3%

