Optimal Energy Management of V2B with RES and ESS for Peak Load Minimization


1
Department of Computer Engineering, Chonbuk National University, Jeonju 561-756, Korea
2
Department of Electronic Engineering, Universidad Técnica Federico Santa María, Valparaíso 2390123, Chile
3
Smart Grid Research Center, Chonbuk National University, Jeonju 561-756, Korea
*
Author to whom correspondence should be addressed.
Appl. Sci. 2018, 8(11), 2125; https://doi.org/10.3390/app8112125
Submission received: 10 October 2018
/
Revised: 27 October 2018
/
Accepted: 28 October 2018
/
Published: 1 November 2018
(This article belongs to the Special Issue Electric Vehicle Charging)
Abstract
:Featured Application
This work studies the impact of EV charging on the building’s power consumption and presents a cost-effective solution for peak load minimization in an educational building equipped with a PV system and an ESS.
Abstract
In order to decrease fuel consumption and greenhouse gas emissions, electric vehicles (EVs) are being widely adopted as a future transportation system. Accordingly, increasing the number of EVs will mean battery charging will have a significant impact on the power grid. In order to manage EV charging, an intelligent charging strategy is required to prevent the power grid from overloading. Therefore, we propose an optimal energy management algorithm (OEMA) to minimize peak load on a university campus consisting of an educational building with laboratories, a smart parking lot, EVs, photovoltaic (PV) panels and an energy storage system (ESS). Communication networks are used to connect all the system components to a university energy management system (UEMS). The proposed OEMA algorithm coordinates EV charging/discharging so as to reduce the peak load of the building’s power consumption by considering the real-time price (RTP). We also develop a priority determination method for the time allocation of the optimal charging algorithm. Priority is determined by arrival time, departure time, state-of-charge (SOC), battery capacity and trip distance. The performance of the proposed algorithm is evaluated in terms of charging cost and peak load under the real environment of the university engineering building.
1. Introduction
Nowadays, electric vehicles (EVs) are receiving great attention due to their benefits in saving energy, decreasing greenhouse gas emissions, and reducing the dependence on conventional fossil fuels [1,2]. Driven by policies and regulations, the number of EVs is projected to rise significantly over the coming decades [3,4]. As the penetration rate of EVs is expected to continue growing exponentially, a lot of energy will be required to support EV charging. The influences of EVs on the power grid may include power losses (feeders overloading and transformer overloading) and power quality (harmonics, unacceptable voltage fluctuations and voltage profile) [5]. Without any control strategies, the charging process of EVs will significantly affect the electric power grid, especially during peak hours [6]. Among the possible solutions to cope with the new peak demand during peak hours is to increase power generation to handle the growth in vehicle charging or to upgrade the distribution system infrastructure. However, these are difficult and expensive solutions [7]. In order to manage and coordinate an EV charging/discharging operation, there is a need for a cost-effective solution, especially in the distribution power network.
Different research work and studies have been conducted for EV charging schemes from different perspectives, including distribution transformer aging [8], apartment buildings [9], office buildings [10] and commercial buildings [11]. Paterakis et al. [8] studied the impact of smart neighborhood load on a distribution transformer aging under a time-varying pricing scheme. The system consisted of a low voltage distribution system across four houses. Each house was equipped with a rooftop photovoltaic (PV) and an energy storage system (ESS). Different scenarios have been investigated considering different EV types. Van Roy et al. [9] investigated the impact of EV charging strategies in an apartment building equipped with a PV system in terms of an EV utility factor, self-power consumption, and grid impact. Van Roy et al. [10] discussed the impact of different EV charging strategies in a real office building equipped for EVs, a large photovoltaic system and a combined heat and power (CHP) unit. Charging strategies have been evaluated in terms of self-electricity consumption and grid impact. Energy storage solutions such as battery storage systems were not considered in References [9,10]. Tavakoli et al. [11] investigated a two-stage energy management strategy for a demand response program considering the operation of EVs and a wind power-based commercial building microgrid with the objective of minimizing the building’s operational costs.
Charging schemes are classified into four basic types: uncontrolled, indirectly controlled, smart and bidirectional charging [12,13]. In uncontrolled charging, there is no attempt to schedule EVs as they begin to charge immediately from the charging stations upon their arrival. Indirectly controlled schemes aim to control some parameters such as charging cost and energy price that will affect the charging operation indirectly. Both smart charging schemes and bidirectional charging schemes aim to control the charging parameters directly, such as output power from a charging station, charging time, and charging duration. However, bidirectional charging schemes support vehicle-to-grid (V2G) concepts that enable EV batteries to discharge.
Coordinating EV charging has a major impact on end users [14,15,16,17,18], retailers [19,20], and power grid operators [21,22,23]. With respect to end user preferences, authors in [14,15] studied the scheduling problem of EV charging in order to minimize customers’ electricity payments and reduce the peak to average power ratio (PAPR). Deilami et al. and Akhavan-Reai et al. [16,17] proposed real-time EV load management to minimize the total energy cost for plug-in electric vehicle (PEV) charging and the corresponding grid energy losses. The proposed scheme in [16] assigned preference time zones with different energy tariffs to customers in order to charge their vehicles. Authors in [18] simulated an EV charging model for an individual EV load profile under a real-time price (RTP) to minimize electricity payments for users. In addition, Zhao et al. [19,20] studied the online peak-minimizing algorithm for an aggregator, which managed a large set of EV charging jobs with deadlines by planning the charging schedules in order.
With respect to the distribution power system, Khatiri-Doost et al. [21] presented a new approach for the coordination of the charging and discharging of multiple EVs in a smart distribution system. The main objective was to minimize the peak shaving and active power losses. Alonso et al. [22] developed and implemented an optimization algorithm for managing EV charging by considering a genetic algorithm in a low voltage distribution system. The proposed algorithm took into account the thermal line limit, transformer loading, parking availability, and voltage limits. Chaudhari et al. [23] proposed a hybrid optimization algorithm for minimizing EV charging costs using energy storage management in a PV-integrated charging station. The algorithm considered the real-time electricity price and real-time PV output from the solar system in the PV-integrated charging station.
In order to maintain the technical limits of the power grid, power grid operators are aiming to design flexible EV charging schemes while satisfying the vehicle owner’s preferences. To achieve this goal, bidirectional power and information flows are required. Therefore, the aggregator plays the main role between the power grid operator and vehicle owners in the EV system. For encouraging end users to change energy usage habits, time-of-use (TOU), real-time pricing (RTP) and critical peak pricing (CPP) are different price-based options as defined by the US Dept. of Energy during different time-periods [24,25].
The activities of EVs including charging and discharging enable them to participate in various domains such as vehicle-to-home (V2H), vehicle-to-building (V2B), V2G and vehicle-to-vehicle (V2V) [26,27,28]. V2B consists of EVs, bidirectional chargers and small-scale renewable energy resources, such as photovoltaic systems and small-scale wind turbines. EVs are able to draw/transfer the energy from/to the building based on their battery status and offer services such as reducing the on-peak load of the building’s power consumption through peak shaving, load shifting and valley filling.
This paper studies the impact of EV charging on the building’s power consumption and presents a cost-effective solution for peak load minimization in an educational building equipped with a PV system and an ESS. In this work, we propose an optimal energy management algorithm (OEMA) for peak load minimization in a university campus. The system model consists of an educational building with laboratories, a smart parking lot, EVs, PV panels and an ESS. We also propose a time allocation scheme for EV charging and discharging based on priority. The priority determination rules are calculated based on different decision factors including both vehicle and user preference. We define three different priority levels as high, medium and low. Charging services will be allocated to EVs with higher priorities without violating the operational constraints of the grid. The proposed scheme is designed to minimize EV charging cost while balancing the load of the power grid. The simulation results outperformed the conventional charging method in terms of peak power and charging cost.
The remainder of this paper is organized as follows: Section 2 presents the system architecture and components. Section 3 explains the proposed optimal energy management algorithm in detail. Section 4 presents the simulation results and a discussion of different scenarios and the conclusion is given in Section 5.
2. System Architecture and Components
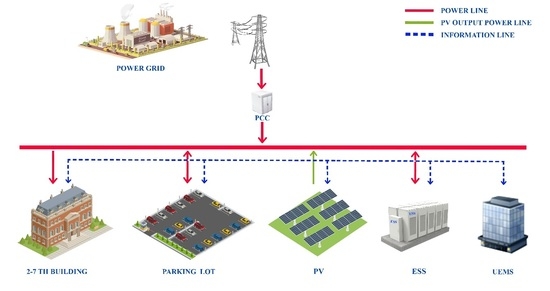
The system architecture considered in this work is shown in Figure 1. It consists of an educational building with laboratories (engineering building 2–7), a smart parking lot with 100 charging/discharging stations, PV panels, and an ESS. The power grid is connected to the system through a point of common coupling (PCC). The power grid supports the electric power for both the building and the parking lot. The university energy management system (UEMS) is a local controller responsible for serving both the building’s energy demands as well as EV demands. The UEMS receives monitoring data from different sub-systems through communication networks. The major roles of the UEMS are:
- To receive information about the real-time price from the power grid and the building’s power consumption.
- To receive information from PV and ESS to decide on their participation.
- To receive information from newly arrived EVs and the priority determination of each EV.
- To allocate time slots for EV charging with a low cost and discharging with a high cost by considering their priority and load profile.
- To update the building load profile.
2.1. Building Model
This work considers the real case study for the power consumption of the engineering building (2–7) of Chonbuk National University, Jeonju Campus, South Korea. The rooms of the educational building are used for teaching, research and as laboratories. The main objective is to minimize the peak power consumption for the engineering building during peak hours by considering vehicle-to-building (V2B) and renewable energy sources (RES). Figure 2 shows the hourly power consumption during a working day.
2.2. Parking Lot Model
Figure 3 illustrates the arrival time and departure time of 100 EVs. The characteristics of arrival time and departure time are defined using a Gaussian normal distribution of µ = 8:30 a.m., σ = 1 and µ = 6:30 p.m., σ = 2, respectively, given in Equation (1). The average daily trip distance is considered to be 50 km with a standard deviation of 10 km (µ = 50, σ = 10). In addition, the initial state-of-charge (SOC) of EVs are considered as randomly generated from 10% to 80%. The driving behavior of EV owners is dependent on their arrival time, departure time, initial SOC and daily trip distance.
2.3. Photovoltaic Model
The PV panels are used to convert the sunlight to electricity. The position of the PV surface should be perpendicular to the sunlight. The output power during the day may be different based on solar irradiation, temperature and weather conditions. Equation (2) shows the output power of the PV system where η is the conversion efficiency of PV cells, S is the surface area of the PV surface, I is the solar radiation and Ta is the ambient temperature [29]. Figure 4 shows the predicted output power of PV panels considered in this work.
2.4. Energy Storage System Model
The energy storage system consists of electrochemical devices that are able to store energy either from AC or DC sources. The ESS can be considered as a load during charging and a controlled generator during discharging. In order to prevent the ESS from undercharging and overcharging, the ESS is limited by its minimum and maximum energy storage, as given in Equation (3). We considered an ESS with a maximum charging and minimum discharging of 80% and 20%, respectively.
3. Proposed Optimal Energy Management Algorithm
The main objective of the energy management system is to minimize the total power consumption from the main power grid, as given in Equation (4).
where is the amount of power consumption from the main power grid at time ts, is the building power consumption at time ts, is the charging/discharging capacity of an EV at time ts, is the charging/discharging capacity of the ESS at time ts, and is the generated power from the PV system at time ts. The coefficients α, β, and γ are related to EV, ESS, and PV, respectively, as shown in Equations (5)–(7).
In this work, the proposed optimal energy management algorithm (OEMA) assigns different priorities to EV charging by considering the status of the building’s power consumption, PV output and ESS. We assume that time is slotted and indexed by an integer in T = {1,2, 3, …, T}, where T is the time-period. The time-period is 24 h consisting of time slots. The time slot size (∆ts) is 15 min. The main objective of this work is to minimize EV charging costs while balancing the load profile of the power grid. We calculate the required number of charging timeslots (Nt) for each EV based on Equation (8) where SOCreq is the desired SOC of the EV battery for the user for the next trip (departure time), Bev is battery capacity, Pc is charging rate and η is the coefficient of charging power rate.
The EV charging cost is given in Equation (9) where C is the minimum EV charging cost, Celec(ts) is the charging cost, Pc is the charging rate, and η is charging efficiency.
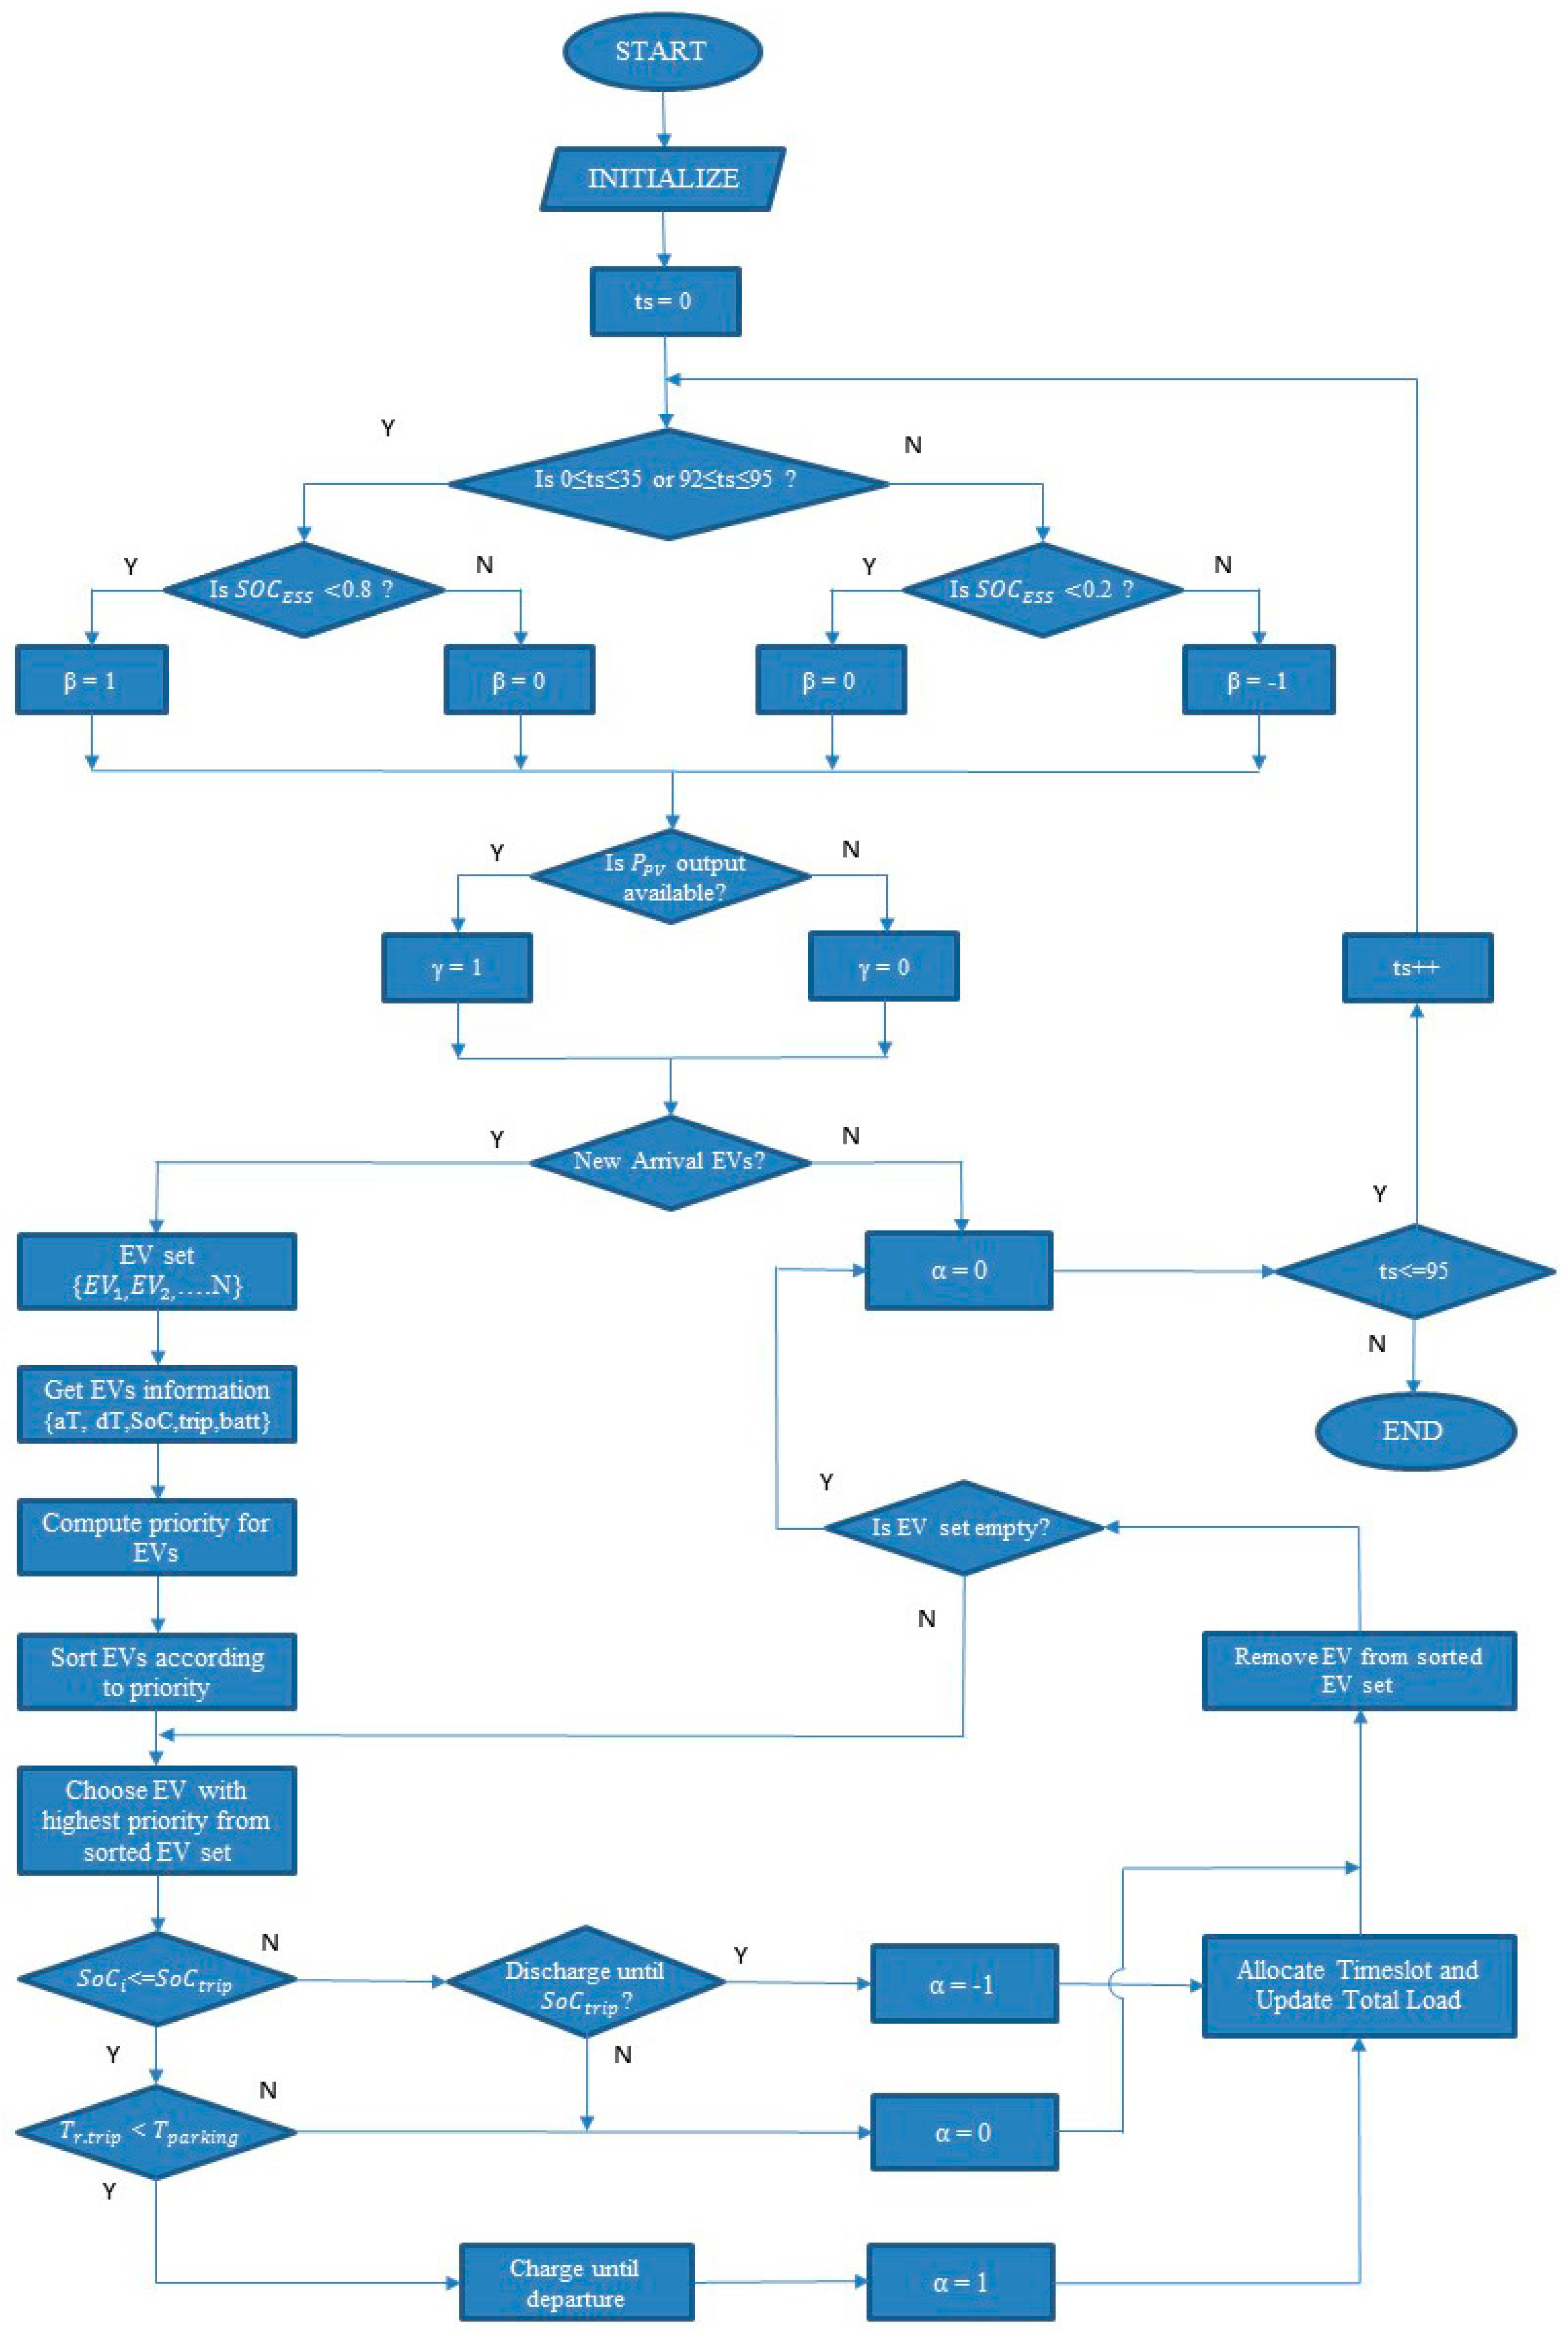
Figure 5 illustrates the main flow chart of the proposed algorithm. The algorithm includes three main parts: ESS, PV output and EV charging/discharging with the user’s preferences. The UEMS receives monitoring data from different sub-systems through communication networks. The major roles of the UEMS are:
- Step 1: -Initiation.
- New day begins ts = 0.
- Get the day-ahead load profile of the engineering building and PV output.
- Get SOC of ESS.
- Step 2: -Check Status of ESS.
- Check time period (off, mid, on).
- Check ESS status at current ts then decide on the participation of ESS.
- If (SOC of ESS < 80%) β = 1 {charge ESS by charging power of ESS} else (SOC of ESS > 80%) β = 0 if (SOC of ESS < 20%) β = 0 {charge ESS by charging power of ESS} else (SOC of ESS > 20%) β = −1
- Step 3: -Check Status of PV output.
- Check PV output at current ts, if PV output is available γ = 1, else γ = 0,
- Step 4: -Check New Arrival of EVs and Priority Determination.
- Check newly arrived EVs in current ts.
- Create EV set then enroll new arrival EVs in EV set.
- Get EV information such as arrival and departure time, SOC, battery capacity and trip distance.
- Compute priority for EVs according to EV information.
- Descending sort EVs according to priority.
- Choose EV with highest priority from sorted EV set.
- Check the current SOC and decide participation with user’s preference (charge or discharge).
- Allocate numbers of charging/discharging timeslots into the building load profile.
- Step 5: -Update load profile
- The load profile is updated.
- If ts number is greater than 95, finish programming unless ts increased by one then go to step two.
Priority Determination Algorithm
The priority determination rules are calculated based on different decision factors including both vehicle and user preference. The main parameters of priority rules are arrival time, departure time, SOC, trip distance and battery capacity. After calculating the EV priority, the aggregator assigns these priorities to EVs for charging, as given in Equation (10) where , , and are stay time, state of charge, trip distance and battery capacity, respectively. After EVs have been prioritized, the highest priority EVs are allocated first for charging (timeslots with low electricity cost).
We defined three different priority levels as high, medium and low, as shown in Table 1. Regarding the EV stay time, low priority is given if the EV stay time is greater than 6 h while high priority is considered if the EV stay time is less than 3 h. With respect to the initial SOC of an EV battery, we define a high priority for SOC as less than 20%, medium as 20–80% and low priority as a SOC greater than 80%. We also consider trip distance; low priority for a trip is less than 10 km, medium 10–60 km and high priority greater than 60 km. Two priority levels for EV battery capacity are defined; medium and low. Low priority is assigned to a battery capacity less than 30 kWh while medium priority is greater than 30 kWh. As a result, the charging service will be allocated to EVs with higher priorities without violating the grid’s operational constraints. Algorithm 1 explains the priority determination algorithm in detail.
| Algorithm 1. Priority Determination Algorithm |
| Input: V—Set of charging requests from EVs |
| Info—information of arrival of EVs (, , ) |
| Output: P—Set of priority lists for charging EVs |
| 1. , , , |
| 2. for i ← 1 to |V| do |
| 3. if 20 then |
| 4. |
| 5. else if 80 then |
| 6. |
| 7. else if then |
| 8. |
| 9. end if; |
| 10. if 3 then |
| 11. |
| 12. else if 6 then |
| 13. |
| 14. else if then |
| 15. |
| 16. end if; |
| 17. if 10 then |
| 18. |
| 19. else if 40 then |
| 20. |
| 21. else if then |
| 22. |
| 23. end if; |
| 24. if 10 then |
| 25. |
| 26. else if then |
| 27. |
| 28. end if; |
| 29. ; |
| 30. P.insert (); |
| 31. end for |
4. Simulation Results
In this work, we considered a real case study to evaluate the performance of the proposed optimal energy management algorithm. The real data for the demand load profile of the engineering building 2–7, Chonbuk National University, Jeonju Campus, South Korea were obtained during a working day. We considered five different scenarios with different system configurations, as given in Table 2. We assumed the time slot size was set to be 15 min, the ESS capacity was set to 50 kWh, and the charging and discharging power of ESS was 6.6 kWh. The output power of the PV system was based on Reference [30]. Simulation parameters and assumptions are given in Table 3.
Three types of EVs (Hyundai BlueOn, Kia Soul and Nissan Leaf Zeo) with different battery capacities (16.4 kWh, 27 kWh and 30 kWh) were considered [31], as given in Table 4. The charging and discharging power for each EV was set to 3.6 kWh. The charging and discharging efficiency were configured as 0.90 and 0.85, respectively. The driver behavior regarding arrival time, departure time, and driving range is given in Table 5. The electricity cost of Korea Electric Power Corporation (KEPCO) during the summer season is shown in Table 6. We considered the electric rate of an educational tariff with option two [32]. We used C++ programming language for our real-time algorithm. Also, we used Qt Creator which is a cross-platform C++, JavaScript and QML integrated development environment which is part of the software development kit (SDK) for the graphical user interface (GUI).
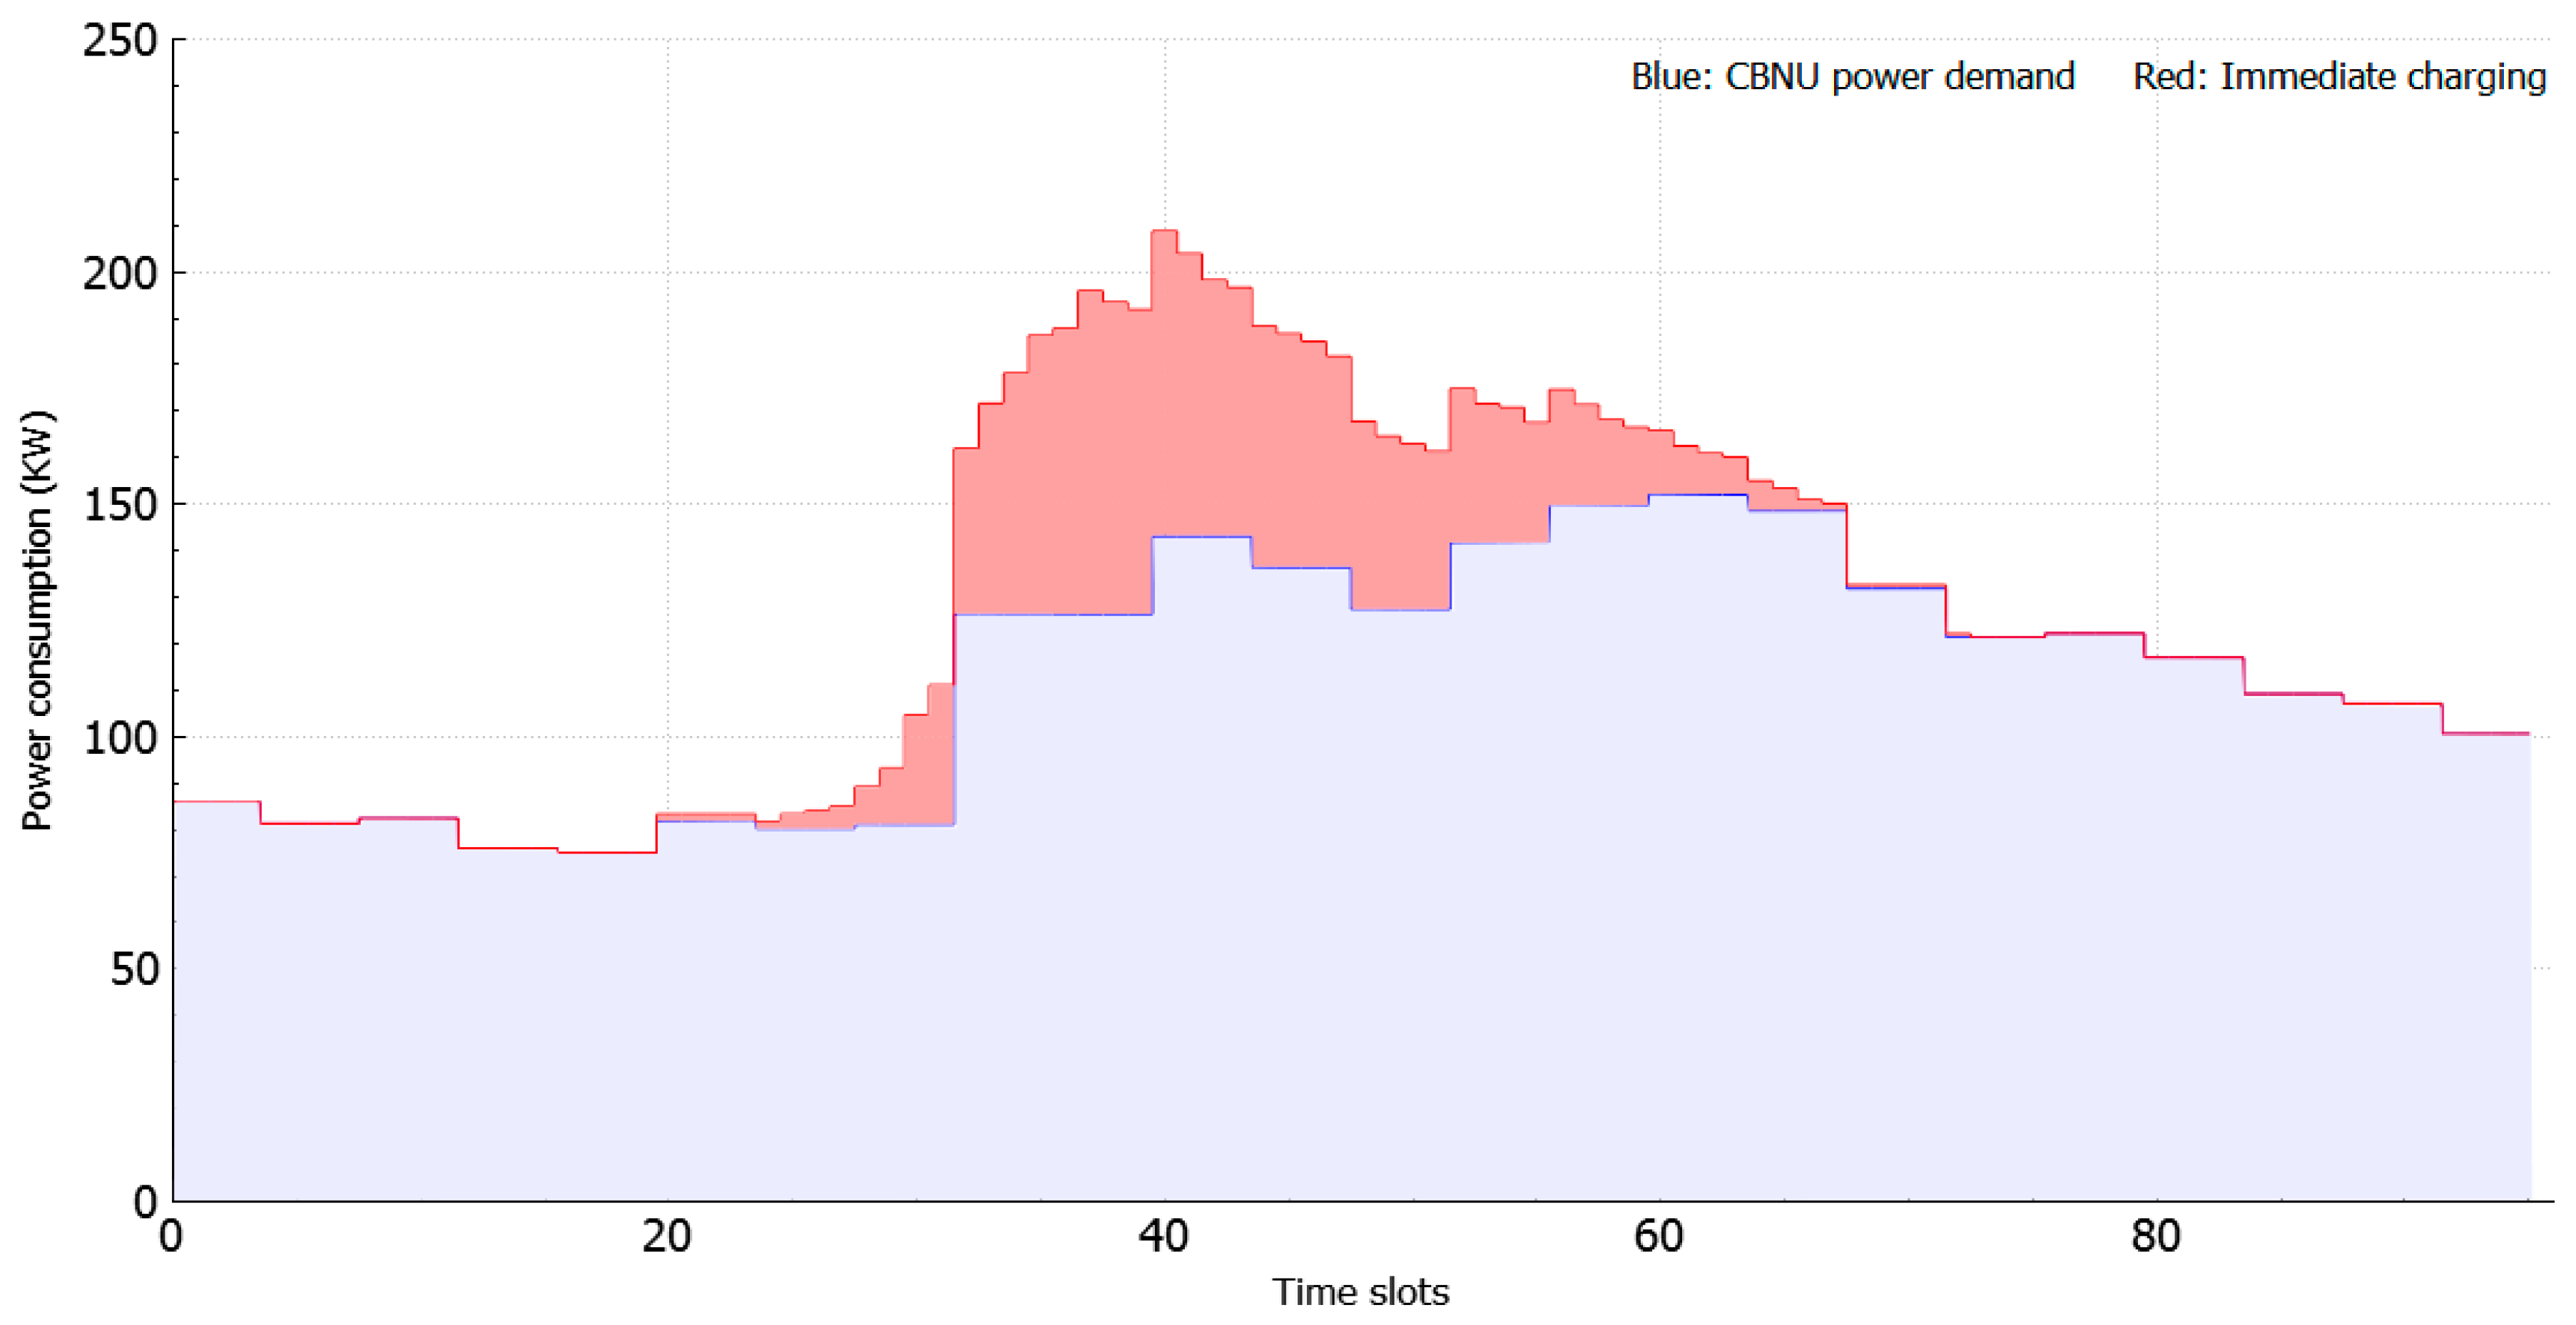
4.1. Scenario One: Immediate Charging EVs
In immediate charging, EVs start charging directly upon arrival without any attempt to schedule or organize their needs. Figure 6 shows the result of the uncoordinated charging scheme where 100 EVs were charged immediately after arriving at the parking lot. The peak power consumption was about 208 kW at 11.00 a.m. The charging load of the EVs coincided with the building’s daily peak demand hours. Both the PV system and the ESS were not configured in this scenario. The result showed that the impact of EV charging on the building power consumption was very severe.
4.2. Scenario Two: EVs Coordinated Charging
The coordinated charging aims to manage/organize EV charging in order to decrease the peak power consumption of the building while fulfilling user requirements. Figure 7 shows the result of the coordinated charging scheme for 100 EVs. The PV system and the ESS were not considered as in scenario one. The proposed algorithm was able to manage the charging of EVs with minimum charging cost, however, power consumption showed two peaks during the periods of low charging cost. The first time period was between 9:00 a.m. and 11:00 a.m., and the second time period was at 1:00 p.m. The peak power consumption was about 192 kW at 10:15 a.m., which was lower than in scenario one.
4.3. Scenario Three: EVs, PV and ESS
Scenario three considers the cooperation among EVs, PV and ESS to reduce the building’s power consumption. Compared to scenario one and scenario two, EVs were able to discharge part of their batteries in order to support the load demands of the building by providing power during peak periods. Figure 8 shows the simulation result considering 50 EVs, a PV system of 10 kWh and an ESS of 30 kWh. The proposed algorithm showed a reduction in the building’s power consumption during the period between 11:00 a.m. and 7:00 p.m. During that time, the output power from PV panels was enough to support part of the EV charging during their parking time. We noticed that power consumption during the remaining periods was similar to the initial building power consumption.
4.4. Scenario Four
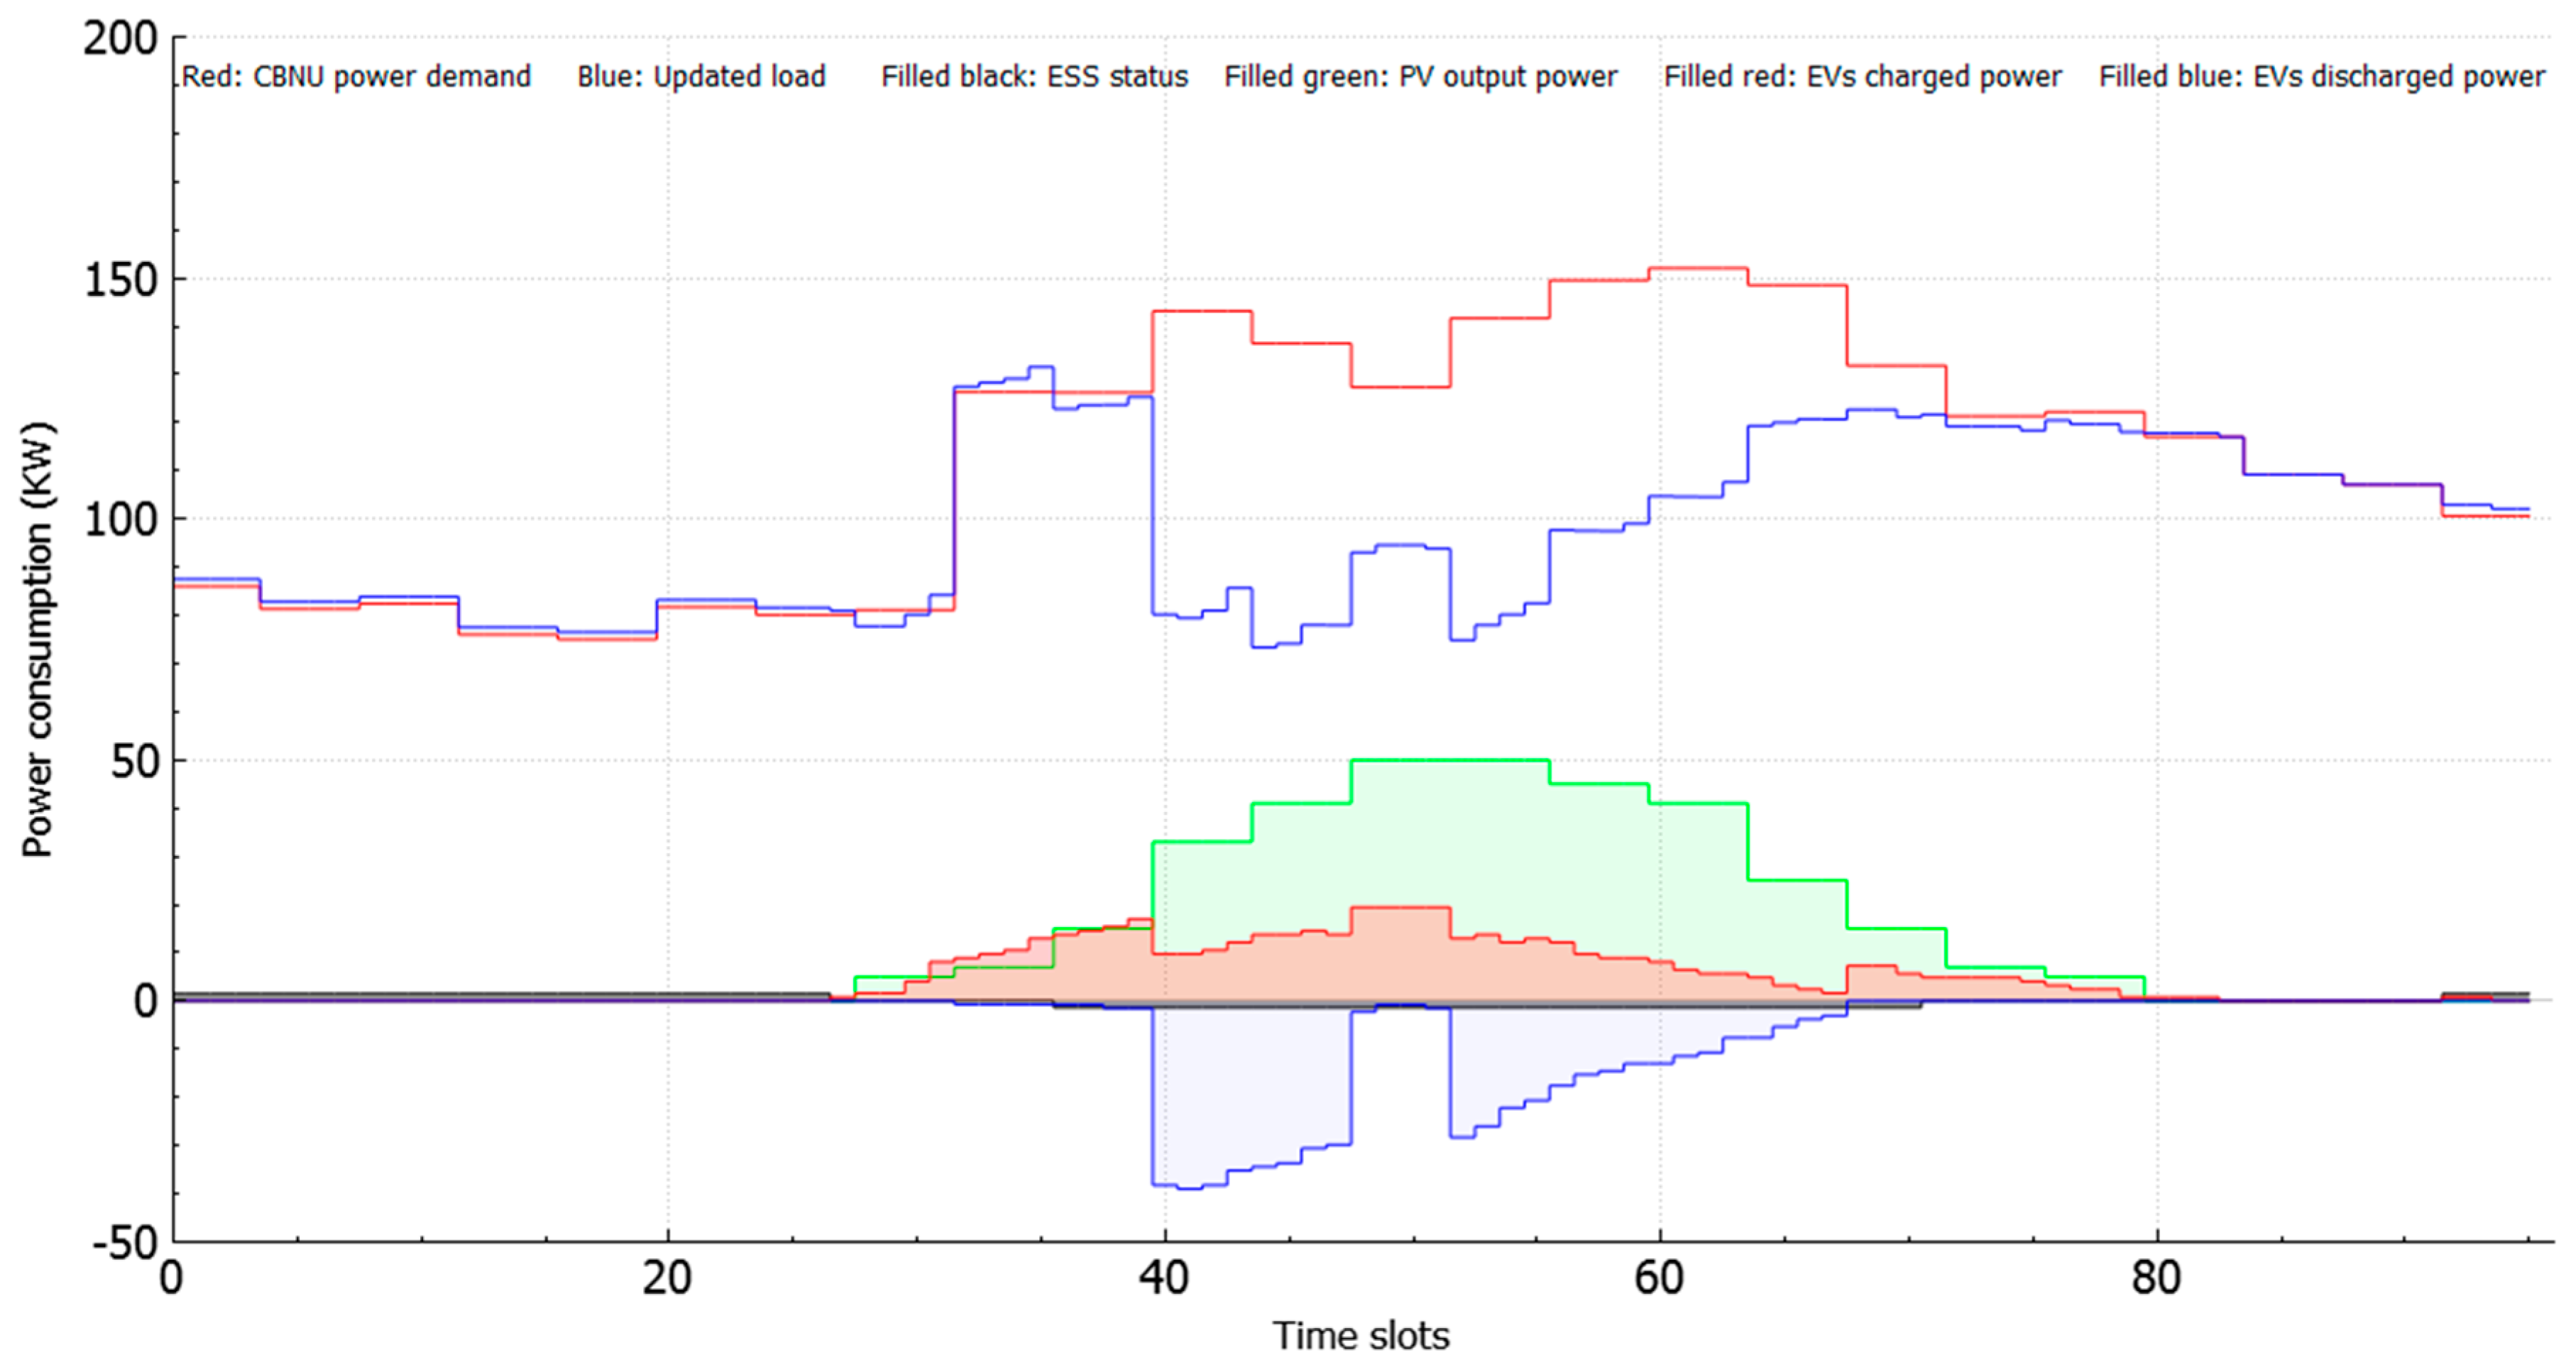
Scenario four was an extension to scenario three, considering a system configuration with 100 EVs, a PV system of 30 kWh and an ESS of 50 kWh. The output power from the PV system was enough to decrease the building’s power consumption during the period between 11:00 a.m. and 8:00 p.m., as shown in Figure 9. As the number of EVs had been doubled compared to scenario three, there was an increase in the building’s power consumption at 9:00 a.m. Peak power consumption was about 132 kW. This increase was due to the low charging costs during the mid-peak from 9:00 a.m. to 10:00 a.m.
4.5. Scenairo Five
We also considered a future scenario for the university building with a PV system of 50 kWh, an ESS of 80 kWh and a smart parking lot to support 150 EVs. The simulation results showed a great reduction in building power consumption during the period from 11:00 a.m. to 6:00 p.m., as shown in Figure 10. However, there was a small reduction in the power consumption during the period between 9:00 a.m. and 11:00 a.m.
Table 7 shows a comparison between different scenarios with respect to peak power consumption, charging/discharging costs and the number of EVs. The initial peak demand of the educational building was about 152 kW. Considering an uncontrolled charging scenario, there was a significant increase in the peak power consumption of about 26.92% (208 kW). However, scheduling EV charging with the help of the PV system and the ESS gave an opportunity to decrease the building’s peak power. The simulation results showed that peak load decreased by about 14.47% and the charging cost of EVs reduced from 202,294 KRW in scenario one to 74,319 KRW in scenario five.
5. Conclusions
Based on the increasing penetration rate of EVs, the charging load of EVs will have a significant effect on the total power consumption of the power grid. In this work, we proposed an optimal energy management scheme to charge or discharge EVs efficiently by considering V2B with RES and ESS. To evaluate the performance of the proposed algorithm, we selected our university building as a case study. The system consisted of an educational building with laboratories, a smart parking lot with 100 charging/discharging stations, PV panels, and an ESS. The simulation results showed that immediate charging had a severe impact on the building’s power consumption. However, scheduling EV charging with the help of the PV system and the ESS was able to minimize the EVs charging cost while decreasing the on-peak load of the building’s power consumption. This implies that the proposed algorithm could be applied to an energy management system for a microgrid such as commercial buildings, campuses and parking lots. As a future work, our scheduling algorithm will be extended to include the predicted power from the solar power system. In addition, we will consider the real data for the building’s power consumption over a long period.
Author Contributions
N.O. and Y.-C.K. proposed the algorithm of this paper; K.-B.L. and M.A.A. helped in analysis of the results; N.O. and M.A.A. wrote the paper; Y.-C.K. provided guidance during the whole research.
Funding
This work was supported by the research fund of the Chonbuk National University in 2017 and the National Research Foundation of Korea (NRF) funded by the Ministry of Science, ICT and Future Planning (2017-004868).
Conflicts of Interest
The authors declare no conflicts of interest.
Nomenclature
| Grid supply power | |
| Building demand power | |
| Charging/discharging power of EV | |
| Charging/discharging power of ESS | |
| Generation power of PV output | |
| Battery capacity of EV | |
| Battery capacity of ESS | |
| Maximum range of EV | |
| Trip distance of EV | |
| Charging/discharging power rate efficiency | |
| Arrival time | |
| Departure time | |
| Stay time | |
| Current SoC of EV | |
| Required SoC for trip | |
| SoC of ESS | |
| Time slot size | |
| Coefficient of EV | |
| Coefficient of ESS | |
| Coefficient of PV | |
| Total charging/discharging cost | |
| Electricity cost | |
| Required number of charging slots for trip |
References
- Wu, Z.; Wang, M.; Zheng, J.; Sun, X.; Zhao, M.; Wang, X. Life cycle greenhouse gas emission reduction potential of battery electric vehicle. J. Clean. Prod. 2018, 190, 462–470. [Google Scholar] [CrossRef]
- Rehmani, M.H.; Reisslein, M.; Rachedi, A.; Erol-Kantarci, M.; Radenkovic, M. Integrating Renewable Energy Resources into the Smart Grid: Recent Developments in Information and Communication Technologies. IEEE Trans. Ind. Inform. 2018, 14, 2814–2825. [Google Scholar] [CrossRef]
- Mahmud, K.; Town, G.E.; Morsalin, S.; Hossain, M.J. Integration of electric vehicles and management in the internet of energy. Renew. Sustain. Energy Rev. 2018, 82, 4179–4203. [Google Scholar] [CrossRef]
- Van der Steen, M.; van Schelven, R.M.; Kotter, R.; van Twist, M.J.W.; van Deventer, P. EV Policy Compared: An International Comparison of Governments’ Policy Strategy towards E-Mobility. In E-Mobility in Europe; Leal Filho, W., Kotter, R., Eds.; Springer: Cham, Switzerland, 2015; pp. 27–53. ISBN 978-3-319-13194-8. [Google Scholar]
- Clement-Nyns, K.; Haesen, E.; Driesen, J. The Impact of Charging Plug-In Hybrid Electric Vehicles on a Residential Distribution Grid. IEEE Trans. Power Syst. 2010, 25, 371–380. [Google Scholar] [CrossRef] [Green Version]
- Nguyen, H.K.; Song, J. Bin Optimal charging and discharging for multiple PHEVs with demand side management in vehicle-to-building. J. Commun. Netw. 2012, 14, 662–671. [Google Scholar] [CrossRef]
- Mukherjee, J.C.; Gupta, A. A Review of Charge Scheduling of Electric Vehicles in Smart Grid. IEEE Syst. J. 2015, 9, 1541–1553. [Google Scholar] [CrossRef]
- Paterakis, N.G.; Pappi, I.N.; Erdinc, O.; Godina, R.; Rodrigues, E.M.G.; Catalao, J.P.S. Consideration of the Impacts of a Smart Neighborhood Load on Transformer Aging. IEEE Trans. Smart Grid 2016, 7, 2793–2802. [Google Scholar] [CrossRef]
- Van Roy, J.; Leemput, N.; Geth, F.; Salenbien, R.; Buscher, J.; Driesen, J. Apartment Building Electricity System Impact of Operational Electric Vehicle Charging Strategies. IEEE Trans. Sustain. Energy 2014, 5, 264–272. [Google Scholar] [CrossRef]
- Van Roy, J.; Leemput, N.; Geth, F.; Buscher, J.; Salenbien, R.; Driesen, J. Electric Vehicle Charging in an Office Building Microgrid With Distributed Energy Resources. IEEE Trans. Sustain. Energy 2014, 5, 1389–1396. [Google Scholar] [CrossRef]
- Tavakoli, M.; Shokridehaki, F.; Marzband, M.; Godina, R.; Pouresmaeil, E. A two stage hierarchical control approach for the optimal energy management in commercial building microgrids based on local wind power and PEVs. Sustain. Cities Soc. 2018, 41, 332–340. [Google Scholar] [CrossRef]
- Kong, P.-Y.; Karagiannidis, G.K. Charging Schemes for Plug-In Hybrid Electric Vehicles in Smart Grid: A Survey. IEEE Access 2016, 4, 6846–6875. [Google Scholar] [CrossRef]
- Shuai, W.; Maille, P.; Pelov, A. Charging Electric Vehicles in the Smart City: A Survey of Economy-Driven Approaches. IEEE Trans. Intell. Transp. Syst. 2016, 17, 2089–2106. [Google Scholar] [CrossRef]
- Wang, Z.; Paranjape, R. Optimal scheduling algorithm for charging electric vehicle in a residential sector under demand response. In Proceedings of the 2015 IEEE Electrical Power and Energy Conference (EPEC), London, ON, Canada, 26–28 October 2015; pp. 45–49. [Google Scholar]
- Ren, D.; Li, H.; Ji, Y. Home energy management system for the residential load control based on the price prediction. In Proceedings of the 2011 IEEE Online Conference on Green Communications, New York, NY, USA, 26–29 September 2011; pp. 1–6. [Google Scholar]
- Deilami, S.; Masoum, A.S.; Moses, P.S.; Masoum, M.A.S. Real-Time Coordination of Plug-In Electric Vehicle Charging in Smart Grids to Minimize Power Losses and Improve Voltage Profile. IEEE Trans. Smart Grid 2011, 2, 456–467. [Google Scholar] [CrossRef]
- Akhavan-Rezai, E.; Shaaban, M.F.; El-Saadany, E.F.; Karray, F. Priority-based charging coordination of plug-in electric vehicles in smart parking lots. In Proceedings of the 2014 IEEE Power & Energy Society Innovative Smart Grid Technologies Conference (ISGT), Washington, DC, USA, 19–22 February 2014; pp. 1–5. [Google Scholar]
- Mohsenian-Rad, A.-H.; Leon-Garcia, A. Optimal Residential Load Control with Price Prediction in Real-Time Electricity Pricing Environments. IEEE Trans. Smart Grid 2010, 1, 120–133. [Google Scholar] [CrossRef]
- Zhao, S.; Lin, X.; Chen, M. Peak-minimizing online EV charging. In Proceedings of the 2013 51st Annual Allerton Conference on Communication, Control, and Computing (Allerton), Monticello, IL, USA, 2–4 October 2013; pp. 46–53. [Google Scholar]
- Zhao, S.; Lin, X.; Chen, M. Peak-minimizing online EV charging: Price-of-uncertainty and algorithm robustification. In Proceedings of the 2015 IEEE Conference on Computer Communications (INFOCOM), Hongkong, China, 26 April–1 May 2015; pp. 2335–2343. [Google Scholar]
- Khatiri-Doost, S.; Amirahmadi, M. Peak shaving and power losses minimization by coordination of plug-in electric vehicles charging and discharging in smart grids. In Proceedings of the 2017 IEEE International Conference on Environment and Electrical Engineering and 2017 IEEE Industrial and Commercial Power Systems Europe (EEEIC/I&CPS Europe), Milan, Italy, 6–9 June 2017; pp. 1–5. [Google Scholar]
- Alonso, M.; Amaris, H.; Germain, J.; Galan, J. Optimal Charging Scheduling of Electric Vehicles in Smart Grids by Heuristic Algorithms. Energies 2014, 7, 2449–2475. [Google Scholar] [CrossRef] [Green Version]
- Chaudhari, K.; Ukil, A.; Kumar, K.N.; Manandhar, U.; Kollimalla, S.K. Hybrid Optimization for Economic Deployment of ESS in PV-Integrated EV Charging Stations. IEEE Trans. Ind. Inform. 2018, 14, 106–116. [Google Scholar] [CrossRef]
- US Department of Energy. Benefits of Demand Response in Electricity Markets and Recommendations for Achieving Them; US Department of Energy: Washington, DC, USA, 2006.
- Muratori, M.; Rizzoni, G. Residential Demand Response: Dynamic Energy Management and Time-Varying Electricity Pricing. IEEE Trans. Power Syst. 2016, 31, 1108–1117. [Google Scholar] [CrossRef]
- Mao, T.; Zhang, X.; Zhou, B. Modeling and Solving Method for Supporting “Vehicle-to-Anything” EV Charging Mode. Appl. Sci. 2018, 8, 1048. [Google Scholar] [CrossRef]
- Liu, C.; Chau, K.T.; Wu, D.; Gao, S. Opportunities and Challenges of Vehicle-to-Home, Vehicle-to-Vehicle, and Vehicle-to-Grid Technologies. Proc. IEEE 2013, 101, 2409–2427. [Google Scholar] [CrossRef] [Green Version]
- Nefedov, E.; Sierla, S.; Vyatkin, V. Internet of Energy Approach for Sustainable Use of Electric Vehicles as Energy Storage of Prosumer Buildings. Energies 2018, 11, 2165. [Google Scholar] [CrossRef]
- Wu, Y.; Ravey, A.; Chrenko, D.; Miraoui, A. A Real Time Energy Management for EV Charging Station Integrated with Local Generations and Energy Storage System. In Proceedings of the 2018 IEEE Transportation Electrification Conference and Expo (ITEC), Long Beach, CA, USA, 13–15 June 2018; pp. 1–6. [Google Scholar]
- Genikomsakis, K.N.; Bocquier, B.; Lopez, S.; Ioakimidis, C.S. Utilizing plug-in electric vehicles for peak shaving and valley filling in non-residential buildings with solar photovoltaic systems. In Proceedings of the 2016 5th International Conference on Smart Cities and Green ICT Systems (SMARTGREENS), Rome, Italy, 23–25 April 2016; pp. 1–10. [Google Scholar]
- Vehicle Fuel Economy and CO2 Emissions: Data and Analyses. Available online: www.energy.or.kr (accessed on 1 July 2018).
- Electric Vehicle Charging Tariff. Available online: http://www.kepco.co.kr (accessed on 20 May 2018).
Figure 1.
System model. PCC: point of common coupling; PV: photovoltaic; ESS: energy storage system; UEMS: university energy management system.
Figure 1.
System model. PCC: point of common coupling; PV: photovoltaic; ESS: energy storage system; UEMS: university energy management system.

Figure 2.
Hourly electricity consumption on 15 May 2018.

Figure 3.
Arrival and departure time of 100 electric vehicles (EVs) at the university parking lot.

Figure 4.
Predicted output power from the photovoltaic panels.

Figure 5.
Flowchart of main algorithm.

Figure 6.
Results of scenario one with immediate charging.

Figure 7.
Results of scenario two with proposed coordinated charging.

Figure 8.
Results of scenario three with 50 EVs, a PV system of 10 kWh and an ESS of 30 kWh.

Figure 9.
Results of scenario four with 100 EVs, a PV system of 30 kWh and an ESS of 50 kWh.

Figure 10.
Results of scenario five with 150 EVs, a PV system of 50 kWh and an ESS of 80 kWh.


Table 1.
Priority definition.
| Parameter | [h] | SoC [%] | [km] | [kWh] | |
|---|---|---|---|---|---|
| Priority | |||||
| HIGH [3] | ≤ 3 | SoC ≤ 20 | 30 ≤ | - | |
| MIDDLE [2] | 3 < < 6 | 20 < SoC < 80 | 10 < < 30 | 30 ≤ | |
| LOW [1] | 6 ≤ | 80 ≤ SoC | ≤ 10 | < 30 | |
Table 2.
Overview of simulation scenarios; NA: not available.
| Number of EVs | PV Output [kWh] | ESS Capacity | |
|---|---|---|---|
| Scenario 1 | 100, Immediate charging | NA | NA |
| Scenario 2 | 100, Scheduled charging | NA | NA |
| Scenario 3 | 50 | 10 | 30 |
| Scenario 4 | 100 | 30 | 50 |
| Scenario 5 | 200 | 50 | 80 |
Table 3.
Simulation parameters and assumption; EVSE: electric vehicle supply equipment.
| Parameter | Value | |
|---|---|---|
| Time slot size | 15 min | 96 time slots in a day |
| Building electricity consumption | Real load profile | |
| Photovoltaic output | 0–30 kWh | Ref. [30] |
| ESS capacity | 50 kWh | Ref. [29] |
| Charging ratio of ESS | 6.6 kWh | Efficiency η = 0.90 |
| Discharging ratio of ESS | 6.6 kWh | Efficiency η = 0.85 |
| Charging ratio of EVSE | 3.6 kWh | Efficiency η = 0.90 |
| Discharging ratio of EVSE | 3.6 kWh | Efficiency η = 0.85 |
Table 4.
EV specification [31].
Table 4.
EV specification [31].
| EV Types | Battery Capacity (kWh) | Max Range (km) |
|---|---|---|
| Hyundai BlueOn | 16.4 | 140 |
| Kia Soul EV | 27 | 150 |
| Nissan Leaf—ZE0 | 30 | 172 |
Table 5.
Driver behavior; PDF: probability density function.
| Driver Behavior | Value | |
|---|---|---|
| Average arrival time | 8:30 a.m. | PDF: µ = 34, σ = 4 |
| Average departure time | 6:30 p.m. | PDF: µ = 68, σ = 8 |
| Average daily driving range | 30 km | PDF: µ = 30, σ = 10 |
Table 6.
Electricity cost of KEPCO (Korea Electric Power Corporation) during the summer season [32].
Table 6.
Electricity cost of KEPCO (Korea Electric Power Corporation) during the summer season [32].
| Category | Time Period | Educational Tariff, Option Two |
|---|---|---|
| Off-peak | 23:00–09:00 | 49.800 KRW/kWh |
| Mid-peak | 09:00–10:00 and 12:00–13:00 and 17:00–23:00 | 94.200 KRW/kWh |
| On-peak | 10:00–12:00 and 13:00–17:00 | 160.400 KRW/kWh |
Table 7.
Comparison of simulation results.
| Peak Power Consumption | Percentage of Peak Load [%] | Charged Cost [KRW] | Discharged Cost [KRW] | Number of EVs Participation | |
|---|---|---|---|---|---|
| Scenario 1 | 208 kW | 26.92 | 202,294 | NA | 100 |
| Scenario 2 | 192 kW | 20.83 | 162,915 | NA | 100 |
| Scenario 3 | 145 kW | 04.60 | 19,090 | 22,456 | 25 |
| Scenario 4 | 133 kW | 12.50 | 49,990 | 63,829 | 63 |
| Scenario 5 | 130 kW | 14.47 | 74,319 | 109,050 | 71 |
© 2018 by the authors. Licensee MDPI, Basel, Switzerland. This article is an open access article distributed under the terms and conditions of the Creative Commons Attribution (CC BY) license (http://creativecommons.org/licenses/by/4.0/).
Share and Cite
MDPI and ACS Style
Odkhuu, N.; Lee, K.-B.; A. Ahmed, M.; Kim, Y.-C. Optimal Energy Management of V2B with RES and ESS for Peak Load Minimization. Appl. Sci. 2018, 8, 2125. https://doi.org/10.3390/app8112125
AMA Style
Odkhuu N, Lee K-B, A. Ahmed M, Kim Y-C. Optimal Energy Management of V2B with RES and ESS for Peak Load Minimization. Applied Sciences. 2018; 8(11):2125. https://doi.org/10.3390/app8112125
Chicago/Turabian StyleOdkhuu, Nandinkhuu, Ki-Beom Lee, Mohamed A. Ahmed, and Young-Chon Kim. 2018. "Optimal Energy Management of V2B with RES and ESS for Peak Load Minimization" Applied Sciences 8, no. 11: 2125. https://doi.org/10.3390/app8112125
Note that from the first issue of 2016, this journal uses article numbers instead of page numbers. See further details here.