Influence of Surface Texture Characteristics on the Noise in Grooving Concrete Pavement
by
Dingbang Wei
1,2, 
Bo Li
1,*,
Zhengwei Zhang
1,
Feng Han
1,
Xingjun Zhang
1,
Man Zhang
2,
Liangying Li
1 and
Qicai Wang
1 1
Key Laboratory of Road & Bridge and Underground Engineering of Gansu Province, Lanzhou Jiaotong University, Lanzhou 730070, China
2
State Key Laboratory of Silicate Materials for Architectures, Wuhan University of Technology, Wuhan 430070, China
*
Author to whom correspondence should be addressed.
Appl. Sci. 2018, 8(11), 2141; https://doi.org/10.3390/app8112141
Submission received: 4 September 2018
/
Revised: 26 October 2018
/
Accepted: 30 October 2018
/
Published: 2 November 2018
(This article belongs to the Special Issue Achievements and Prospects of Functional Pavement: Materials and Structures)
Abstract
:To thoroughly explore the relationship between concrete pavement texture characteristics and tire/pavement noise of grooving concrete pavement, the surface texture, i.e., roughness, macrotexture, and microtexture, was investigated in numerous highway pavements. The On-Board Sound Intensity (OBSI) method was used to test the pavement/tire noise. The statistical correlation between concrete pavement texture characteristics and tire/pavement noise was quantitatively described by two correlation analysis methods for highway concrete pavement: origin of linear regression and the Pearson two-sided test method. The results indicate that the effect of pavement roughness on tire/pavement noise is significant, while the noise level is minor for the flat pavement. The macro texture depth also has a marked impact on the tire/pavement noise. In addition, a large grooving depth of concrete pavement could cause a high tire/pavement noise level; however, there is no clear correlation between side-way force coefficient (SFC) and tire/pavement noise.
1. Introduction
With the rapid development of the economy, concrete pavement design should not only meet the basic requirements of vehicular traffic, but also improve its surface functions, such as skidding resistance, durability, and low noise. A serious concern in engineering to reduce the noise of concrete pavement, especially in heavily populated areas, highways near the city, and tunnels [1,2]. In recent years, noise barriers, green forest, and other ways were often used to reduce the tire/pavement noise level. However, the infrastructure is expensive and difficult to repair after damage [3]. Recently, some results have shown that concrete pavement surface textural features are closely correlated to the tire/pavement noise. Utilizing a “quiet” concrete pavement texture has a significant advantage in noise reduction on pavements [4,5,6].
Han et al. indicated an exposed aggregate cement concrete pavement (EACCP), a new style of cement concrete pavement with a superior performance, i.e., excellent skidding resistance and noise reduction, for a pavement texture depth of 0.7–1.8 mm and a pavement noise reduction amplitude of 3–4 dB(A) [7,8]. Liu et al. found that the porous cement concrete pavement, EACCP, and the longitudinal groove pavement have a similar noise level to that of the asphalt pavement, and each of them has a good skidding resistance performance [9]. Tian et al. tested the concrete pavement noise value of 10 different texture types using the control pass method. The results showed that porous concrete pavement with a void ratio of 17% can reduce the tire/pavement noise value by about 4~8 dB(A) compared with the groove concrete pavement [10]. Ling Tianqing et al. found that, with the aim of ensuring the mechanical properties and wear resistance of pavement, adding ceramsite to concrete can reduce traffic noise by reducing the road slab stiffness [11]. The use of new cement concrete pavement, i.e., EACCP, porous concrete pavement, or ceramic, creates superior skidding resistance and has a great effect on the noise reduction of pavement; however, due to the relatively high construction costs and the difficulty of technology promotion and application, many countries still use the groove method in the concrete pavement surface texture. Jaecke et al. found that a uniform and random transverse tin plating produces a higher effect on internal and external noise than either skewed or longitudinal tin planting. Transversal tin plating, even in some randomly spaced textures, causes discrete frequencies or whine [12]. Burge provides a contrast between the longitudinal diamond road and the transverse diamond road for the newly built Portland cement concrete pavement. The results show that the noise of the longitudinal rhombic ground shows a low range from 2 to 5 dB and mainly depends on the composition of the traffic vehicles [13]. Kohler t al. also measured and compared the pavement noise level of existing concrete pavement by the onboard sound intensity method. The surfaces encountered were classified into five texture categories: burlap drag, diamond ground, diamond grooved, longitudinally broomed, and longitudinally tined [14]. The results show that the quietest section is measured on the surface of diamond abrasive particles. However, the longitudinal viewing surface as a group is the quietest, based on the average noise level of the assessed slices for each texture type. Liu et al. revealed that the noise level of the transverse groove concrete pavement is the highest, followed by smooth concrete pavement and longitudinal groove concrete pavement, and the noise level of porous concrete pavement is the lowest [15]. Li compared the noise characteristics of newly-built Portland cement concrete pavement with longitudinal and transverse diamond grooved pavement by the tire acceleration method [16,17]. The results show that, compared with the transverse grooving road surface, the longitudinal grooving has good performance at preventing vehicle sideslip and reducing noise.
Generally, the noise is a focus of concrete pavement. However, there is limited research on the correlation between texture features and noise of concrete pavement. In this paper, concrete pavement noises are collected by an on-board sound intensity system (OBSI). Statistical analysis is used to discuss the correlation between common concrete pavement surface texture and noise value.
2. Materials and Methods
The characteristics of concrete pavement surface texture in highway tunnels were collected in Gansu province. The test site information and textural characteristics of the samples are shown in Table 1.
2.1. Measurement of Concrete Pavement Texture
In this study, test methods of concrete pavement texture are shown in Figure 1. During the testing, the pavement roughness is measured by a continuous roughness tester (LXBP-3, Changsha Instruments Company, Changsha, China). Meanwhile, the macrotexture and microtexture are tested by the sanding method and friction coefficient test equipment (JGMC-2, Beijing JinGuShenJian Measuring and Control Technology Institute, Beijing, China), respectively.
2.2. Tire/Road Noise Test
The on-board sound intensity system (Figure 2) is a useful method in tire/road noise testing for measuring the noise level of each test section. The test vehicle ran at a constant speed of 60 km/h. Dewesoft 7.0 (DEWEsoft, Trbovlje, Slovenia) and Coinv DASP ET software (v2005, China Orient institute of Noise and Vibration, Beijing, China) were used to collect and analyze the noise characterization, respectively, and the frequency of collection was 10,000 Hz.
3. Results
3.1. Pavement Roughness and Noise
Before the statistical analysis, the measurement data of pavement roughness must be revised to eliminate the obvious systematic errors such as the effect of concrete pavement joints. Then Origin Pro 8.5 was used to perform a regression analysis between the international roughness index (IRI) and the tire pavement noise level. The statistical results are shown in Figure 3.
Figure 3 shows that there is a quadratic relation between the concrete pavement roughness and the noise level, and the correlation coefficient (R2) is 0.74. It is indicated that there exists a certain correlation between the pavement roughness and tire/pavement noise of concrete pavement. To further investigate this relationship, Statistical Program for Social Sciences (SPSS) 19.0 statistical analysis softwarewas used for the correlation analysis of test samples. Table 2 presents the results of SPSS correlation analysis of descriptive statistics.
As can be seen from Table 2, the average IRI and OBSI values of the samples are 1.73 m/km and 103.1 dB(A), respectively, and the standard deviations of the two variables are relatively small. This indicates a small discrete degree among various samples, which to some extent reflects the accuracy of the test data.
Pearson correlation coefficient and p-value from the T statistics test were calculated through the SPSS correlation matrix analysis process. The results are shown in Table 3.
Table 3 shows that the Pearson correlation coefficients of two variables are 1.0 and 0.82, respectively. This indicates that there is a strong correlation between the roughness and noise of concrete pavement. Indeed, a positive correlation between the concrete pavement roughness and tire/pavement noise can be observed. In other words, using the same test section the corresponding tire/pavement noise level also increases when increasing the international roughness index (IRI). What needs to be noticed is that when the IRI increases over 2.4 m/km, the noise level does not increase any more. The reason is that the fast scroll wheels make contact with the uneven concrete pavement surface, which can generate vibrational noise during the high-speed driving. The worse the roughness of concrete pavement, the higher the corresponding vibration noise will be [18].
3.2. Macrotexture and Noise
3.2.1. Transverse Groove Concrete Pavement
The statistical results of a correlation analysis between the macrotexture and the noise of a transverse groove concrete pavement are shown in Figure 4.
Figure 4 shows that there is a quadratic relationship between the macrotexture and tire/pavement noise of transverse groove pavement, and the correlation coefficient (R2) is 0.63. This implies that there is a certain correlation between macrotexture and tire/pavement noise of transverse groove concrete pavement. Likewise, SPSS 19.0 statistical analysis software was used for testing samples of two variables’ correlation analysis. Table 4 presents the calculation results of an SPSS correlation analysis of descriptive statistics.
As can be seen from Table 4, the sample mean of macrotexture is 0.720 mm, and the OBSI is 103 dB(A). In addition, the variable dispersions are small, reflecting well the accuracy of the experimental data.
Pearson correlation coefficient and p-value from the T statistics test are shown in Table 5.
Table 5 shows the Pearson correlation coefficient of the two variables is 0.79. This indicates that there is a strong, positive correlation between the macrotexture and the tire/pavement noise. In other words, under the same test conditions, the corresponding tire/pavement noise level will also increase with the increase of macrotexture. The main reason may be the direct contact of fast scroll wheels with road trench when the vehicle is driving at high speeds. Thus, a certain degree of deformation in rubber tires occurs because of the tire contact impact force. The vibration noise will be generated during the repeated tire deformation and recovery. The higher the macrotexture, the higher the corresponding vibration noise will be [19]. Meanwhile, it is noticed that the noise level does not increase obviously when further increasing the value of macrotexture.
3.2.2. Longitudinal Groove Concrete Pavement
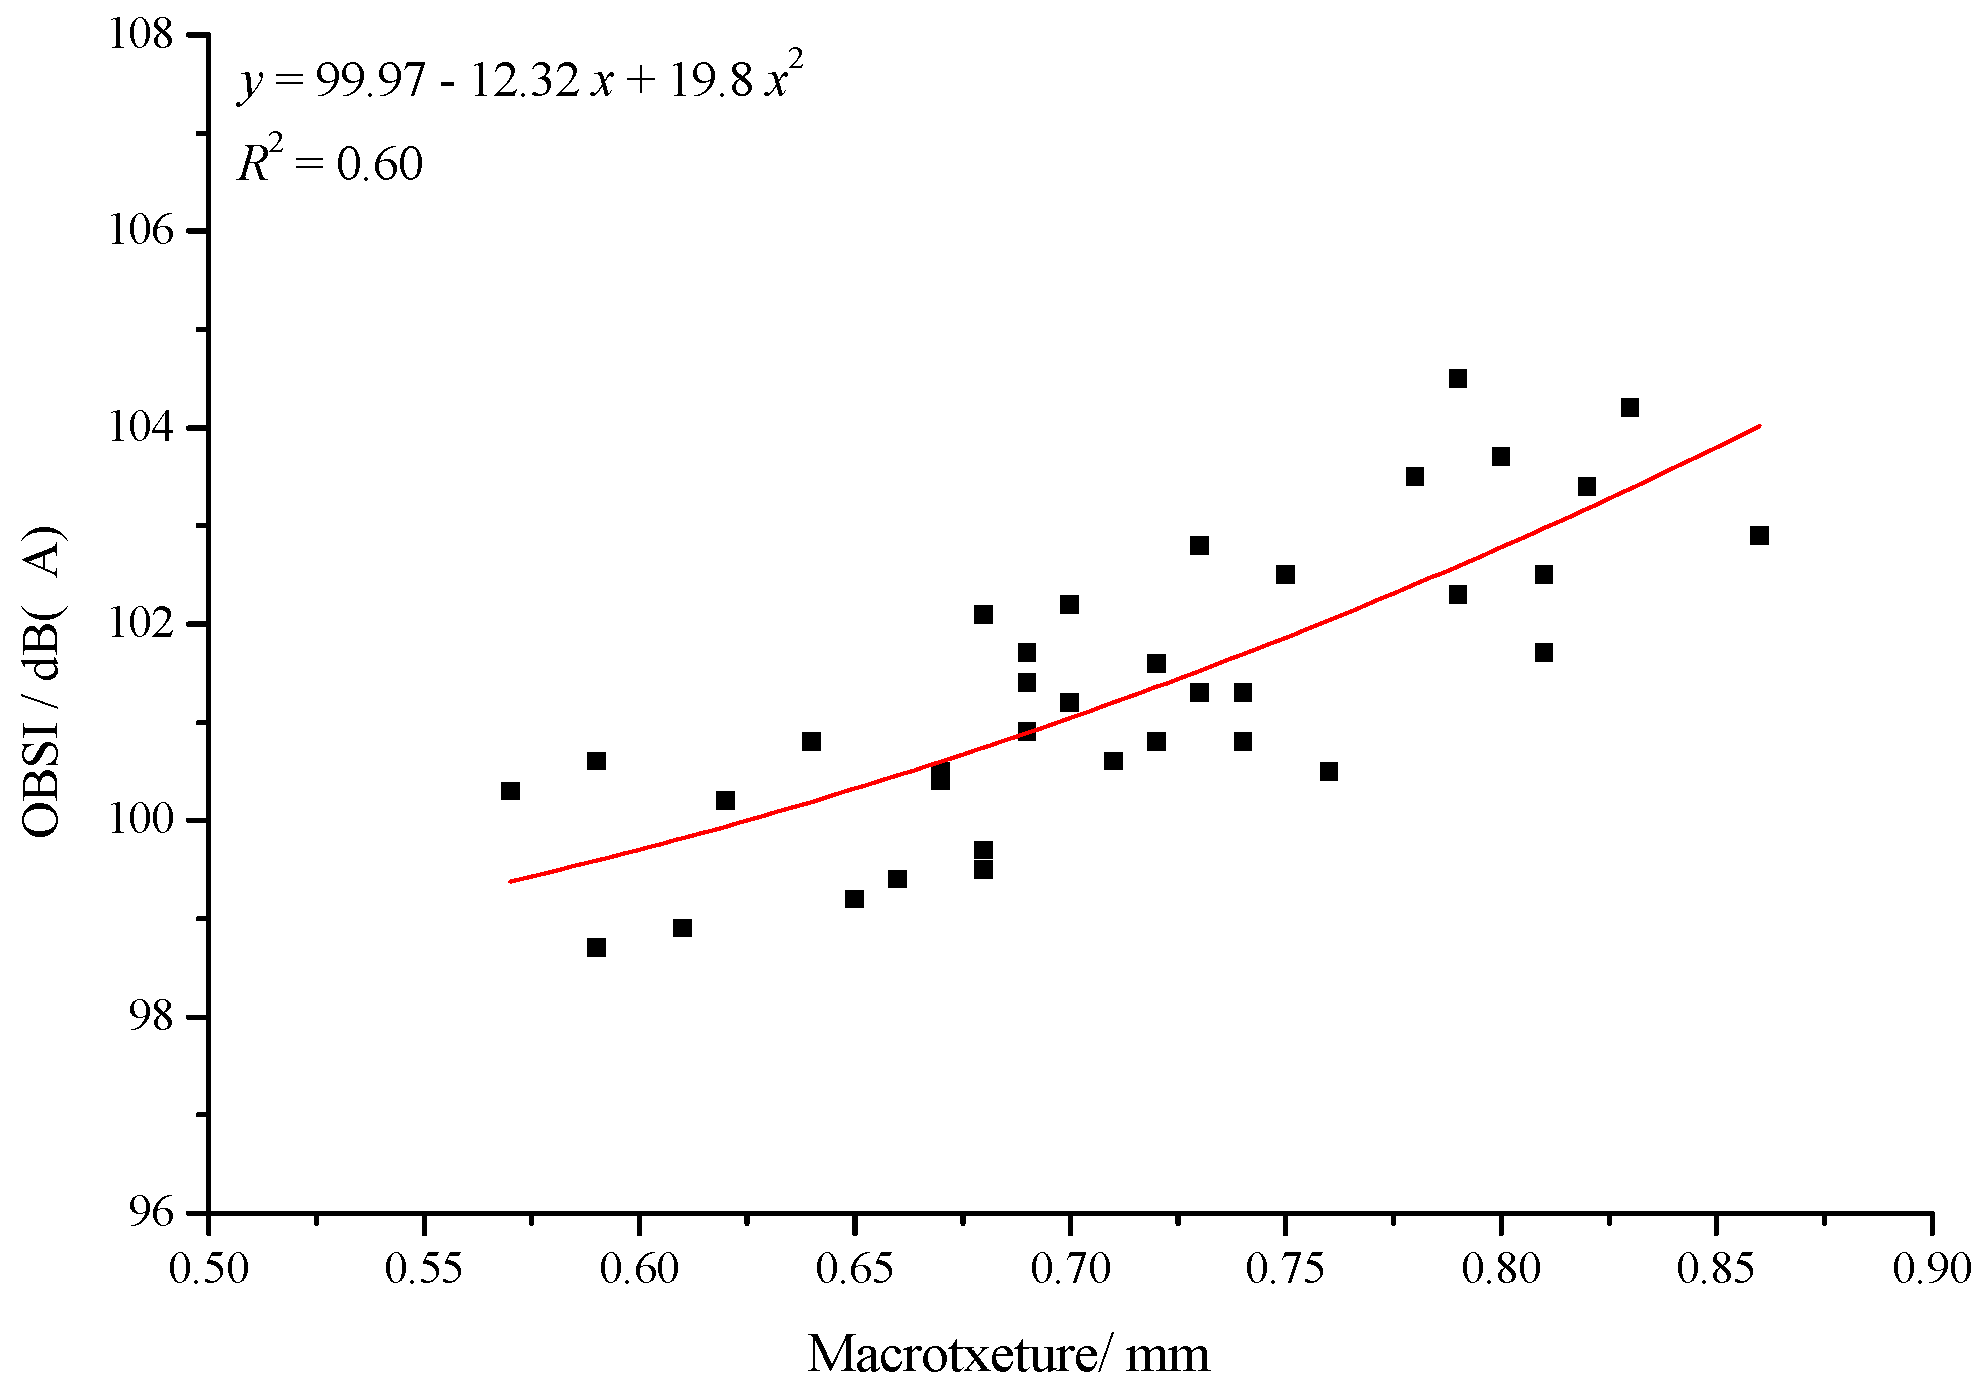
The statistical results of correlation analysis between macrotexture and noise of longitudinal groove concrete pavement are shown in Figure 5.
Figure 5 shows that there is a quadratic relationship between the macrotexture and tire/pavement noise of longitudinal groove pavement, and the correlation coefficient (R2) is ~0.60. This indicates that there is a certain correlation between macrotexture and tire/road noise of longitudinal groove concrete pavement. Likewise, SPSS 19.0 statistical analysis software was used to test samples for the two variables correlation analysis. Table 6 presents the calculation results of SPSS correlation analysis of descriptive statistics.
As can be seen from Table 6, the sample mean of macrotexture is 0.71, which meets the relevant requirement of the current industry standard. The standard deviations of the two variables are relatively small, which implies that the individual sample is closer to the sample mean with a less variation degree. Macrotexture of samples are consistent with the new concrete pavement construction, furthermore, validate the accuracy of the test data.
The Pearson correlation coefficient and p-value from the T statistics test are shown in Table 7. The Pearson correlation coefficients of the two variables are ~0.78, indicating that there is a high, positive correlation between the macrotexture and the tire/road noise of longitudinal groove concrete pavement. In addition, the corresponding pavement noise level will also increase when increasing the macrotexture under the same test conditions. Meanwhile, it is worthwhile noting that there is no saturation of noise level when varying the macrotexture.
3.3. Microtexture and Noise
Figure 6 shows the statistical results of the regression analysis between side-way force coefficient (SFC) and the corresponding tire/road noise.
As can be seen from Figure 6, there is no noticeable correlation between SFC and noise of concrete pavement. The pavement noise level of some test sections remains nearly unchanged for the same type of concrete pavement texture despite the varying of SFC. The tire/pavement noise level, however, varies greatly with SFC. Table 8 presents the results of an SPSS correlation analysis of descriptive statistics. As can be seen from Table 8, the sample mean of SFC is 57.8, which meets the requirements of the current industry standard. Nonetheless, the standard deviation of SFC is 7.299, indicating a high degree of dispersion.
The Pearson correlation coefficient and p-value from the T statistics test are shown in Table 9. Table 9 shows that the Pearson correlation coefficients of two variables is 0.136, which shows that the two variables may have a weak correlation. In another word, the SFC of concrete pavement has no obvious correlation with the noise. The main reason may be that SFC is mainly related to the material properties of pavement, water film thickness, speed, wear, and pollution of pavement surface [20].
4. Discussion
Based on current research, tire/road noise mainly comes from the air pumping effect and vibration effect, which depend on the surface texture characteristics of grooving concrete pavement [21].
From the test results, it was found that there is a significant correlation between tire/pavement noise and pavement surface texture index, such as IRI and macrotexture, besides the microtexture. The pavement noise increases with the groove depth, because of the increased volume embraced by the tire grooves in contact with the concrete pavement. With the tire rolling on the road, air pumped volume increases, leading to high noise. At the same time, as the groove depth increases, the volume of the gas pipeline cavity formed between groove and tire tread increases, which enhances the tire cavity resonance effect during the tire rolling. Additionally, when the tires leave the road, the air volume in the contact surface will increase, which causes an increased Helmholtz resonance effect and thus noise amplification. For microtexture that does not induce vibration and air pumping effect, there is no correlation with noise.
5. Conclusions
Concrete pavement noises are collected by an on-board sound intensity system (OBSI) and statistical analysis results show that there are different correlations between pavement surface texture characteristics and the noise value.
The roughness of concrete pavement has a significant influence on the noise level. The corresponding noise level increases with the increase in the international roughness index (IRI).
The macrotexture of concrete pavement is closely related to the noise level. The noise level of transverse groove concrete pavement is lower than that of longitudinal groove concrete pavement.
The microtexture of concrete pavement has no significant influence on the tire/pavement noise level. In other words, pavement noise can be reduced by choosing superior pavement texture while ensuring vehicle safety.
Author Contributions
Conceptualization, D.W. and B.L.; Methodology, Z.Z.; Validation, F.H.; Formal analysis and investigation, X.Z. and M.Z.; Resources and Data Curation, L.L.; Writing—Original Draft Preparation and Writing—Review and Editing, D.W. and B.L.; Supervision, Q.W.
Funding
The research work reported in this paper was supported by the National Natural Science Foundation of China (Grant No. 51408287), Gansu DOT Research Project (2011-08), the Program for Changjiang Scholars and Innovative Research Team in University (IRT1139), the Young Scholars Science Foundation of Lanzhou Jiaotong University (2011031), and the Science and Technology Support Foundation of Lanzhou Jiaotong University (ZC2012004).
Conflicts of Interest
The authors declare no conflict of interest. The funders had no role in the design of the study; in the collection, analyses, or interpretation of data; in the writing of the manuscript, or in the decision to publish the results.
References
- Babisch, W. Road Traffic Noise and Cardiovascular Risk. Noise Health 2008, 10, 27–33. [Google Scholar] [CrossRef] [PubMed]
- Hajek, J.J.; Blaney, C.T.; Hein, D.K. Framework for environmental assessment of tire-pavement noise. Transp. Res. Rec. J. Transp. Res. Board 2008, 2058, 140–146. [Google Scholar] [CrossRef]
- Bo, T.; Liu, Y.; Niu, N.; Li, S.; Xie, J.; Li, X. Reduction of Tire-Pavement Noise by Porous Concrete Pavement. J. Mater. Civ. Eng. 2014, 26, 233–239. [Google Scholar]
- Ongel, A.; Harvey, J. Pavement characteristics affecting the frequency content of tire/pavement noise. Noise Control Eng. J. 2010, 58, 563–571. [Google Scholar] [CrossRef]
- Biligiri, K.P.; Way, G.B. Noise-damping characteristics of different pavement surface wearing courses. Road Mater. Pavement Des. 2014, 15, 925–941. [Google Scholar] [CrossRef]
- Donavan, P.R. Noise evaluation of various pavement textures on new Portland cement concrete. Noise Control Eng. J. 2009, 57, 63–76. [Google Scholar] [CrossRef]
- Han, S.; Dong, Y.M.; Chen, H.F.; Zhang, D.S.; Lu, X.M.; Shi, Y.Q. Noise reduction performance of exposed-aggregated cement concrete pavement. J. Traffic Transp. Eng. 2005, 5, 32–34. [Google Scholar]
- Jia, J.; Han, S. Research on tunnel cement concrete pavement based on skid resistance and noise reduction. J. Highw. Transp. Res. Dev. 2008, 4, 42–45. [Google Scholar]
- Liu, Y.; Tian, B.; Niu, K. Skid-resistance and Denoising Properties of Cement Concrete Pavement with Different Surface Texture. J. Highw. Transp. Res. Dev. 2012, 29, 28–33. [Google Scholar]
- Tian, B.; Niu, K. Study on Cement Concrete Pavement Tire Noise and Noise Reduction Method. J. Highw. Transp. Res. Dev. 2008, 25, 172–176. [Google Scholar]
- Ling, T.; Wang, R.; Zhang, J.; Liu, J.; Dong, Q. Influence of Ceramsite Mortar and Ceramic Concrete on Reducing Traffic Noise in Tunnel. China J. Highw. Transp. 2011, 24, 21–24. [Google Scholar]
- Jaeckel, J.R.; Kuemmel, D.A.; Becker, Y.Z.; Satanovsky, A.; Sonntag, R.C. Noise issues of concrete-pavement texturing. Transp. Res. Rec. 2000, 1702, 69–79. [Google Scholar] [CrossRef]
- Burgé, P.L.; Travis, K.; Rado, Z. Transverse-Tined and Longitudinal Diamond-Ground Texturing for Newly Constructed Concrete Pavement: A Comparison. Transp. Res. Rec. 2002, 1792, 75–82. [Google Scholar] [CrossRef]
- Kohler, E.; Harvey, J.; Motumah, L. Assessment of tire noise on concrete Pavement in California Highways. Transp. Res. Rec. 2013, 2036, 113–121. [Google Scholar] [CrossRef]
- Liu, Y.-M.; Han, S.; Tao, Z.-J.; Guo, Z.-T. Noise evaluation of concrete pavements with different texture. Nat. Sci. Ed. 2012, 36, 16–20. [Google Scholar]
- Li, B.; Kang, H.-W.; Han, S.; Tao, Z.J. Noise Characteristics of Concrete Pavement Based on the Method of Accelerating-falling Tire. J. Wuhan Univ. Technol. 2013, 35, 59–62. [Google Scholar]
- Li, B.; Kang, H.-W.; Zhang, Z.-W. Comparison of skid resistance and noise between transverse and longitudinal grooving pavements in newly constructed concrete pavement. Adv. Mater. Res. 2012, 446–449, 2637–2640. [Google Scholar] [CrossRef]
- Sun, L.-J.; Geng, Y.-J.; Zhou, X.-Q. Experimental Research on the Relation between Motor Vehicle Noise and Pavement Roughness of Urban Road. J. Highw. Transp. Res. Dev. 2007, 24, 24–28. [Google Scholar]
- Bueno, M.; Luong, J.; Terán, F.; Viñuela, U.; Paje, S.E. Macrotexture influence on vibrational mechanisms of the tyre-road noise of an asphalt rubber pavement. Int. J. Pavement Eng. 2014, 15, 606–613. [Google Scholar] [CrossRef]
- Gothie, M. The contribution to road safety of pavement surface characteristics. Bulletin des Laboratories des Ponts et Chaussees 2000, 244, 5–12. [Google Scholar]
- Ahammed, M.A. Safe, Quiet and Durable Pavement Surfaces. Ph.D. Thesis, University of Waterloo, Waterloo, ON, Canada, 2009. [Google Scholar]
Figure 1.
Test methods of concrete pavement texture.

Figure 2.
The on-board sound intensity system (OBSI).

Figure 3.
Regression analyses between groove concrete pavement roughness and tire/road noise.

Figure 4.
Regression analysis between macrotexture of transverse groove pavement and tire/road noise.
Figure 4.
Regression analysis between macrotexture of transverse groove pavement and tire/road noise.

Figure 5.
Regression analysis between macrotexture of longitudinal groove pavement and tire/road noise.
Figure 5.
Regression analysis between macrotexture of longitudinal groove pavement and tire/road noise.

Figure 6.
Regression analysis between side-way force coefficient (SFC) and tire/road noise.


Table 1.
Test section information of concrete pavement.
| Texture Type | Test Sites | Groove Spacing/Groove Width/Groove Depth (mm) | Number of Sample Group |
|---|---|---|---|
| Transverse groove | Wang Jiaba Tunnel | 20, 5, 5 | 20 |
| 25, 5, 5 | 20 | ||
| Guo Jiashan Tunnel | 20, 5, 5 | 20 | |
| Mai Jishan Tunnel | 24–25, 5, 3–4 | / | |
| Wu Shaoling 2# Tunnel | 20, 4, 2–3 | / | |
| Wu Shaoling 4# Tunnel | 22–24, 4, 2–3 | / | |
| Longitudinal groove | Wang Jiaba Tunnel | 25, 5, 5 | 20 |
| Guo Jiashan Tunnel | 25, 5, 5 | 20 | |
| Mai Jishan Tunnel | 22–24, 5, 3–4 | 16 | |
| Transverse random spacing groove | Wang Jiaba Tunnel | 25/50, 5, 5 | 25 |
| Guo Jiashan Tunnel | 15/25, 5, 5 | 22 | |
| 20/40, 5, 5 | 22 | ||
| Longitudinal random spacing groove | Wang Jiaba Tunnel | 25, 5, 5 | 24 |
| Guo Jiashan Tunnel | 25, 5, 5 | 24 | |
| Mai Jishan Tunnel | 24–25, 5, 3–4 | 22 |
Table 2.
Statistical description of international roughness index (IRI) and On-Board Sound Intensity System (OBSI).
Table 2.
Statistical description of international roughness index (IRI) and On-Board Sound Intensity System (OBSI).
| Sample Mean | Standard Deviation | N | |
|---|---|---|---|
| IRI (m/km) | 1.73 | 0.675 | 35 |
| OBSI (dB(A)) | 103.1 | 1.366 | 35 |
Table 3.
Correlation analysis between pavement roughness and tire/pavement noise.
| Statistical Test Parameters | IRI (m/km) | OBSI (dB(A)) | |
|---|---|---|---|
| IRI (m/km) | Pearson correlation coefficient | 1.0 | 0.82 ** |
| Significant (bilateral) | 0.0 | ||
| Sum of squared | 16 | 26 | |
| Covariance | 0.46 | 0.76 | |
| N | 35 | 35 | |
| OBSI (dB(A)) | Pearson correlation coefficient | 0.82 ** | 1 |
| Significant (bilateral) | 0.00 | ||
| Sum of squared | 26 | 63 | |
| Covariance | 0.76 | 1.9 | |
| N | 35 | 35 |
** means the correlation was significant at the level of 0.01 (both sides).
Table 4.
Statistical description of macrotexture and OBSI of transverse groove concrete pavement.
| Sample Mean | Standard Deviation | N | |
|---|---|---|---|
| Macrotexture (mm) | 0.720 | 0.105 | 40 |
| OBSI (dB(A)) | 103 | 1.59 | 40 |
Table 5.
Correlation analysis between macrotexture and noise of transverse groove concrete pavement.
Table 5.
Correlation analysis between macrotexture and noise of transverse groove concrete pavement.
| Statistical Test Parameters | Macrotexture/mm | OBSI/dB(A) | |
|---|---|---|---|
| Macrotexture/mm | Pearson correlation coefficient | 1 | 0.79 ** |
| Significant (bilateral) | 0.001 | ||
| sum of squared | 0.427 | 5.19 | |
| Covariance | 0.011 | 0.133 | |
| N | 40 | 40 | |
| OBSI/dB(A) | Pearson correlation coefficient | 0.790 ** | 1 |
| Significant (bilateral) | 0.001 | ||
| sum of squared | 5.19 | 98.8 | |
| Covariance | 0.133 | 2.53 | |
| N | 40 | 40 |
** means the correlation was significant at the level of 0.01 (both sides).
Table 6.
Statistical description of macrotexture and OBSI of longitudinal groove pavement.
| Sample Mean | Standard Deviation | N | |
|---|---|---|---|
| Macrotexture (mm) | 0.71 | 0.729 | 36 |
| OBSI (dB(A)) | 101 | 1.48 | 36 |
Table 7.
Correlation analysis between macrotexture and noise of longitudinal groove pavement.
| Statistical Test Parameters | Macrotexture/mm | OBSI/dB(A) | |
|---|---|---|---|
| Macrotexture/mm | Pearson correlation coefficient | 1 | 0.78 ** |
| Significant (bilateral) | 0.001 | ||
| Sum of squared | 0.186 | 2.97 | |
| Covariance | 0.005 | 0.085 | |
| N | 36 | 36 | |
| OBSI/dB(A) | Pearson correlation coefficient | 0.78 ** | 1 |
| Significant (bilateral) | 0.001 | ||
| Sum of squared | 2.97 | 76.7 | |
| Covariance | 0.085 | 2.19 | |
| N | 36 | 36 |
** means the correlation was significant at the level of 0.01 (both sides).
Table 8.
Statistical description of side-way force coefficient (SFC) and OBSI.
| Sample Mean | Standard Deviation | N | |
|---|---|---|---|
| SFC | 57.8 | 7.30 | 92 |
| OBSI/dB(A) | 100 | 2.27 | 92 |
Table 9.
Correlation analysis between SFC and noise.
| Statistical Test Parameters | SFC | OBSI/dB(A) | |
|---|---|---|---|
| SFC | Pearson correlation coefficient | 1 | 0.136 |
| Significant (bilateral) | 0.196 | ||
| Sum of squared | 4847.652 | 204.803 | |
| Covariance | 53.271 | 2.251 | |
| N | 92 | 92 | |
| OBSI/dB(A) | Pearson correlation coefficient | 0.136 | 1 |
| Significant (bilateral) | 0.196 | ||
| Sum of squared | 204.803 | 466.972 | |
| Covariance | 2.251 | 5.132 | |
| N | 92 | 92 |
© 2018 by the authors. Licensee MDPI, Basel, Switzerland. This article is an open access article distributed under the terms and conditions of the Creative Commons Attribution (CC BY) license (http://creativecommons.org/licenses/by/4.0/).
Share and Cite
MDPI and ACS Style
Wei, D.; Li, B.; Zhang, Z.; Han, F.; Zhang, X.; Zhang, M.; Li, L.; Wang, Q. Influence of Surface Texture Characteristics on the Noise in Grooving Concrete Pavement. Appl. Sci. 2018, 8, 2141. https://doi.org/10.3390/app8112141
AMA Style
Wei D, Li B, Zhang Z, Han F, Zhang X, Zhang M, Li L, Wang Q. Influence of Surface Texture Characteristics on the Noise in Grooving Concrete Pavement. Applied Sciences. 2018; 8(11):2141. https://doi.org/10.3390/app8112141
Chicago/Turabian StyleWei, Dingbang, Bo Li, Zhengwei Zhang, Feng Han, Xingjun Zhang, Man Zhang, Liangying Li, and Qicai Wang. 2018. "Influence of Surface Texture Characteristics on the Noise in Grooving Concrete Pavement" Applied Sciences 8, no. 11: 2141. https://doi.org/10.3390/app8112141
Note that from the first issue of 2016, this journal uses article numbers instead of page numbers. See further details here.