Inorganic Pseudo Ion Exchange Membranes—Concepts and Preliminary Experiments

REDstack BV, Pieter Zeemanstraat 6, 8606 JR Sneek, The Netherlands
*
Author to whom correspondence should be addressed.
Appl. Sci. 2018, 8(11), 2142; https://doi.org/10.3390/app8112142
Submission received: 29 September 2018
/
Revised: 17 October 2018
/
Accepted: 18 October 2018
/
Published: 2 November 2018
(This article belongs to the Special Issue Electro-membrane Processes for Clean Water and Sustainable Energy)
Abstract
:Featured Application
This paper describes new inorganic (pseudo) ion exchange membranes that can be applied to closed-loop reverse electrodialysis (RED) systems. These include salinity gradient–based flow batteries for energy storage and heat-to-power generators for use of waste heat. Other possible applications include using them in RED-based devices for hydrogen production and as end membranes in RED and electrodialysis stacks. Expected advantages of these new membranes are high permselectivity (also at high temperatures), low permeability for H2O, and stability at elevated temperatures.
Abstract
Reverse electrodialysis (RED) is a method to produce electricity from the reversible mixing of two salt solutions with different concentrations. RED was first employed for energy generation using sea and river water. New fields of application are energy storage and heat-to-power conversion. In energy storage applications, a stack operates in ED mode during charge and in RED mode during discharge. In a heat-to-power system, the RED stack produces electricity and the outgoing solutions are returned to their original concentrations in a heat-driven regenerator. In both new applications, the salt solutions are circulated and there is a free choice of the combination of salt and membranes for optimal performance. However, classical polymer-based membranes have some disadvantages: they are less suited for operation at higher temperatures, have reduced permselectivity at higher concentrations, and are rather permeable to water, causing an imbalance of the feed waters. We developed a new concept of pseudo-membrane (PM): a metal sheet (sometimes covered with an insoluble salt) on which opposite electrochemical reactions occur at each side of the metal surface. Because a PM is dissolving at one side and growing at the other side during operation, the current should be inverted periodically. We tested a zinc sheet as a pseudo cation exchange membrane for Zn2+ ions and a silver chloride–covered silver plate as a pseudo anion exchange membrane for Cl− ions in three steps. First, a stack was built with Ag/AgCl membranes in combination with normal cation exchange membranes and operated with NaCl solutions. The next stack was based on Zn membranes together with normal anion exchange membranes. This stack was fed with ZnCl2 solutions. Finally, we tested a stack with zinc and Ag/AgCl pseudo-membranes with a ZnCl2 solution. The latter RED system worked; however, after standing for one night, the stack did not function and appeared to be damaged by redox reactions. This failure was the basis for general considerations about the possibilities of ED and RED hybrid stacks, consisting of a combination of classical and pseudo ion exchange membranes. Finally, we consider the possibility of using intercalation electrodes as a pseudo-membrane.
1. Introduction
Reverse electrodialysis (RED) is one of the methods to convert the potential energy from salinity gradients into electrical energy. The main applications include: (i) primary energy generation from natural sources [1,2]; (ii) production of H2 [3,4]; (iii) energy storage: the stack is used in the electrodialysis (ED) mode to store energy as a salinity gradient, and this energy can be recovered by operating the stack in the RED mode [5,6]; and (iv) the generating part of a heat-to-power system in combination with a thermally driven regeneration unit [7,8].
The requirements of the RED stack, the applied membranes, and the used salt are very different for each application. For primary energy generation, there is no free choice of the salts and the RED stack and membranes are designed for optimal power density and/or efficiency using feed water with natural ion composition. In energy storage systems, there is, in principle, a free choice of the electrolyte; important parameters are the total cycle efficiency, charge and discharge power density, energy density of the electrolyte, price of the electrolyte, and aspects concerning health, safety, and the environment. A special point in such systems is the water transport through the membranes as a source of imbalance during long-time operation. In heat-to-power systems, there are two methods of regeneration: distillation of the fluid phase (usually water) or of the salt (ammonium bicarbonate or ammonium carbonate). In the case of water distillation, there is much freedom in choosing an electrolyte and membranes; in contrast to energy storage systems, the amount of electrolyte is restricted and price is therefore less important than in storage systems.
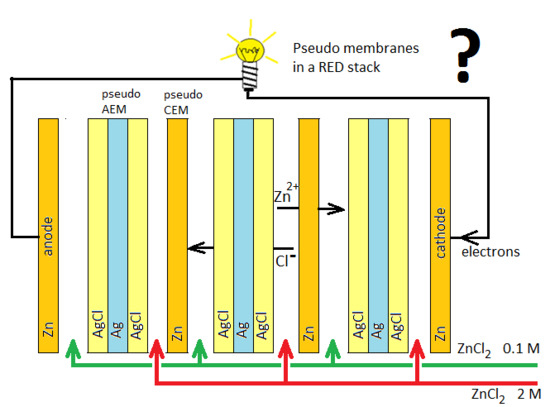
Usually in ED and RED, organic membranes are applied polymer–based structures with exchanging fixed charges. The fixed charges are mostly sulfonate groups (~SO3−) in the cation exchange membranes (CEMs) and quaternary ammonium groups (~N(CH3)3+) in the anion exchange membranes (AEMs). These polymeric membranes have some drawbacks: the permselectivity decreases at higher salt concentrations, and they facilitate water transport and deteriorate at high temperatures. In this paper, we launch a new membrane type based on reversible electrochemical reactions on both sides of the so-called pseudo-membrane. The adjective “pseudo” indicates that in most cases there is no real permeation of an ion through the membrane: they change ions at one side for ions at the other side. In fact, these pseudo-membranes are literally real exchange membranes, in contrast with normal “ion exchange membranes” that are based on ion transport. Figure 1 shows the principle: a RED stack is equipped with Zn pseudo-membranes, acting as cation-exchange membranes for Zn2+ ions, and Ag/AgCl pseudo-membranes, acting as AEMs for Cl−; the stack is fed with high- and low-concentration ZnCl2 solutions.
The Zn pseudo-membrane functions as a CEM:
- at the high concentration side: Zn2+ + 2e → Zn;
- at the low concentration side: Zn → Zn2+ + 2e.
The AgCl/Ag/AgCl pseudo-membrane functions as an AEM:
- at the high concentration side: Ag + Cl− → AgCl + e;
- at the low concentration side: AgCl + e → Ag + Cl−.
The reactions on the end electrodes are:
- cathode: Zn2+ + 2e → Zn;
- anode: Zn → Zn2+ + 2e.
Obviously, a periodical flow switch should be applied; the switch period is especially dependent on the thickness of the AgCl layer. During the switch, the stack is not generating energy and this dead time is relative shorter with a longer switch period. Otherwise, a longer switch period requires a thicker AgCl layer, which introduces more electrical resistance. The thickness of the zinc electrodes is no particular problem: they can be overdimensioned without any serious consequence to ionic or electrical resistance.
The generated voltage over each pseudo-membrane is, in principle, the same as over a conventional ion exchange membrane. This can be seen as follows: a zinc rod in a solution of H mol/L ZnCl2 gets a potential EH with respect to the solution:
where R is the gas constant (8.3143 J/mol/K), T is the temperature, n is the number of involved charges, and F is the Faraday constant (96,485 C/mol). Here, we have assumed an activity coefficient equal to 1. Thus the potential of the solution with respect to the zinc rod is −EH.
Now we take a vessel divided by a zinc plate into two parts, both containing ZnCl2, one with concentration H (high) and the other with L (low). Then the voltage difference between the two solutions is:
This result is the same equation as for the Donnan potential over a normal CEM. The same holds for the Ag/AgCl pseudo-membrane. Therefore, we can conclude that these new pseudo-membranes act as classical ion exchange membranes. They are very ion-specific, and co-ion transport is impossible, resulting in a permselectivity of 100%. Water transport through the Zn and Ag/AgCl pseudo-membranes is also unthinkable. Moreover, these inorganic structures are very resistant to high temperatures. We will introduce the terms pseudo CEM (pCEM) and pseudo AEM (pAEM), or, generally, pseudo ion exchange membrane (pIEM).
The combination of a pCEM with a normal AEM or a pAEM with a normal CEM seems not to be problematic. However, with two pseudo-membranes, there is the threat of redox reactions between them. In the system described above, these reactions are:
resulting in:
2 AgCl → 2 Ag+ + 2 Cl−
Zn + 2 Ag+ → Zn2+ + 2 Ag
2 AgCl + Zn → 2 Ag + Zn2+ + 2 Cl−
The reaction rate is dependent on the concentration of the dissolved Ag(I). In the first instance, we considered only the free Ag+ ion with a very low concentration due to the small solubility product of AgCl (LAgCl = 1.8 × 10⁻¹⁰) and expected a rather low disintegration of the system. However, it turned out that much silver(I) is dissolved as chloro-complexes, limiting the lifespan of the system to a few hours. This complication is discussed in Section 2.3.1.
In this paper, we present experiments with the Ag/AgCl and Zn pseudo-membranes and outline a new path for the application of pseudo-membranes.
2. Pseudo-Membranes, Systems, and Applications
In this chapter, we propose different modifications of pseudo-membranes and discuss possible combinations of pCEMs and pAEMs. Is should be emphasized that only Zn and Ag/AgCl pseudo-membranes were tested, individually with a classical ion exchange membrane and in combination, as depicted in Figure 1. Important parameters for application of pseudo membranes are price (Table 1), solubility (Table 2) and standard reduction potentials (Table 3).
2.1. Pseudo Cation Ion Exchange Membranes (pCEMs)
We will distinguish two classes of pCEMs: pure metals and intercalation compounds.
2.1.1. Pure Metal: Zn for Zn2+, Ni for Ni2+, Cu for Cu2+
The metal should be stable in water and not too expensive or harmful. Pseudo-membranes dissolve at one side and grow at the other side. This process is inverted frequently by current reversal; essential for a good operation is a smooth and homogeneous building of the metal layer.
Zn: The advantages are that zinc (and zinc salt) is rather cheap and has medium toxicity. These are important issues in energy storage systems, where huge quantities of electrolytes are stored. A disadvantage is that zinc has a rather low reduction potential, promoting the reduction of free Ag+ if in combination with a pAEM (as discussed in Section 2.3).
Ni: The reduction potential of Ni is much higher than of Zn [12], which may be advantageous with respect to stability. Drawbacks are the high price [9] and the toxicity [10] of nickel salts, which make the application to energy storage systems impossible (Table 1). However, in heat-to-power systems, nickel pCEMs may be considered.
Cu: Copper can exist in two oxidation states, which causes some complications. Therefore, copper cannot be used in systems containing CuCl2. The reason is that the poorly soluble copper(I) chloride can be formed via an auto-redox reaction:
resulting in:
Cu2+ + 2 e → Cu 0.34 V
CuCl + e ← Cu + Cl− 0.14 V
Cu2+ + Cu + 2 Cl− → 2 CuCl
2.1.2. Intercalation Compounds: MnO2 for Na+; FePO4 for Li+; and Prussian Blue Analogues for Li+, Na+, and K+
These materials come from the battery world and contain transition metals with different oxidation states. Foreign ion can settle within the crystal structure, a process called intercalation. In a battery, there is a metallic- or carbon-based current collector where electrons are transferred from or to the redox material. In a pCEM, this metal or carbon/graphite is the substrate for the active redox layers on both sides. An (expensive) option is a platinized metal substrate. Intercalation pCEMs should be loaded on both sides and should be saturated with ions for 50% of the capacity in the start phase.
MnO2/Na2Mn5O10: The use of this manganese salt and oxide for a working sodium electrode is described by La Mantia et al. [13] and Ye et al. [14]:
2 Na+ + 5 MnO2 + 2 e → Na2Mn5O10
Pan Xiong et al. [15] studied the intercalation of the ions Li+, Na+, K+, and Mg2+ with MnO2 and observed only minor structural changes in the two-dimensional layered structures.
LiFePO4/FePO4: This material is used in Li-ion batteries and many properties are known [16,17]. This mixture can absorb and release Li+ ions due to the multivalent property of iron:
Li+ + e + FePO4 ↔ LiFePO4
FeIII[FeIIIFeII(CN)6]3: This insoluble salt, called Prussian Blue, contains iron(III) and iron(II) ions; the blue color is ascribed to charge transfer between the ions with different oxidation states. The iron can be substituted by other transition metals. These Prussian Blue analogues (PBAs) have, in principle, the same structure but with vacancies of different dimensions, suitable for absorbing different alkali ions: Li+, Na+, and K+.
2.2. Pseudo Anion Ion Exchange Membranes (pAEMs)
In contrast to pCEMs, a pure elemental pAEM is generally impossible. A theoretical exception seems to be a sheet of solid iodine that might be pseudo-permeable for iodide ions via redox reactions on both sides; on the other hand, the I2 dissolves in an iodide-containing electrolyte, which in turn makes it difficult to apply. For more practical application, we encountered two classes: silver and copper halides and PbSO4.
2.2.1. Halide pAEMs: Ag/AgX and Cu/CuX for Cl−, Br−, and I−
Ag/AgX (X = Cl, Br, or I): A drawback is the resistance of the AgX layer: the electrochemical reactions take place at the Ag–AgX interface and the X− ion should diffuse through the AgX layer until the silver surface is reached.
Cu/CuX (X = Cl, Br, or I): In principle, a system with Zn pCEMs together with Cu/CuX and a ZnCl2 electrolyte can be used for a short time. The solubility of the Cu(I)-halides is much larger than that of the silver analogues. This may shorten the lifespan of the membranes due to reactions such as:
2 Cu+ + Zn → 2 Cu + Zn2+
Thus, the combination of a metallic pCEM with a copper(I)-halide is also unstable.
2.2.2. Lead(II) Sulfate for SO42−
Pb/PbSO4: The process of binding and releasing the sulfate ion is quite common in a lead-acid battery, and the combination of a Pb/PbSO4 pAEM with a normal CEM and an Na2SO4 electrolyte can be considered. Again, a combination of two pseudo-membranes, as in Zn–Pb/PbSO4–ZnSO4, is inherent unstable.
2.2.3. Intercalation Compounds: LDHs for Different Anions
2.3. Systems Based on Pseudo-Membranes
2.3.1. Combinations of pAEM with pCEM
Systems with pIEMs can, in principle, be equipped with classical electrode systems or with capacitive electrodes. However, a more simple solution is to construct the end electrodes of the same material as the pCEM, or eventually as the pAEM. We will denote the (unstable) system described in the introduction as Zn-Ag/AgCl–ZnCl2, indicating that Zn is the end electrode material and also the pCEM, Ag/AgCl is the pAEM, and ZnCl2 is the electrolyte; the same system with Ag/AgCl end electrodes will be denoted as Ag/AgCl–Zn-ZnCl2.
A special problem is the combination of an Ag/AgCl pAEM with a metal pCEM, e.g., Zn. The desired electrolyte in this case is a ZnCl2 solution. Although the solubility product is rather low (LAgCl = 1.8 × 10⁻¹⁰) and the concentration of free silver ions is therefore also very low, it is known that a remarkable amount of AgCl is dissolved by complexation with chloride ions. From the work of Fritz [21] we know that silver is present as Ag+, AgCl, AgCl2−, AgCl32−, and AgCl43− if silver chloride is in contact with a solution of HCl, NaCl, KCl, or NH4Cl. Table 4 shows the solubility of AgCl in different concentrations of NaCl and the distributions over the various compounds. It is remarkable that AgCl has much more solubility in KCl solutions. Moreover, the solubility is strongly temperature dependent.
If Ag/AgCl pAEMs are combined with classical CEMs, the rather high concentration of silver complexes seems not to introduce technical problems: the most abundant complex ion is double-negative charged and rejected by the CEM. However, a drawback for storage applications is the high price of the applied silver.
The combination of a Zn pCEM with an Ag/AgCl pAEM requires a ZnCl2 electrolyte. The dissolved silver ions introduce an inherent unstable system due to
2 Ag+ + Zn → 2 Ag + Zn2+
We found that this process occurred during one night, resulting in a black coating on the zinc plates and a damaged Ag/AgCl structure, making it impossible to repeat any RED or ED experiment the next day.
The system Zn–Ag/AgCl–ZnCl2 is exceptionally unstable by two effects: the high solubility of silver in the chloride solution and the large difference in reduction potential of silver and zinc. The silver concentration can be decreased by changing Cl for Br or I, because the solubility products of AgBr and Agl are much smaller than those of AgCl [11], (Table 2). However, the conclusion is that all combinations of a metallic pCEM with a silver halide pAEM are always unstable.
Within the system Cu-Pb/PbSO4–CuSO4, the Pb electrode is in direct contact with the Cu2+ ions, which may result in a fast redox reaction, Pb + Cu2+ + SO42− → PbSO4 + Cu, because copper is more noble than lead. Thus we wonder if changing Cu for Zn gives a more stable system.
In the system Zn-Pb/PbSO4–ZnSO4, the Pb2+ concentration is dictated by the solubility product of PbSO4 (LPbSO4 = 1.6 × 10⁻⁸). With a ZnSO4 concentration of about 1 M, the resulting Pb2+ concentration is about 10−8 M. Nevertheless, such a system is unstable due to the reaction Pb2+ + Zn → Pb + Zn2+.
The system Ni-Pb/PbSO4–NiSO4 is also unstable for the same reason as the zinc analogue. However, the difference between the reduction potentials of Zn2+ and Pb2+ is rather small, therefore we expect that the nickel system has a longer lifespan.
Not all combinations are possible, due to electrochemical considerations. We conclude that we are restricted to intercalation-based pCEMs together with Ag/AgX, Cu/CuX, or Pb/PbSO4, provided that the substrate is resistant enough against oxidation. Table 5 shows possible combinations of pCEMs with pAEMs with solubility achieved from [22].
2.3.2. Hybrid Systems
Hybrid systems are constructed by combining a pseudo-membrane with a normal ion exchange membrane. Moreover, instead of using participating electrodes, noble metal electrodes (with a redox reaction in the electrolyte) or capacitive electrodes can be applied. Such hybrid stacks may be useful for the development of a whole pseudo system, because the pseudo-membranes can be tested separately. We used this method in an attempt to develop the Zn–Ag/AgCl–ZnCl2 system; first we tested a classical stack with Ag/AgCl pAEMs together with normal CEMs, then we built a stack with zinc pCEMs and normal AEMs, and finally we constructed the whole pIEM system.
2.4. Applications
(a) Heat-to-Power Systems
RED stacks with inorganic membranes can be applied in a heat-to-power generator, a closed-loop system where a regenerator is used to bring the concentrations of the outlet streams to their original values. This regenerator can be based on water distillation or evaporation of a volatile salt and is powered by waste heat. Osmosis through a classical membrane requires additional evaporation, and the low water transport through the inorganic membranes in such a heat-to-power system is therefore advantageous. Moreover, the thermal stability with respect to permselectivity and the small deterioration at elevated temperature make the application of inorganic membranes an interesting option. Because the volume of the closed-loop system is relative small, the price of salts is less important.
(b) Energy-Storage Systems
A RED/ED salinity gradient storage system consists, in the simplest form, of a RED/ED stack and two vessels with salt solutions. The solutions circulate through the stack in a closed system. During charge, a surplus of electrical energy is used to drive the stack in the electrodialysis (ED) mode, resulting in an increased salinity gradient between the two solutions. During discharge, this stack operates in the RED mode and the stored salinity gradient is converted to electrical energy. A drawback is that there is continuous water transport from the low- to high-concentration solution due to osmosis. Here, the low water permeability and high permselectivity of inorganic membranes are very advantageous. In contrast to the heat-to-power application, large amounts of electrolyte are needed and the price of the salt is important.
(c) End Membranes in ED or RED Stacks
End membranes are the outer membranes of a RED or ED stack and separate the electrode compartments from the feed compartments. In many applications, it is important that these membranes are a good barrier for unwanted transport from the electrode rinse solution to the feed water and vice versa. An example is the need to maintain low pH in the electrode rinse solution if the Fe2+/Fe3+ redox couple is used [23,24,25,26,27]. In other applications, there is the danger of aggressive compounds in the electrode compartment that can damage the end membranes; chlorine is generated in an NaCl electrode rinse [27]. In stacks for H2 production, there may be a need for solid pressure-resistant walls around the electrodes [3,4]. The high specific permeability and mechanical robustness of pseudo-membranes can deal with these threats.
2.5. Preparing Ag/AgCl Pseudo-Membranes
2.5.1. Electrical Resistance of the AgCl Layer
The Ag/AgCl pseudo-membranes are made by anodizing silver plates between two inert cathodes with constant current in an HCl/NaCl solution. The involved reactions are:
anode: Ag + Cl− → AgCl + e
Cathode: e + H+ → ½H2
The applied voltage U(t) is estimated by a constant value (b) and a time-dependent part (a·t):
The constant b is the starting potential caused by (i) Nernst potentials; (ii) overvoltages of the chemical redox reactions at the electrodes; and (iii) the ohmic drop in the electrolyte. The Nernst part has little meaning when silver plate is used as a pseudo-membrane during the RED or ED process, because during these processes, oxidation and reduction of silver cancel each other out on both sides of the silver plate. More interesting is the voltage increase a due to the buildup of AgCl layer and the corresponding increase of resistance dRL/dt:
Thus the layer resistance RL and the area resistance RLa of the AgCl layer at time t are:
If the Ag/AgCl plate is used in the RED/ED stack, RL and RLa are more or less constant because the AgCl sacrifice at one side is compensated by a growth at the other side, therefore the total thickness of the AgCl layers is constant.
The transported electrical charge per m2 (Qa(t)) is:
To compare different experiments, we introduce the Faradic area resistance RFa, the area resistance of an AgCl layer as produced by a charge of 1 Faraday per m2:
where F stands for the Faraday constant (1 F = 96,485 C/mol).
2.5.2. Thickness of the AgCl Layer
The thickness of the AgCl layer during the anodizing process is estimated from the applied charge per m2. After transport of 1 Faraday of electricity, 1 mol of AgCl is deposited on one side of the silver plate and 1 mol of Ag is converted to AgCl. From the densities (AgCl: 5.56; Ag: 10.50 g/cm3) and molar masses (AgCl: 143.32; Ag: 107.87 g/mol), it follows that this results in a decrease of 10.3 µm for Ag and an increase of 25.8 µm for AgCl. Therefore it is assumed that the AgCl layer is composed of pure crystalline AgCl without inclusion or pores.
In our experiments, the maximum anodizing time was 30 min with a current density of 60 A/m2, resulting in a transport of 1.12 Faraday, equivalent to a shrinkage of the silver plate of 11.5 µm on each side. Thus the 200 µm of material present is more than sufficient.
3. Experiment
3.1. Membranes and Pseudo-Membranes
The applied commercial membranes were Neosepta CMX and AMX (Tokuyama, Japan). Zinc pseudo-membranes and end electrodes were cut from 0.8 mm commercial galvanized iron plate for experiments 4.2 and 4.3 (Auke Rauwerda, Leeuwarden, The Netherlands) and from 0.8 mm zinc plate for experiment 4.4 (Rheinzink, Datteln, Germany). Ag/AgCl pseudo-membranes were made from 0.2 mm 99.9% pure silver plate (Drijfhout, Amsterdam, The Netherlands). Stacks were equipped with 500 µm woven spacers (Sefar, Lochem, The Netherlands). The dimensions were 14.5 × 14.5 cm2; the active membrane area in the stack was 10 × 10 cm2. After polishing, they were anodized between titanium mesh cathodes, coated with Ru–Ir mixed-metal oxide (MMO, MAGNETO Special Anodes B.V., Schiedam, The Netherlands). The current was applied with a Velleman LABPS3005D power supply (Conrad, Oldenzaal, The Netherlands); the distance between the silver plate and the Ti-electrodes was about 1 cm. During anodization, the applied voltage was measured. RED and ED experiments were performed with an Iviumstat potentiostat (Ivium Technologies bv, Eindhoven, The Netherlands).
3.2. Stacks
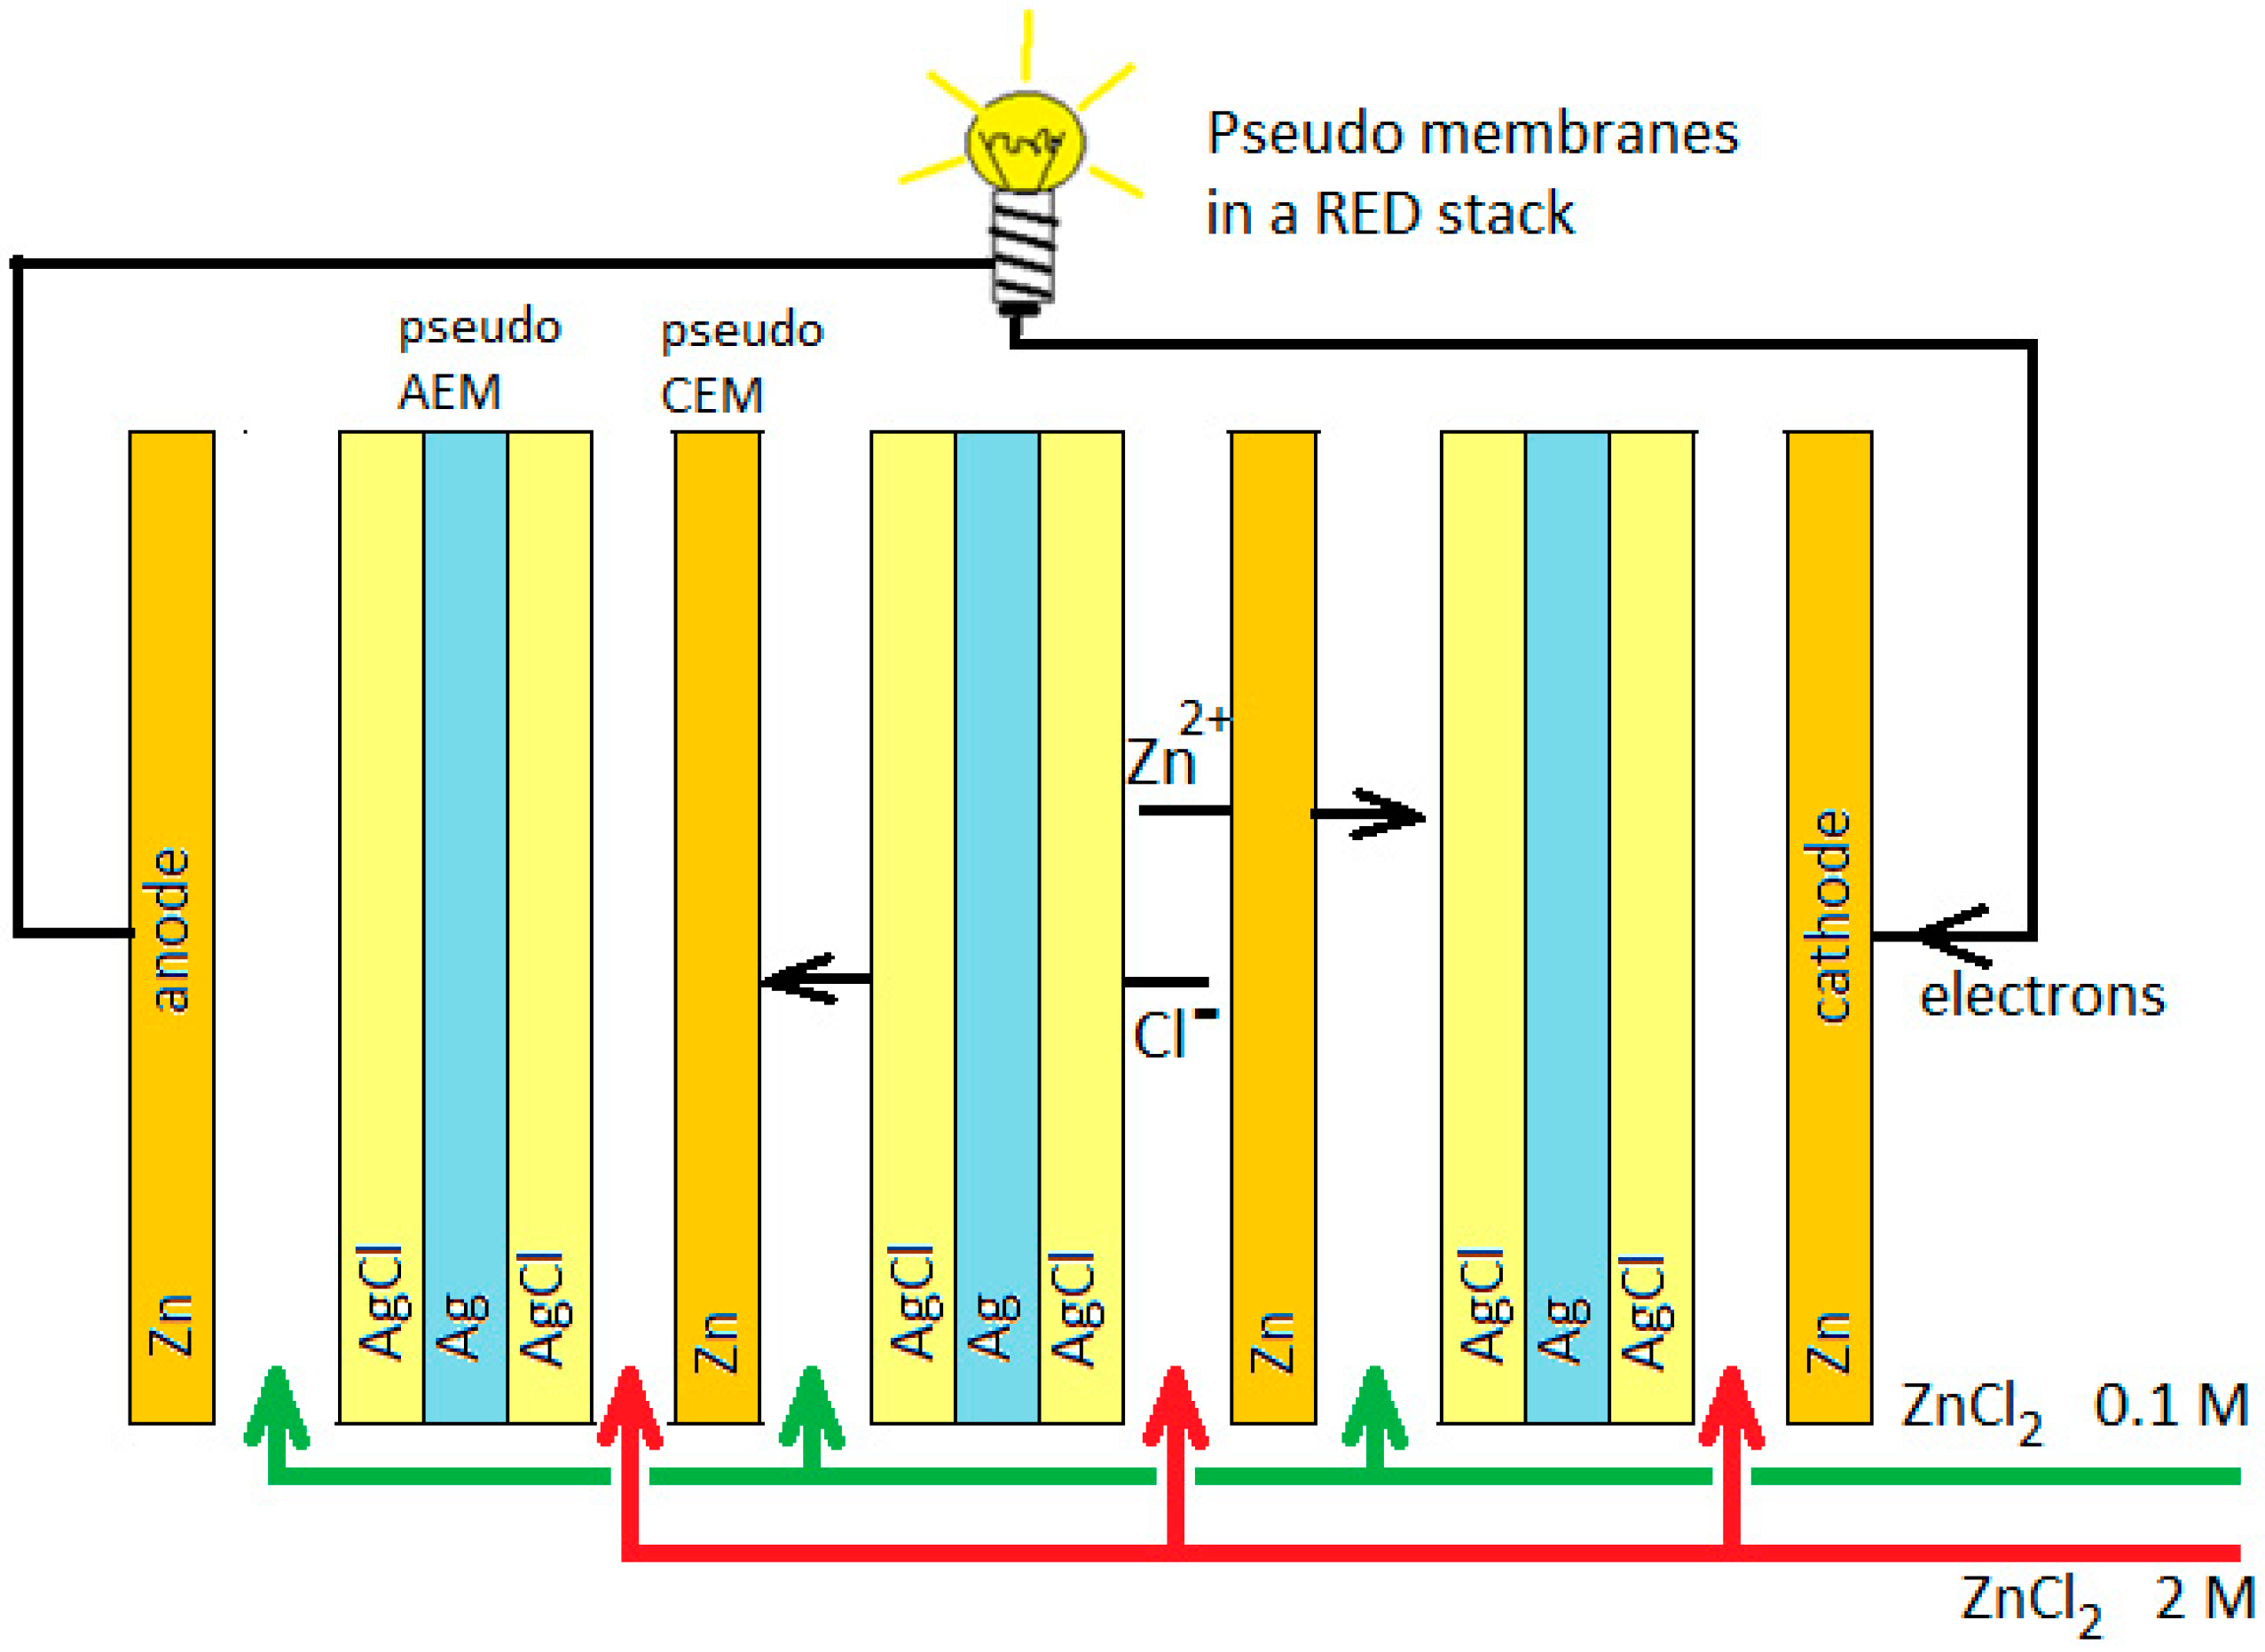
Four RED stacks (A, B, C, and D) were built, each with different (pseudo) ion exchange membranes, as shown in Figure 2. All stacks were mounted in a cross-flow stack housing, resulting in an active cross-section of 10 × 10 cm2 (REDstack bv, Sneek, The Netherlands).
Stack A was equipped with 4 cell pairs and an additional terminating membrane; each cell pair consisted of a Neosepta CMX membrane, an Ag/AgCl pAEM, and 2 spacers. End membranes were Neosepta CMX at both sides. The cell was equipped with Pt-coated titanium mesh electrodes with dimensions 10 × 10 cm2 (MAGNETO Special Anodes B.V., Schiedam, The Netherlands). The electrode rinse solution (flow rate 150 mL/min) contained the redox couple 0.2 M K3Fe(CN)6 with 0.2 M K4Fe(CN)6 in a 0.25 M NaCl bulk. First an RED test was performed and then an ED test.
Stack B was composed of 3 galvanized pCEMs with 4 normal AMX membranes. This stack contained galvanized end electrodes, the same as those used for the pseudo-membranes. No special electrode rinse was used.
Stack C, equipped solely with pseudo-membranes, was identical to stack B, except that it was provided with Ag/AgCl pAEMs instead of the classical AEMs.
Stack D was, in principle, the same as stack C. However, pure zinc was used for the pCEMs and electrodes and Ag/AgCl electrodes with a thinner AgCl layer were used.
Stacks B and C were equipped with galvanized iron with a zinc layer of about 20 µm. Each run lasted for 300 s with a maximum current of 20 mA. For oxidation at the anode and the anodic side of the pseudo-membranes, a zinc layer of 0.03 µm was dissolved, far below the available zinc amount.
3.3. Feed Water
Saltwater and freshwater streams (H = high concentration, L = low concentration) composed of dissolved NaCl (99.5% purity; ESCO, Harlingen, The Netherlands) or ZnCl2 (at least 98% purity, Boom, Meppel, The Netherlands) were fed into the RED stacks.
3.4. Electrochemical Measurements
Electrochemical measurements were performed with a potentiostat (Ivium Technologies, The Netherlands). Conductivity was measured with a Cond3310 conductivity meter equipped with a Tetracon 325 measuring cell (WTW, Weilheim, Germany). Power densities were calculated as power per area of total (pseudo) membrane. All stacks contained 4 cell pairs with a cross-section of 10 × 10 cm2, resulting in a total membrane area of 0.08 m2.
3.5. Stack Operation
During each lab test, a restricted number of RED runs was performed. After each run, the feed water was switched together with a polarity reversal. Then, after a rest time, the next run started, and so on.
4. Results and Discussion
4.1. Test of the Ag/AgCl Pseudo-Membrane
4.1.1. Preparation of the Ag/AgCl Electrodes
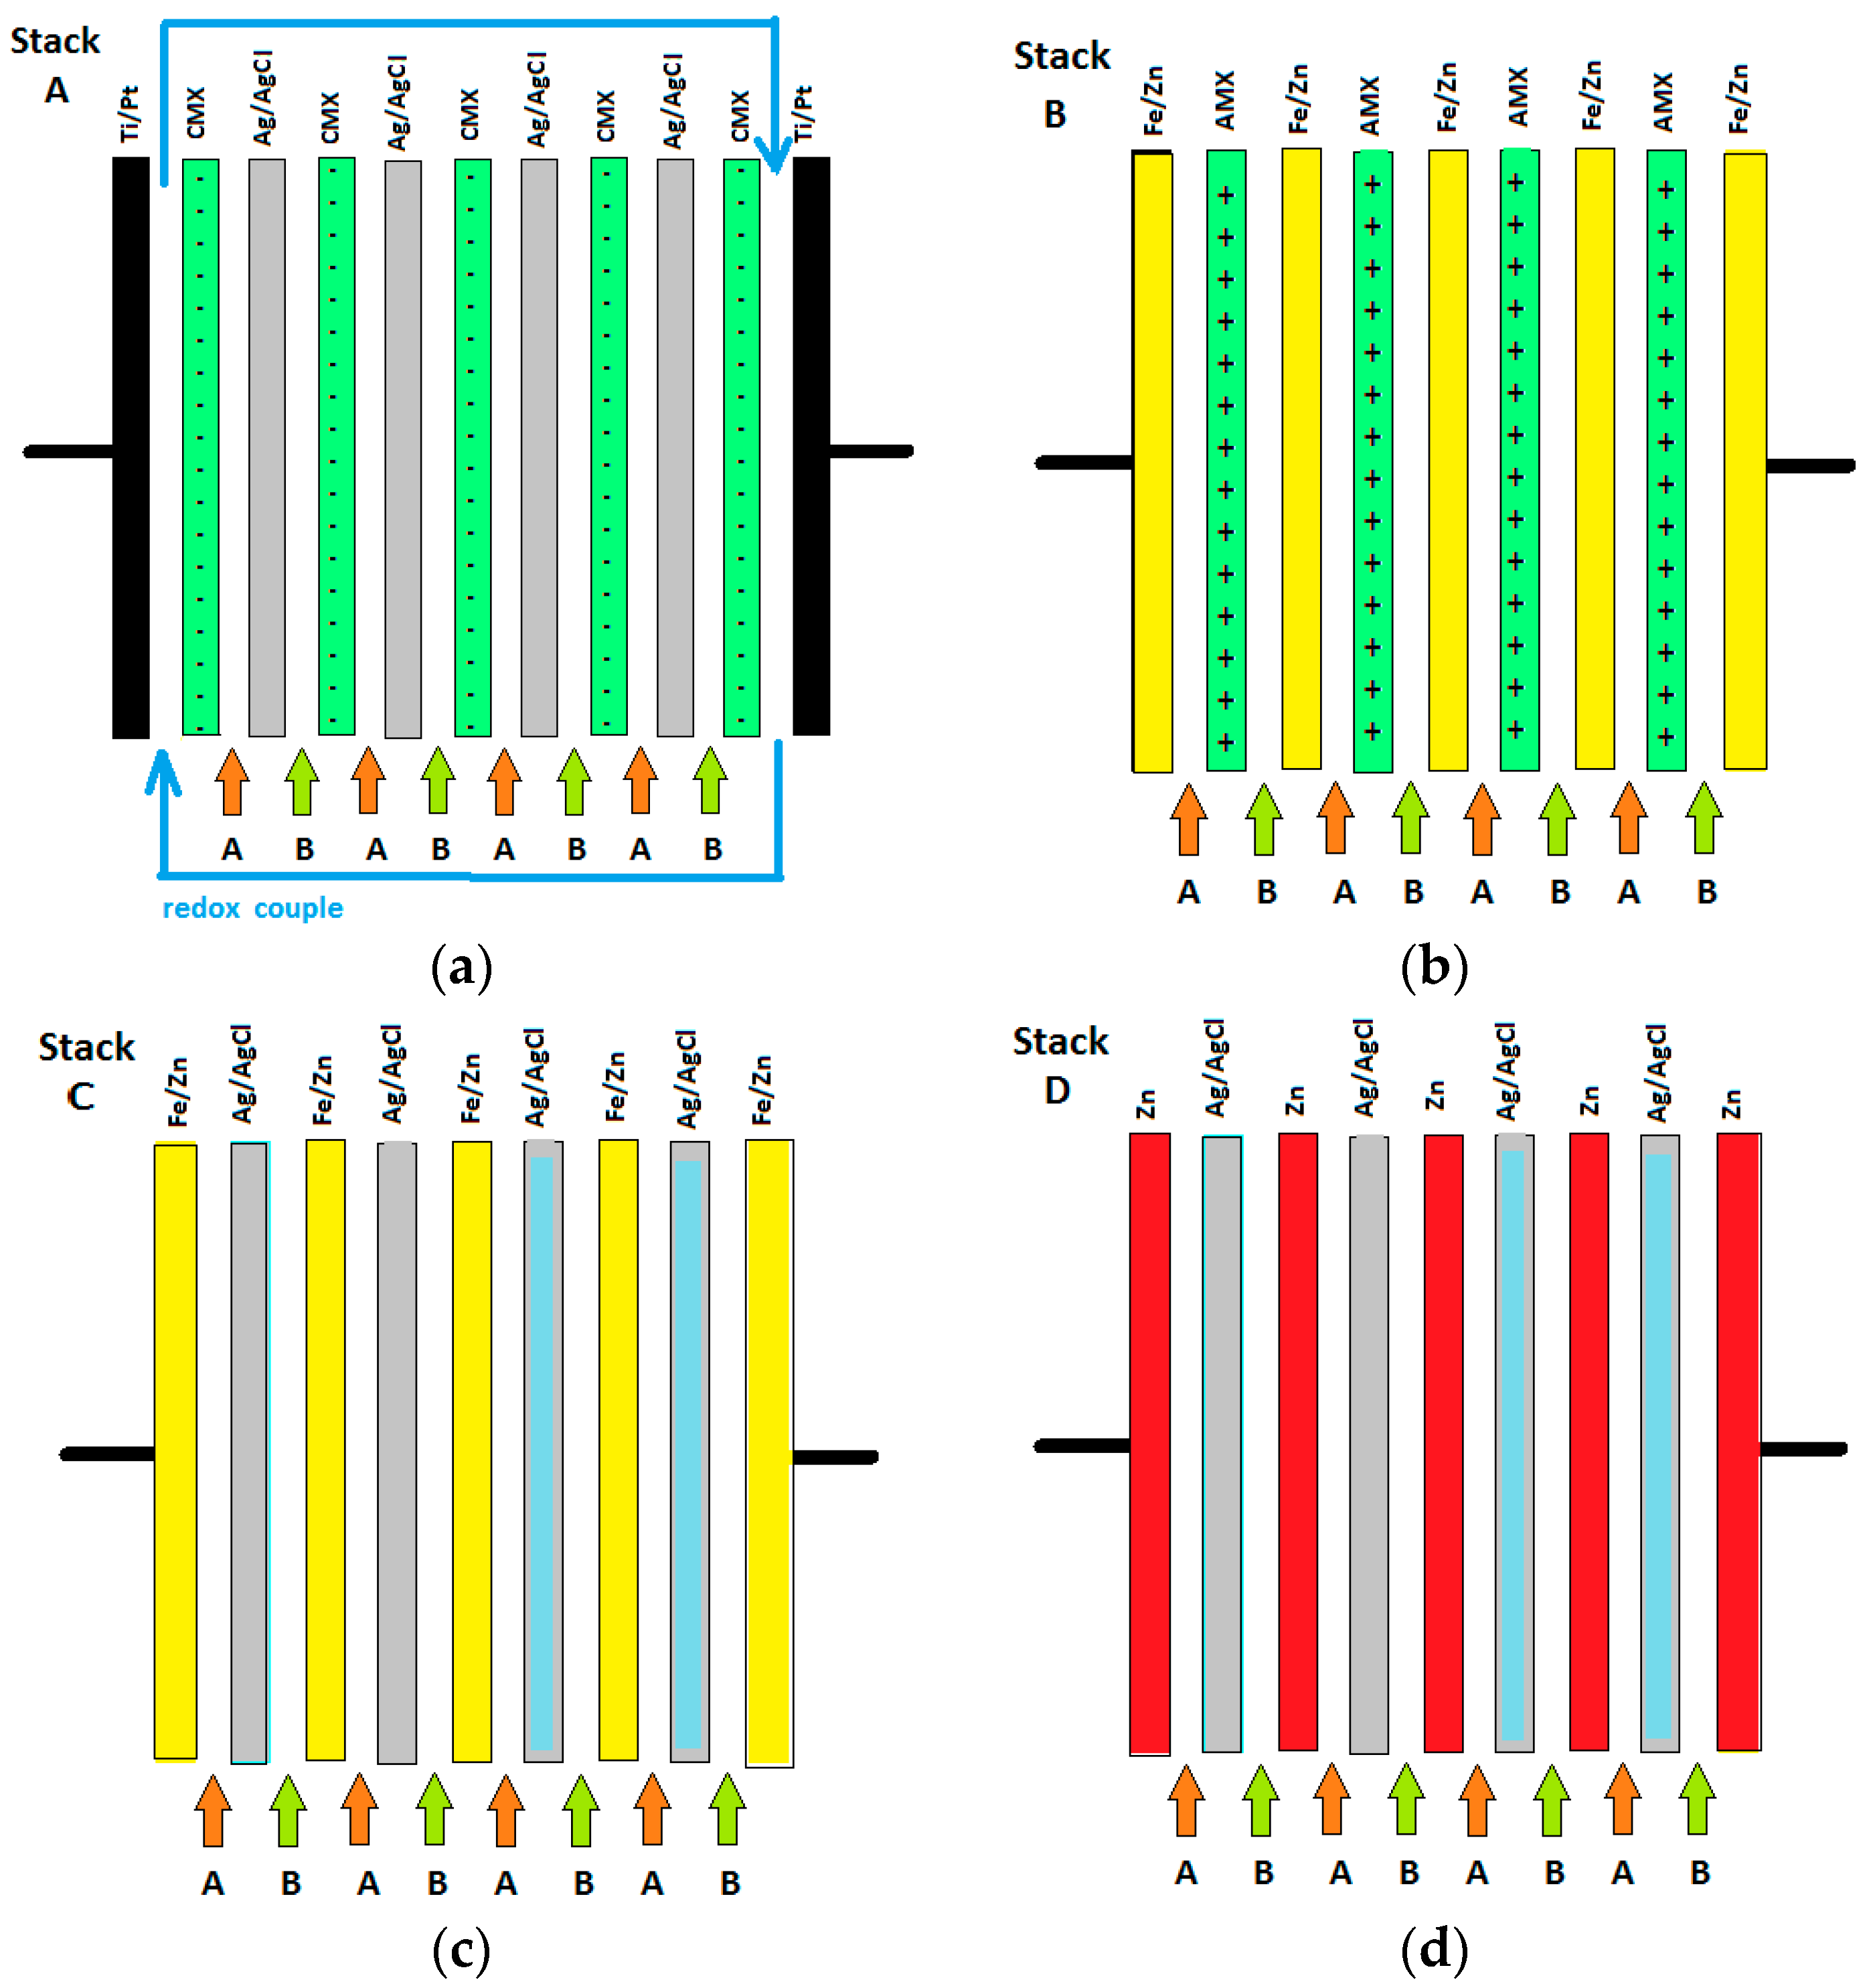
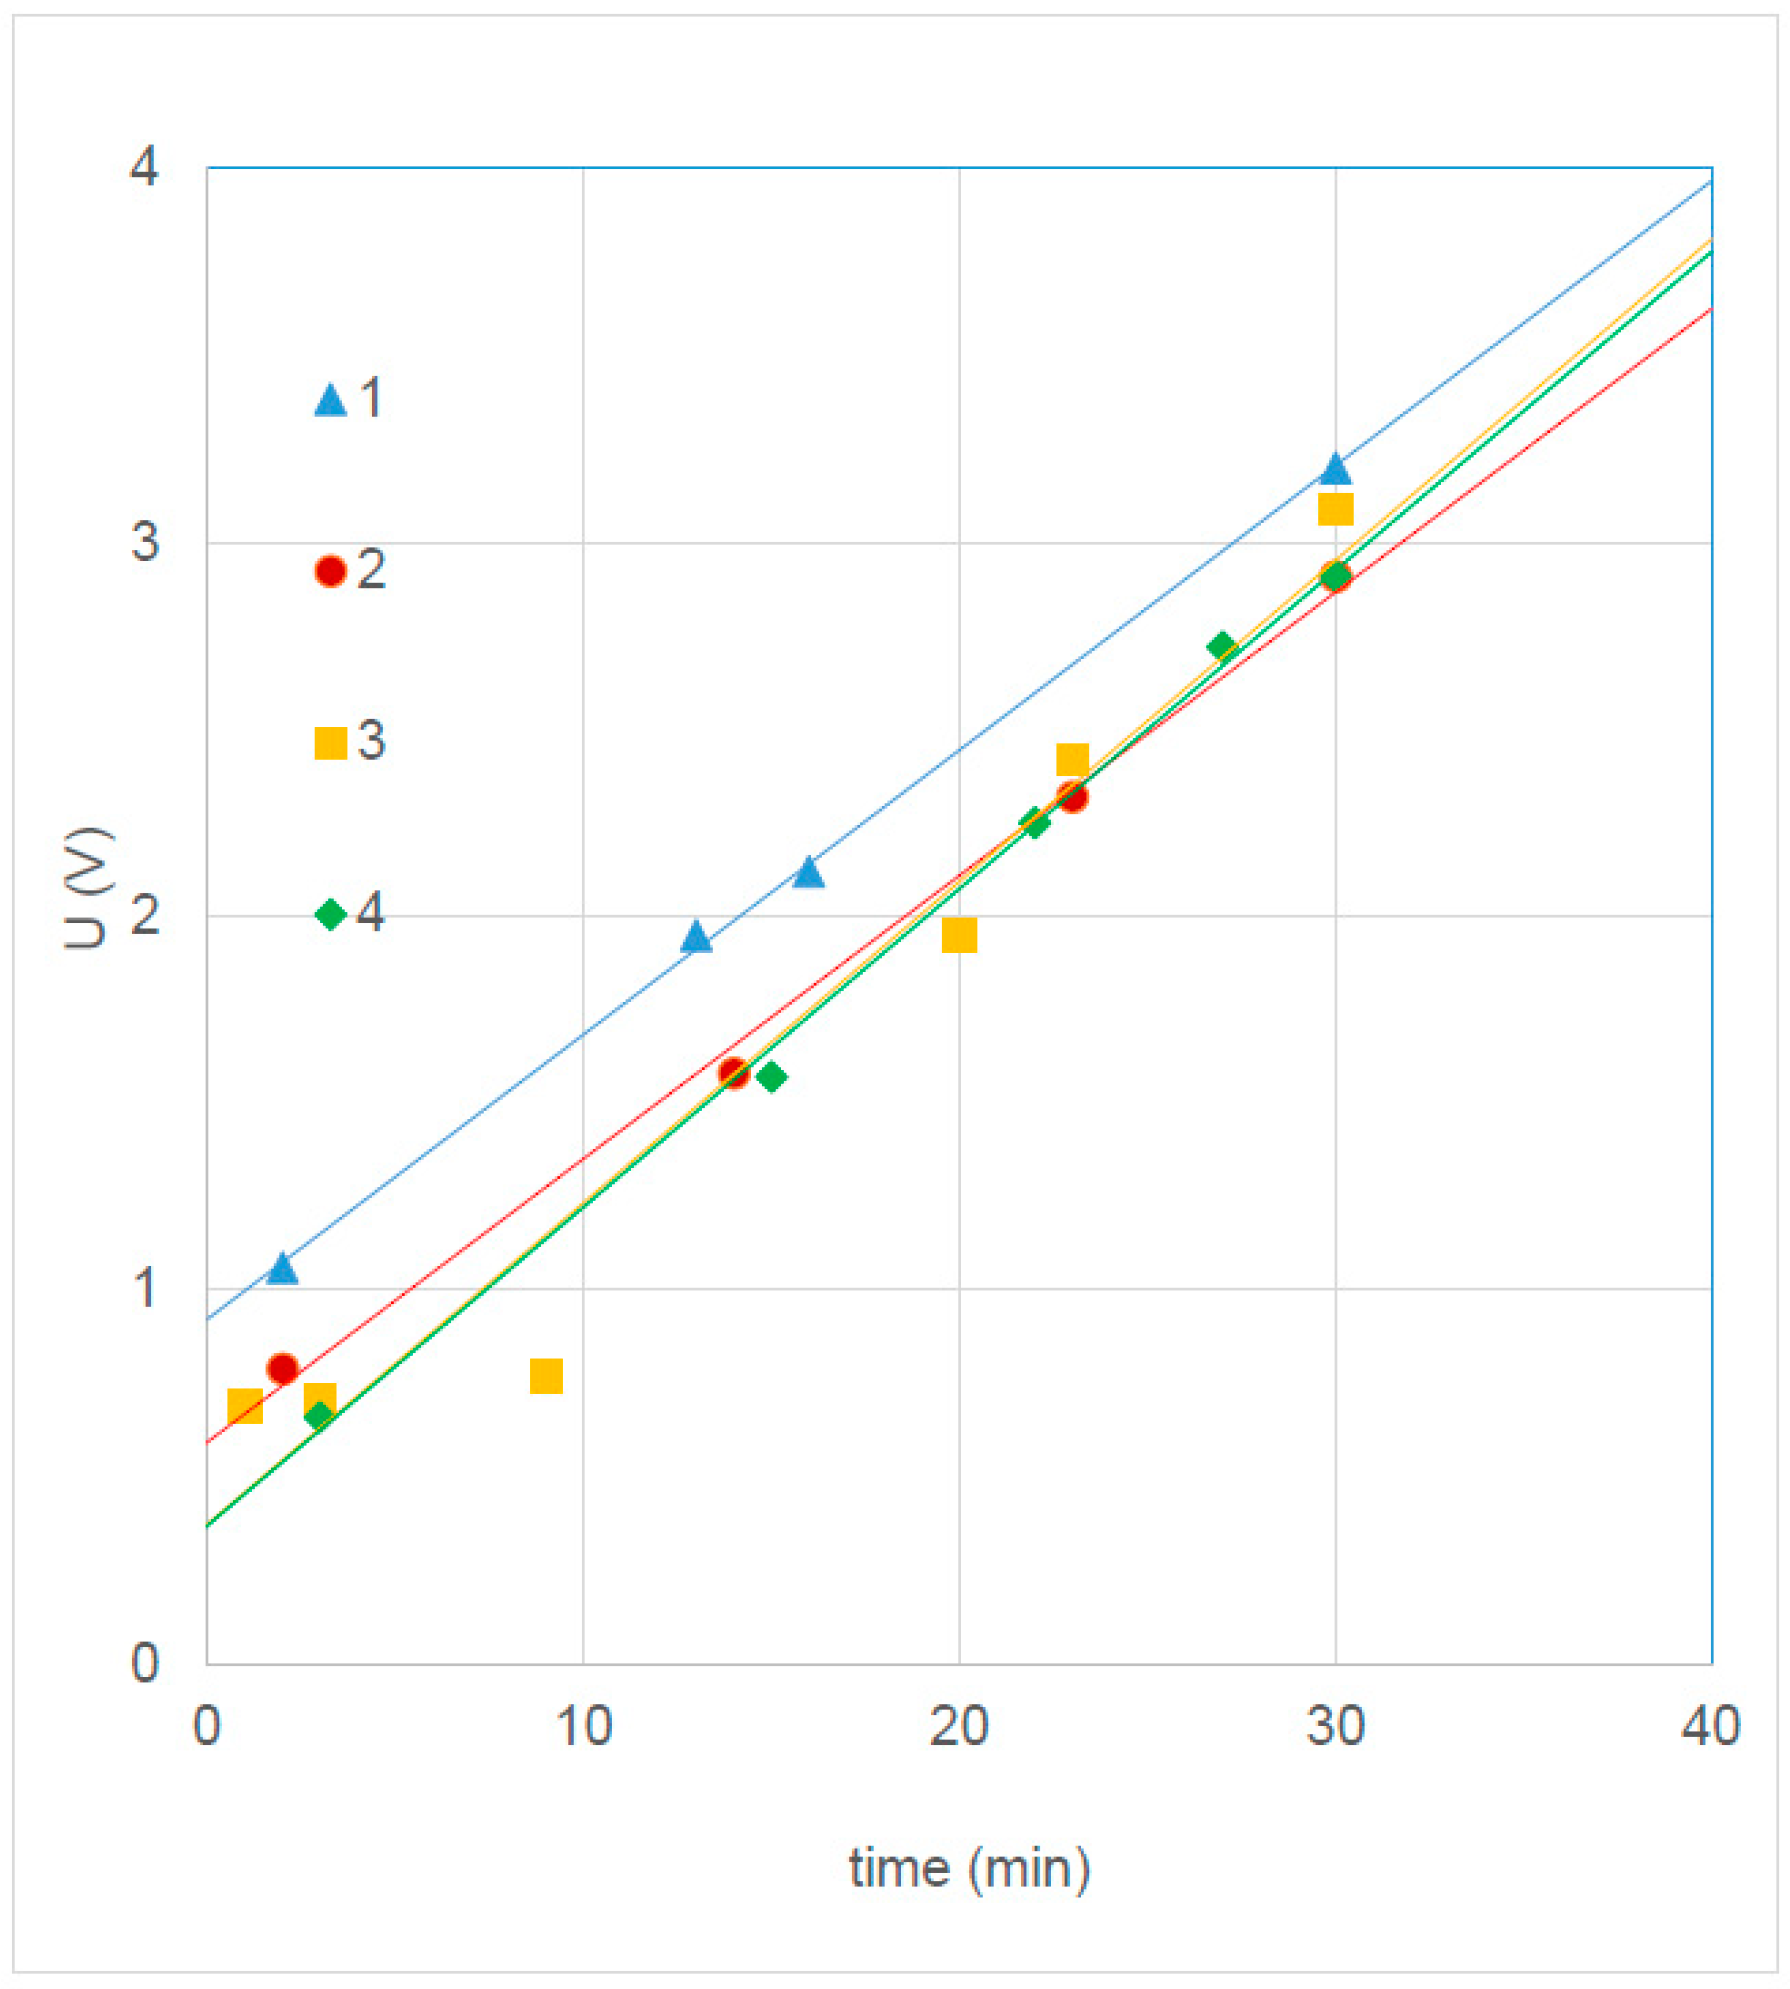
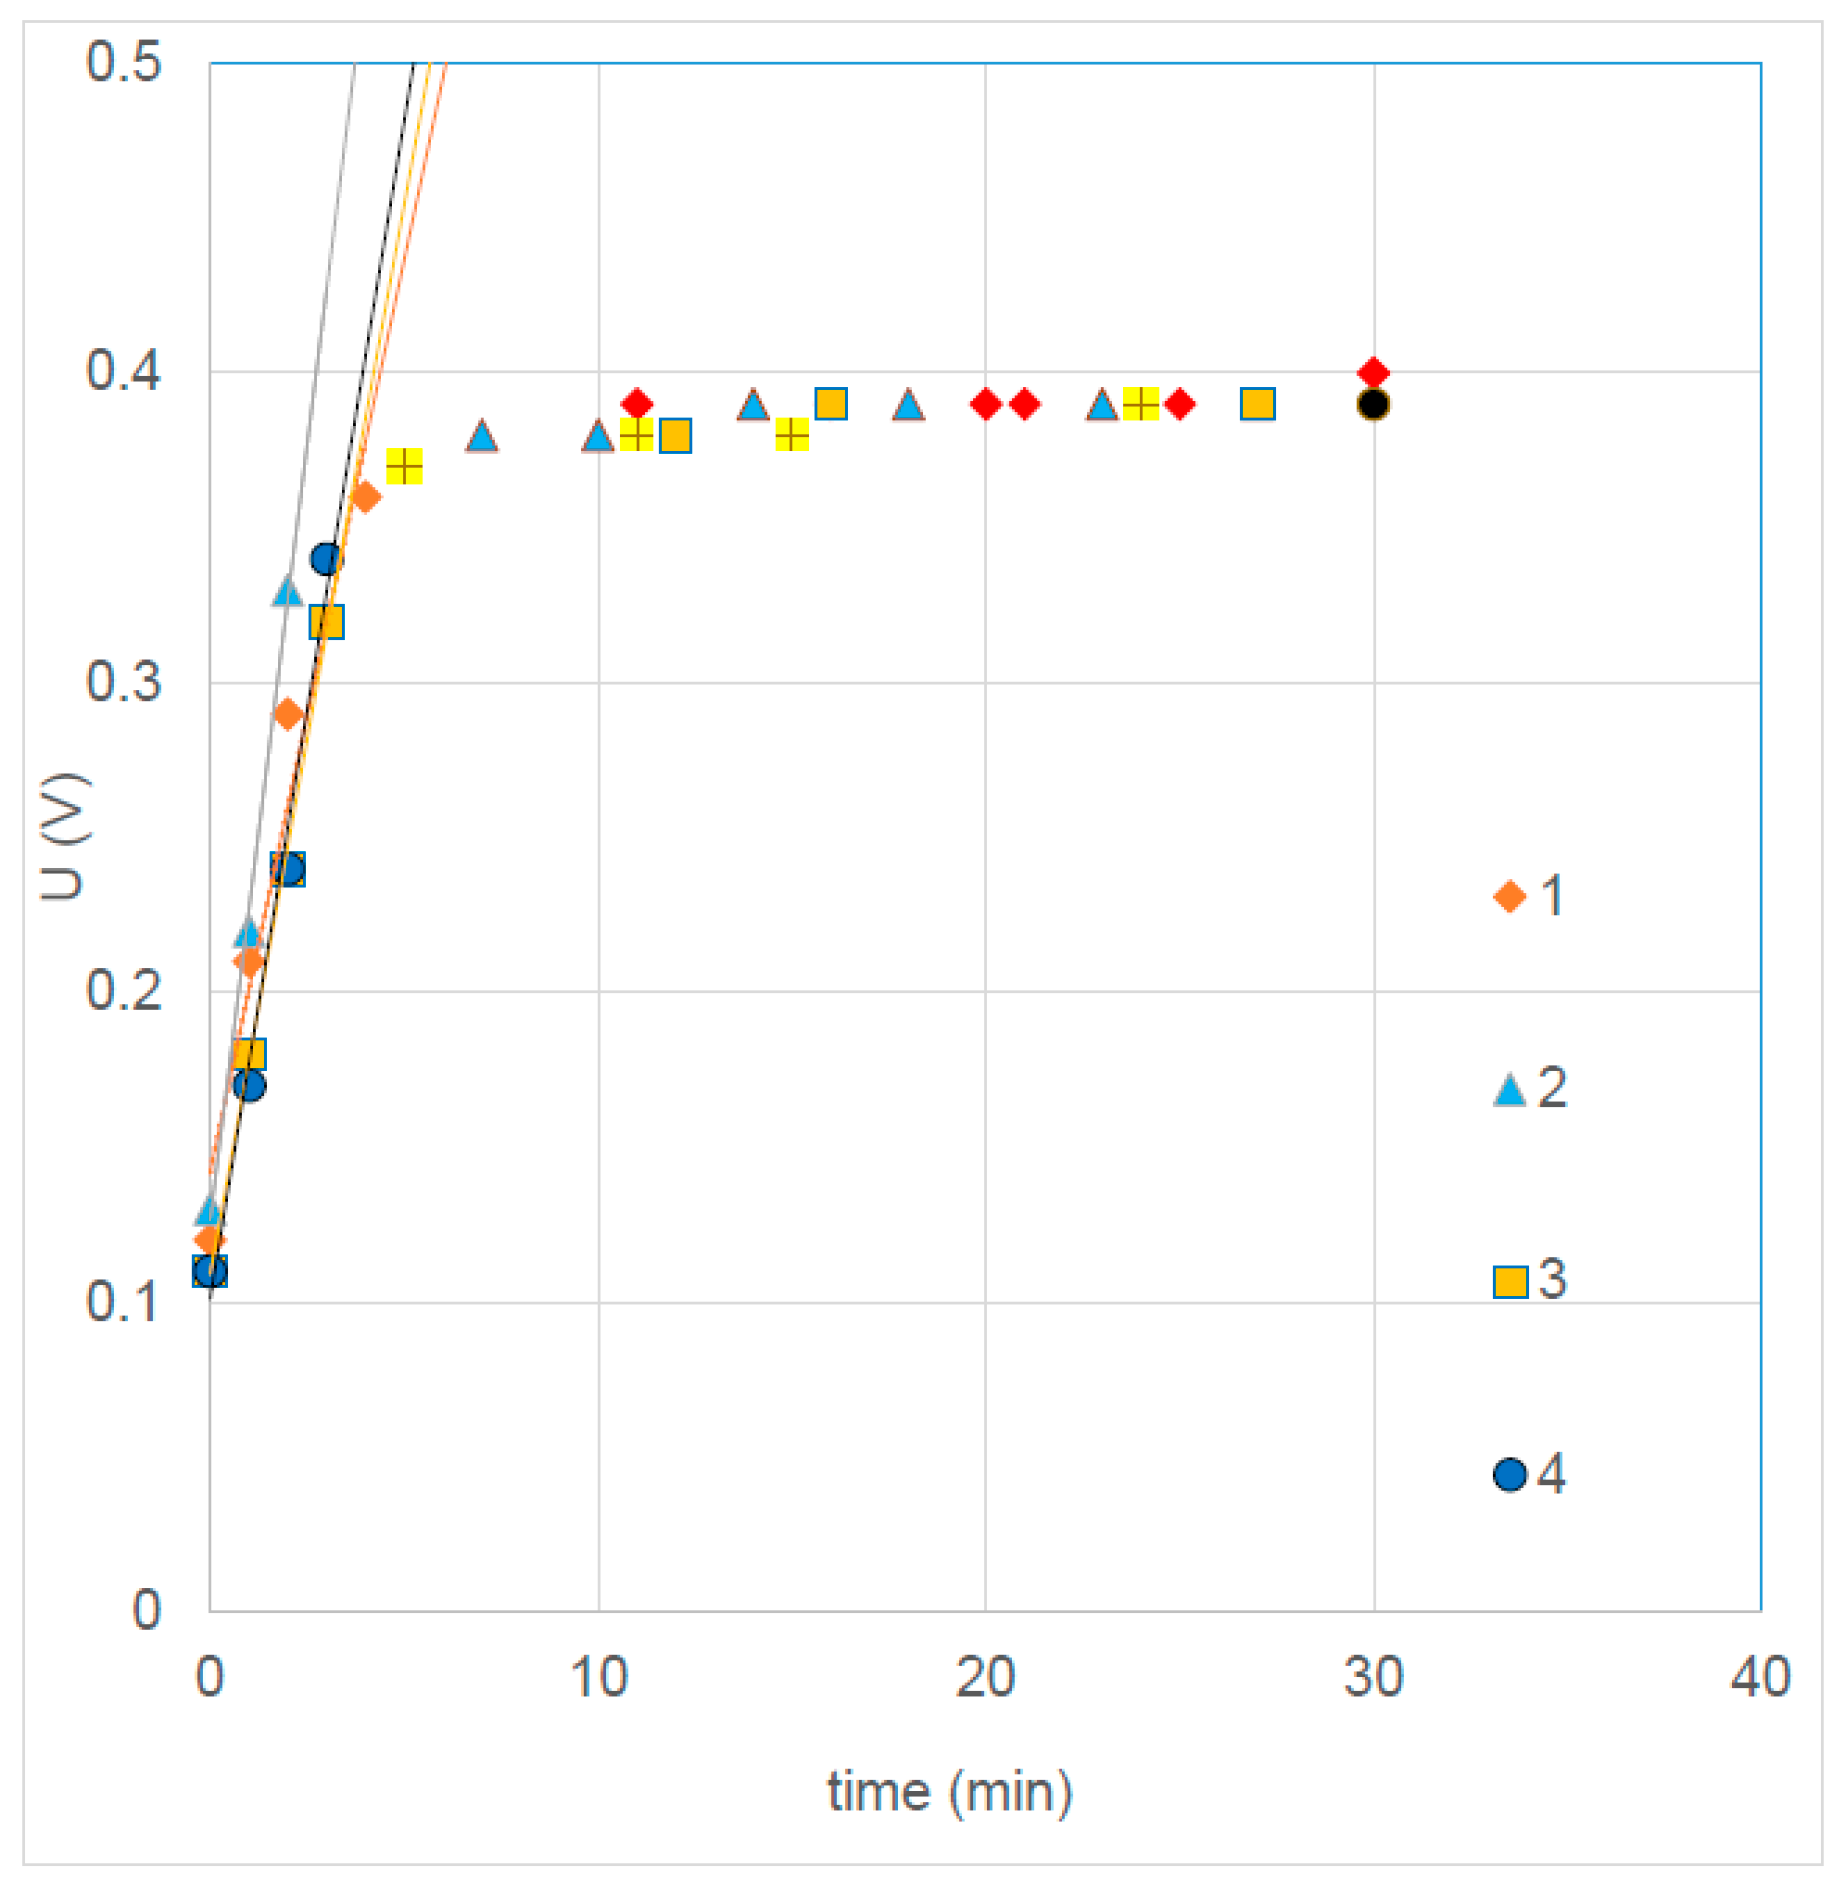
Silver plates (14.5 × 14.5 cm2) were cleaned with concentrated nitric acid. Anodizing of each plate was performed in a bath containing of 480 g of NaCl in 8 L of demi water. The silver plate was clamped between two titanium mesh electrodes covered with an Ru–Ir metal-oxide mixture. A distance of about 1 cm between the silver plate and the titanium electrode was fixed by four small rubber space holders at the corners. An electrical current of 2.496 A (59 A/m2) was applied for 30 min. Figure 3 shows the U-t curves. With a mean value of a (a = 0.086 V/min = 0.00143 V/s) from Table 6, we calculated with Equation (9) Faradic area resistance, RF = 0.039 Ω C−1 m4.
After 1 min, using Equation (7), the area resistance of one AgCl layer on the silver plate was 14.5 Ω cm2. Because this layer was present on both sides, the total area resistance of the pseudo-membrane was 29.0 Ω cm2 after 1 min, larger than normal AEMs by at least a factor of 10. In our case, the applied anodizing current was 59.4 A/m2, and assuming the same current density in the RED and ED application, the feed water switch in that stack should be performed within 1 min. During operation, the resistance of the pseudo-membrane will be more or less constant: the decrease on one side is compensated by growth on the other side.
An acceptable switch period (the time between two feed water switches) is dependent on the residence time of the feed waters. In our experiments, we used stacks with a flow channel length of 10 cm and feed water velocity of about 1 cm/s, resulting in a residence time of 10 s. Thus, during the switch, the stack was at least 10 s ineffective. With a half-switch time of 1 min, this 10 s meant a considerably loss. Otherwise, a longer switch period requires a thicker AgCl layer, with correspondingly higher ohmic losses. A solution may use lower current densities during ED/RED (e.g., 10 A/m2), resulting in relatively shorter dead time.
4.1.2. RED Test
Feed solutions were 0.1 M NaCl and 2 M NaCl. Two tests were performed, a maximum power point tracking (MPPT) and a constant current (CC) test.
RED with Maximum Power Point Tracking
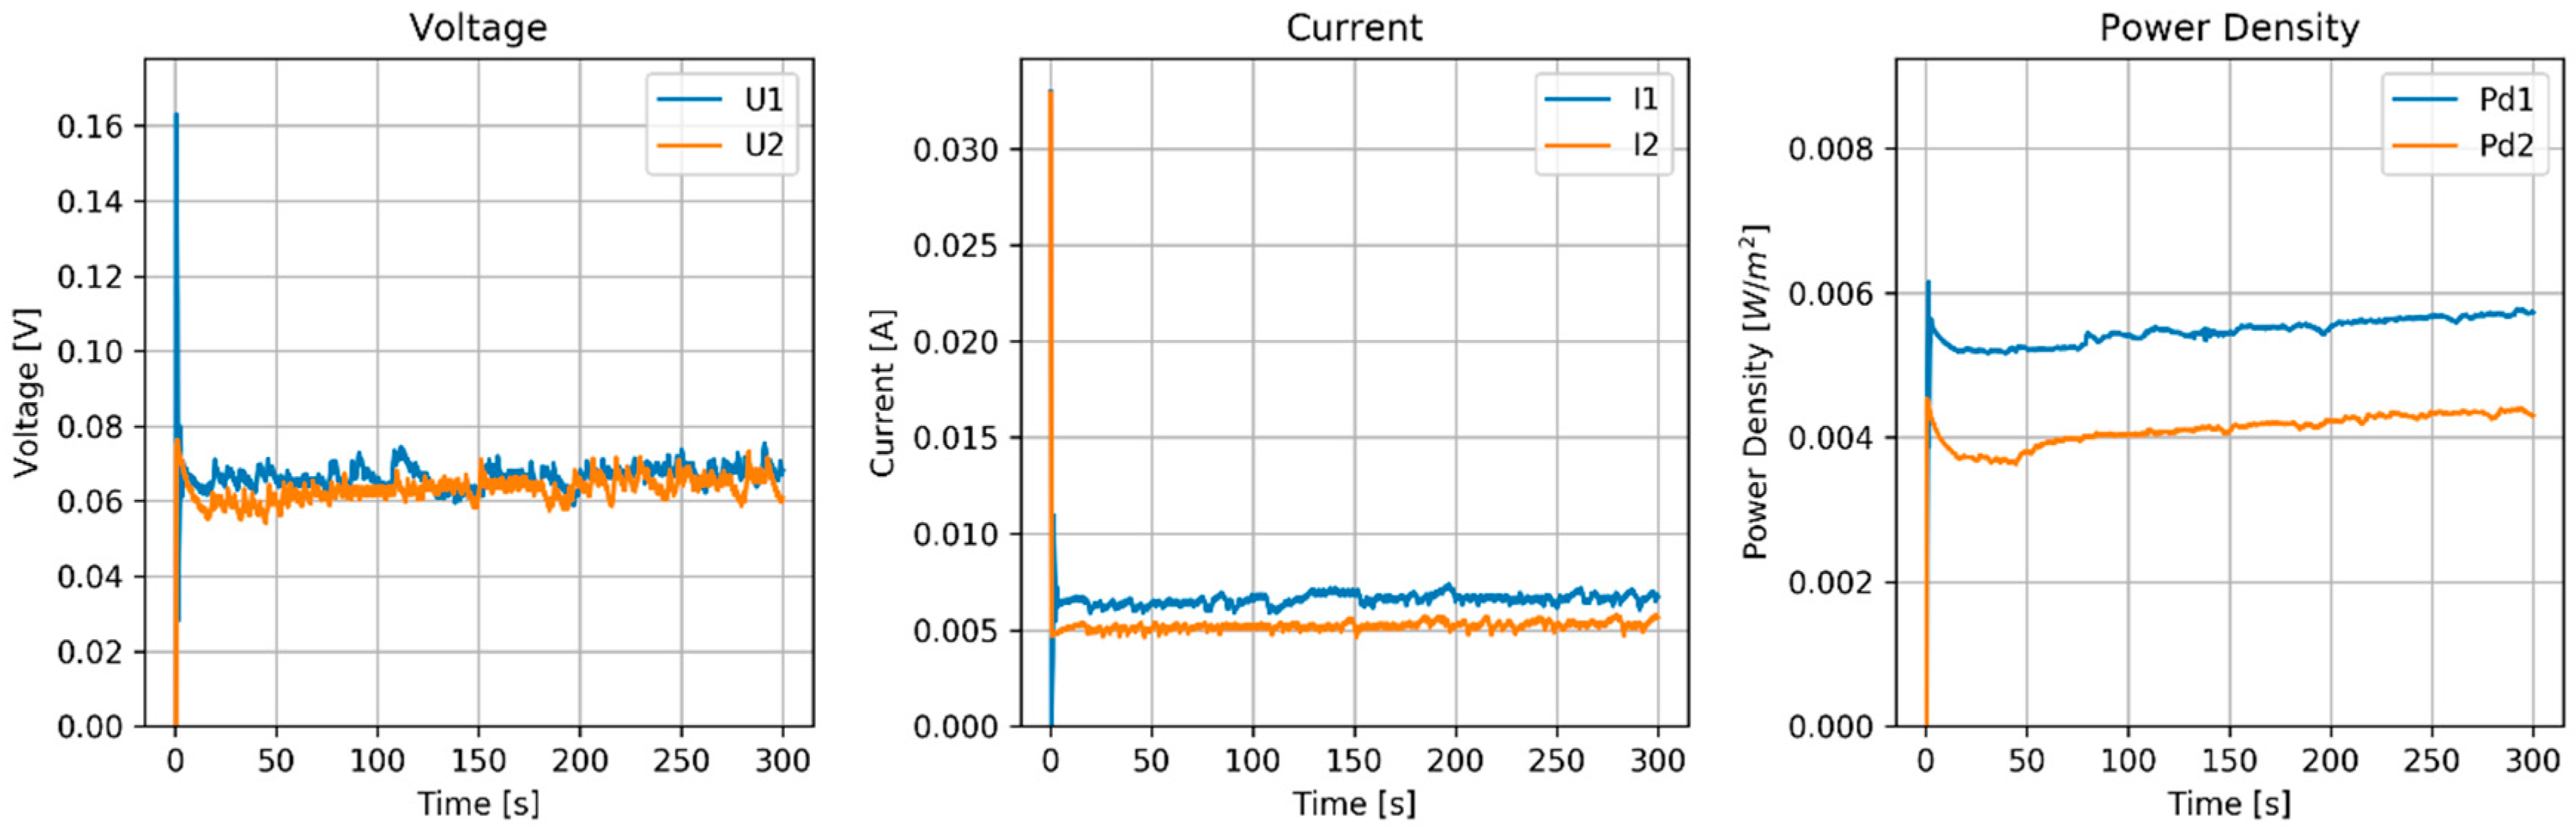
The stack was tested in RED mode with maximum power point tracking for 5 min. Rest time was 10 min, flow rate H and L were both 80 mL/min, and five runs were performed.
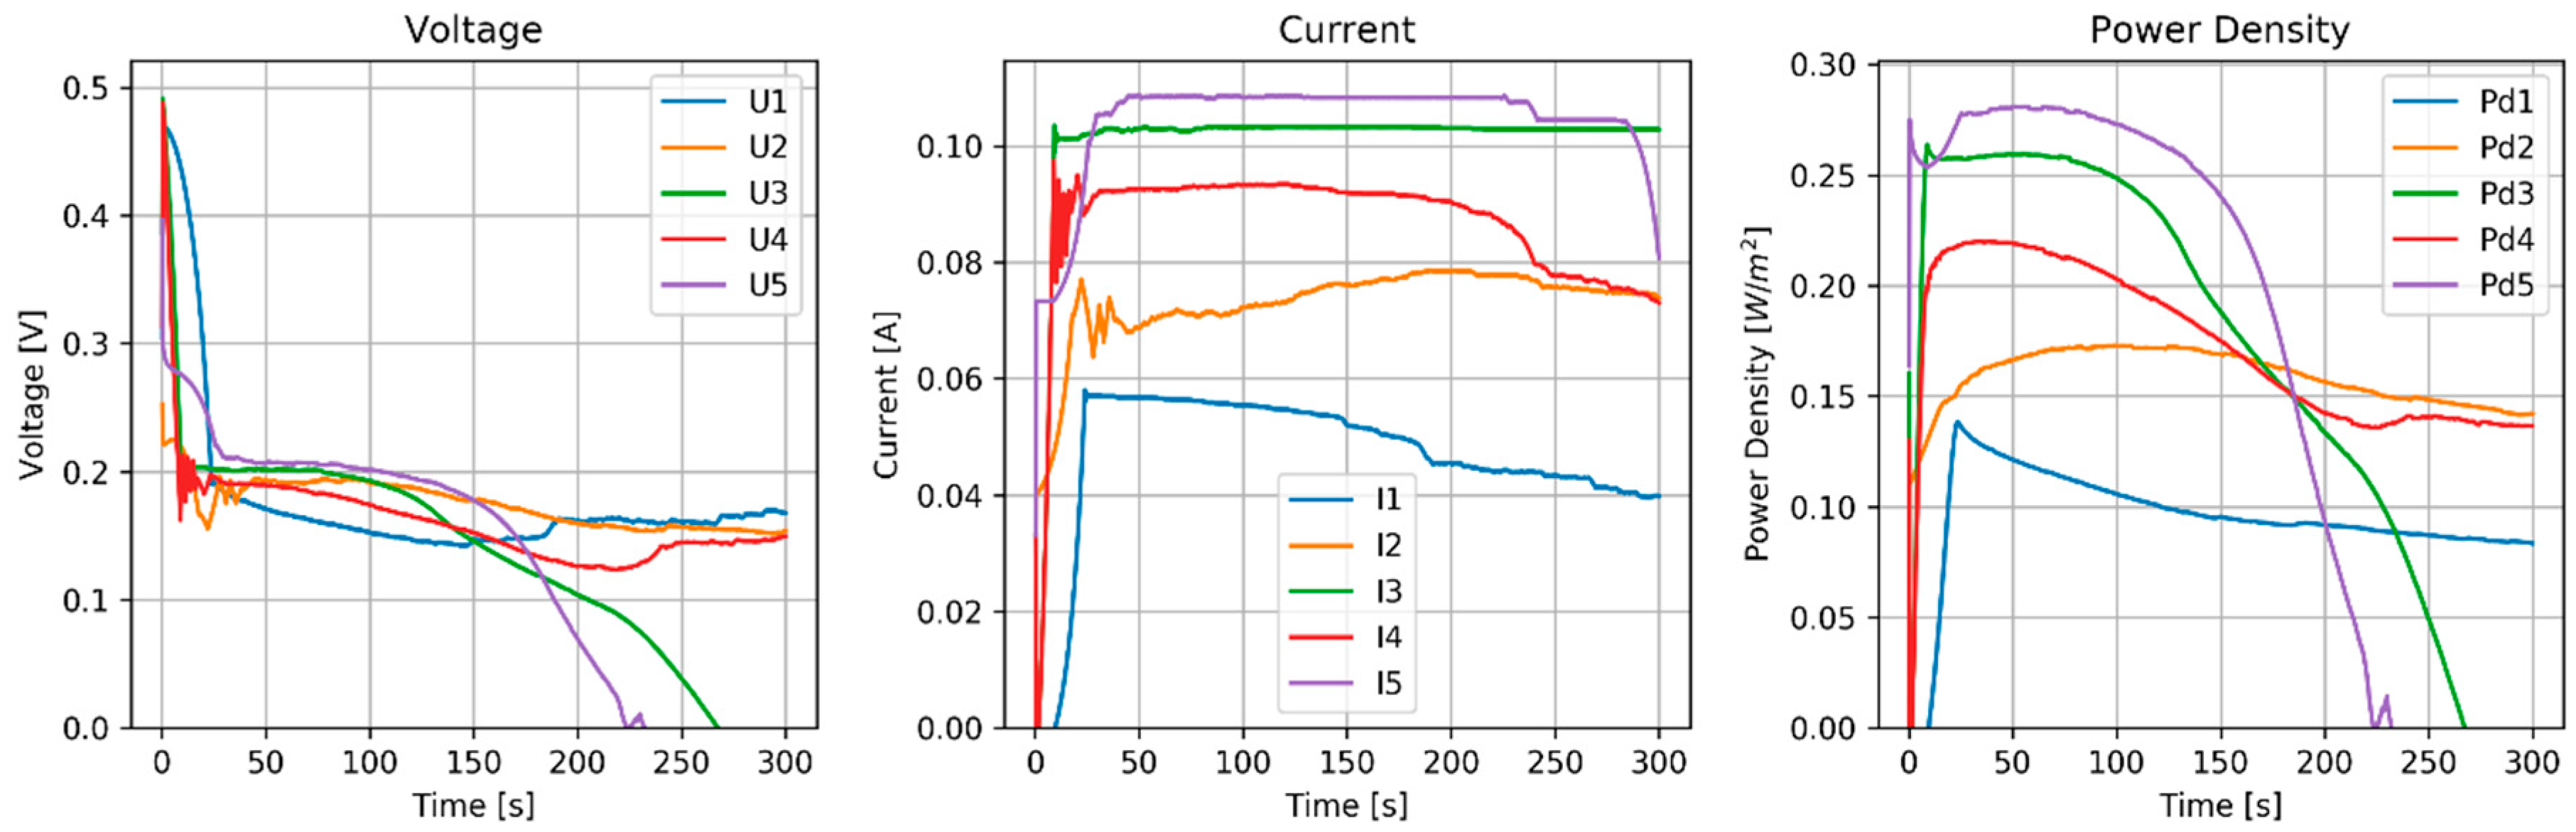
Figure 4 shows the results of the RED tests. After each run, the power production increased. Amazing is the relatively short duration of power production. This may be ascribed to suboptimal operation of one or more Ag/AgCl pAEMs.
RED Tested with Constant Current
The stack was tested in RED mode with a constant current of 80 mA (8 A/m2) for 10 min (Figure 5). Rest time was 10 min, H and L flow rates were both 80 mL/min. Again there was an improvement in the power. The working time was doubled with respect to the MPPT experiment. Before each run, the OCV (Open Circuit Voltage) was measured (Table 7).
Discussion of RED Tests
The expected OCV of the stack was estimated to be 647 mV based on a permselectivity of 0.99 for the CMX [28] and 1.00 for the Ag/AgCl pseudo-membrane, and an activity coefficient of 0.6 for the 0.5 M and 0.7 for the 2 M NaCl solutions. The measured OCV (Table 7 and Table 8) was substantially lower, and we ascribe it to the extremely high membrane resistance in combination with parasitic currents [29].
With an OCV of 81 mV per membrane, we expected a voltage of 40.5 mV per membrane at the stack under the condition of maximal power. The mean area resistance of the Ag/AgCl and CMX membranes was (0.0438 + 0.0003)/2 = 0.0221 Ωm2; the estimated current density would be 1.64 A/m (if we ignore the much lower resistance in the electrode and feed water compartments), and this would result in an external power density of 66 mW/m2.
The voltage collapsed after about 150 s in the MPPT experiment and also very quickly in the CC experiment. That is inexplicable, because the anodizing was done with 59 A/m2 for 30 min (delivering an electrical charge of 106,200 C/m2) and RED was performed with a current of about 0.1 A for 150 s (i.e., 15 C/m2).
A possible explanation could be that an inhomogeneous AgCl layer was formed during the anodizing process. If there were parts in the surface with a thinner layer, these parts would have lower resistance and would dissolve preferentially during the RED process [30].
4.2. Test of the Zinc Pseudo-Membrane
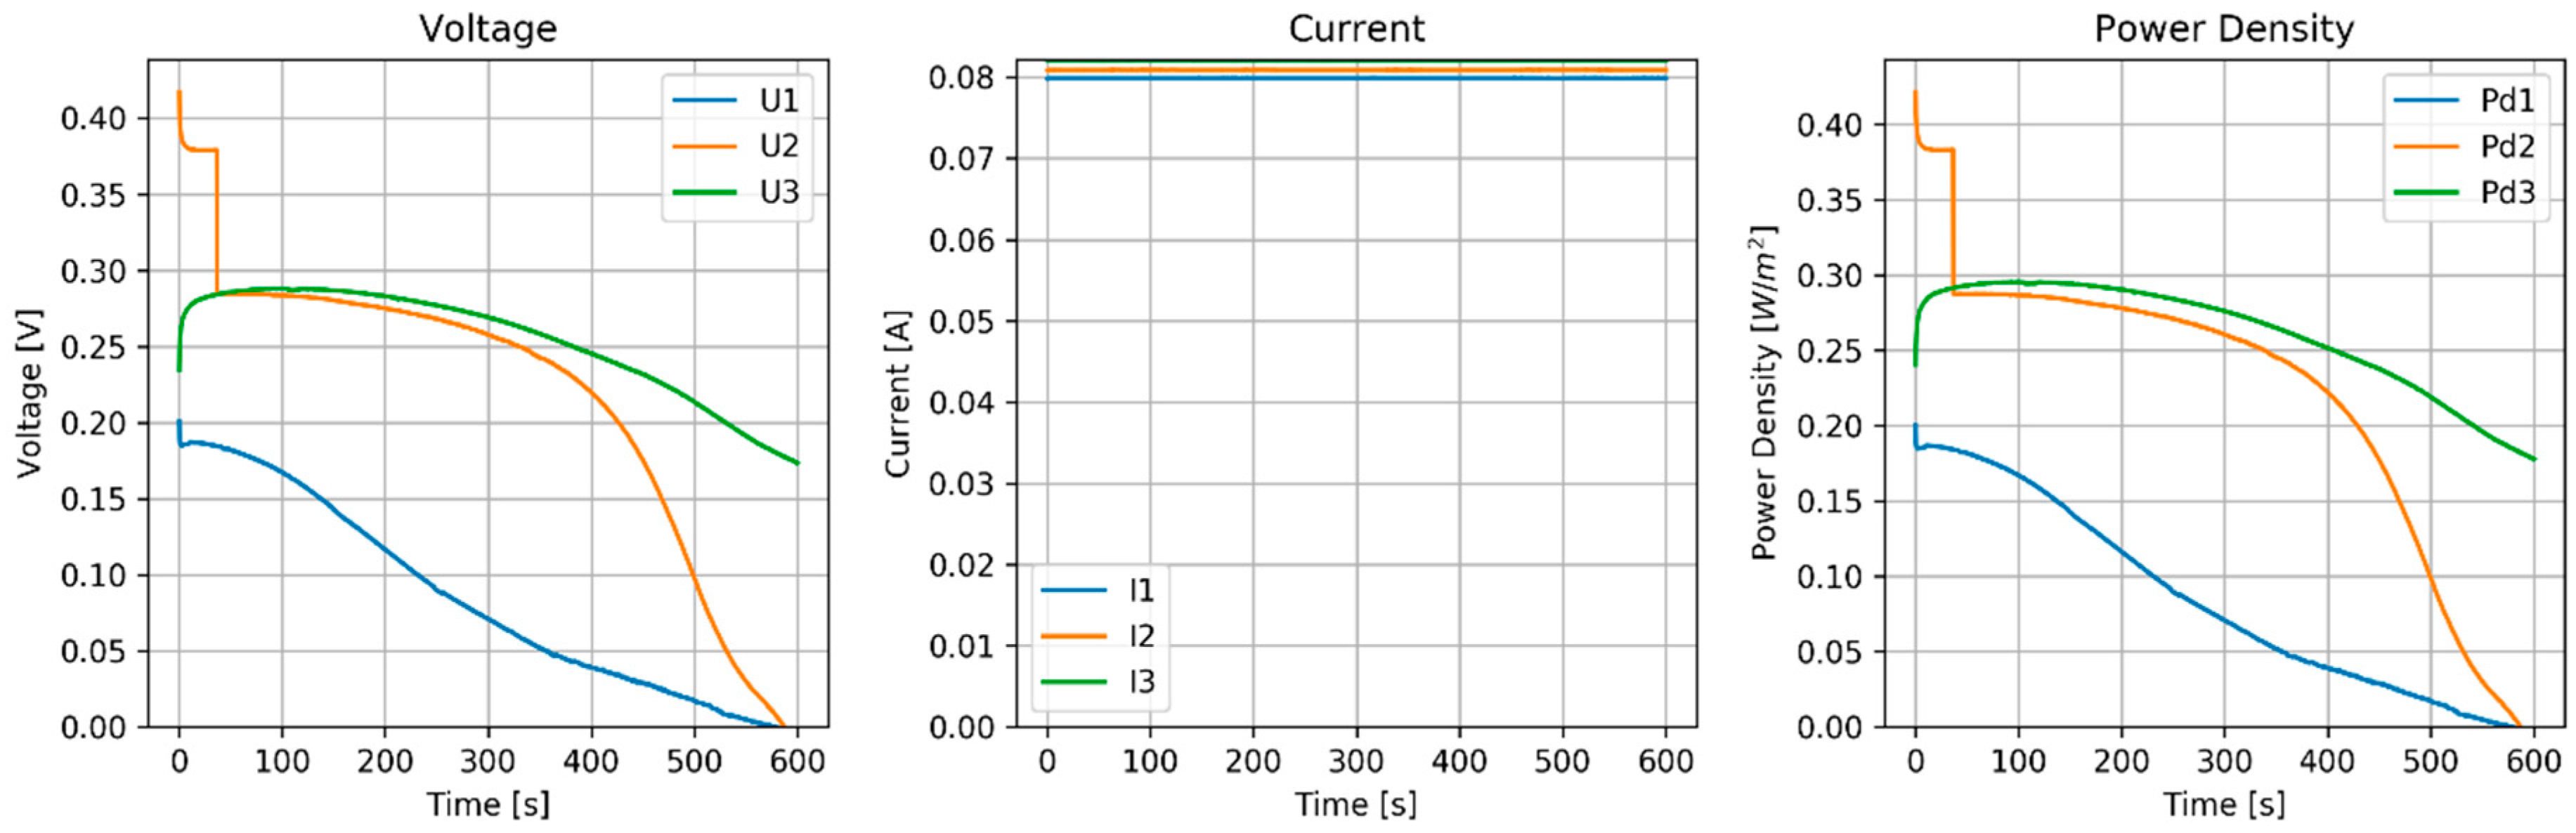
In this experiment, galvanized iron plate was used as a zinc source. A stack was built with two Fe/Zn end electrodes and three Fe/Zn pseudo CEMs, and four Neosepta AMX membranes between the Fe/Zn plates. Spacers were 500 μm woven fabric. The stack was fed with a 0.1 M (15.33 mS/cm at 20.8 °C) and a 2 M (95.1 mS/cm at 21.0 °C) ZnCl2 solution.
4.2.1. RED Test
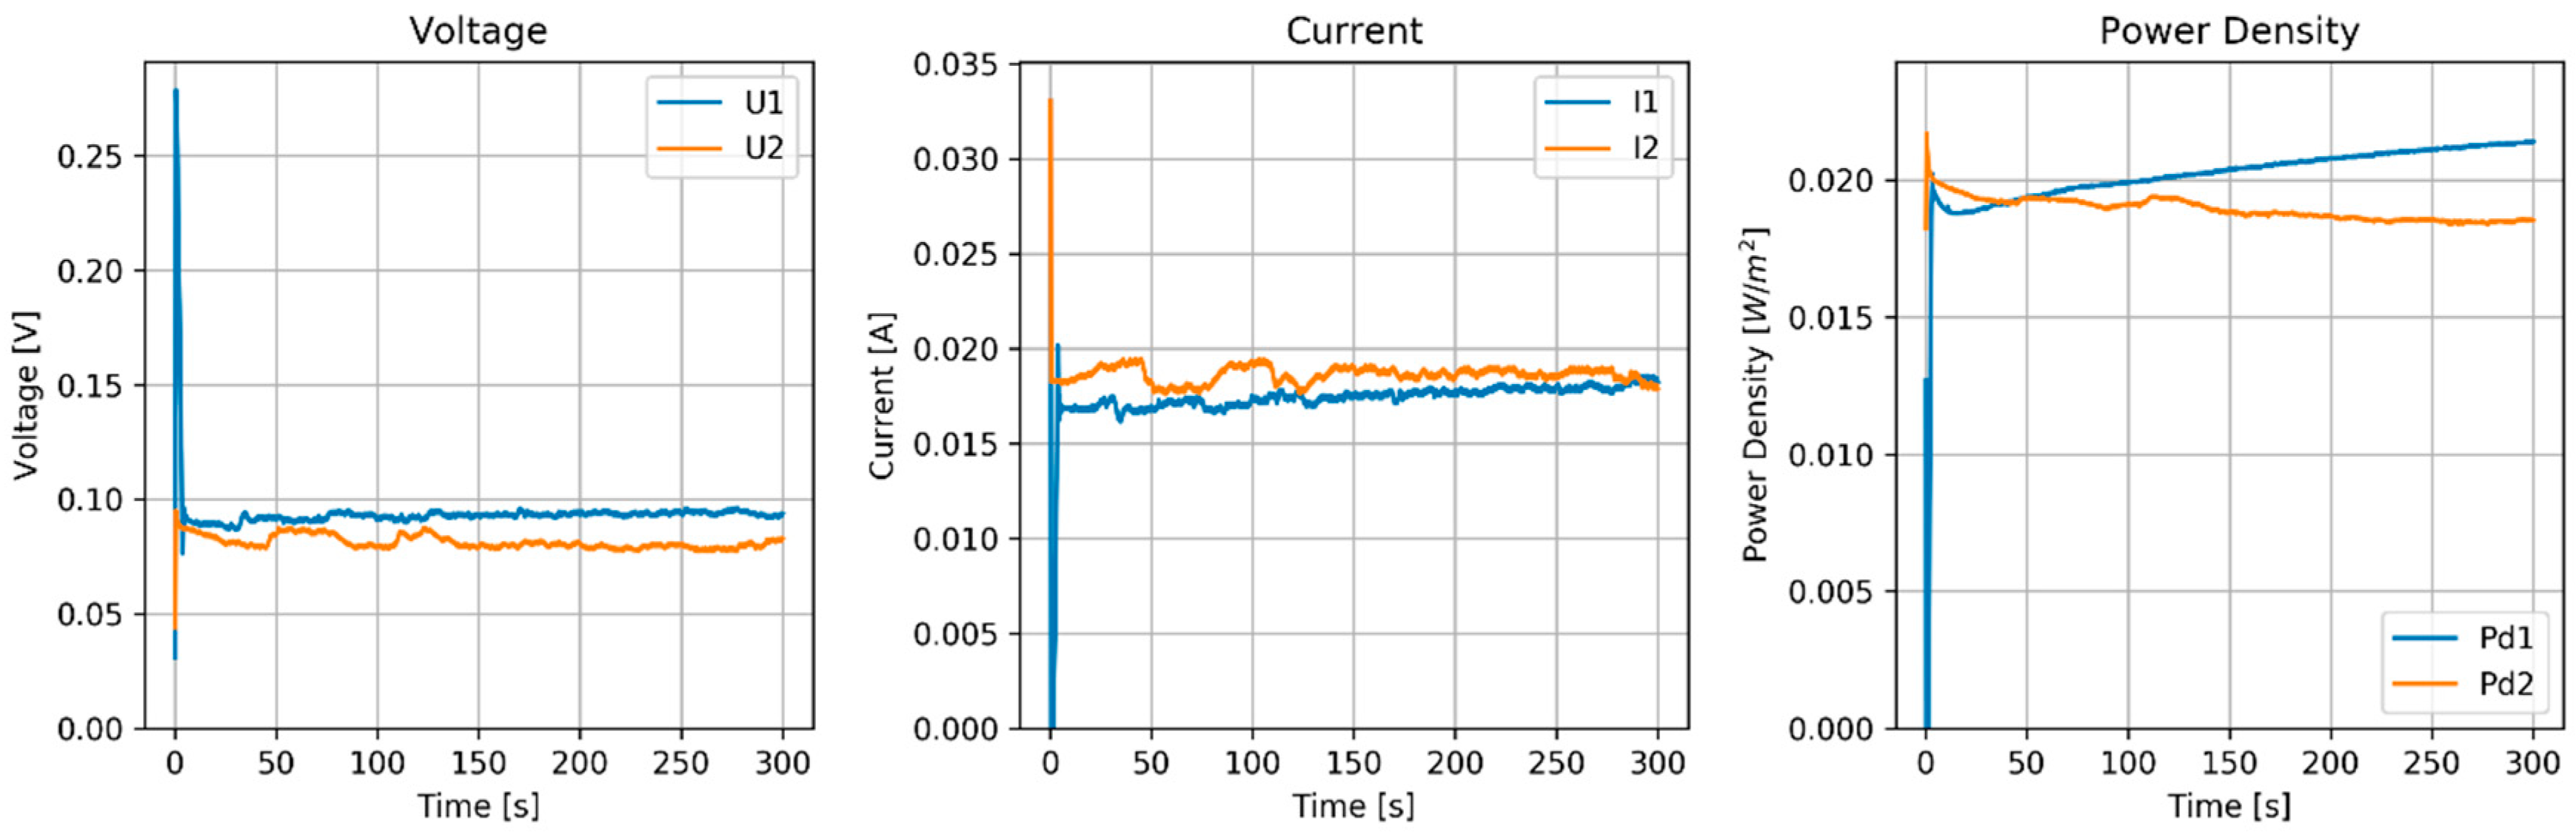
RED with Maximum Power Point Tracking
RED Tested with Constant Current
Voltage, current and power density of the constant current (20 mA) experiment are shown in Figure 7.
Discussion of the RED Tests
OVC values of the Zn–AMX system using a ZnCl2 solution were less than half of those of the CMX–Ag/AgCl system with an NaCl solution. That is probably due to the electrochemistry at the zinc surface, but interaction of the ZnCl3− anion at the AMX can also play a role.
Between each run, the feed solutions were switched, and a large asymmetry is seen in the voltage and current plot. However, the system is symmetrical and we cannot explain this anomalous behavior. The power density of this Zn–AMX stack is a factor of 10 lower than that achieved with the CMX–Ag/AgCl stack.
4.3. Test of the Combined Ag/AgCl and Zn Pseudo-Membranes
In this experiment, galvanized iron plate was again used as a zinc source. A stack was built with two Fe/Zn end electrodes and three Fe/Zn pseudo CEMs, and four Ag/AgCl pseudo-membranes between the Fe/Zn plates. Spacers were 500 μm woven fabric. The stack was fed with a 0 M (0.512 mS/cm at 20.8 °C) and a 2 M (106.1 mS/cm at 21.0 °C) ZnCl2 solution.
4.3.1. Preparation of the Ag/AgCl Electrodes
For experiment 4.3, a bath of 300 g NaCl and 250 mL concentrated HCl in 10 L demi water was used and a current of 2.0 A (48 A/m2) was applied for 30 min. Figure 8 shows the U-t curves and Table 10 summarizes the properties of the regression lines.
From Equation (9) it follows that Rca = 6.0 × 10⁻⁷ Ω C−1 m4, 50% larger than in the first experiment (Section 4.1).
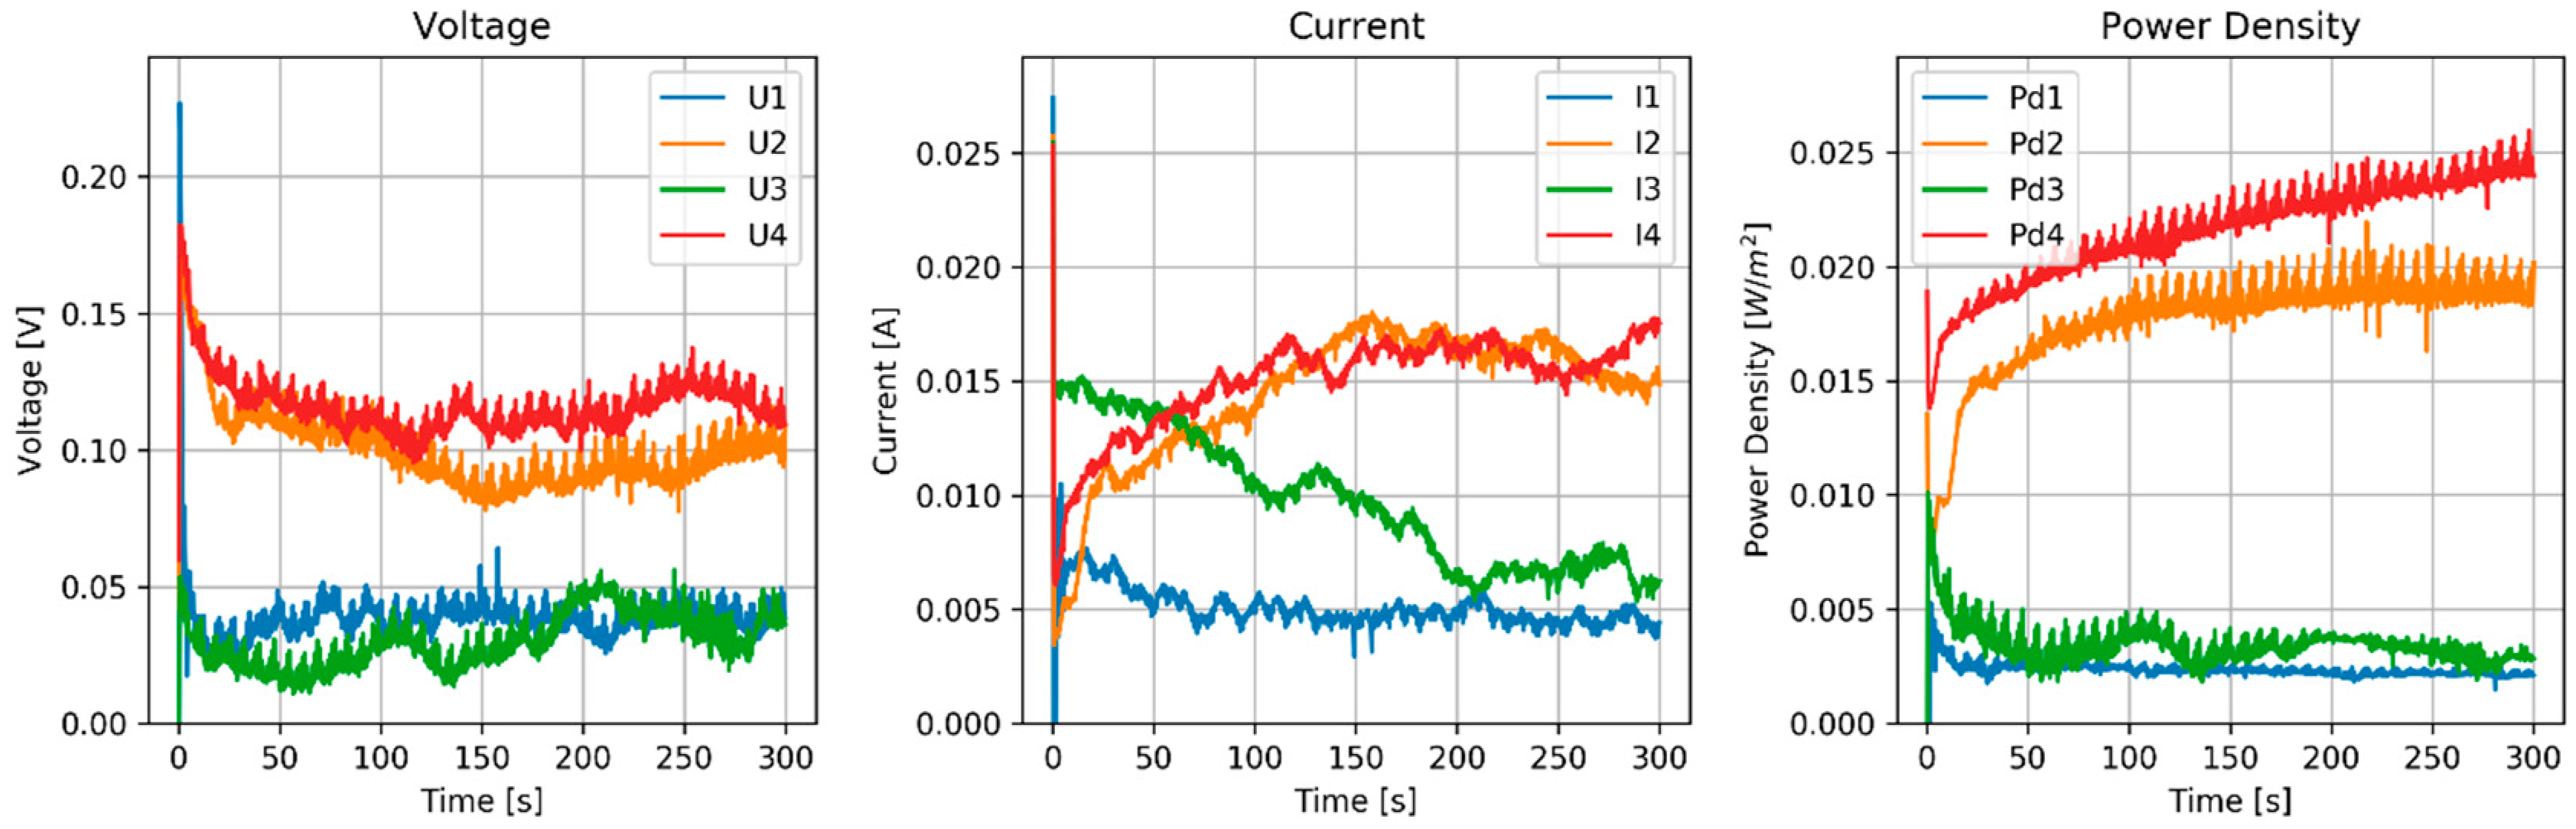
4.3.2. RED Test
RED with Maximum Power Point Tracking
RED with Constant Current
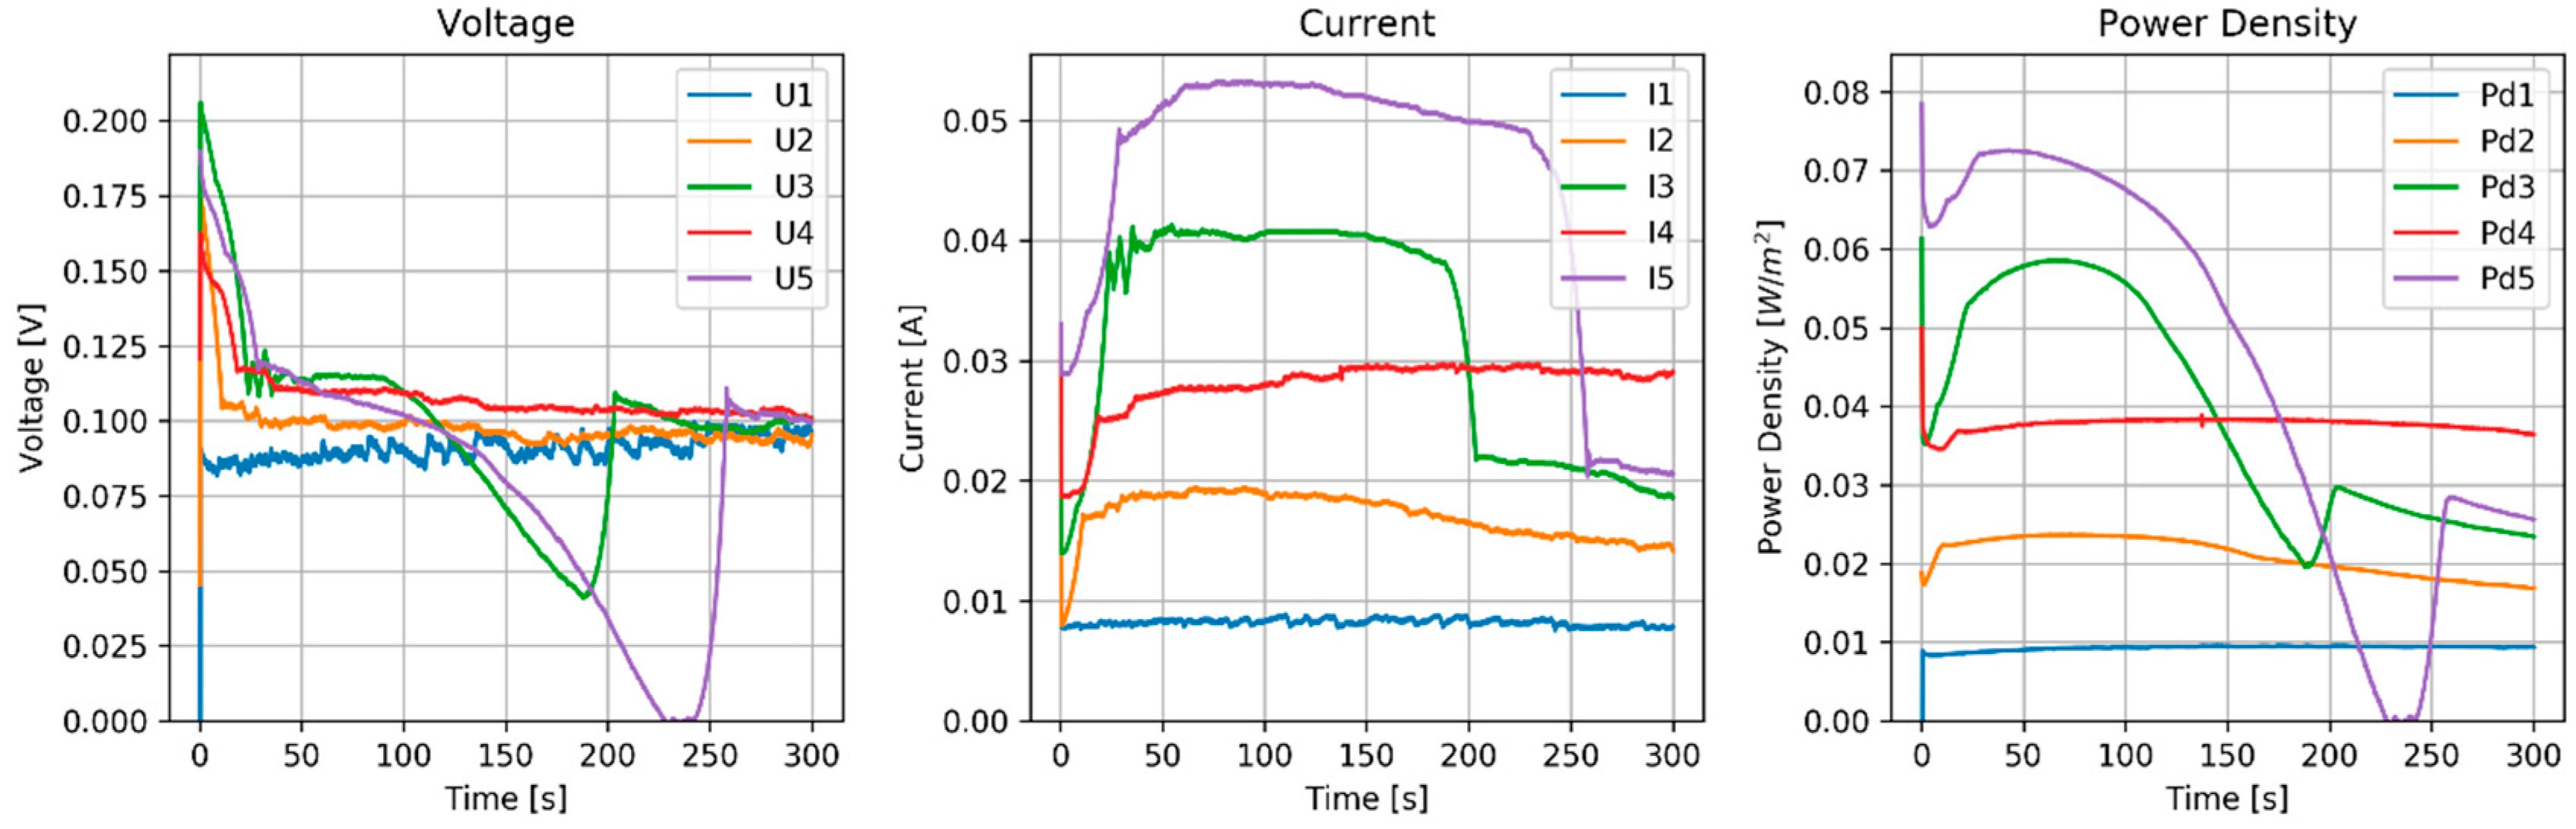
Again the stack was tested with constant current as shown in Figure 11.
Discussion of RED Tests
The flow rate had a rather large influence on the power density. With 60 mL/min (superficial velocity of 0.5 cm/s), the power density was 5 mW/m2, and with 120 mL/min (1 cm/s), the power density increased to about 20 mW/m2. Larger flow rates seemed not to improve the power density.
4.4. Test of the Combined Ag/AgCl and Zn Pseudo-Membranes
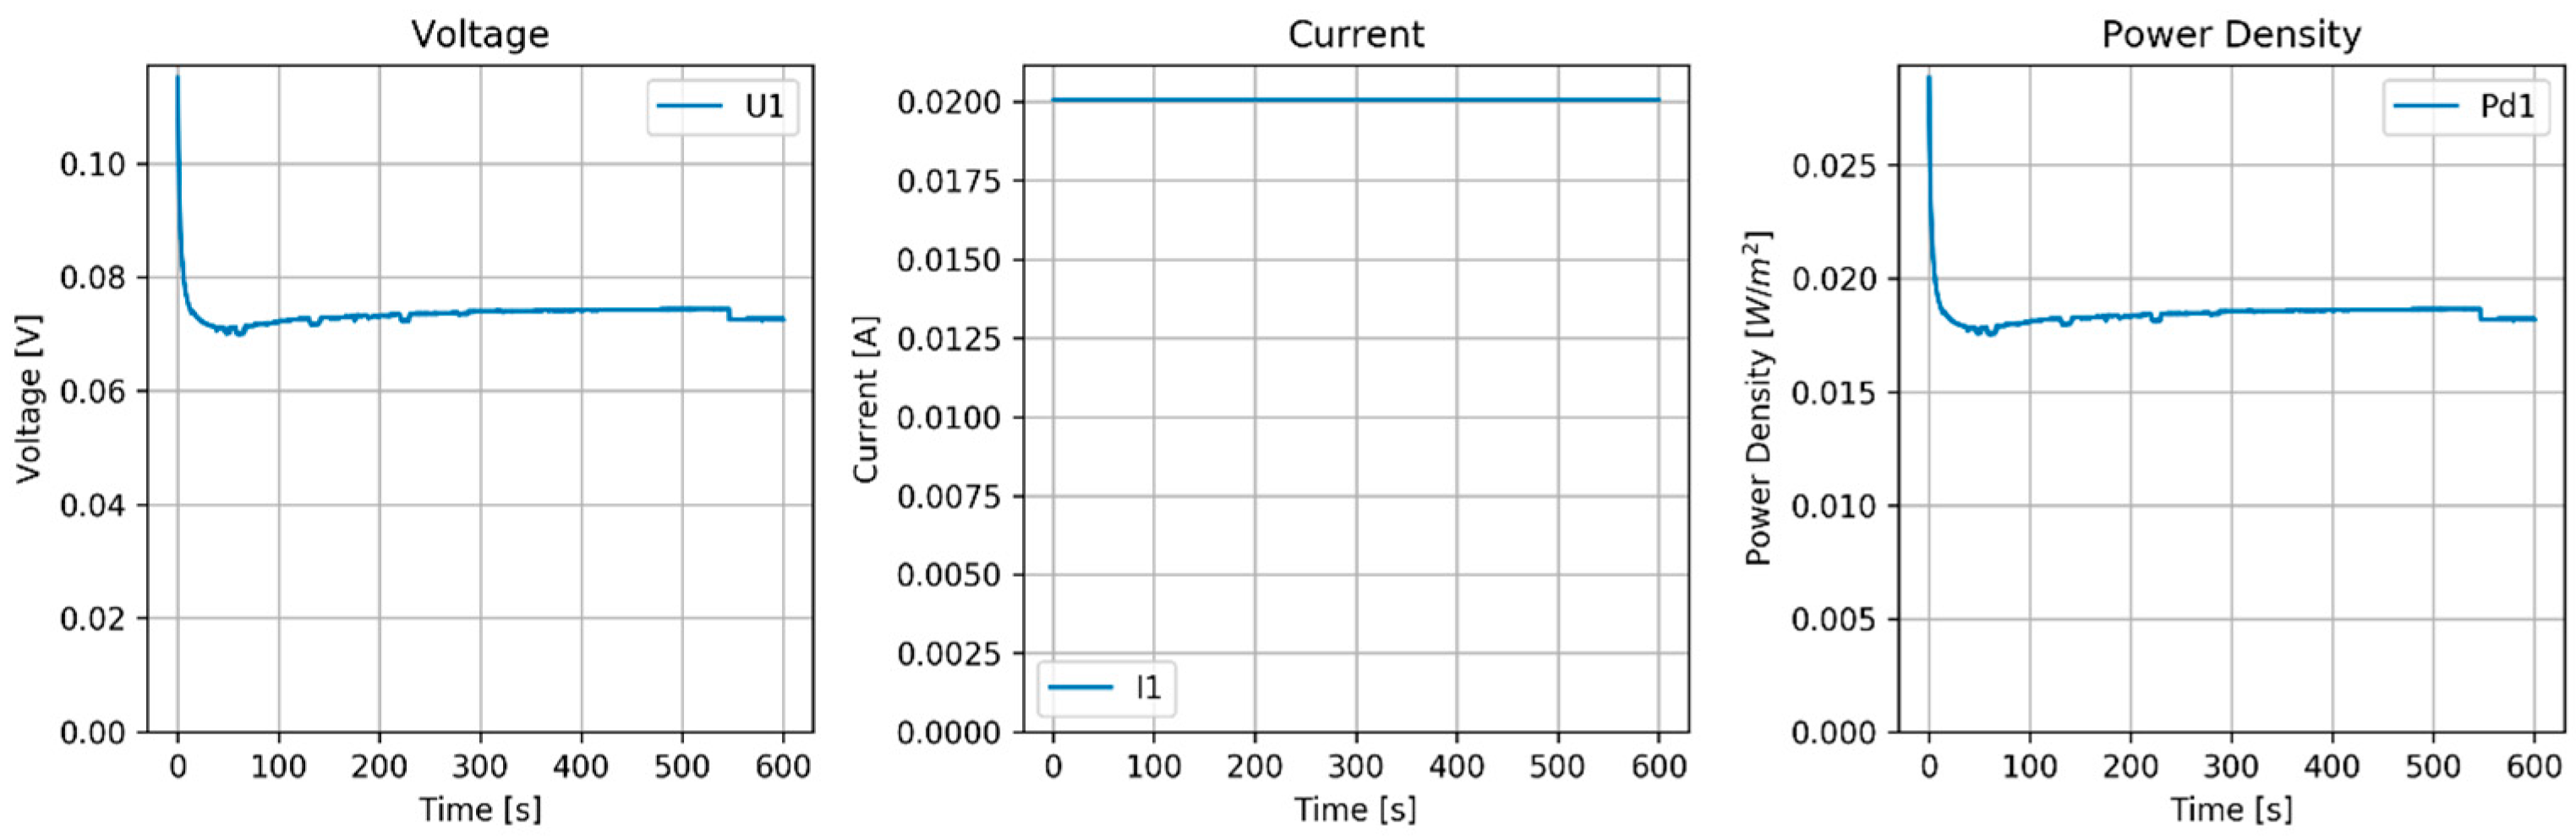
In this experiment, pure zinc plate was used. A stack was built with two Zn end electrodes and three Zn pseudo CEMs, and four Ag/AgCl pseudo-membranes between the Fe/Zn plates. Spacers were 500 μm woven fabric.
4.4.1. Preparation of the Ag/AgCl Electrodes
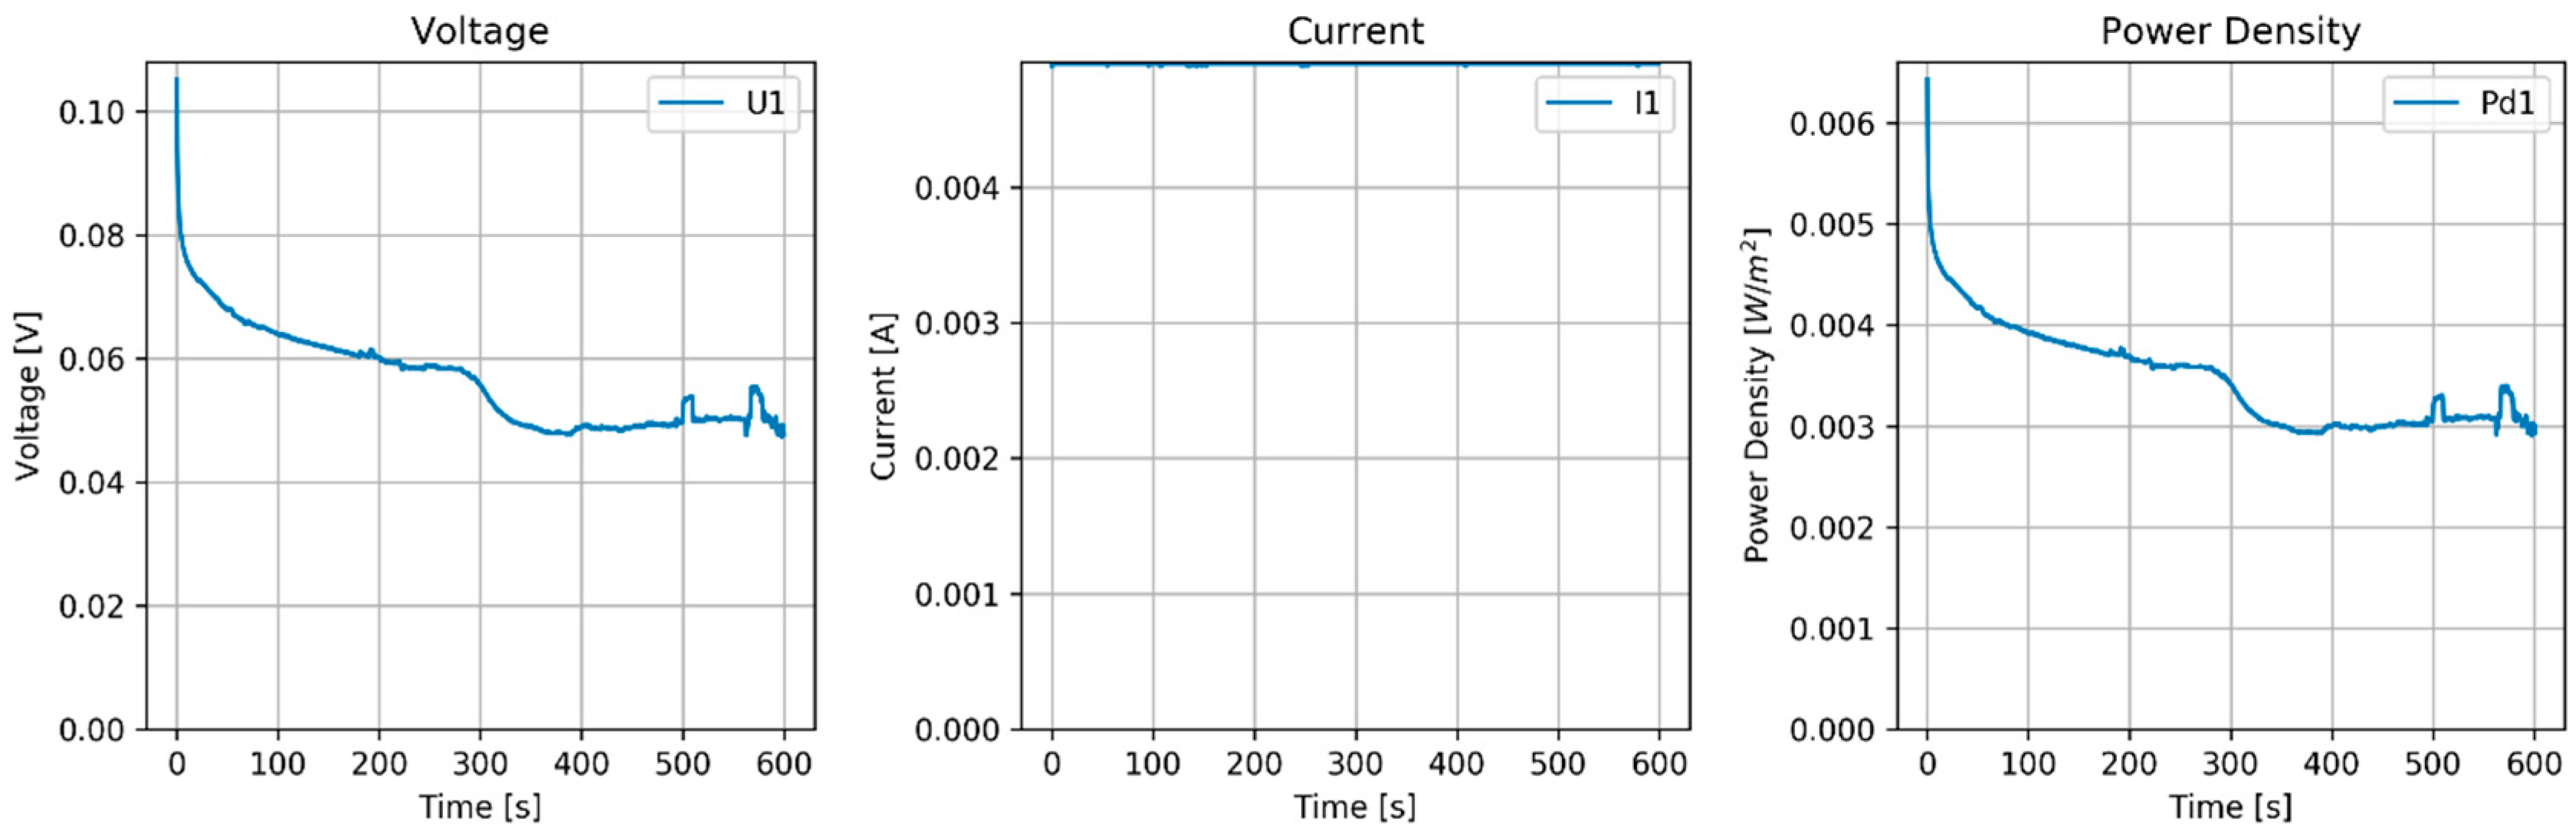
A bath of 300 g NaCl and 250 mL concentrated HCl in 10 L demi water was used, and a current of 0.2 A (4.8 A/m2) was applied for 30 min. Maximum voltage was set to 0.39 V. Figure 12 shows the U-t curves and Table 11 summarizes the properties of the regression lines of the first part below 0.39 V. The slope of the left part is comparable with the slope in former experiments with larger current density. The applied charge was estimated to be 4718 C/m2 or 0.049 mol/m2, a factor of 20 lower than those in the former experiments. The expected resistance is also the same factor less; we estimated about 23.5 Ω·cm2.
Remarkable is the low start voltage (0.120 V), much lower than the Nernst voltage of the cell (about 0.221 V). We expected a higher start voltage, composed of different effects on Ag/AgCl and the Ti-MMO electrodes. These include Nernst potential, overvoltage, effects of concentration polarization, and ohmic voltage drop in the solution.
4.4.2. RED Test
5. Conclusions
The principle of RED with pseudo ion exchange membranes has been proven in these preliminary experiments. For application to energy storage systems, ED experiments are also needed. However, the performance should be improved for real application to energy storage or heat-to-power conversion. Key factors are the resistance of the Ag/AgCl pseudo-membrane and the behavior of the zinc system. Furthermore, combining Zn pseudo-membranes with Ag/AgCl pseudo-membranes seems to be impossible.
6. Outlook
6.1. Improved pAEMs
The Ag/AgCl pAEM used for this experiment is too expensive for commercial applications. In fact, there are two ways to go:
First is to improve the membrane by covering a copper plate with a thin silver layer and then converting half of the silver in silver chloride. Moreover, it should be questioned if the presence of silver is necessary.
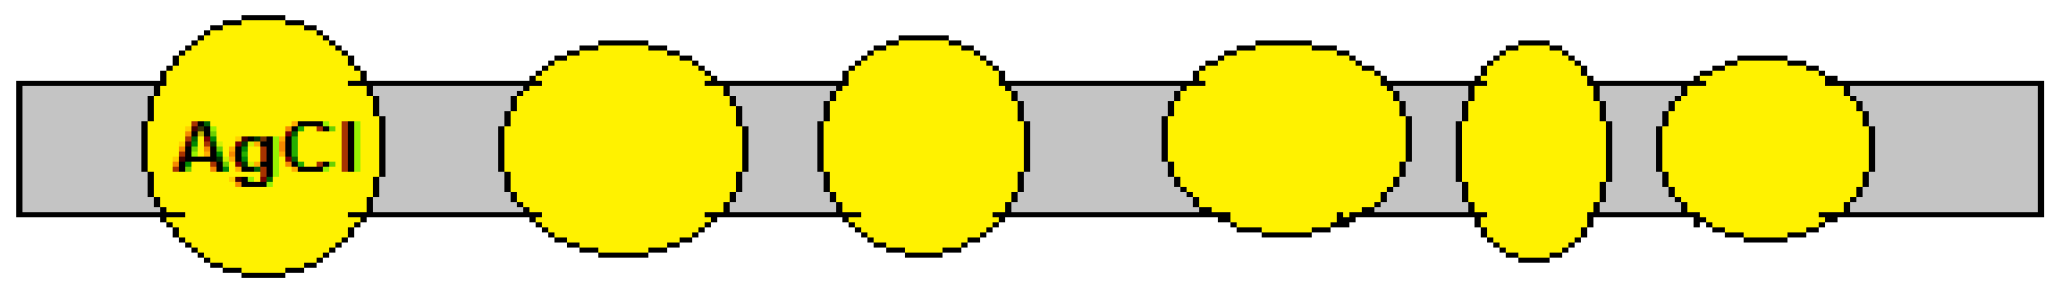
If silver can be omitted, grains of silver chloride can be embedded in a polymer foil, making sure that each grain is in contact with the water phase at each side (Figure 14). However, because there would now be transport of the chloride ion through the whole membrane, in this case it would be a pure AEM and not a pAEM, and we wonder if the good properties of a pIEM (high permselectivity and low water permeability) would be achieved.
If silver can be omitted, we could also construct a pure AgCl membrane in a porous support. A porous medium would be attached between two vessels, one filled with an AgNO3 solution and the other with a NaCl solution. In the pores, AgCl would be precipitated. Eventually (if necessary), a part of the AgCl could be reduced to metallic Ag by photolysis.
A second option to get around the high silver price is to apply Cu/CuCl pAEMs. Complications might be the high solubility of CuCl and unpredictable complications of the oxidation of Cu(I) in such a system (by air or other processes).
Feed water switch is essential when using pseudo-membranes. High switch frequency is advantageous for Ag/AgCl pAEMs because the AgCl layers can be thinner in that case. However, during switch, no charging or discharging activity is possible and this dead time should be as small as possible. This is a challenge for the stack designer: small internal volumes enable less dead time and thus high switch frequency.
6.2. Improved pCEMs
It could be that the zinc system with a large percentage of complexed zinc ions is the reason for the poor performance of the zinc pCEM. Another comparable system with less complexation might be nickel with nickel chloride.
From the fast-developing world of sodium batteries [31], some electrode materials seem suitable as a base for sodium-permeable pCEMs. Phosphates of Ti and Mn seem to be especially good candidates for such pCEMs [32]. Meanwhile, other materials are also capable of absorbing cations, commonly known as intercalation electrodes. As suggested for AgCl, deleting the metal support and using the pure intercalation material as membrane embedded in a polymer can also be tried.
6.3. Real Inorganic Ion Exchange Membranes
Much knowledge has been gained about inorganic ion exchange materials over the last 40 years [33]. Many of these materials are based on intercalation. These materials can be applied on each side of a metal substrate, and in this way, pseudo-membranes are constructed. However, it is worth investigating these materials without metal support, but imbedded in a polymer, such as the suggested AgCl membrane in Figure 14.
Author Contributions
J.V. developed the concepts, supervised the experiments and wrote and corrected the paper. He also reported the progress to the RED-Heat-to-Power community. D.K. built the different stacks, managed and edited the data. J.V. and D.K designed the experimental methodology, conducted the experiments and analysed the data and discussed the paper together.
Funding
This research was funded within the European Union’s Horizon 2020 research and innovation programme under grant agreement No. 640667.
Acknowledgments
This work was performed within the RED-Heat-to-Power project (Conversion of Low Grade Heat to Power through Closed-Loop Reverse Electrodialysis), Horizon 2020 program, project number: 640667; www.red-heat-to-power.eu. We thank Michel Saakes from Wetsus, European Centre of Excellence for Sustainable Water Technology (The Netherlands), for the fruitful discussions.
Conflicts of Interest
The authors declare no conflicts of interest.
Nomenclature
| E | electrode potential |
| E0 | standard reduction potential at 25 °C |
| F | Faraday constant (96,485 C/mol) |
| n | number of involved charges |
| R | gas constant (8.32432 J·mol−1K−1) |
| T | temperature (K) |
| Abbreviations | |
| AEM | anion exchange membrane |
| CEM | cation exchange membrane |
| ED | electrodialysis |
| H | high concentration stream |
| IEM | ion exchange membrane |
| L | low concentration stream |
| MD | membrane distillation |
| MMO | mixed metal oxide |
| MPPT | maximum power point tracking |
| pAEM | pseudo anion exchange membrane |
| pCEM | pseudo cation exchange membrane |
| pIEM | pseudo ion exchange membrane |
| RED | reverse electrodialysis |
References
- Veerman, J.; Vermaas, D. Reverse Electrodialysis: Fundamentals. In Sustainable Energy from Salinity Gradients; Elsevier: Amsterdam, The Netherlands, 2016; Chapter 4; pp. 77–133. [Google Scholar]
- Cipollina, A.; Micale, G.; Tamburini, A.; Tedesco, M.; Gurreri, L.; Veerman, J.; Grasman, S. Reverse electrodialysis: Applications. In Sustainable Energy from Salinity Gradients; Elsevier: Amsterdam, The Netherlands, 2016; Chapter 5; pp. 135–180. [Google Scholar]
- Tufa, R.A.; Chanda, D.; Tundis, L.; Hnát, J.; Bouzek, K.; Veerman, J.; Fontananova, E.; Di Profio, G.; Curcio, E. Salinity gradient power driven electrolysis for hydrogen production. Chem. Eng. Trans. 2017, 60, 283–288. [Google Scholar]
- Tufa, R.A.; Rugiero, E.; Chanda, D.; Hnàt, J.; van Baak, W.; Veerman, J.; Fontananova, E.; Di Profio, G.; Drioli, E.; Bouzek, K.; et al. Salinity gradient power-reverse electrodialysis and alkaline polymer electrolyte water electrolysis for hydrogen production. J. Membr. Sci. 2016, 514, 155–164. [Google Scholar] [CrossRef]
- Aqua Battery. Available online: http://aquabattery.nl/ (accessed on 19 October 2018).
- Van Egmond, W.J.; Saakes, M.; Porada, S.; Meuwissen, T.; Buisman, C.J.N.; Hamelers, H.V.M. The concentration gradient flow battery as electricity storage system: Technology potential and energy dissipation. J. Power Source 2016, 325, 129–139. [Google Scholar] [CrossRef]
- Tamburini, A.; Cipollina, A.; Papapetrou, M.; Piacentino, A.; Micale, G. Salinity gradient engines. In Sustainable Energy from Salinity Gradients; Elsevier: Amsterdam, The Netherlands, 2016; Chapter 7; pp. 219–252. [Google Scholar]
- Electricity from Low-Grade Heat. Available online: http://www.RED-heat-to-power.eu (accessed on 19 October 2018).
- Quandl. Available online: https://www.quandl.com/collections/markets/metals (accessed on 16 May 2016).
- WHO’s Drinking Water Standards 1993. Available online: http://www.lenntech.com/applications/drinking/standards/who-s-drinking-water-standards.htm (accessed on 19 October 2018).
- Ars-Chemia—The Art of Chemistry. Available online: http://www.ars-chemia.net/Permanent_Files/Tables/Solubility_Product_Constant.pdf (accessed on 16 May 2016).
- University of Missouri. Available online: http://web.missouri.edu/~puckettj/ChemistryTablesfolder/StandardReductionPotentials298K.pdf (accessed on 16 May 2016).
- La Mantia, F.; Pasta, M.; Deshazer, H.D.; Logan, B.E.; Cui, Y. Batteries for Efficient Energy Extraction from a Water Salinity Difference. Nano Lett. 2011, 11, 1810–1813. [Google Scholar] [CrossRef] [PubMed]
- Ye, M.; Pasta, M.; Xie, X.; Cui, Y.; Criddle, C.S. Performance of a mixing entropy battery alternately flushed with wastewater effluent and seawater for recovery of salinity-gradient energy. Energy Environ. Sci. 2014, 7, 2295–2300. [Google Scholar] [CrossRef]
- Xiong, P.; Ma, R.; Sakai, N.; Bai, X.; Li, S.; Sasaki, T. Redox Active Cation Intercalation/Deintercalation in Two-Dimensional Layered MnO2 Nanostructures for High-Rate Electrochemical Energy Storage. ACS Appl. Mater. Interfaces 2017, 9, 6282–6291. [Google Scholar] [CrossRef] [PubMed]
- Hamid, N.A.; Wennig, S.; Hardt, S.; Heinzel, A.; Schulz, C.; Wiggers, H. High-capacity cathodes for lithium-ion batteries from nanostructured LiFePO4 synthesized by highly-flexible and scalable flame spray pyrolysis. J. Power Source 2012, 216, 76–83. [Google Scholar] [CrossRef]
- Ramana, C.V.; Mauger, A.; Gendron, F.; Julien, C.M.; Zaghib, K. Study of the Li-insertion/extraction process in LiFePO4/FePO4. J. Power Source 2009, 187, 555–564. [Google Scholar] [CrossRef]
- Gupta, V.; Gupta, S.; Miura, N. Potentiostatically deposited nanostructured CoxNi1−x layered double hydroxides as electrode materials for redox-supercapacitors. J. Power Source 2008, 175, 680–685. [Google Scholar] [CrossRef]
- Lv, L.; He, J.; Wei, M.; Evans, D.G.; Duan, X. Uptake of chloride ion from aqueous solution by calcined layered double hydroxides: Equilibrium and kinetic studies. Water Res. 2006, 40, 735–743. [Google Scholar] [CrossRef] [PubMed]
- Beck, F.; Krohn, H. Reversible electrochemical intercalation of anions from aqueous solutions in polymer bound graphite electrodes. Synthetic Met. 1983, 7, 193–199. [Google Scholar] [CrossRef]
- Fritz, J. Thermodynamic properties of chloro-complexes of silver chloride in aquous solution. J. Solut. Chem. 1985, 14, 865–879. [Google Scholar] [CrossRef]
- Periodic-Table-Of-Elements. Available online: http://periodic-table-of-elements.org/SOLUBILITY (accessed on 19 October 2018).
- Scialdone, O.; Albanese, A.; D’Angelo, A.; Galia, A.; Guarisco, C. Investigation of electrode material—Redox couple systems for reverse electrodialysis processes. Part II: Experiments in a stack with 10–50 cell pairs. J. Electroanal. Chem. 2013, 704, 1–9. [Google Scholar] [CrossRef]
- Scialdone, O.; Guarisco, C.; Grispo, S.; D’Angelo, A.; Galia, A. Investigation of electrode material—Redox couple systems for reverse electrodialysis processes. Part I: Iron redox couples. J. Electroanal. Chem. 2012, 681, 66–75. [Google Scholar] [CrossRef]
- Tedesco, M.; Cipollina, A.; Tamburini, A.; Micale, G. Towards 1 kW power production in a reverse electrodialysis pilot plant with saline waters and concentrated brines. J. Membr. Sci. 2017, 522, 226–236. [Google Scholar] [CrossRef]
- Tedesco, M.; Scalici, C.; Vaccari, D.; Cipollina, A.; Tamburini, A.; Micale, G. Performance of the first reverse electrodialysis pilot plant for power production from saline waters and concentrated brines. J. Membr. Sci. 2016, 500, 33–45. [Google Scholar] [CrossRef] [Green Version]
- Veerman, J.; Saakes, M.; Metz, S.J.; Harmsen, G.J. Reverse Electrodialysis: Evaluation of suitable electrode systems. J. Appl. Electrochem. 2010, 40, 1461–1474. [Google Scholar] [CrossRef]
- Długołȩcki, P.; Nymeijer, K.; Metz, S.; Wessling, M. Current status of ion exchange membranes for power generation from salinity gradients. J. Membr. Sci. 2008, 319, 214–222. [Google Scholar] [CrossRef]
- Veerman, J.; Post, J.; Saakes, M.; Metz, S.; Harmsen, G. Reducing power losses caused by ionic shortcut currents in reverse electrodialysis stacks by a validated model. J. Membr. Sci. 2008, 310, 418–430. [Google Scholar] [CrossRef] [Green Version]
- Janz, G.; Ives, D. Silver, silver chloride electrodes. An. N. Y. Acad. Sci. 1968, 148, 210–221. [Google Scholar] [CrossRef]
- Li, W.-J. Investigation on the Promising Electrode Materials for Rechargeable Sodium Ion Batteries. Ph.D. Thesis, University of Wollongong, Wollongong, Australia, 2015. Available online: http://ro.uow.edu.au/theses/4603 (accessed on 19 October 2018).
- Wu, W.; Shabhag, S.; Chang, J.; Rutt, A.; Whitacrea, J. Relating Electrolyte Concentration to Performance and Stability for NaTi2(PO4)3/Na0.44MnO2 Aqueous Sodium-Ion Batteries. J. Electrochem. Soc. 2015, 162, A803–A808. [Google Scholar] [CrossRef]
- Clearfield, A. Inorganic Ion Materials; CRC Press: Boca Raton, FL, USA, 1982. [Google Scholar]
Figure 1.
Concept of a reverse electrodialysis (RED) stack equipped with inorganic pseudo-membranes. AEM, anion exchange membrane; CEM, cation exchange membrane.
Figure 1.
Concept of a reverse electrodialysis (RED) stack equipped with inorganic pseudo-membranes. AEM, anion exchange membrane; CEM, cation exchange membrane.

Figure 2.
The four tested stacks: stack A (a); stack B (b); stack C (c) and stack D (d). Feed water solutions are indicated by A and B.
Figure 2.
The four tested stacks: stack A (a); stack B (b); stack C (c) and stack D (d). Feed water solutions are indicated by A and B.

Figure 3.
Anodizing potential of four silver plates; regression lines of 2 and 3 coincide.

Figure 4.
Results of maximum power point tracking (MPPT) test of the RED stack equipped with normal CEMs (CMX) and pseudo AEMs (Ag/AgCl).
Figure 4.
Results of maximum power point tracking (MPPT) test of the RED stack equipped with normal CEMs (CMX) and pseudo AEMs (Ag/AgCl).

Figure 5.
Results of constant current of the RED stack equipped with normal CEMs (CMX) and pseudo AEMs (Ag/AgCl).
Figure 5.
Results of constant current of the RED stack equipped with normal CEMs (CMX) and pseudo AEMs (Ag/AgCl).

Figure 6.
Results of the MPPT test of the RED stack equipped with normal AEMs (AMX) and pseudo CEMs (Zn).
Figure 6.
Results of the MPPT test of the RED stack equipped with normal AEMs (AMX) and pseudo CEMs (Zn).

Figure 7.
Results of the constant current (20 mA) test of the RED stack equipped with normal AEMs (AMX) and pseudo CEMs (Zn).
Figure 7.
Results of the constant current (20 mA) test of the RED stack equipped with normal AEMs (AMX) and pseudo CEMs (Zn).

Figure 8.
Anodizing potential of four silver plates; regression lines of 3 and 4 coincide.

Figure 9.
Results of MPPT test of the RED stack equipped with pseudo AEMs (Ag/AgCl) and pseudo CEMs (Zn). Flow rate (H and L) is 60 mL/min.
Figure 9.
Results of MPPT test of the RED stack equipped with pseudo AEMs (Ag/AgCl) and pseudo CEMs (Zn). Flow rate (H and L) is 60 mL/min.

Figure 10.
Results of MPPT test of the RED stack equipped with pseudo AEMs (Ag/AgCl) and pseudo CEMs (Zn). Flow rate (H and L) is 120 mL/min.
Figure 10.
Results of MPPT test of the RED stack equipped with pseudo AEMs (Ag/AgCl) and pseudo CEMs (Zn). Flow rate (H and L) is 120 mL/min.

Figure 11.
Results of MPPT test of the RED stack equipped with pseudo AEMs (Ag/AgCl) and pseudo CEMs (Zn). Flow rate (H and L) is 60 mL/min.
Figure 11.
Results of MPPT test of the RED stack equipped with pseudo AEMs (Ag/AgCl) and pseudo CEMs (Zn). Flow rate (H and L) is 60 mL/min.

Figure 12.
Anodizing potential of four silver plates.

Figure 13.
Results of MPPT test of the RED stack equipped with pseudo AEMs (Ag/AgCl) and pseudo CEMs (Zn). Flow rate (H and L) is 60 mL/min.
Figure 13.
Results of MPPT test of the RED stack equipped with pseudo AEMs (Ag/AgCl) and pseudo CEMs (Zn). Flow rate (H and L) is 60 mL/min.

Figure 14.
An inorganic AgCl anion exchange membrane based on AgCl grains in a polymer matrix.


| Metal | Price ($/kg) | Drinking Water Standard (μg/L) |
|---|---|---|
| Ni | 8.43 | 20 |
| Cu | 4.58 | 2000 |
| Zn | 1.68 | 3000 |
| Ag | 461 | 10 |
| Pb | 1.77 | 10 |
| Sn | 17.70 | - |
Table 2.
Solubility product of salts at 25 °C [11].
Table 2.
Solubility product of salts at 25 °C [11].
| Lsp at 25 °C | Ag+ | Cu+ | Pb2+ |
|---|---|---|---|
| Cl− | 1.8 × 10⁻¹⁰ | 1.7 × 10⁻⁷ | 1.2 × 10⁻⁵ |
| Br− | 5.4 × 10⁻¹³ | 6.3 × 10⁻⁹ | 6.6 × 10⁻⁶ |
| I− | 8.5 × 10⁻¹⁷ | 1.1 × 10⁻¹² | 8.5 × 10⁻⁹ |
Table 3.
Standard reduction potentials of some half-reactions [12].
Table 3.
Standard reduction potentials of some half-reactions [12].
| Half-Reaction | E0red (V) |
|---|---|
| Ag+ + e → Ag(s) | 0.80 |
| Cu+ + e → Cu(s) | 0.52 |
| Cu2+ + 2 e → Cu(s) | 0.34 |
| AgCl(s) + e → Ag(s) + Cl− | 0.22 |
| Cu2+ + e → Cu+ | 0.15 |
| CuCl(s) + e → Cu + Cl− | 0.14 |
| AgBr(s) + e → Ag(s) + Br− | 0.10 |
| Pb2+ + 2 e → Pb(s) | −0.13 |
| Sn2+ + 2 e → Sn(s) | −0.14 |
| CuI(s) + e → Cu(s) + I− | −0.19 |
| Ni2+ + 2 e → Ni(s) | −0.28 |
| Zn2+ + 2 e → Zn(s) | −0.76 |
| Mg2+ + 2 e → Mg(s) | −2.26 |
Table 4.
Solubility of AgCl in NaCl solutions at 25 °C [21].
Table 4.
Solubility of AgCl in NaCl solutions at 25 °C [21].
| Host Solution | Solubility of AgCl | Percentage Present in Solution | ||||
|---|---|---|---|---|---|---|
| NaCl (mol/L) | (mmol/L) | Ag+ | AgCl | AgCl2− | AgCl32− | AgCl43− |
| 0.1 | 0.003 | <1% | <1% | 10% | 80% | 10% |
| 2 | 0.42 | <1% | <1% | 10% | 70% | 20% |
Table 5.
Suggested systems, based on pseudo ion exchange membranes. The table shows 3 pCEMs (pseudo cation exchange membranes) in the columns and 7 pAEMs (pseudo anion exchange membrane) in the rows. On each intersection, the applicable salt and its solubility in g/100 g H2O at 20 °C are listed [22].
| Salt | pCEM | |||||
|---|---|---|---|---|---|---|
| solubility in g/100g H2O at 20 °C | MnO2 | FePO4 | PBA (Prussian Blue Analogue) | |||
| pAEM | Ag/AgCl or Cu/CuCl | NaCl 36 | LiCl 83 | KCl 34 | NaCl 36 | LiCl 83 |
| Ag/AgBr or Cu/CuBr | NaBr 91 | LiBr 160 | KBr 65 | NaBr 91 | LiBr 160 | |
| Ag/AgI or Cu/CuI | NaI 179 | LiI 165 | KI 145 | NaI 179 | LiI 165 | |
| Pb/PbSO4 | Na2SO4 19 | Li2SO4 35 | K2SO4 11 | Na2SO4 19 | Li2SO4 35 | |
Table 6.
Properties of the anodizing regression lines from Figure 3.
Table 6.
Properties of the anodizing regression lines from Figure 3.
| y = ax + b | |||
|---|---|---|---|
| No. | a | b | R2 |
| 1 | 0.119 | 0.282 | 0.990 |
| 2 | 0.062 | 1.545 | 0.987 |
| 3 | 0.064 | 1.516 | 0.990 |
| 4 | 0.097 | 0.731 | 0.951 |
| mean | 0.086 | 1.018 | |
Table 7.
OCV (Open Circuit Voltage) of the stack before each MPPT run.
| Run | OCV (V) |
|---|---|
| 1 | 0.528 |
| 2 | 0.412 |
| 3 | 0.569 |
| 4 | 0.431 |
| 5 | 0.567 |
| mean | 0.503 |
Table 8.
OCV of the stack before each constant current run.
| Run | OCV (V) |
|---|---|
| 1 | 0.434 |
| 2 | 0.575 |
| 3 | 0.407 |
| mean | 0.472 |
Table 9.
OCV of the stack before each MPPT run.
| Run | OCV (V) |
|---|---|
| 1 | 0.166 |
| 2 | 0.185 |
| 3 | 0.250 |
| 4 | 0.253 |
| mean | 0.214 |
Table 10.
Properties of the anodizing regression lines from Figure 8.
Table 10.
Properties of the anodizing regression lines from Figure 8.
| y = ax + b | |||
|---|---|---|---|
| No. | a | b | R2 |
| 1 | 0.076 | 0.922 | 0.999 |
| 2 | 0.076 | 0.592 | 0.996 |
| 3 | 0.088 | 0.376 | 0.955 |
| 4 | 0.085 | 0.369 | 0.997 |
| mean | 0.081 | 0.565 | |
Table 11.
Properties of the anodizing regression lines from Figure 12.
Table 11.
Properties of the anodizing regression lines from Figure 12.
| y = ax + b | |||
|---|---|---|---|
| No. | a | b | R2 |
| 1 | 0.060 | 0.142 | 0.944 |
| 2 | 0.100 | 0.127 | 0.997 |
| 3 | 0.069 | 0.109 | 0.997 |
| 4 | 0.076 | 0.101 | 0.986 |
| mean | 0.076 | 0.120 | |
Table 12.
OCV of the stack before each MPPT run.
| Run | OCV |
|---|---|
| 1 | 0.178 |
| 2 | 0.244 |
| 3 | 0.270 |
| 4 | 0.268 |
| 5 | 0.284 |
© 2018 by the authors. Licensee MDPI, Basel, Switzerland. This article is an open access article distributed under the terms and conditions of the Creative Commons Attribution (CC BY) license (http://creativecommons.org/licenses/by/4.0/).
Share and Cite
MDPI and ACS Style
Veerman, J.; Kunteng, D. Inorganic Pseudo Ion Exchange Membranes—Concepts and Preliminary Experiments. Appl. Sci. 2018, 8, 2142. https://doi.org/10.3390/app8112142
AMA Style
Veerman J, Kunteng D. Inorganic Pseudo Ion Exchange Membranes—Concepts and Preliminary Experiments. Applied Sciences. 2018; 8(11):2142. https://doi.org/10.3390/app8112142
Chicago/Turabian StyleVeerman, Joost, and Damnearn Kunteng. 2018. "Inorganic Pseudo Ion Exchange Membranes—Concepts and Preliminary Experiments" Applied Sciences 8, no. 11: 2142. https://doi.org/10.3390/app8112142
Note that from the first issue of 2016, this journal uses article numbers instead of page numbers. See further details here.