Characterization of Maple and Ash Material Properties for the Finite Element Modeling of Wood Baseball Bats

1
Baseball Research Center, Mechanical Engineering, University of Massachusetts Lowell, 1 University Avenue, Lowell, MA 01854, USA
2
U.S. Forest Products Laboratory, US Forest Service, 1 Gifford Pinchot Drive, Madison, WI 53726, USA
*
Author to whom correspondence should be addressed.
Appl. Sci. 2018, 8(11), 2256; https://doi.org/10.3390/app8112256
Submission received: 1 May 2018
/
Revised: 5 November 2018
/
Accepted: 7 November 2018
/
Published: 15 November 2018
(This article belongs to the Special Issue Sports Materials)
Abstract
:To assist in developing a database of wood material properties for the finite element modeling of wood baseball bats, Charpy impact testing at strain rates comparable to those that a wood bat experiences during a bat/ball collision is completed to characterize the failure energy and strain-to-failure as a function of density and slope-of-grain (SoG) for northern white ash (Fraxinus americana) and sugar maple (Acer saccharum). Un-notched Charpy test specimens made from billets of ash and maple that span the range of densities and SoGs that are approved for making professional baseball bats are impacted on either the edge grain or face grain. High-speed video is used to capture each test event and image analysis techniques are used to determine the strain-to-failure for each test. Strain-to-failure as a function of density relations are derived and these relations are used to calculate inputs to the *MAT_WOOD (Material Model 143) and *MAT_EROSION material options in LS-DYNA for the subsequent finite element modeling of the ash and maple Charpy Impact tests and for a maple bat/ball impact. The Charpy test data show that the strain-to-failure increases with increasing density for maple but the strain-to-failure remains essentially constant over the range of densities considered in this study for ash. The flat response of the ash data suggests that ash-bat durability is less sensitive to wood density than maple-bat durability. The available SoG results suggest that density has a greater effect on the impact failure properties of the wood than SoG. However, once the wood begins to fracture, SoG plays a large role in the direction of crack propagation of the wood, thereby determining if the shape of the pieces breaking away from the bat are fairly blunt or spear-like. The finite element modeling results for the Charpy and bat/ball impacts show good correlation with the experimental data.
1. Introduction
In 2008, Major League Baseball (MLB) commissioned a team of experts comprised of wood scientists and bat performance test engineers to investigate options for reducing the rate of bats breaking during games. While there were no data to support if there was or was not an increasing rate of bats breaking into multiple pieces during games, there was a perception of an increased breaking rate by the league and by fans. The perceived rise in bat breakage rates coincided with the increase in popularity of the maple wood species as a bat preference amongst players in MLB. Historically, the ash wood species was the wood of choice for players in MLB up until the entry of maple bats in the game in the late 1990s. Maple became the trendy choice after Barry Bonds’ historic 2001 season in which he set a MLB single-season record of 73 homeruns using a maple bat.
To develop a baseline on the rate of bat breakage, MLB completed a two-and-a-half-month collection of broken bats in August 2008. The lessons learned from this and subsequent wood bat collections led to new requirements in the WBBS (Wooden Baseball Bat Specifications), specifically ash bats continue to be impacted on the edge grain, maple bats change to be impacted on the face grain and the slope-of-grain (SoG) of the wood used to manufacture baseball bats to be within ±3° of the centerline of the bat longitudinal axis.
To complement the wood bat collections, research efforts were conducted to investigate how finite element modeling can aid in explaining how bat profile and wood quality relate to bat durability [1]. Previous research studies conducted on metal, composite and wood baseball bats utilizing the finite element method have been demonstrated to be an effective way of analyzing the effect of high-speed impact on the bat after impact with the baseball occurs [2,3,4,5]. These finite element models have been found to be valuable tools for providing insight into the mechanical response of wood baseball bats over a range of impact speeds [6]. However, the description of the material properties to date has been limited to what can be extracted from quasistatic four-point bend testing of dowels and from the Wood Handbook [7]. These quasistatic test programs were completed at the USDA (United States Department of Agriculture) Forest Product Labs (FPL) and have documented the Modulus of Elasticity (MOE) and Modulus of Rupture (MOR) for ash, maple and yellow birch as a function of wood density [8]. To further improve the level of correlation between these finite element models and lab-simulated bat/ball impacts, the material behavior for these wood species must also be characterized at strain rates comparable to those experienced during game-condition bat/ball collisions.
In the current research, Charpy Impact testing of ash and maple was completed to characterize the high strain-rate behavior of these wood species. To date the documented research on the dynamic behavior of wood during impact is fairly limited [9,10] compared to other engineering materials. By following the testing methodologies that were used by the Federal Highway Administration (FHWA) [11] to characterize southern yellow pine and applying them to maple and ash, the current high-speed testing characterized the material behavior of these wood species further than is currently available. Once characterized, the resulting material properties can be prescribed in the *MAT_WOOD (Material Model 143) and *MAT_EROSION material models in LS-DYNA for use in finite element analyses of bat/ball impacts. In addition to the mechanical testing data from the FPL and the Charpy programs, past test data for maple and ash bats in the ADC Bat Durability Testing System that are available at the UMass Lowell Baseball Research Center (UMLBRC) [1,12] along with properties taken from the Wood Handbook [7] were utilized to further refine wood properties. With a level of confidence in the material parameter inputs established, the finite element modeling can be used to support scientifically defensible arguments for proposing future changes to wood bat specifications aimed at reducing bat breakage rates. In some cases, these changes can be essentially transparent to players as to what they have come to expect in bat feel and performance.
This paper describes the Charpy test program that was used to characterize the strain-to-failure of ash and maple wood specimens under dynamic loading and the subsequent finite element modeling using the material parameters derived from the test program. Finite element modeling of the Charpy tests is performed to show that the models are capable of replicating the tests from which the material parameters were derived. With a good level of comfort established for the ability of the finite element models to simulate a Charpy impact tests, the modeling approach is shown to be applicable to simulating the mechanical behavior of wood bats to ball impacts.
2. Materials and Methods
Quasistatic and dynamic material testing was conducted to characterize the material behavior of maple and ash. Four-point bend testing of wood dowels was conducted at the FPL in 2009 to quantify the relationship between wood density and the MOE (Modulus of Elasticity) and wood density and the MOR (Modulus of Rupture). In the current research, Charpy Impact testing was conducted to characterize wood behavior during dynamic impact to investigate the relationship between wood density and strain-to-failure.
2.1. Existing Test Data
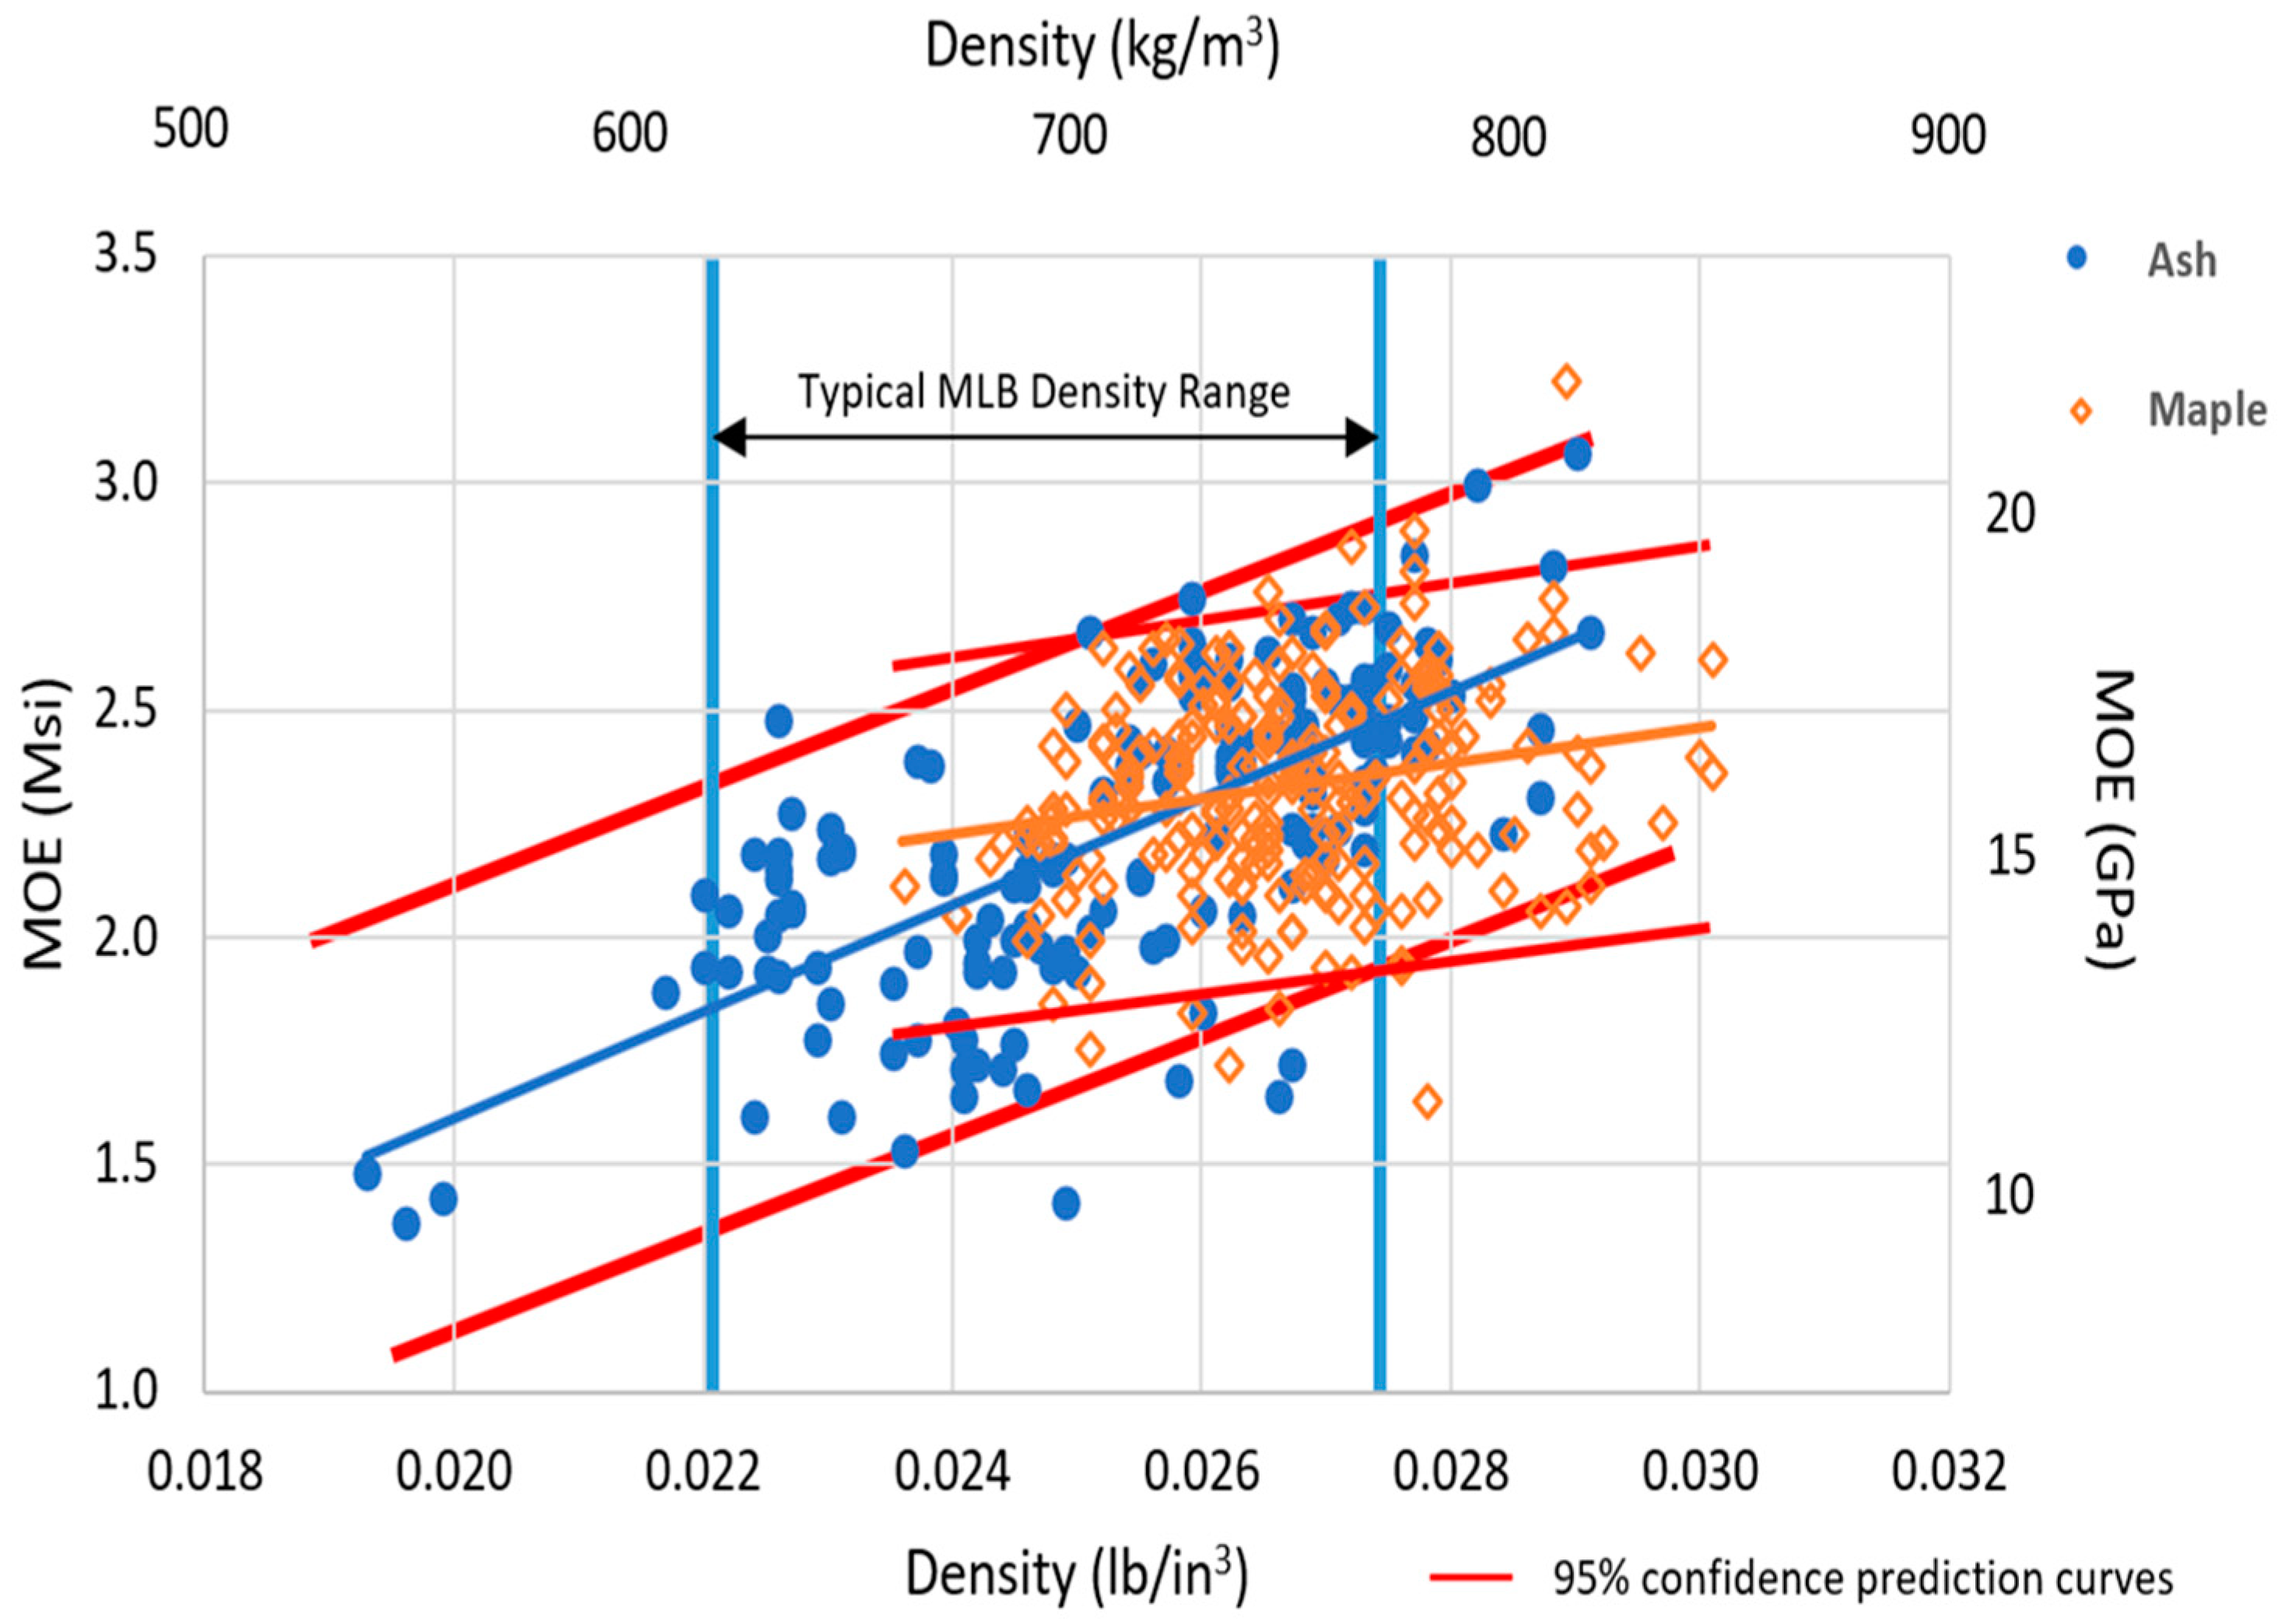
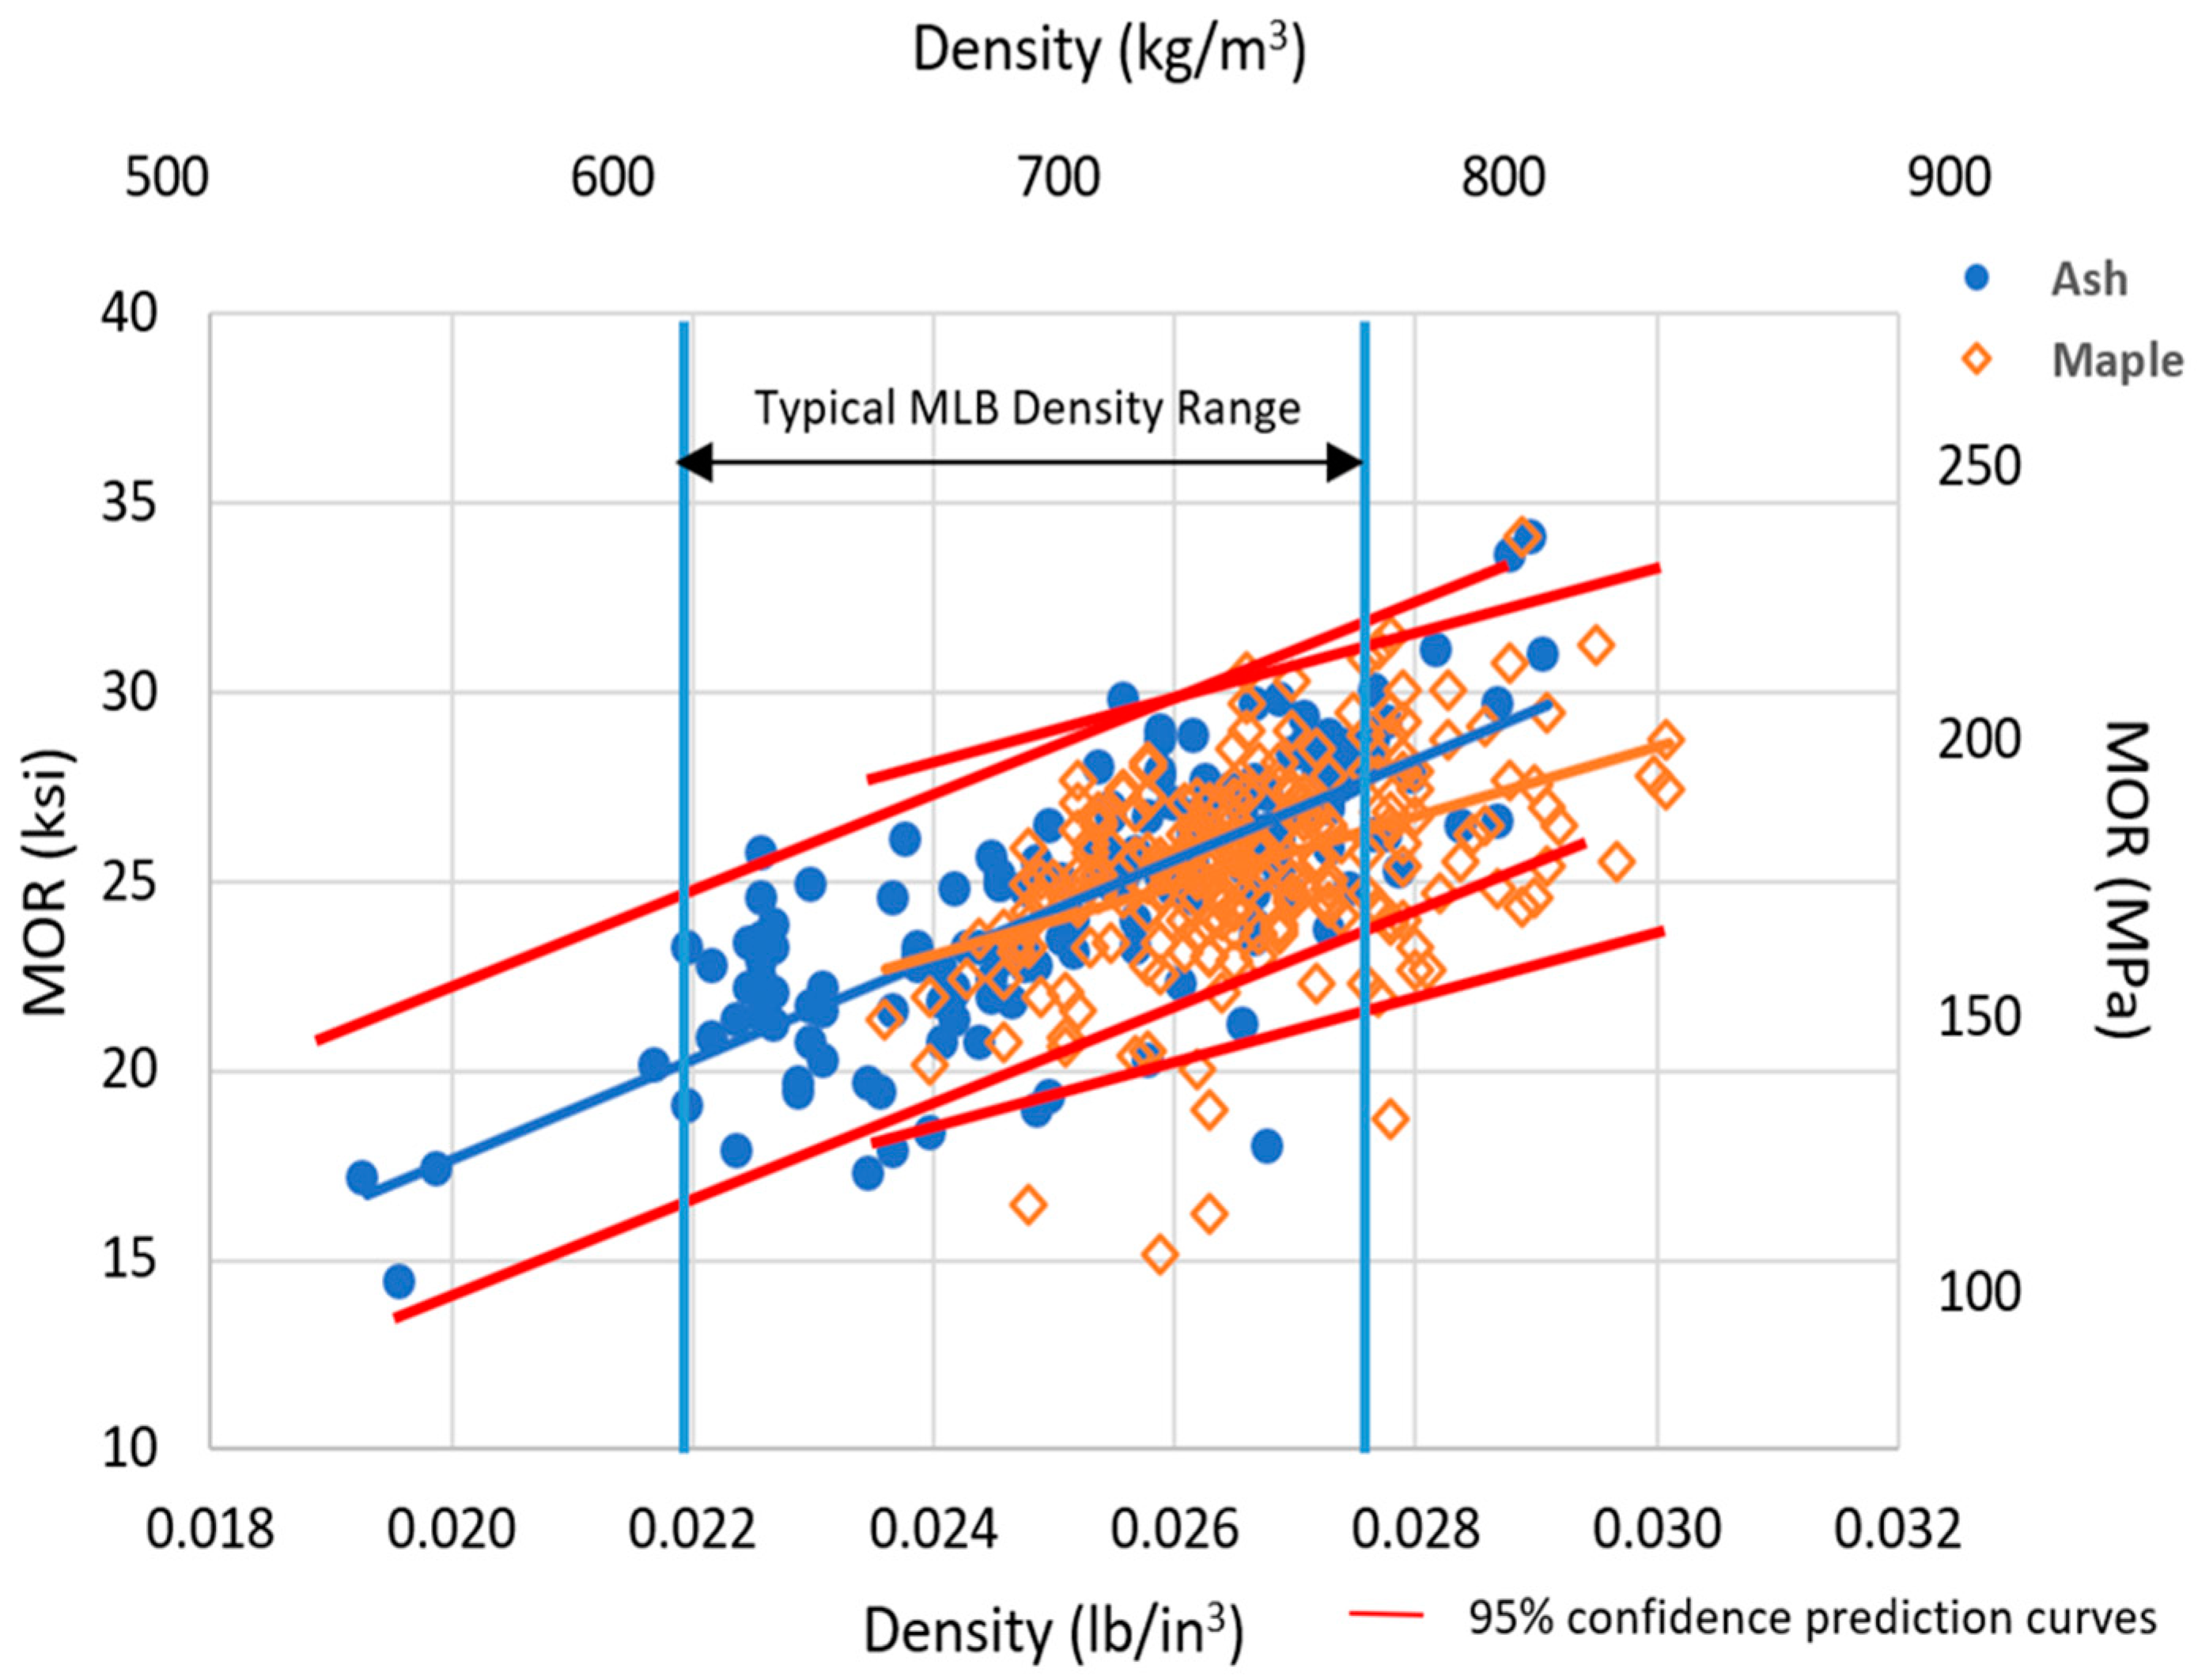
In 2009, quasistatic four-point bend testing of ash and maple dowels was completed at the FPL in Madison, WI [8]. These test data quantified how the MOE and MOR vary as a function of density for ash and maple. The density range tested for each wood species corresponded to the range of densities that are used to manufacture MLB-quality baseball bats. Figure 1 and Figure 2 show MOE-density and MOR-density results, respectively, for the ash and maple dowels. These dowels had slope-of-grain (SoG) angles between ±3°, which is the current range of SoGs that are allowed for the manufacture of the baseball bats used by major-league players. A 0° SoG is when the direction of the wood grain is aligned with the axis of the bat. Figure 1 and Figure 2 show how the MOE and MOR, respectively, of each of the wood species increases with increasing density. These test data reflect the wide scatter in material properties that are typical for wood. A linear regression on each set of data was completed. The resulting equations are:
where is the density in lb/in3.
2.2. Dynamic High-Rate Material Testing
Wood is a viscoelastic material and as a result, its strain-to-failure is a function of strain rate. For quantifying the strain-to-failure as a function of strain rate, the Charpy Impact test was used for all dynamic wood testing. The Charpy Impact is a test that can be conducted at the strain rates that are representative of what ash and maple experience during bat/ball impacts. The range of strain rates that occur during a collision have not been measured directly but an estimate of the strain rates ranging from 101–104 s−1 during such a collision have been concluded from what has been seen in preliminary finite element analyses of bat/ball impacts using LS-DYNA.
A standard Charpy test involves the use of a pendulum swinging a hammer to impact a specimen of known geometry [13]. The height that the pendulum reaches at the end of the swing following the breaking of the test sample is recorded and this height is used to determine the energy that was required to break the test specimen. This energy is the only direct output of the Charpy test. Thus, additional complementary analyses must be completed to quantify the strain rate that was experienced by the test specimen. A Redlake HG100k high-speed camera in conjunction with Motion Studio camera software was set up to record each sample’s impact and subsequent breakage using a frame rate of 30,000 frames/s at a resolution of 160 pixels wide by 168 pixels high. The captured high-speed video facilitated the complementary analysis to quantify the strain rate experienced by the wood specimens during each test event.
2.3. Sample Preparation
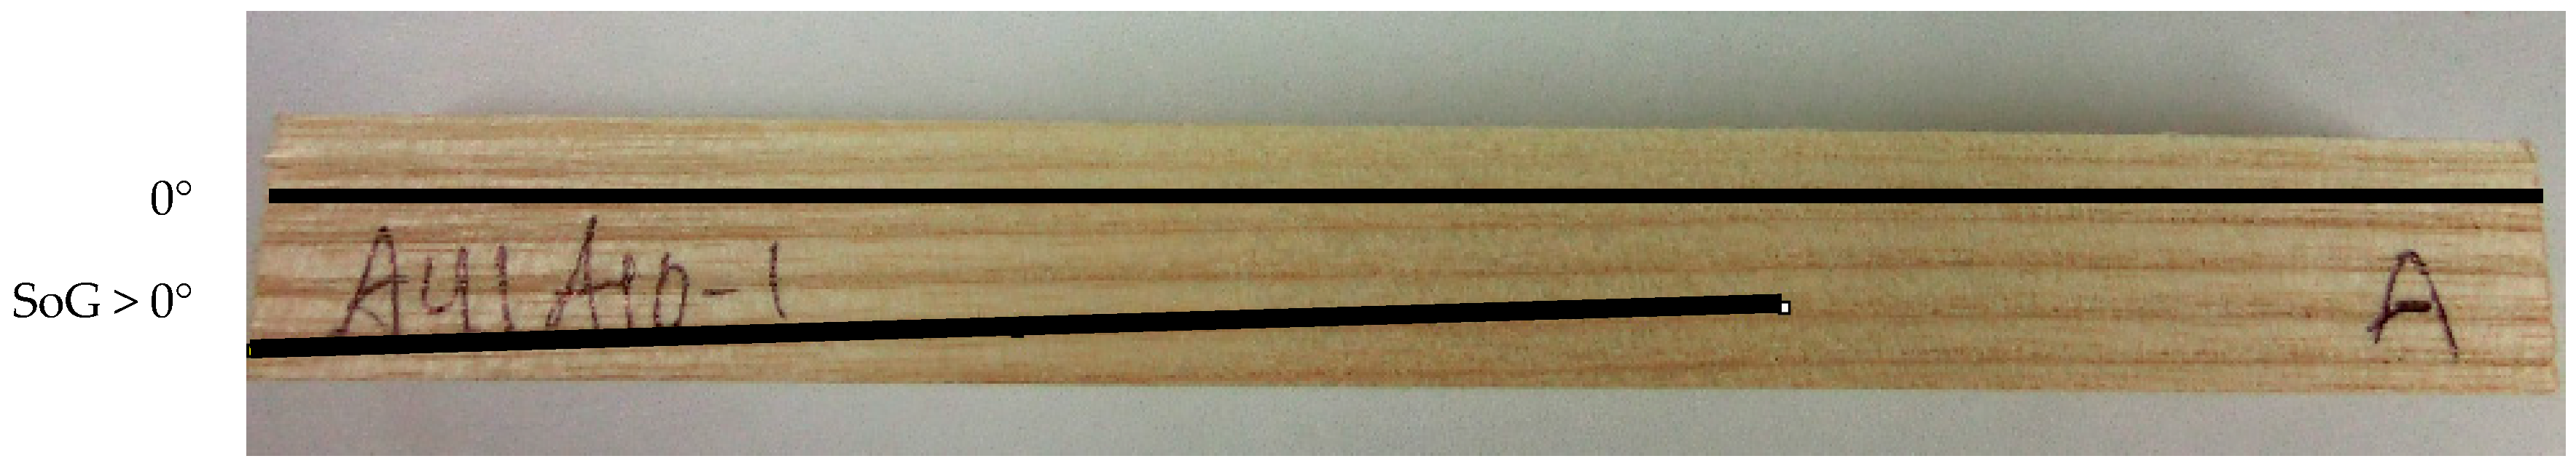
Charpy test specimens were made from blocks of ash and maple that spanned the range of densities from 0.022–0.029 lb/in3 (608.9–747.4 kg/m3). This range is representative of the span of wood densities that are approved for making professional baseball bats. Wood samples were cut to a square cross-section geometry within the dimensions as specified by ASTM Standard D6110-10 Standard Test Method for Determining the Charpy Impact Resistance of Notched Specimens of Plastics, that is, 5.0 × 0.5 × 0.5 in. (12.7 × 1.27 × 1.27 cm) (length × width × thickness) [13]. For this testing, samples were un-notched for the purpose of determining the strain required to initiate fracture of the solid wood geometry, which is similar to a baseball bat in that a bat would not be used if cracked or notched, during a standard Charpy test. Utilizing ImageJ software, the edge (radial) and face (tangential) SoGs were measured for each sample [14]. Figure 3 shows an example of the grain line used to measure SoG on the samples within ~0.2°. Samples were conditioned for a minimum of 14 days in 50 ± 10% relative humidity and 72 ± 2 °F (22 ± 1 °C) before doing any testing. This same conditioning is what is used before testing wood baseball bats at the UMLBRC.
2.4. Test Procedure
The Charpy Impact test measures the resistance of a material to breakage by the flexural shock that is induced by a pendulum of specified weight to break a test specimen with a single swing [13]. The output of the test is the energy required to break a specimen of a prescribed size. Samples were impacted with a 10.0 ft-lb (13.6 N-m) hammer on the edge grain and face grain (1) to investigate the differences between edge-grain versus face-grain impacts within each wood species and (2) to conclude a strain-to-failure as a function of wood density for each wood species.
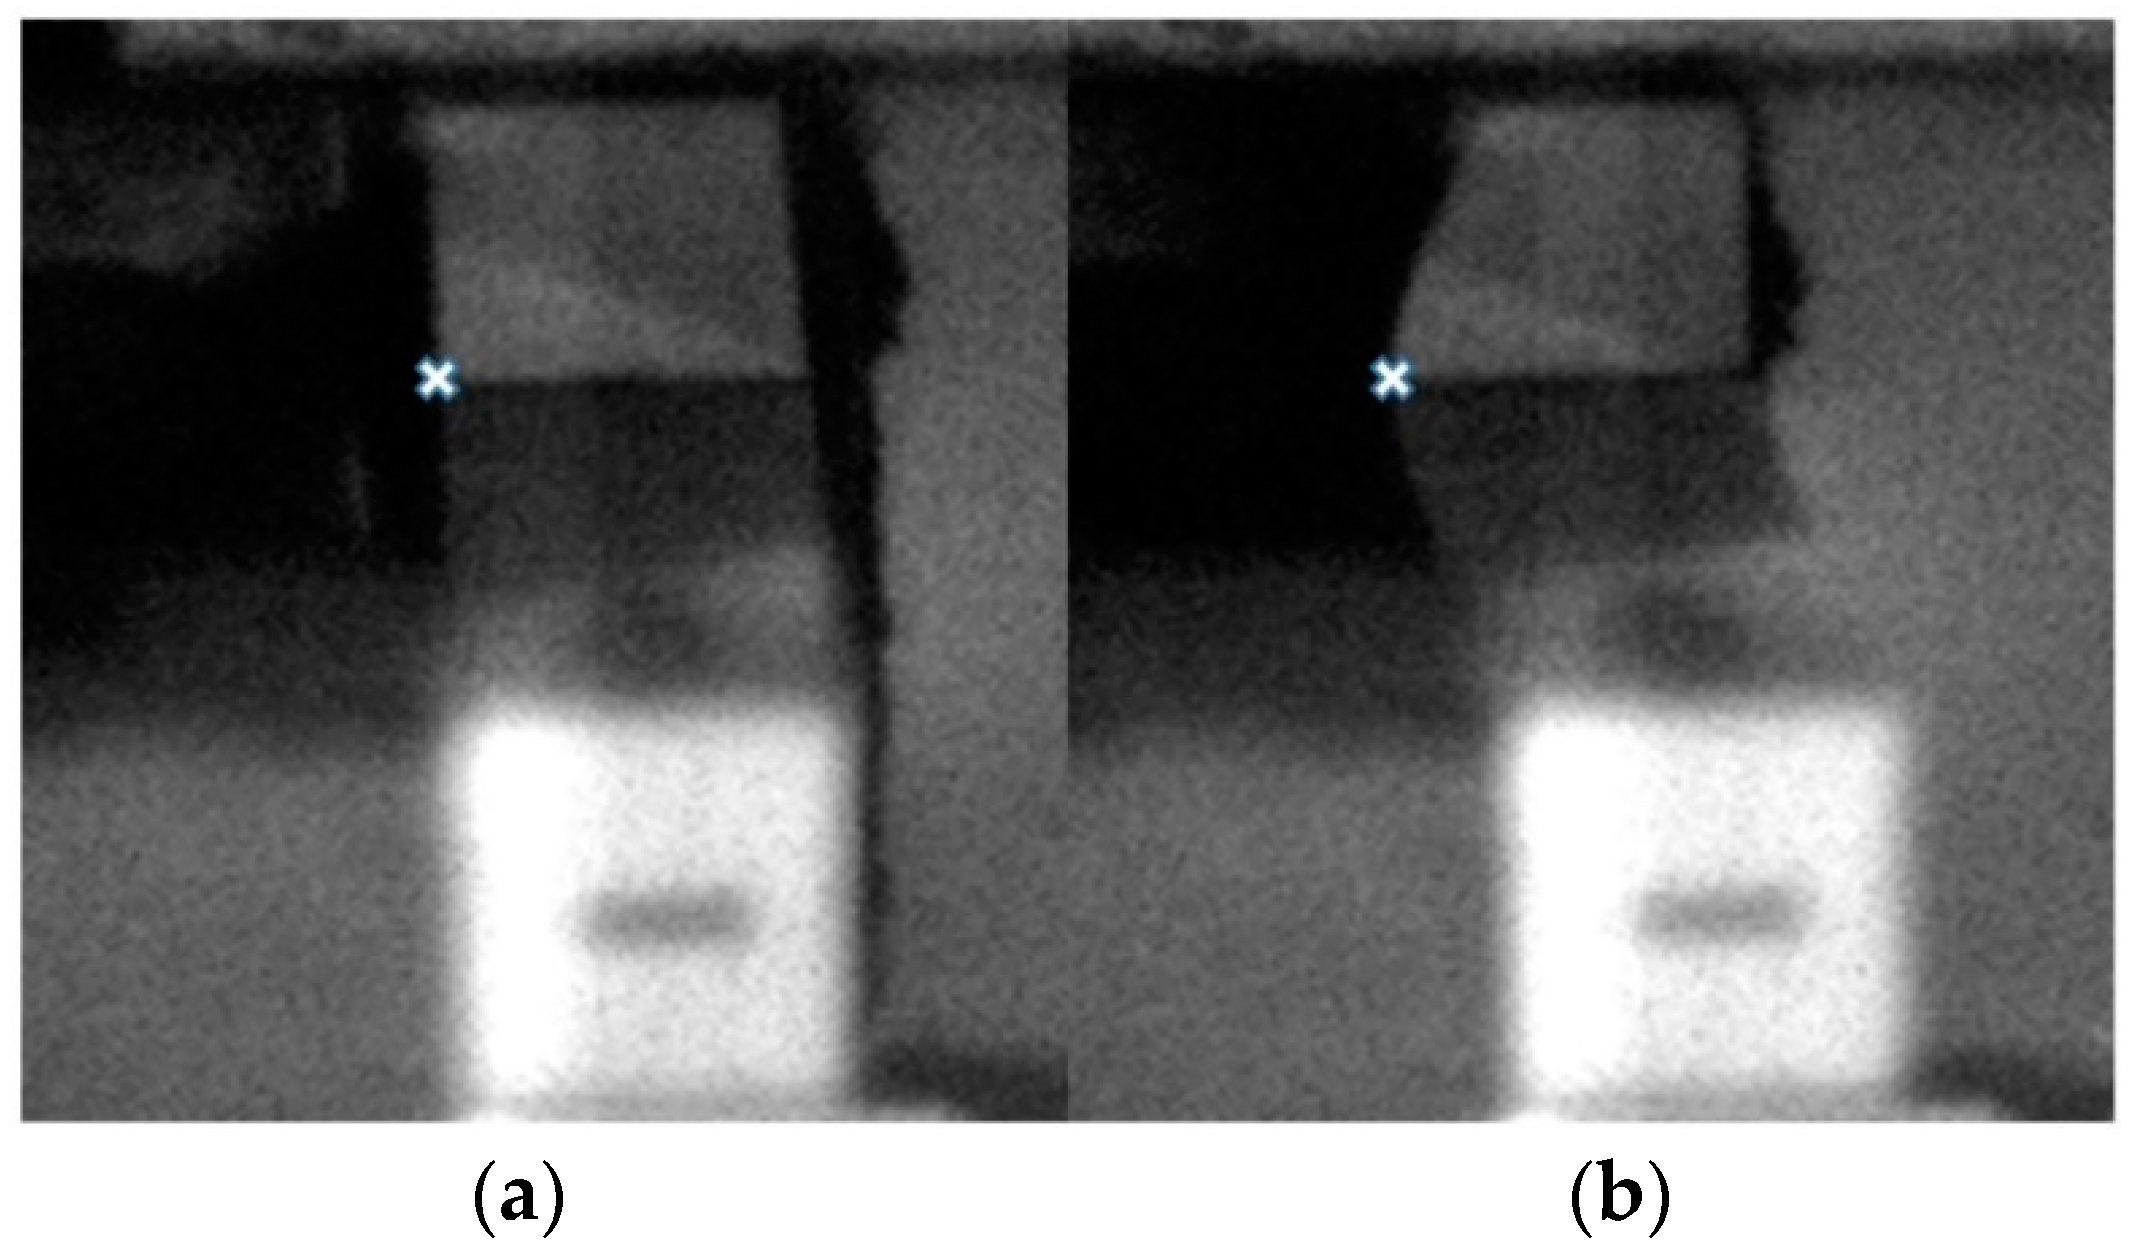
The information collected from the Charpy test included (1) the energy required to break the sample and (2) the high-speed video. The break energy of each sample was directly read from the dial of the Charpy impact tester. The break energy indicates the loss of energy of the pendulum to fracture the sample. ImageJ was used to examine the high-speed video and to quantify the maximum deflection of the sample just before breaking. The process for measuring this maximum deflection was first to identify the position of a point on the non-impact side of the sample before impact and then to locate the same point directly before failure occurs. An example of this process is presented in Figure 4 with the image on the left being the starting position of the point and the image on the right showing the same point directly before failure occurs. It should be noted that this method is imperfect and some degree of measurement error could be included within the individual measurements, thus the average result of the entire sample set and one standard deviation is reported. Using the standard deflection equation for three-point bending in beam theory, the strain-to-failure can be estimated using Equation (5),
where L is the effective length of specimen between the supports, is the max deflection and y is the half-thickness.
3. Results
The overall mean of the results of the Charpy testing is presented in Table 1. The results show that maple exhibited a lower failure energy, a lower maximum-deflection and a lower strain-to-failure for both edge- and face-grain loadings relative to ash. Maple exhibited a higher failure energy when loaded in the face-grain direction compared to edge-grain loading. This higher failure energy for face-grain impacts was expected because maple is known to exhibit better durability (higher relative bat/ball impact breaking speed) when impacted on the face grain compared to bat/ball impacts on the edge grain [15]. Ash performed better overall than maple with a greater deflection at breaking and hence, a greater strain-to-failure when impacted on the edge grain, than maple when impacted on either the edge or the face grain. Ash exhibited superior failure energy when impacted on the face grain. From a strain-to-failure perspective, the ash samples performed better when impacted in edge-grain loading, which is consistent with the preferred impact surface of ash bats due to flaking of the wood cells inherent to repeated face-grain impacts.
3.1. Density
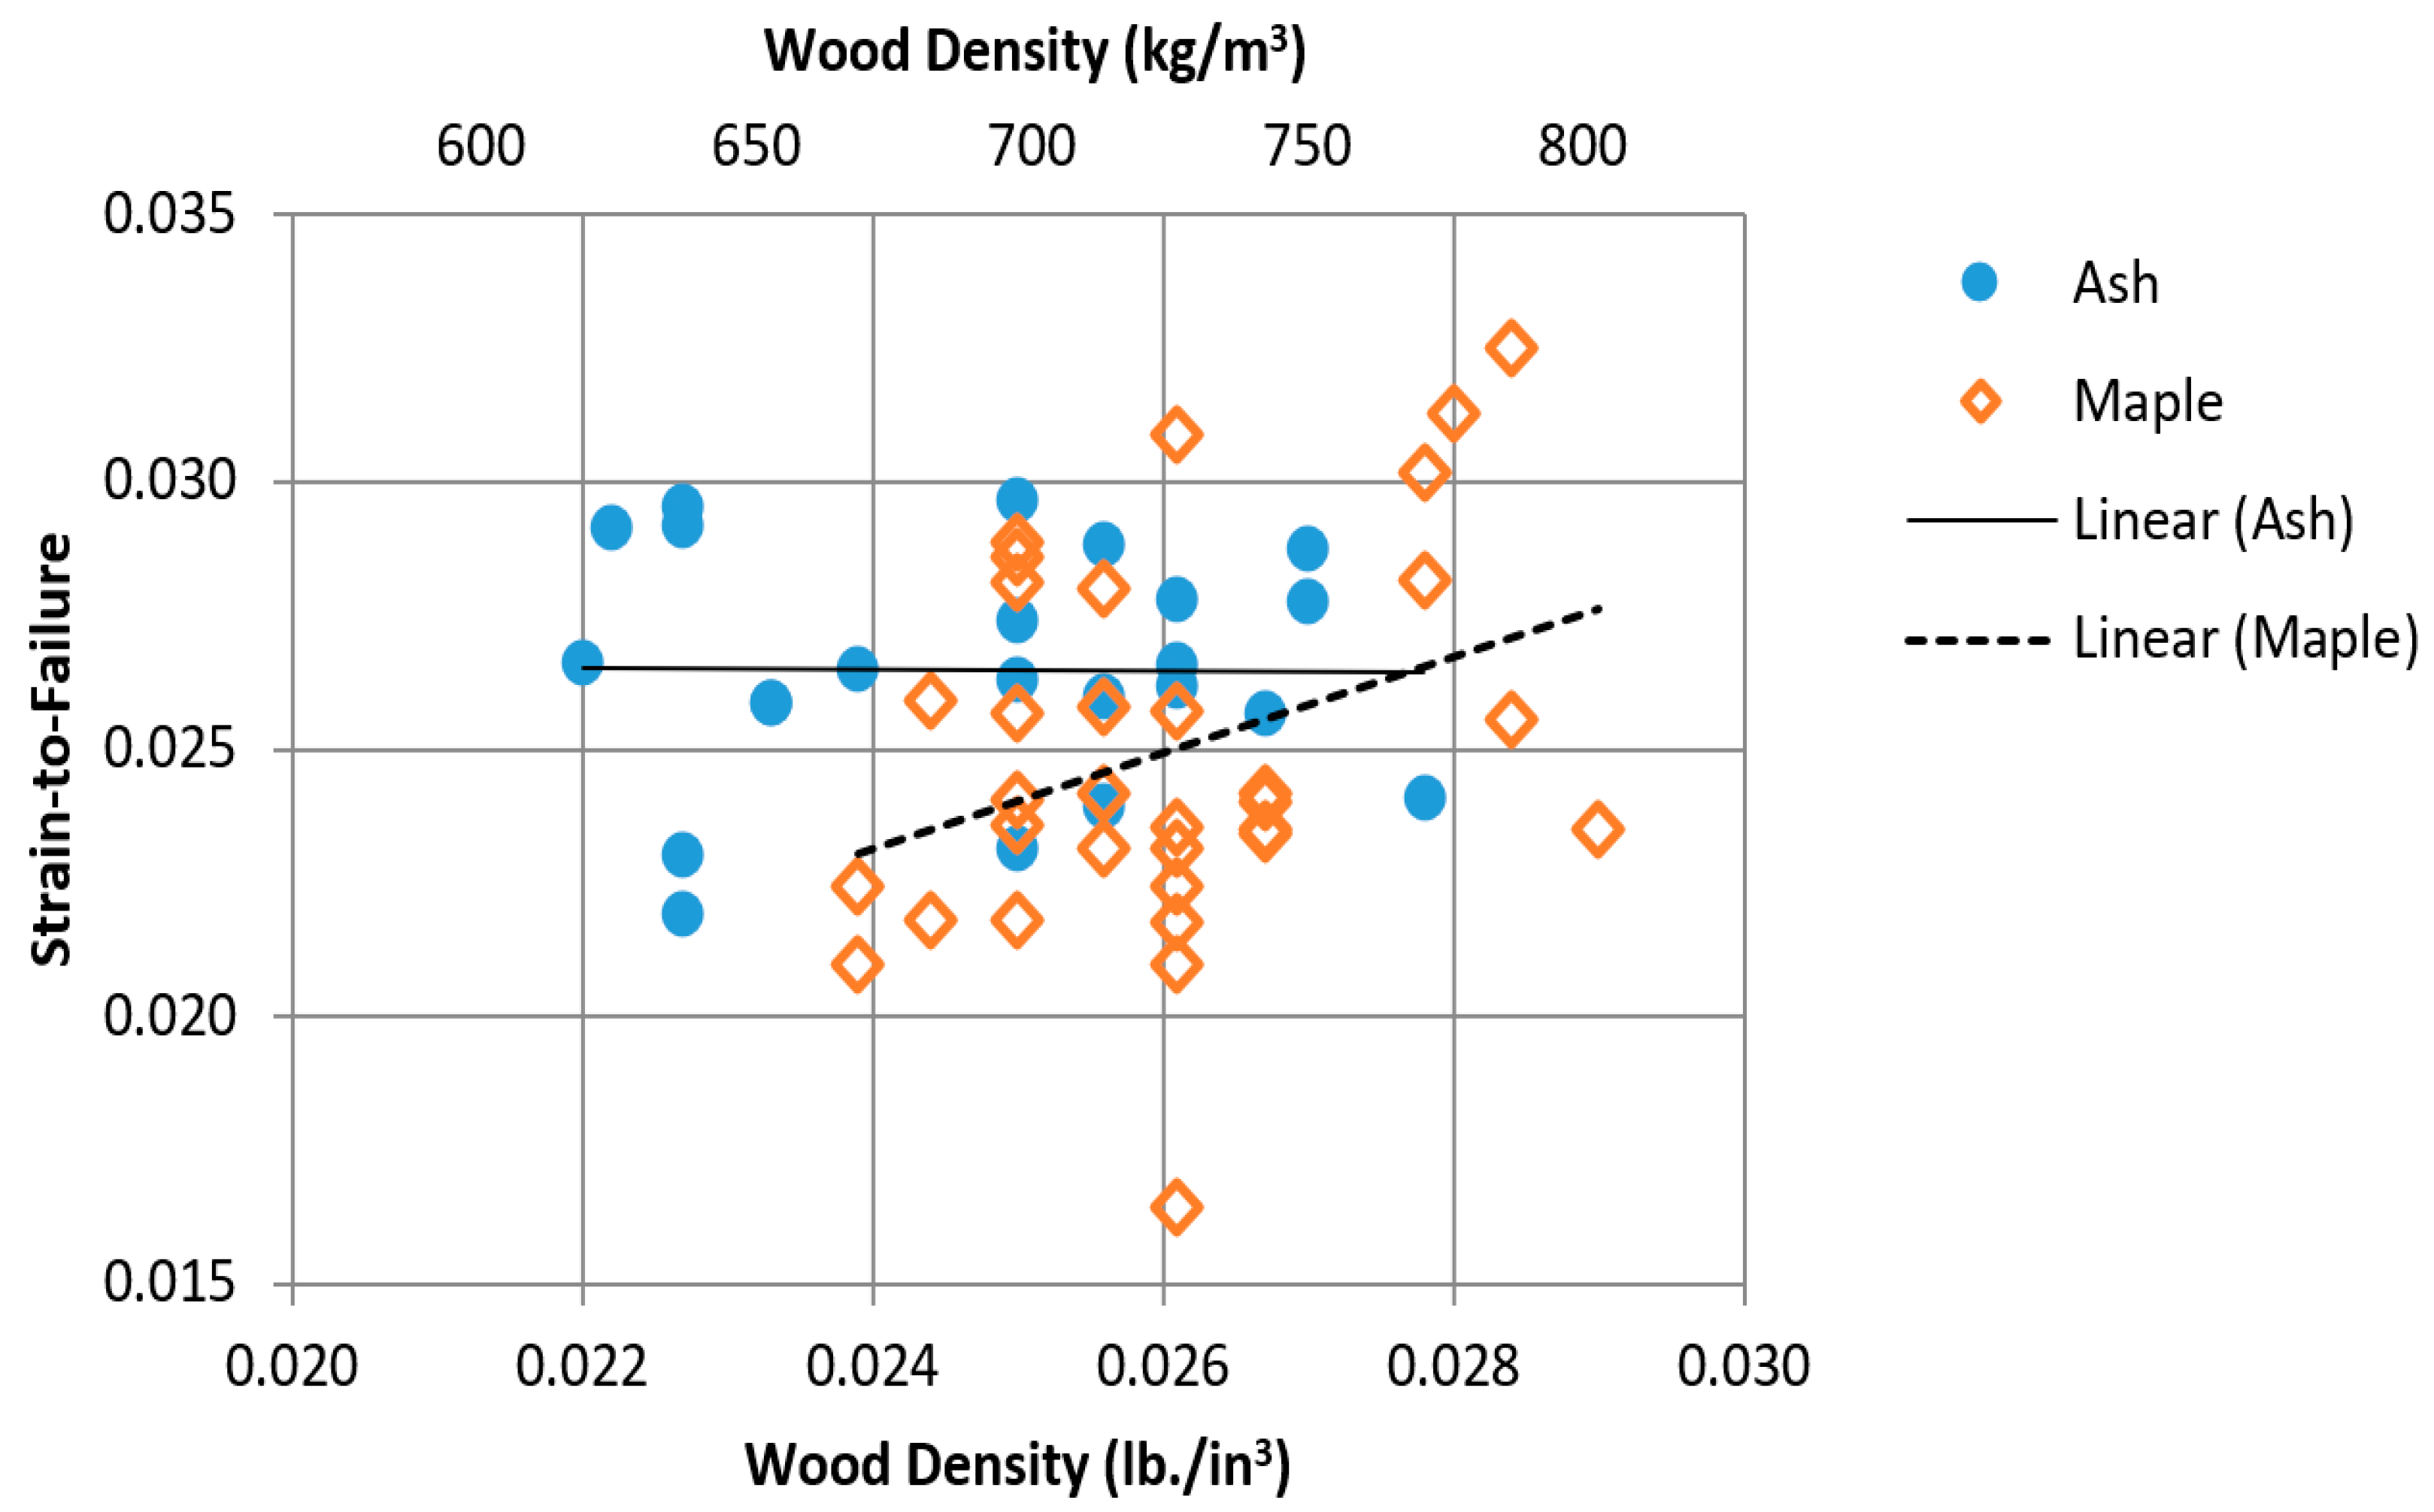
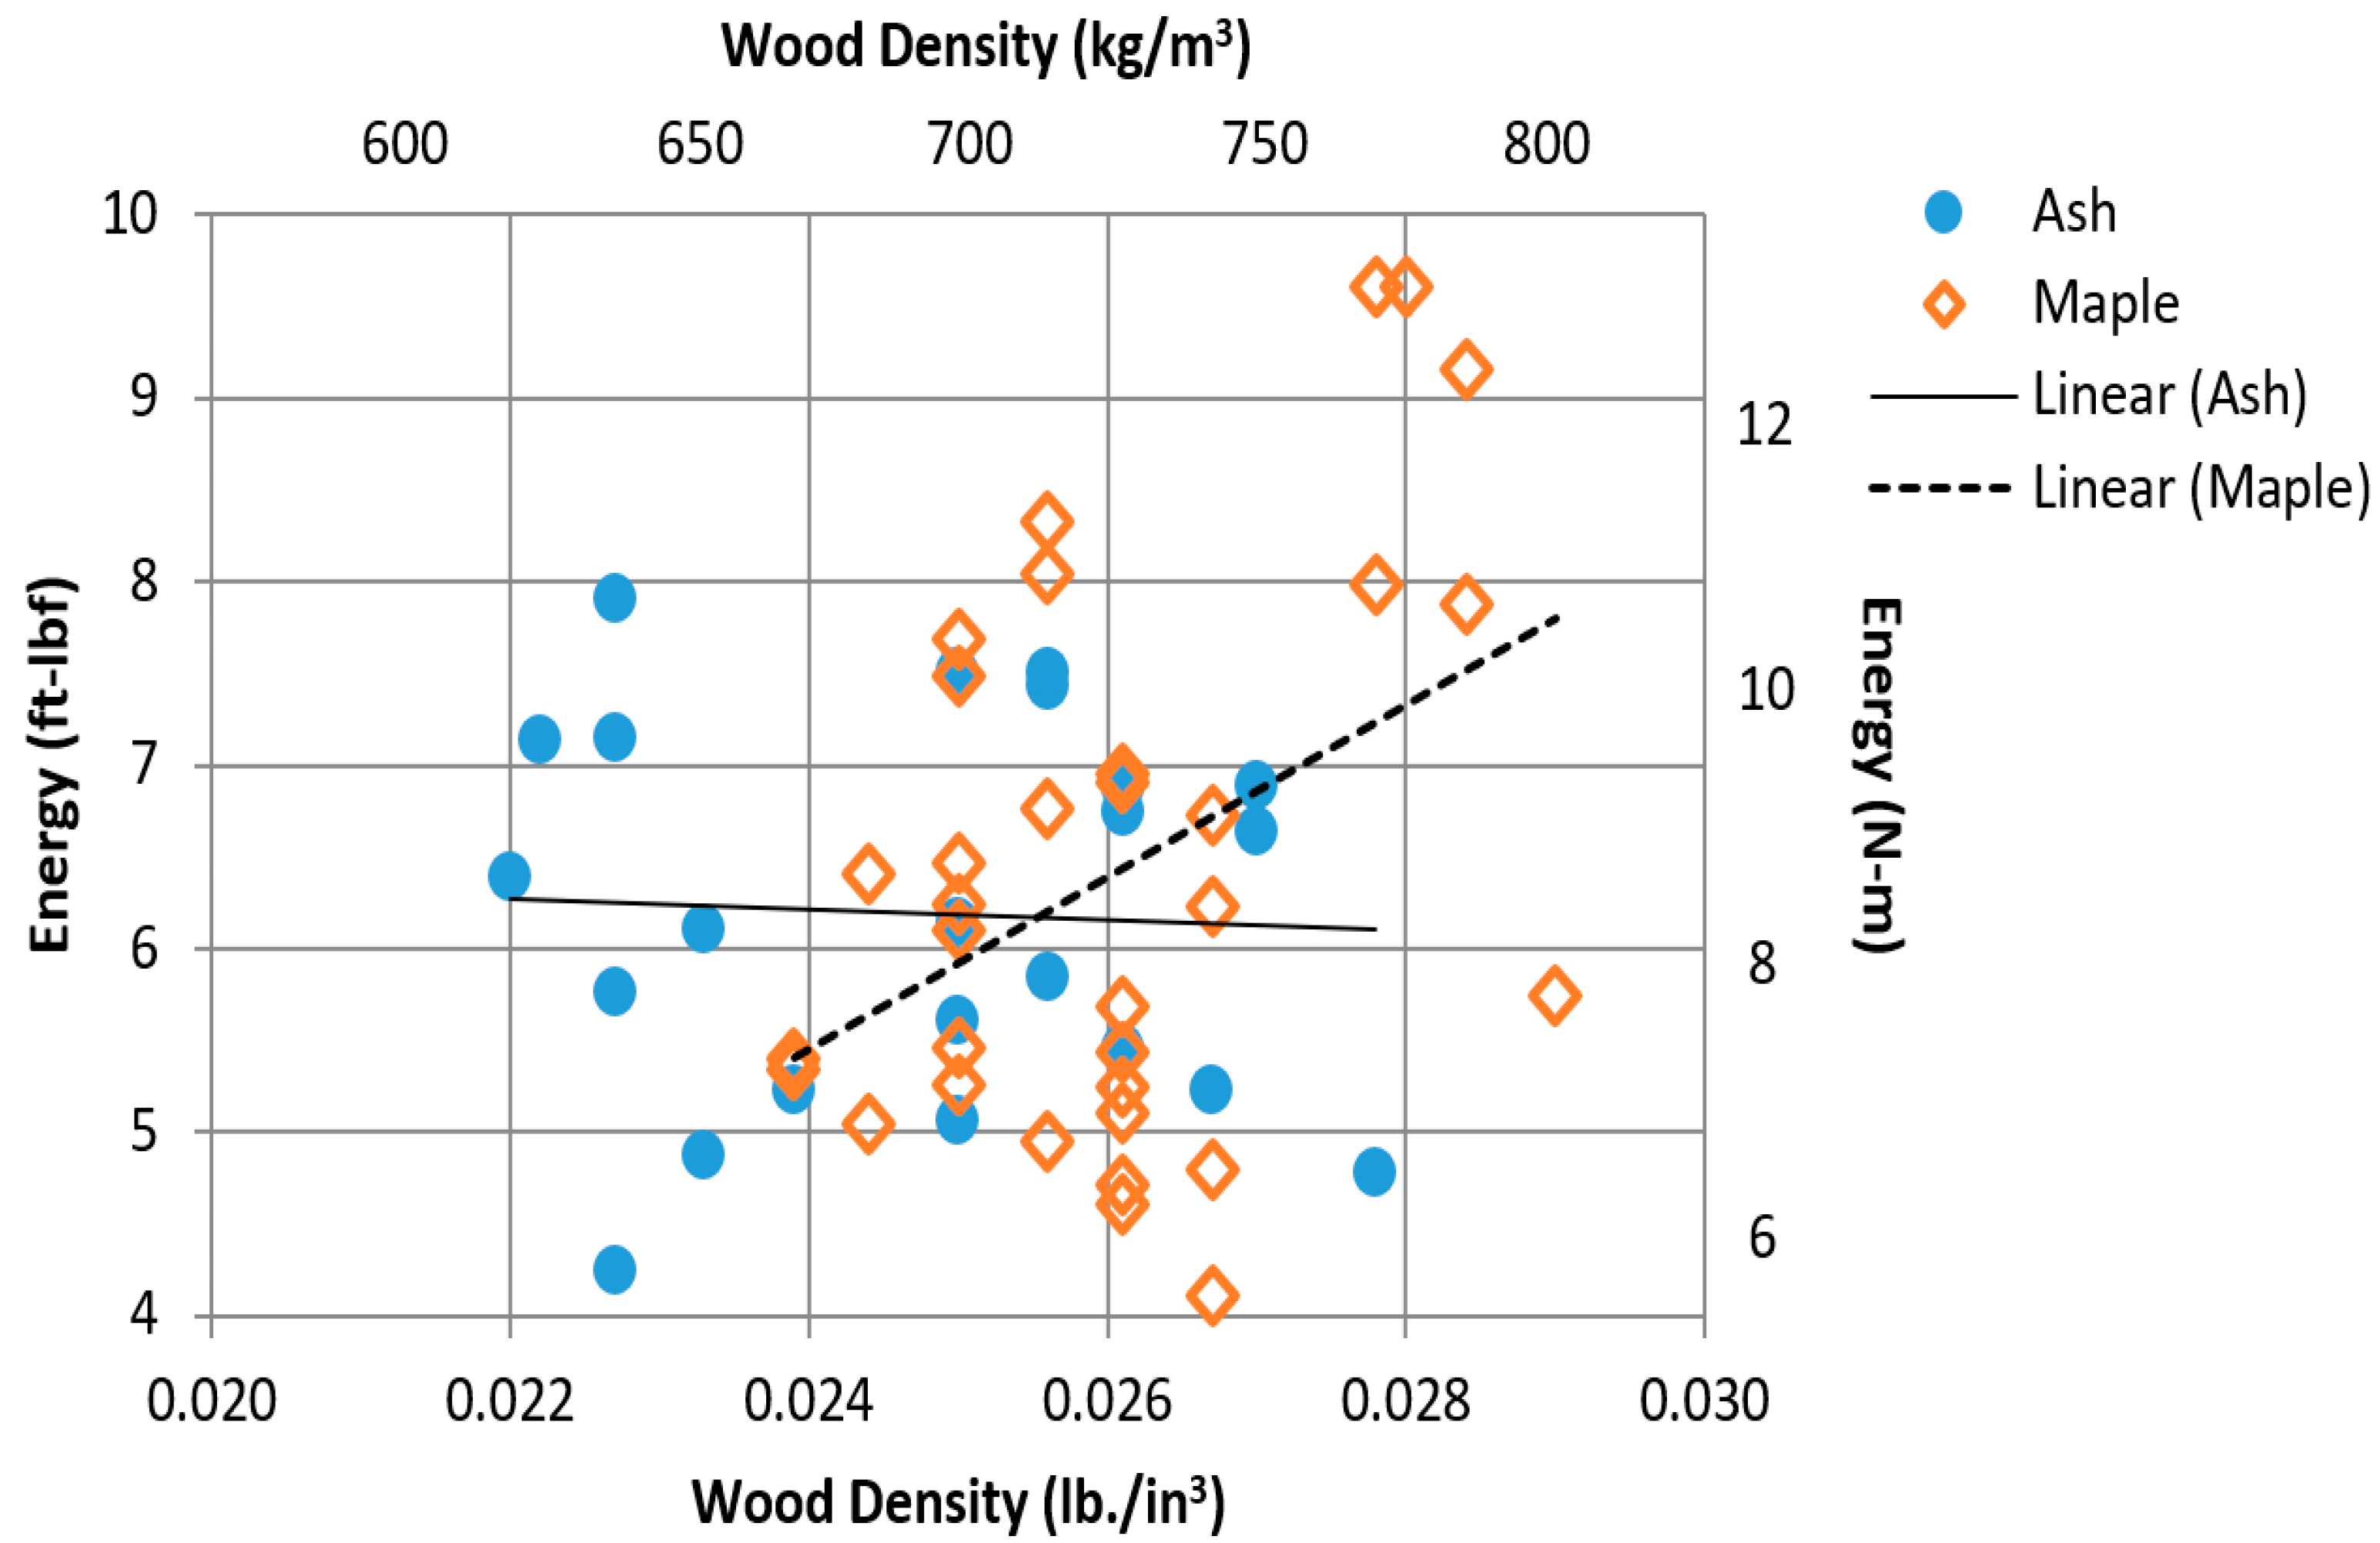
Figure 5 shows the strains-to-failure for maple samples impacted on the face grain and for ash samples impacted on the edge grain, respectively and Figure 6 shows the failure energy for the same wood species and impact-surfaces, respectively. These two combinations of wood species and impact-surface type are of primary interest because these are the same combinations that are currently prescribed for on-field bat/ball impacts. There is wide scatter among the data points in each of these four figures but this type of scatter is not unusual in wood testing. Despite the wide scatter, some trends and differences can be noted amongst the data for each of the wood species as a function density.
Linear regressions (as denoted by the solid and dashed black lines) of the Charpy data are included in Figure 5. For the maple sample set (Figure 5, open data points), the strain-to-failure exhibits a much steeper response with respect to density than the slope of the ash data (Figure 5, solid data points). The flatter slope of the ash data suggests that the durability of ash bats is less sensitive to wood density than maple bats. As used in this paper, bat durability is defined as the relative bat/ball impact speed at specific axial location along the bat—the greater the relative bat/ball impact speed, the greater the bat durability [15]. On this basis and in terms of baseball bats, it is important when using a maple wood to maximize the wood density to achieve the best impact properties for the desired profile. For ash bats, the density, while still a concern, is not as essential to the impact properties as the impact face is, with edge grain impact being the preferred impact surface. An analogous interpretation of the failure energy plot (Figure 6) can be made.
3.2. Slope of Grain
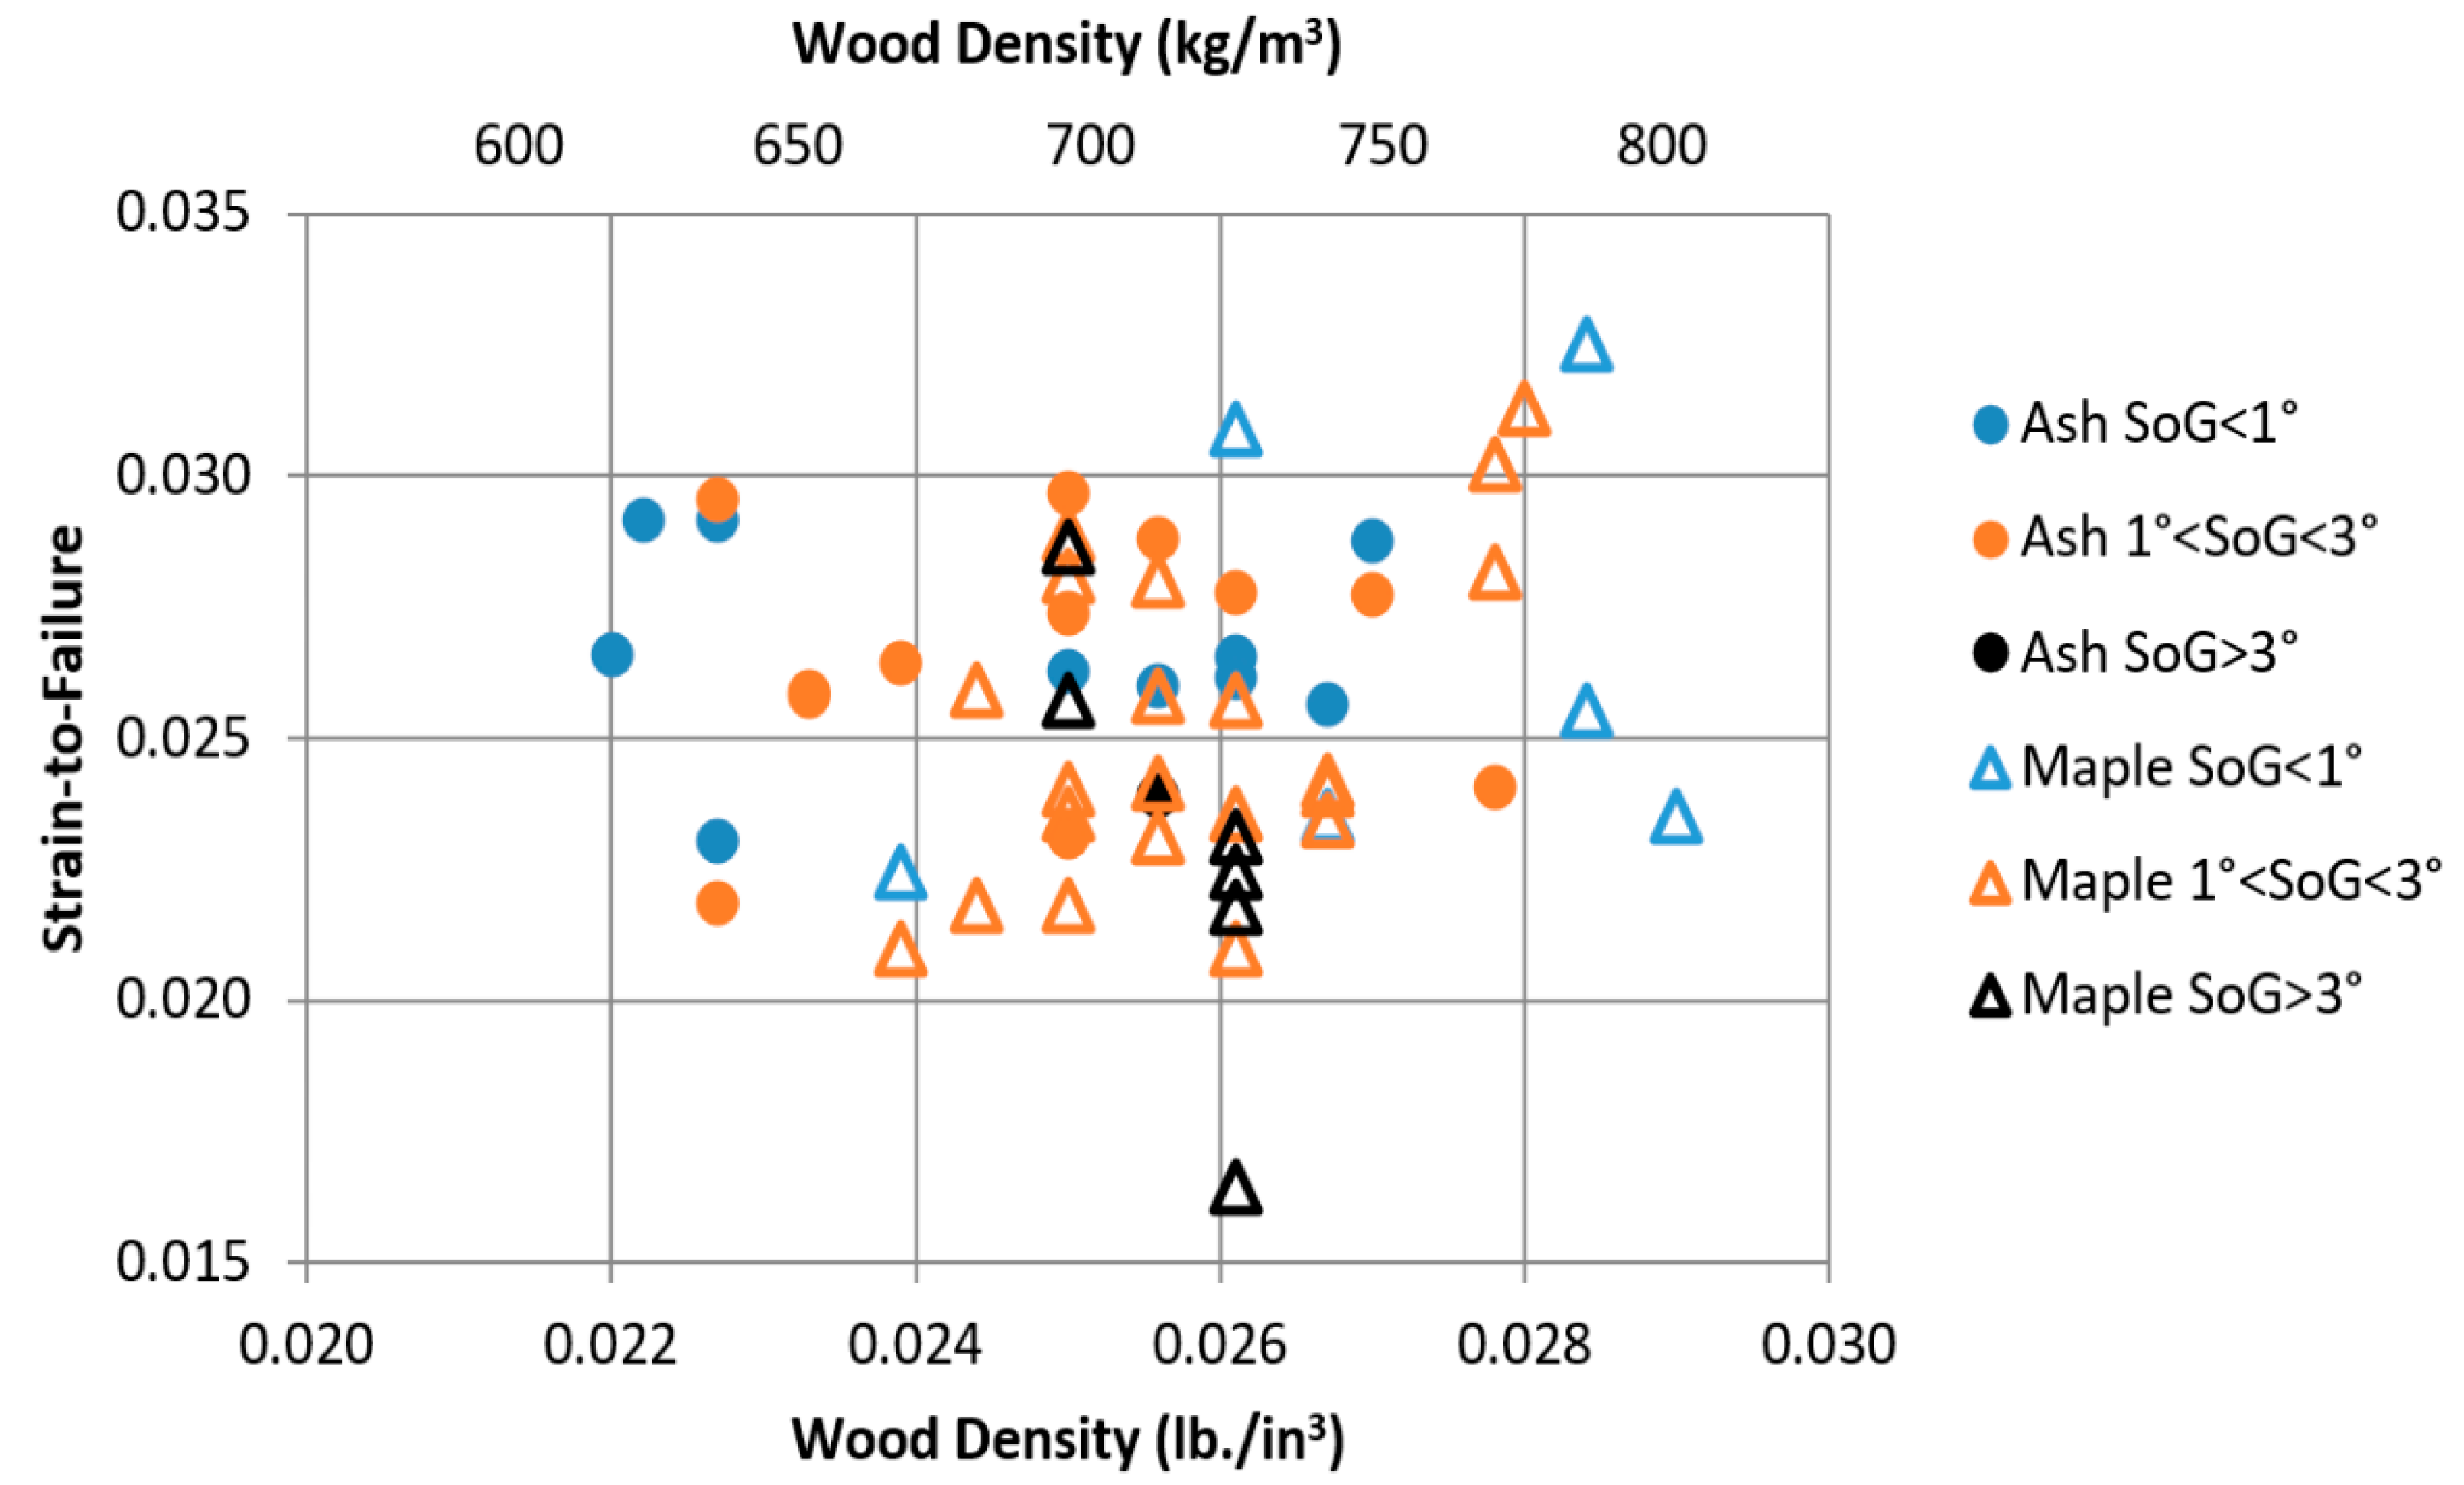
The Charpy data were sorted into three SoG groupings, specifically (1) |SoG| < 1°, (2) 1° < |SoG| < 3° and (3) |SoG| > 3°. Absolute values are used in the SoG grouping due to the symmetry involved in the Charpy Impact test. Because it is well-known that the stress-to-failure decreases with increasing absolute value of the SoG [16,17], it was anticipated that the test data would show a similar trend for the strain-to-failure as a function of SoG for maple and for ash.
Figure 7 is the same plot as Figure 5 where the ash and maple data have been sorted into three SoG groupings. It is challenging to see a clear decrease in the strain-to-failure with increasing SoG in Figure 7. However, upon review of the mean strain-to-failure and standard deviation of the data set in Table 2 for each of the three SoG groupings, it can be seen that the mean for |SoG| > 3° is lower than the mean for 1° < |SoG| < 3° which is lower or equal than the mean for |SoG| < 1°.
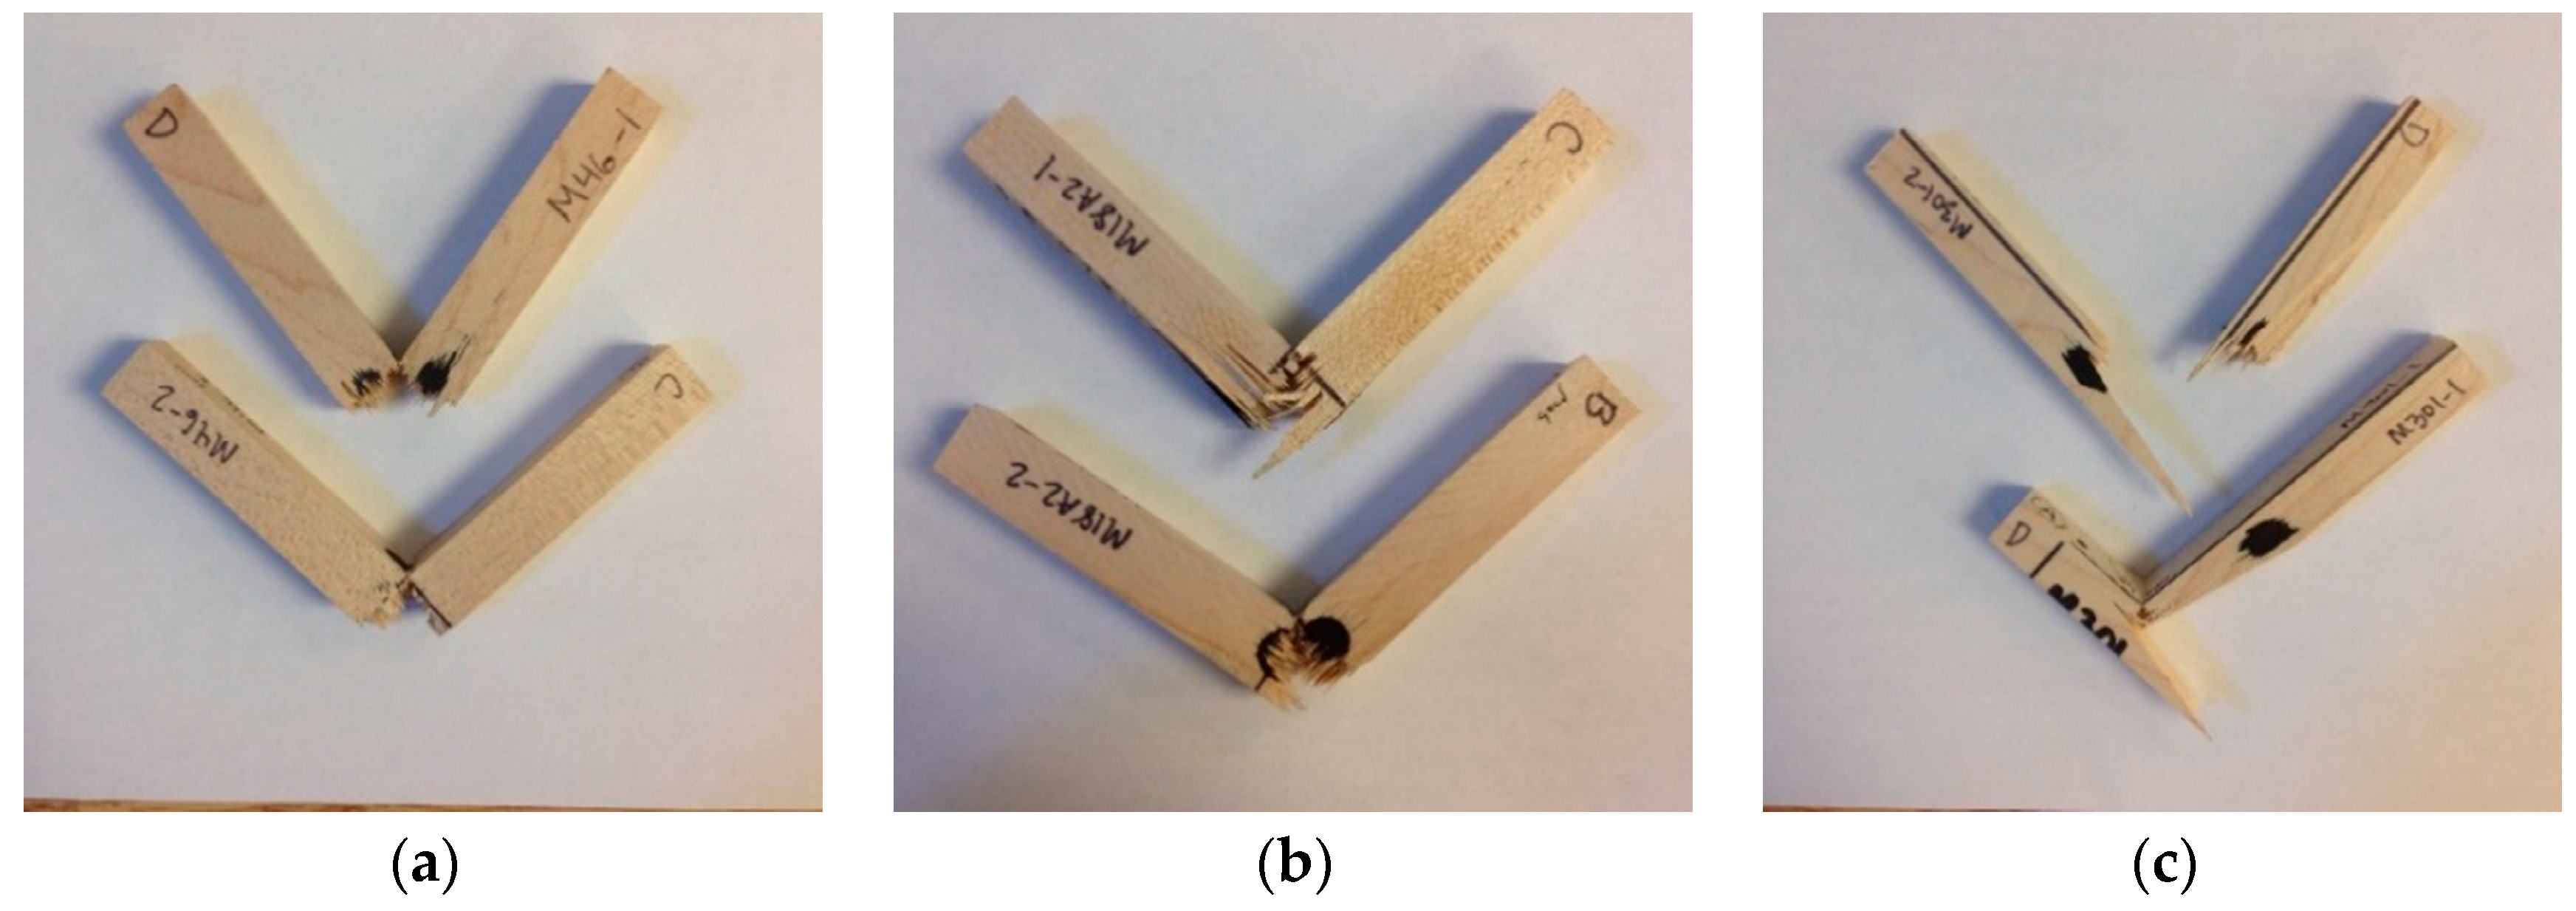
However, this interpretation of the data may be a stretch due to the limited number of samples in each of the SoG groupings that span the range of densities. Without more data, it is difficult to make a definitive conclusion by using only the current research data on the relationship between SoG and strain-to-failure. Thus, in the absence of more data, the available results suggest that density has a greater effect on the impact failure properties of the wood than SoG for the range of densities and SoGs considered in this study. However, once the wood has begun to fracture, SoG dominates the direction of crack propagation of the wood, thereby determining if the pieces breaking away from the bat are fairly blunt or spear-like in shape. This phenomenon is highlighted in Figure 8.
Figure 8 shows a maple wood species Charpy test sample from each of the three SoG groupings that were examined. The samples shown in Figure 8a have a density of 0.028 lb/in3 (786 kg/m3) and a SoG measuring 0.3°. It can be seen that the sample has not completely fractured through the width and this fracture surface is indicative of a brash wood failure. The samples in Figure 8b have a density of 0.026 lb/in3 (709 kg/m3) and a SoG measuring 1.7°. Theses samples exhibit more splintering of the wood at the fracture site in comparison to Figure 8a. The Figure 8b samples also did not completely split through the width. Figure 8c shows samples with a wood density of 0.026 lb/in3 (722 kg/m3) and a measured SoG of 3.7°. The high-SoG specimens split along the grain line during impact, thereby resulting in the formation of sharp edges on the fracture surface. This high-SoG failure propagation behavior is important to consider when discussing the issue of broken bats during gameplay because high-SoG wood is very likely to fail in a multi-piece mode.
3.3. Finite Element Model
The results of the quasi-static and dynamic test programs of ash and maple assisted in building a comprehensive set of the wood material properties that are needed for the LS-DYNA material model *MAT_WOOD (MAT_143). To investigate the credibility of a finite element model using this set of material properties, a finite element model of a Charpy Impact specimen was developed for analysis in LS-DYNA. The model was constructed of 10,000 solid elements and 12,221 nodes with a uniform mesh size of 0.0500 in. (0.127 cm). Previous modeling of the breaking of wood bats in LS-DYNA found that good correlation between models and experiments were best achieved when the *MAT_ADD_EROSION option for prescribing a strain-to-failure criterion was used in combination with the *MAT_WOOD (*MAT_143) material model [18]. Thus, the Charpy models were investigated using the *MAT_WOOD (*MAT_143) material model in combination with the *MAT_ADD_EROSION option. Once a high level of correlation was demonstrated for simulations of the Charpy test, the material properties and failure criterion were used to model baseball bat impacts and the outputs of these bat/ball impact simulations were compared to existing bat failure testing results.
3.4. Wood Material Cards
Material Type *MAT_WOOD (MAT_143) is the wood based material model available for use in LS-DYNA [19]. The user prescribes the material input parameters for moduli, strength and fracture properties of the wood species. For Card 2 in *MAT_WOOD (MAT_143), the Young’s modulus was calculated using the linear equation for MOE versus wood density that was derived from the results of the FPL quasi-static testing on maple. To characterize the remaining moduli parameters available in *MAT_WOOD (MAT_143), the relationships published in table 5-1 of the Wood Handbook [7] were used as a guide. The strength input parameters for Card 3, for example, the tensile yield strength, were determined using the linear regression for MOR versus wood density that was derived from the results of the FPL quasi-static testing on maple to provide a value for the parallel tensile strength. These values are displayed in bold in Table 3. The remaining strength input parameters were derived based on the strength relationships published in table 5-3 in the Wood Handbook [7]. The input parameters for 0.0250 lb/in3 (692.0 kg/m3) maple wood are shown in Table 3. This approach was also used to determine the ash wood material properties as a function of density as listed in Table 3.
The Card 4 fracture input parameters for Mode I parallel fracture energy were based on the values published in tables 5–10 of the Wood Handbook [7] of 430 lbf/in2-in1/2 (480 KPa-m1/2) as this failure mode is seen during a Charpy Impact test. The remaining parameters were left as determined by the FHWA study [11].
3.5. Failure Criterion
An important aspect to the finite element modeling is demonstrating the ability of the model to capture the failure of the wood. To accomplish this failure in the model, a reliable failure criterion must be established and implemented into the modeling. The results of the dynamic material testing provided valuable insight into the strain-to-failure of the wood species and how the strain-to-failure does (or does not) vary as a function of wood density. Using these results, a relationship between wood density and failure strain was determined. This relationship for maple and ash wood is given in Equations (6) and (7), respectively. Incorporating the strain-to-failure into the modeling was done through the use of the *MAT_ADD_EROSION option which provides an element failure condition based on user-defined inputs. For the current study, the maximum principle strain at failure input was utilized.
3.6. Model Correlation
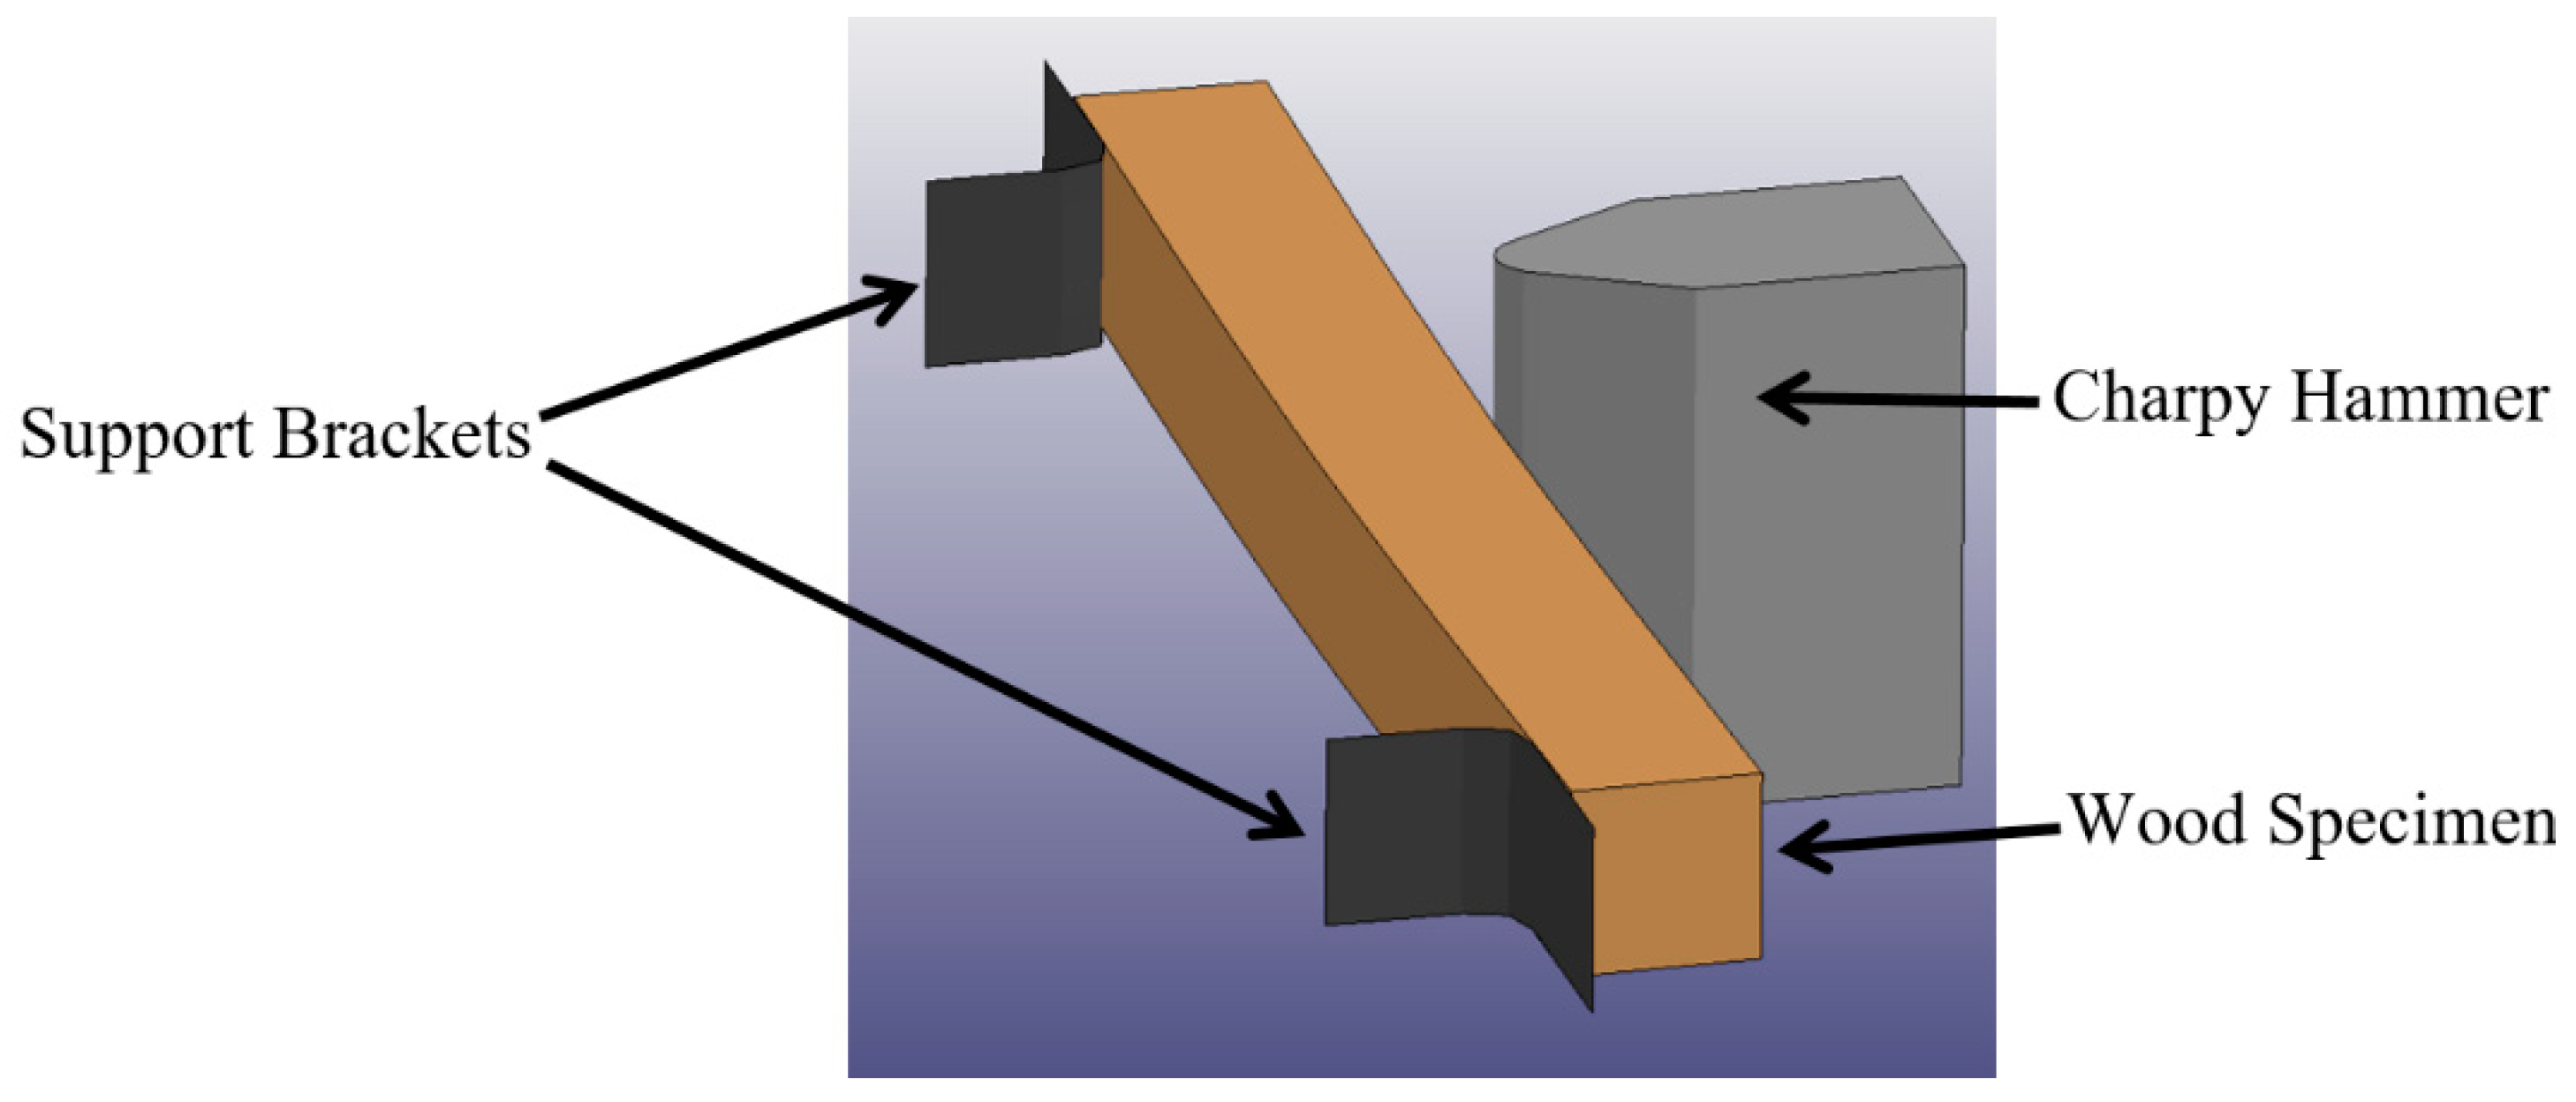
A finite element model of the Charpy Impact was analyzed in LS-DYNA and the correlation of the model with experimental results was examined. The model is shown in Figure 9 where the setup consists of a 5.00 × 0.50 × 0.50 in. (12.7 cm × 1.3 cm × 1.3 cm) (length × width × height) wood specimen impacted by a 10.0 ft-lb (13.6 N-m) Charpy hammer at 11.4 ft/s (3.47 m/s). The wood specimen rests on a pair of rigid support brackets. The element mesh is very fine, so explicitly showing the mesh would not be beneficial.
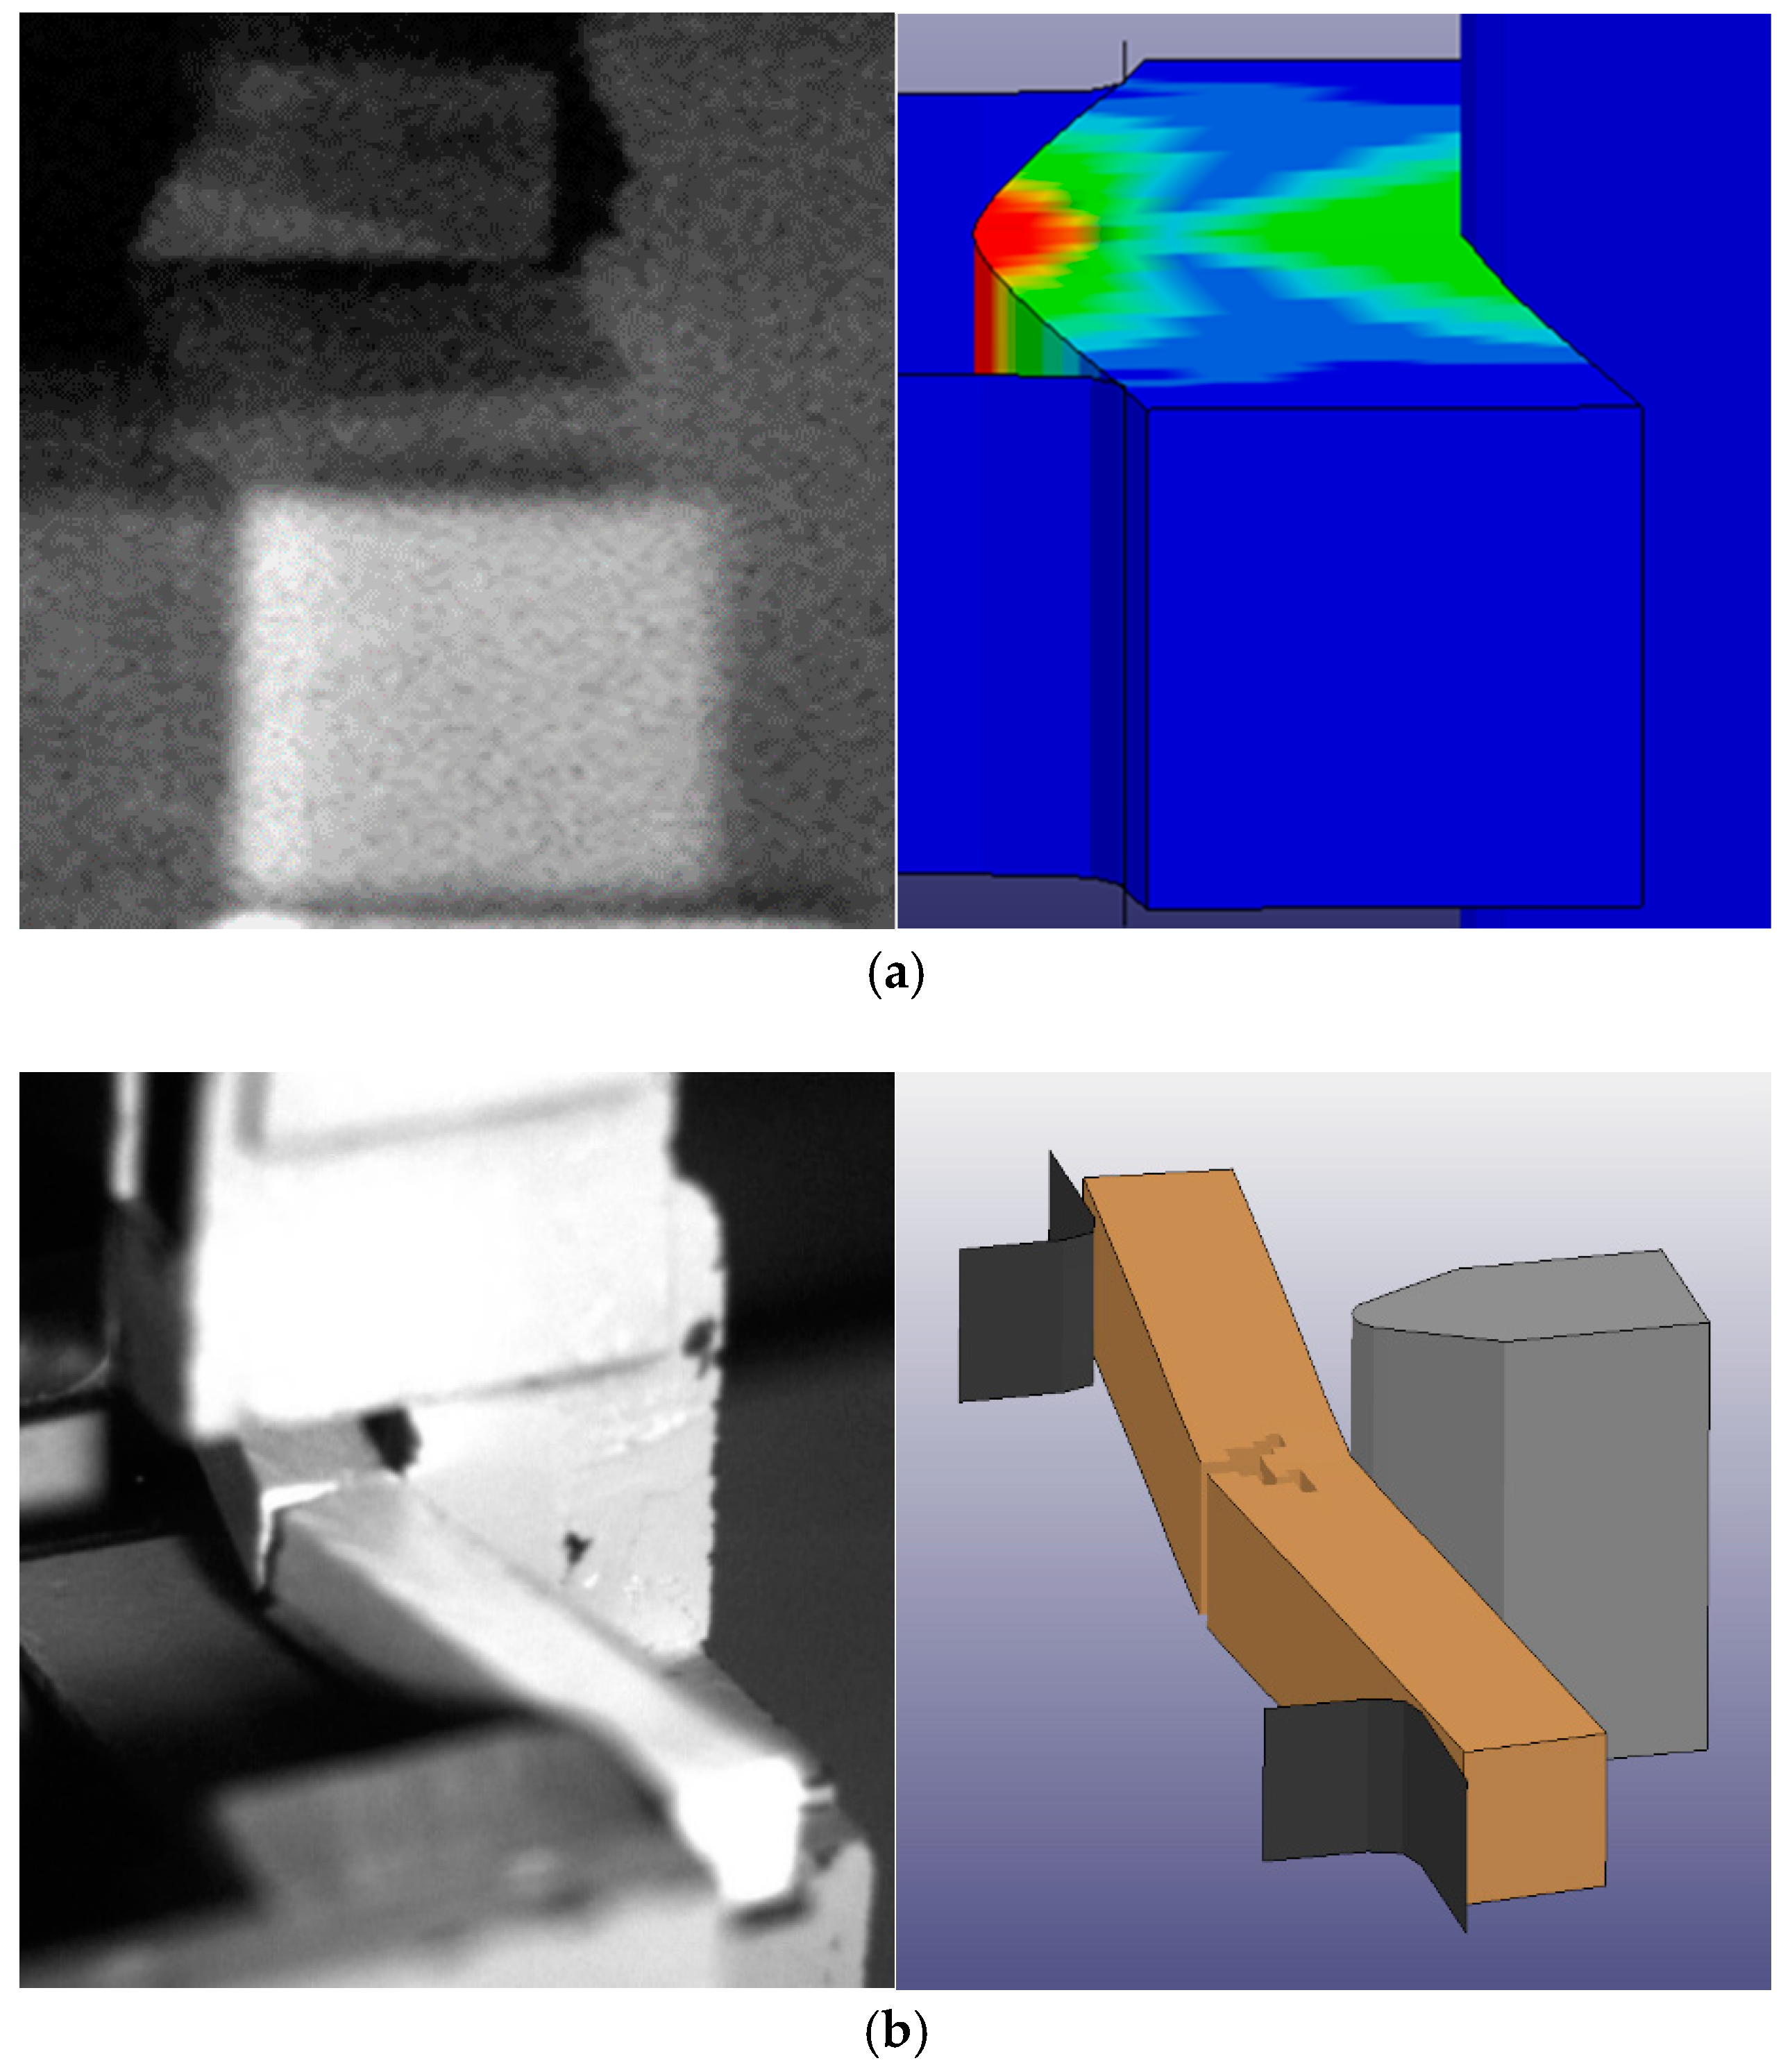
The simulation was processed using LS-DYNA R8.0 and postprocessed using LS-PrePost 4.1. To minimize the bias that may come with any anomalies associated with one specific test, the mean density of 0.026 lb/in3 (719.7 kg/m3) and the associated strain-to-failure of 0.025 (per Equation (6)) of the maple data set were used for this finite element model. The resulting maximum deflection of the model before failure occurs is 0.137 in. (0.348 cm), which is very close to the 0.138 in. (0.350 cm) maximum deflection of sample M307B, a 0.026 lb/in3 (719.7 kg/m3) density maple sample that failed at a strain of 0.0241. The model deflection of 0.137 in. (0.348 cm) falls within the mean deflection plus one standard deviation of 0.12–0.159 in. (0.308–0.404 cm) of the entire maple sample set. The model can be seen in Figure 10 with a high-speed video image for comparison.
A series of finite element simulations of the Charpy impact tests was completed for maple and ash specimens and a span of wood densities for each of the two wood species. Summaries of the comparison of maximum deflection, that is, deflection just before fracture, of these maple and ash Charpy impact models with the corresponding test sample IDs are presented in Table 4, respectively. There is excellent correlation between the maximum deflection values between the experimental data and the model results.
3.7. Bat Model
The methods described for the modeling of the maple wood in the Charpy impact simulations were applied to the finite element modeling of bat/ball impacts. A finite element model of a popular professional bat profile that was previously tested in the Bat Durability Test System (Automated Design Corporation) at the UMLBRC was built for subsequent analysis in LS-DYNA. The finite element model of the bat was constructed containing 130,554 solid elements and 137,548 nodes with a mesh size of approximately 0.2 in. (0.4920 cm). This maple bat model was 34 in. (86.4 cm) in length with a prescribed wood density of 0.0250 lb/in3 (692.0 kg/m3) to represent a 31 oz. (0.879-kg) bat, thereby matching the profile, length and weight of the lab tested maple bat. The finite element model of the baseball that was used in this research was constructed in LS-PrePost. The geometry of the ball model is a sphere of 1.4 in. (3.6 cm) radius and consists of 12,096 solid elements and 12,589 nodes with a uniform mesh size of approximately 0.2 in. (0.556 cm). The LS-DYNA *MAT_VISCOELASTC (*MAT_006) was used to define the material behavior of the ball. The baseball material properties are summarized in Table 5 [20].
The finite element model of the Bat Durability Test System consisted of the rotating back plate and the rollers that grip the bat. The LS-DYNA *MAT_ELASTIC (*MAT_001) was used to implement the properties for each of the rollers. The LS-DYNA *MAT_RIGID (*MAT_020) with aluminum material properties for the elastic modulus and Poisson’s ratio was used for the plate. The material properties of the rollers and “rigid” aluminum plate are summarized in Table 6.
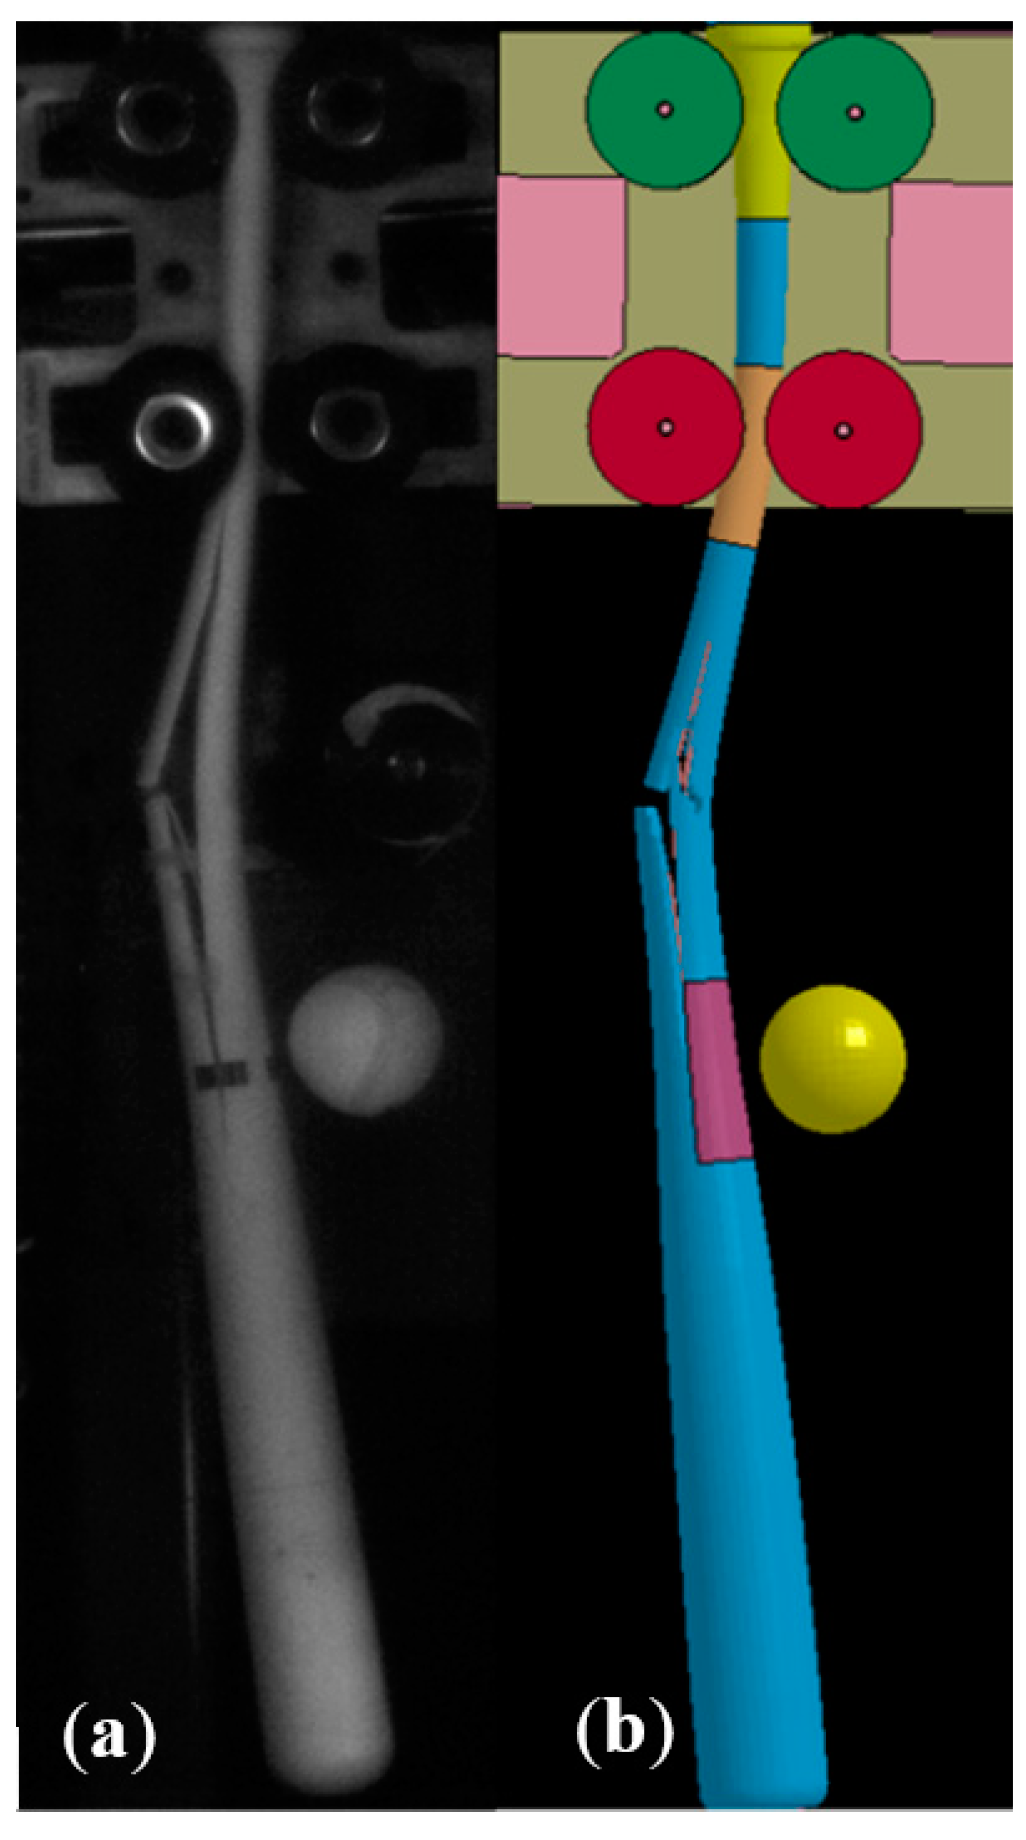
An impact velocity of 143 mph (230 kph) at a location 14.0 in. (35.6 cm) from the barrel tip was prescribed in the model to mimic the lab test conditions. Surface-to-surface contact was defined between the baseball and the bat models. The strain-to-failure used in the model was 0.0241 and was derived from the relationship between maple wood density and strain-to-failure based on the results of the Charpy impact testing (Equation (6)). A comparison of a high-speed image taken of the bat profile during durability testing and the finite element model are presented in Figure 11. The model shows excellent correlation for the mode of fracture (single-piece failure), location of fracture initiation (~15 in. [38 cm] from the knob) and the extent of the crack propagation along the length of the bat (~6 in. [15 cm] in total length).
In an effort to further explore the capabilities of this maple bat model, the impact velocity was varied to observe the bat response at different speeds. Through ramp-up durability testing at the UMLBRC, it is known that bat profiles will be able to withstand impacts up to a distinct failure threshold and then fracture in either a single-piece or multi-piece failure mode will occur.
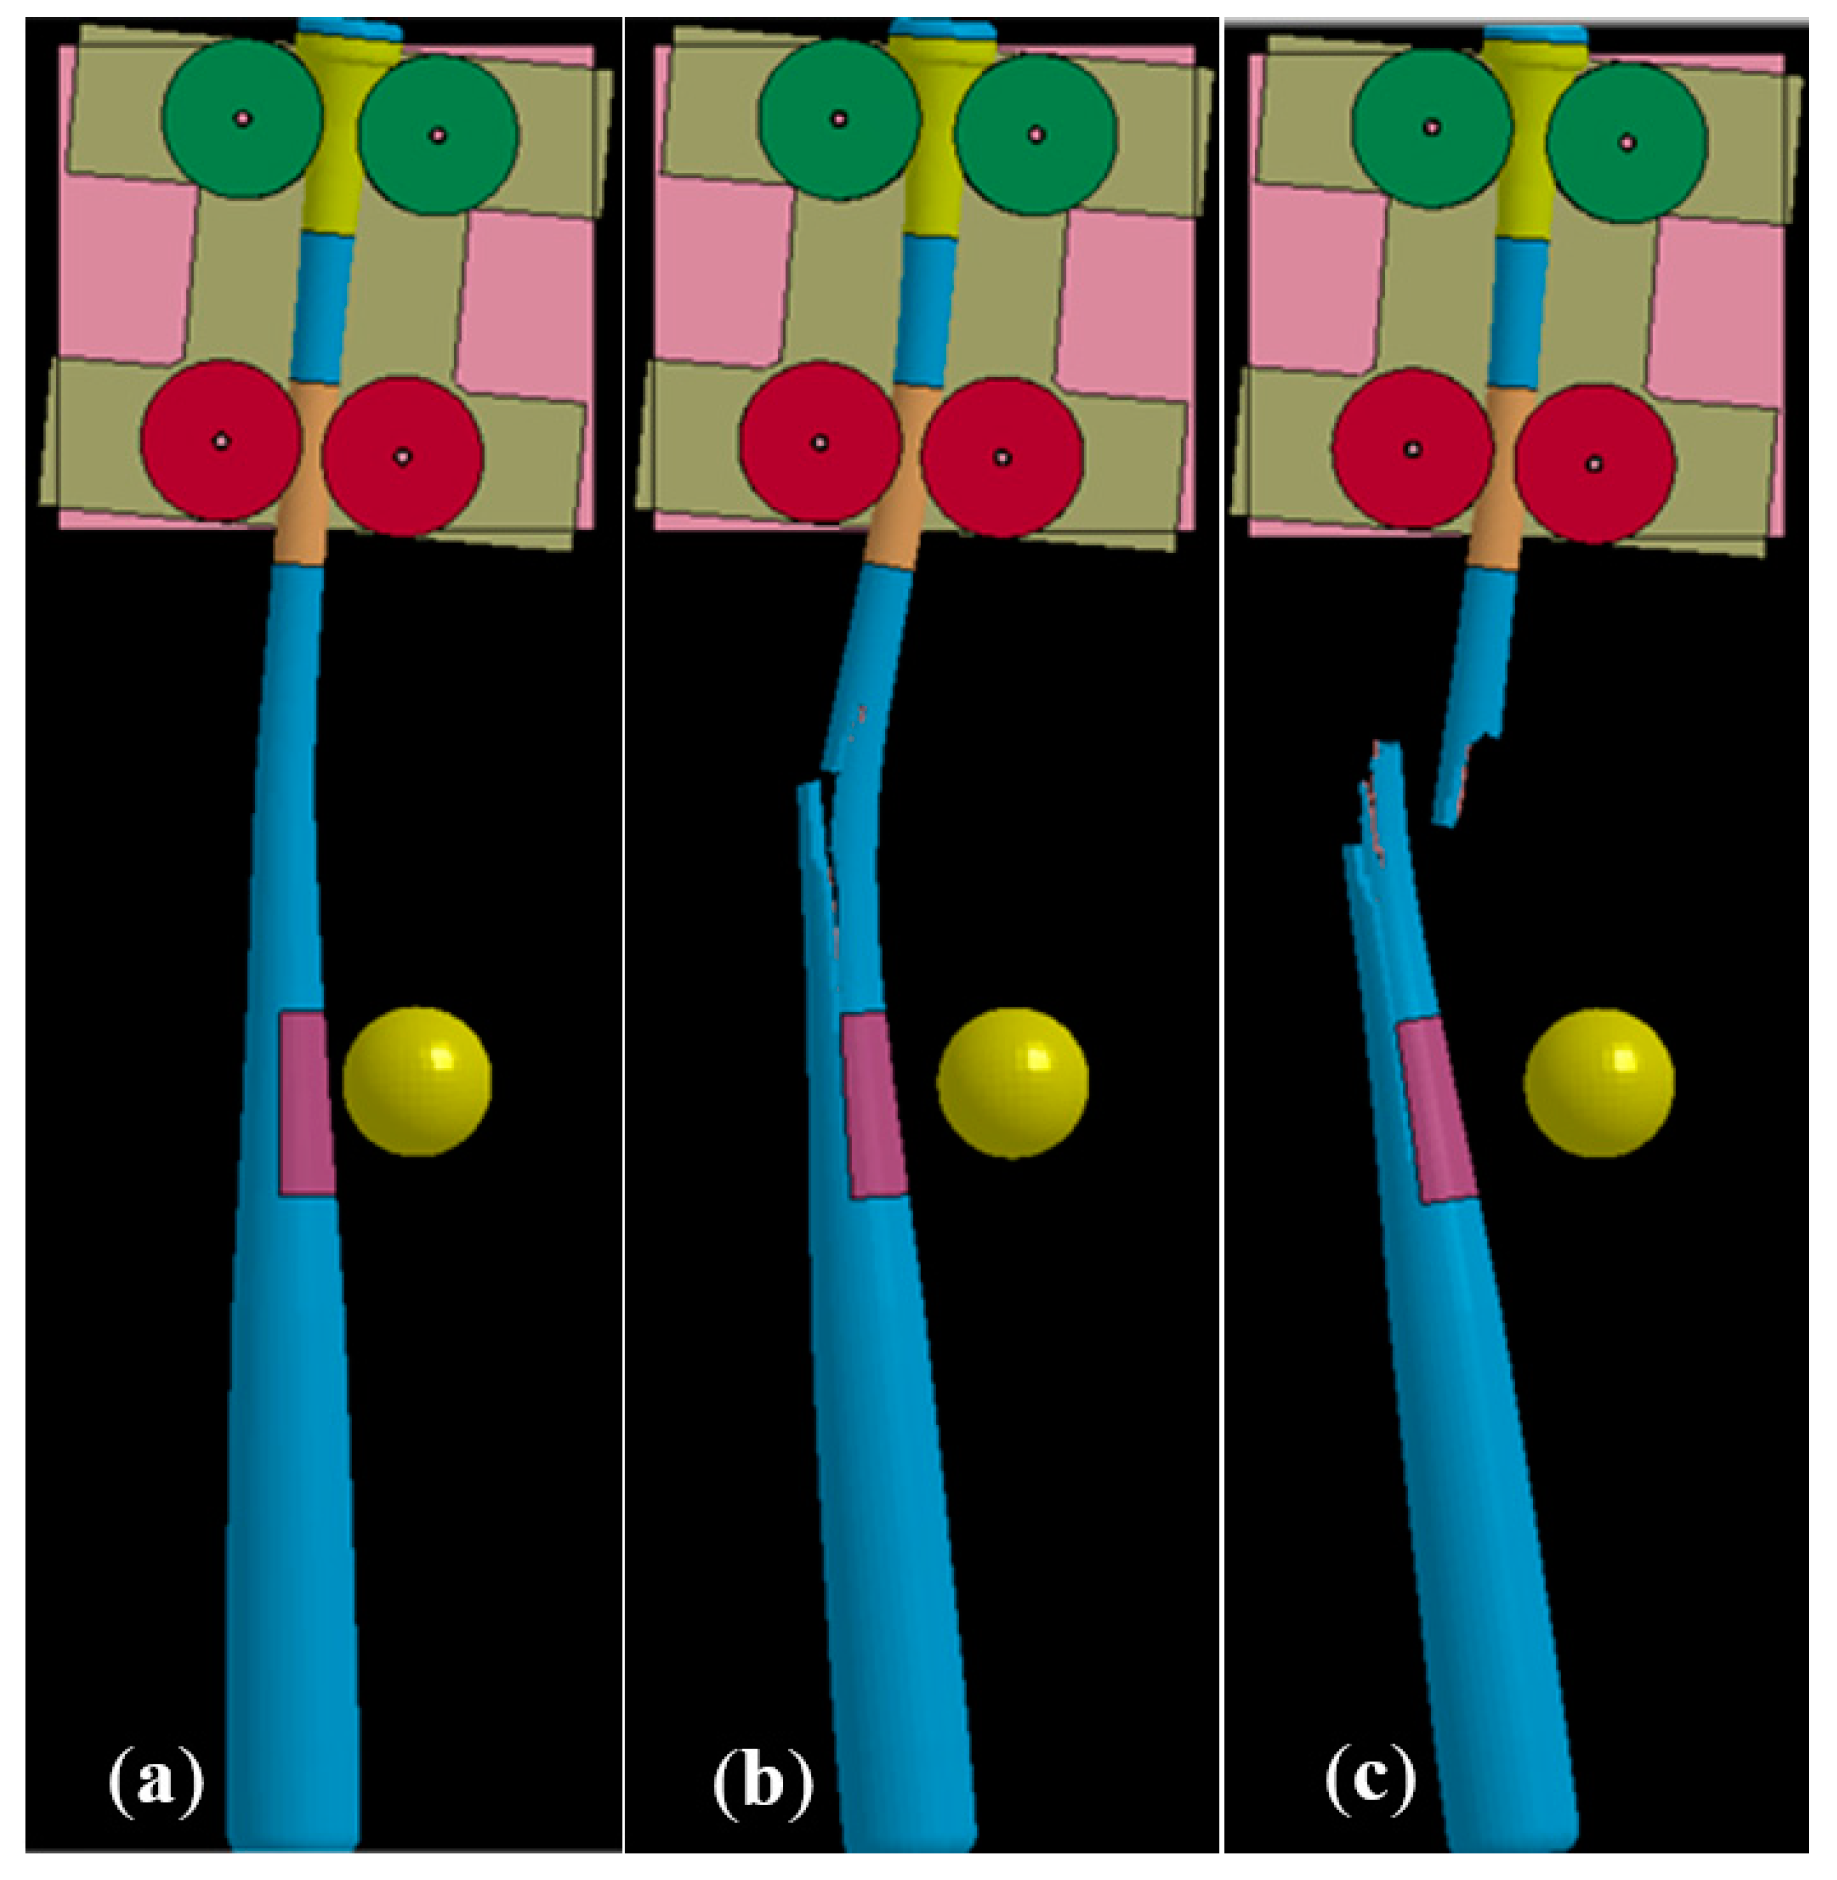
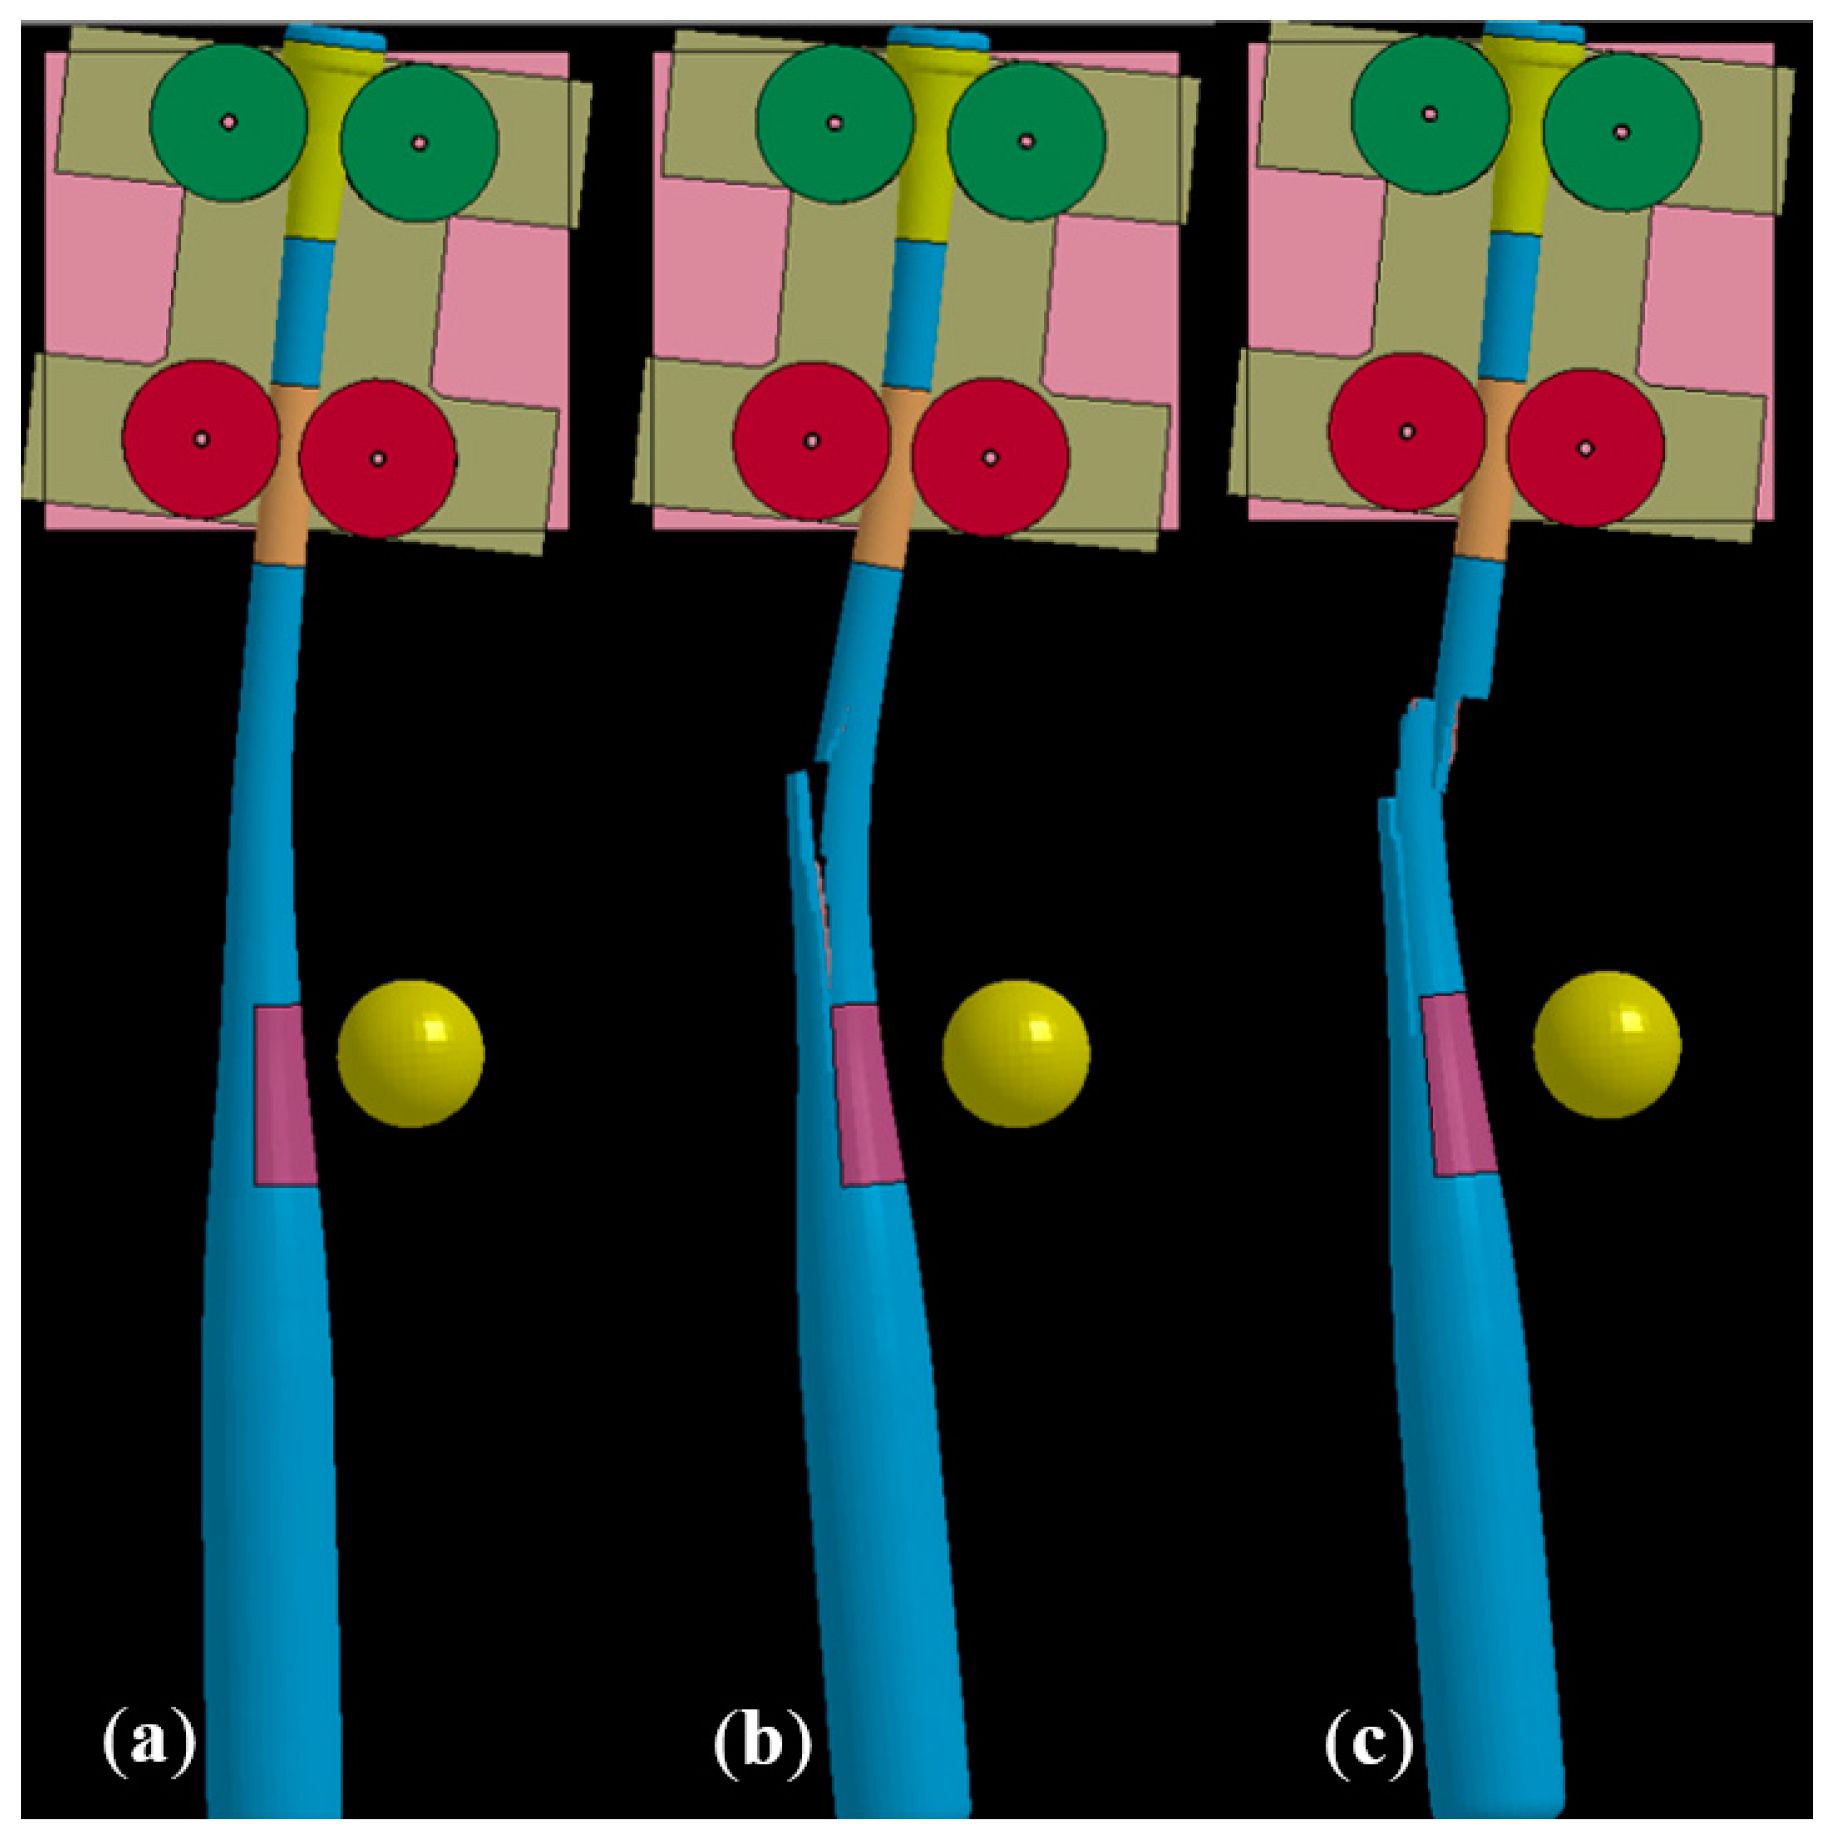
Three impact velocities were chosen, that is, 120, 130 and 145 mph (193, 209 and 233 kph) for examining how the response of the bat varies with impact speed. The wood properties and failure strain were unchanged from the 34 in. (86.4 cm) 31 oz. (0.879 kg) bat as shown in Figure 11. The post-impact results of the modeling are shown in Figure 12. It can be seen in this figure that there is a transition from single-piece failure to multi-piece failure somewhere between 130 and 145 mph (209 and 233 kph). By using 5 mph (8 kph) incremental changes in the impact velocity, a good estimate of the impact speed associated with the single-piece failure and multi-piece failure thresholds can be determined.
To explore the respective roles that impact density and strain-to-failure play in the subsequent failure mode of the bat, the density was varied from 0.0245–0.0265 lb/in3 (678–734 kg/m3) in 0.00025 lb/in3 (6.9 kg/m3) increments with the material properties of the bat prescribed based on the relationships defined in Equations (1) and (2). At each increment the strain-to-failure defined in the *MAT_ADD_EROSION card of the model was scaled according to the relationship defined in Equation (6). The bat was impacted at a velocity of 145 mph (233 kph) and the subsequent bat response was analyzed. Figure 13 shows the failure mode of a C243 profile at the three different density levels. The density of the wood plays a significant role in the subsequent failure mode of the bat, as wood material properties such as stiffness and strength increase with increasing density. As the density of the bat is increased, the failure of the bat transitions from multi-piece failure to single-piece failure and finally reaches a level where no failure occurs for a velocity of 145 mph (233 kph) and the bat survives the impact. This result shows that bats comprised of higher density wood are more durable and less susceptible to failure than those with lower densities.
4. Conclusions
Charpy impact testing at strain rates comparable to what a wood bat experiences during a bat/ball collision was completed to characterize the failure energy and strain-to-failure as a function of density and SoG for ash and maple. The failure energy increased with increasing wood density for the maple wood species. The failure energy exhibited a slight decrease with increasing wood density for the ash samples. The strain-to-failure increased with increasing density for maple but the strain-to-failure remained constant over the range of densities considered in this study for ash. The relatively flat slope of the ash data suggests that ash-bat durability is less sensitive to wood density than maple bats. Ash exhibited a higher strain-to-failure in edge-grain loading in comparison to face-grain loading and maple exhibited a higher strain-to-failure in face-grain loading in comparison to edge-grain loading. These results support the WBBS requirement that ash bats be impacted on the edge grain and maple bats be impacted on the face grain. Maple exhibited a lower failure energy, a lower max-deflection and a lower strain-to-failure for both edge and flat-grain loadings relative to ash. Maple exhibited a higher failure energy when loaded in the face-grain direction compared to edge-grain loading. The available SoG results suggest that density has a greater effect on the impact failure properties of the wood than SoG. However, once the wood has begun to fracture, SoG is the primary influence of the direction of crack propagation of the wood, thereby determining if the pieces breaking away from the bat are fairly blunt or spear-like in shape.
The characterization data were subsequently used in finite element models of a Charpy test and of a bat/ball collision. The series of finite element models of the Charpy impact tests spanned the range of ash and maple densities used in the test program. The finite element models showed excellent correlation with the experimental data for the same combinations of wood species and density. A finite element model of a maple bat/ball impact showed excellent correlation with a lab test of the same conditions.
Author Contributions
Conceptualization, J.S., P.D. and D.K.; Data curation, J.F.-S., J.S. and P.D.; Formal analysis, J.F.-S.; Funding acquisition, J.S.; Investigation, J.F.-S.; Methodology, J.F.-S. and J.S.; Project administration, P.D.; Resources, P.D.; Software, J.F.-S. and J.S.; Supervision, J.S. and P.D.; Validation, J.F.-S., J.S., P.D. and D.K.; Visualization, J.F.-S.; Writing—original draft, J.F.-S.; Writing—review & editing, J.S., P.D. and D.K.
Funding
This research was funded in part by the Office of the Commissioner of Baseball and the MLB Players Association.
Acknowledgments
This material is based upon the work supported by the Office of the Commissioner of Baseball and the MLB Players Association. Any opinions, findings and conclusions or recommendations expressed in this material are those of the authors and do not necessarily reflect the views of the Office of the Commissioner of Baseball and the MLB Players Association.
Conflicts of Interest
The authors declare no conflict of interest. The funding sponsors had no role in the design of the study; in the collection, analyses, or interpretation of data; in the writing of the manuscript and in the decision to publish the results.
References
- Ruggiero, E. Investigating Baseball Bat Durability Using Experimental and Finite Element Modeling Methods. Master’s Thesis, University of Massachusetts Lowell, Lowell, MA, USA, 2013. [Google Scholar]
- Nicholls, R.L.; Miller, K.; Elliott, B.C. Numerical analysis of maximal bat performance in baseball. J. Biomech. 2006, 39, 1001–1009. [Google Scholar] [CrossRef] [PubMed]
- Mustone, T.J.; Sherwood, J.A. Using LS-DYNA to Characterize the Performance of Baseball Bats. In Proceedings of the LS-Dyna Users Conference, Detroit, MI, USA, 21–22 September 1998. [Google Scholar]
- Shenoy, M.M.; Smith, L.V.; Axtell, J.T. Performance assessment of wood, metal and composite baseball bats. Compos. Struct. 2001, 52, 397–404. [Google Scholar] [CrossRef]
- Smith, L.V.; Hermanson, J.C.; Rangaraj, S.; Bender, D.A. Dynamic finite element analysis of wood baseball bats. In Proceedings of the 1999 ASME Bioengineering Conference, Big Sky, MT, USA, 16–20 June 1999; pp. 629–630. [Google Scholar]
- Fortin-Smith, J.; Ruggiero, E.; Drane, P.; Sherwood, J.; Kretschmann, D. A Finite Element Investigation of the Relationship between Bat Taper Geometry and Bat Durability. J. Sports Eng. Technol. 2017, in press. [Google Scholar] [CrossRef]
- Kretschmann, D.E. Wood handbook—Wood as an Engineering Material; General Technical Report FPL-GTR-190; U.S. Department of Agriculture, Forest Service, Forest Products Laboratory: Madison, WI, USA, 2010.
- Kretschmann, D.E.; Bridwell, J.J.; Nelson, T.C. Effect of changing slope of grain on ash, maple, and yellow birch in bending strength. In Proceedings of the WCTE 2010, World Conference on Timber Engineering, Riva del Garda, Trento, Italy, 20–24 June 2010. [Google Scholar]
- Bertrand, D.; Bourrier, F.; Olmedo, I.; Brun, M.; Berger, F.; Limam, A. Experimental and numerical dynamic analysis of a live tree stem impacted by a Charpy pendulum. Int. J. Solids Struct. 2013, 50, 1689–1698. [Google Scholar] [CrossRef]
- Reid, S.R.; Peng, C. Dynamic uniaxial crushing of wood. Int. J. Impact Eng. 1997, 19, 531–570. [Google Scholar] [CrossRef]
- Murray, D.; Reid, J.D.; Faller, R.K.; Bielenberg, B.W.; Paulsen, T.J. Evaluation of LS-DYNA Wood Material Model 143; Publication No. FHWA-HRT-04-096; Federal Highway Administration: Washington, DC, USA, 2005.
- U.S. Department of Transportation Federal Highway Administration. Manual for LS-DYNA Wood Material Model 143 2007; U.S. Department of Transportation Federal Highway Administration: Washington, DC, USA, 2007.
- ASTM International. ASTM International 2010 ASTM D6110-10. Standard Test Method for Determining the Charpy Impact Resistance of Notched Specimens of Plastics; ASTM International: West Conshohocken, PA, USA, 2010. [Google Scholar]
- Fortin-Smith, J.; Ruggiero, E.; Drane, P.; Sherwood, J.; Kretschmann, D. Wood Baseball Bat Slope of Grain Durability Finite Element Modeling. Appl. Sci. 2018. submitted for review. [Google Scholar]
- Ruggiero, E.; Fortin-Smith, J.; Sherwood, J.; Drane, P.; Kretschmann, D. Development of a Protocol for Certification of New Wood Species for Making Baseball Bats. J. Sports Eng. Technol. 2017, in press. [Google Scholar]
- Carrasco, E.V.M.; Mantilla, J.N.R. Applying Failure Criteria to Shear Strength Evaluation of Bonded Joints According to Grain Slope under Compressive Load. Int. J. Eng. Technol. 2013, 13, 19–25. [Google Scholar]
- Hankinson, R.L. Investigation of crushing strength of spruce at varying angles of grain. Air Serv. Inf. Circ. 1921, 3, 130. [Google Scholar]
- Ruggiero, E.; Sherwood, J.; Drane, P.; Duffy, M.; Kretschmann, D. Finite Element Modeling of Wood Bat Profiles for Durability. Proc. Eng. 2014, 34, 427–432. [Google Scholar] [CrossRef]
- Livermore Software Technology Corporation. LS-DYNA KEYWORD USER’S MANUAL VOLUME II—Material Models; Livermore Software Technology Corporation: Livermore, CA, USA, 2016. [Google Scholar]
- Connelly, T.; University of Massachusetts Lowell, Lowell, MA, USA. Personal Communication, 2011.
Figure 1.
Modulus of Elasticity (MOE) test results for ash and maple dowels with slope-of-grain angles spanning the range of ±3°.
Figure 1.
Modulus of Elasticity (MOE) test results for ash and maple dowels with slope-of-grain angles spanning the range of ±3°.

Figure 2.
Modulus of Rupture (MOR) test results for ash and maple dowels with slope-of-grain angles spanning the range of ±3°.
Figure 2.
Modulus of Rupture (MOR) test results for ash and maple dowels with slope-of-grain angles spanning the range of ±3°.

Figure 3.
Example of a radial slope-of-grain measurement.

Figure 4.
Maximum Deflection Measurement (a) just before impact and (b) just before fracture. The white “✖” denotes the tracked point before impact and at the initiation of fracture.
Figure 4.
Maximum Deflection Measurement (a) just before impact and (b) just before fracture. The white “✖” denotes the tracked point before impact and at the initiation of fracture.

Figure 5.
Strain-to-failure as a function of wood density for ash samples impacted edge-grain and maple samples impacted face-grain.
Figure 5.
Strain-to-failure as a function of wood density for ash samples impacted edge-grain and maple samples impacted face-grain.

Figure 6.
Failure energy as a function of wood density for ash samples impacted edge-grain and maple samples impacted face-grain.
Figure 6.
Failure energy as a function of wood density for ash samples impacted edge-grain and maple samples impacted face-grain.

Figure 7.
Strain-to-failure of ash samples impacted on the edge-grain and maple samples impacted on the face-grain. All samples are sorted by slope-of-grain (SoG).
Figure 7.
Strain-to-failure of ash samples impacted on the edge-grain and maple samples impacted on the face-grain. All samples are sorted by slope-of-grain (SoG).

Figure 8.
Charpy samples of varying SoG (a) |SoG| < 1°, (b) 1° < |SoG| < 3° and (c) |SoG| > 3°.

Figure 9.
Charpy impact finite element model.

Figure 10.
Charpy Impact of maple sample: (a) High-speed video image and (b) Finite element model showing maximum strain contours (top) and crack propagation (bottom).
Figure 10.
Charpy Impact of maple sample: (a) High-speed video image and (b) Finite element model showing maximum strain contours (top) and crack propagation (bottom).

Figure 11.
34-in. (86.4 cm) long, 31-oz. (0.879 kg) professional maple bat profile impacted at 143 mph (230 kph): (a) Lab test and (b) Finite element model.
Figure 11.
34-in. (86.4 cm) long, 31-oz. (0.879 kg) professional maple bat profile impacted at 143 mph (230 kph): (a) Lab test and (b) Finite element model.

Figure 12.
Bat model failure modes at varying impact velocities; (a) No failure at 120 mph (193 kph), (b) Single-piece failure at 130 mph (209 kph) and (c) Multi-piece failure at 145 mph (233 kph).
Figure 12.
Bat model failure modes at varying impact velocities; (a) No failure at 120 mph (193 kph), (b) Single-piece failure at 130 mph (209 kph) and (c) Multi-piece failure at 145 mph (233 kph).

Figure 13.
C243 profile impacted at 145 mph (233 kph) at density levels of (a) 0.0265 lb/in3 (733 kg/m3), (b) 0.0255 lb/in3 (706 kg/m3) and (c) 0.0245 lb/in3 (678 kg/m3).
Figure 13.
C243 profile impacted at 145 mph (233 kph) at density levels of (a) 0.0265 lb/in3 (733 kg/m3), (b) 0.0255 lb/in3 (706 kg/m3) and (c) 0.0245 lb/in3 (678 kg/m3).


Table 1.
Summary of mean values with one standard deviation for Charpy Impact testing of Major League Baseball (MLB)-quality Ash and Maple.
Table 1.
Summary of mean values with one standard deviation for Charpy Impact testing of Major League Baseball (MLB)-quality Ash and Maple.
| Species | Impact Surface | Number of Samples | Strain to Failure | Max Deflection in. (cm) | Energy ft-lbf (N-m) |
|---|---|---|---|---|---|
| Ash | edge | 23 | 0.0265 ± 0.002 | 0.148 ± 0.0122 (0.376 ± 0.0310) | 6.48 ± 1.02 (8.79 ± 1.38) |
| Ash | face | 12 | 0.0259 ± 0.003 | 0.146 ± 0.0139 (0.371 ± 0.0353) | 7.19 ± 1.14 (9.75 ± 1.55) |
| Maple | edge | 21 | 0.0236 ± 0.002 | 0.133 ± 0.0134 (0.338 ± 0.0340) | 6.30 ± 1.33 (8.54 ± 1.80) |
| Maple | face | 33 | 0.0250 ± 0.004 | 0.140 ± 0.0191 (0.356 ± 0.0485) | 6.41 ± 1.48 (8.69 ± 2.01) |
Table 2.
Mean maple and ash sample strain-to-failure results sorted by SoG class.
| SoG Class | Maple Strain-to-Failure | Ash Strain-to-Failure |
|---|---|---|
| <1° | 0.026 ± 0.0043 | 0.027 ± 0.0025 |
| 1° < SoG < 3° | 0.025 ± 0.0030 | 0.027 ± 0.0020 |
| >3° | 0.023 ± 0.0041 | 0.024 |
Table 3.
MAT_WOOD (MAT_143) maple and ash card 2 and 3 inputs.
| Material Property | LS-DYNA Material Variable | Units | Ash | Maple | |||
|---|---|---|---|---|---|---|---|
| US | SI | US | SI | US | SI | ||
| Parallel Normal Modulus | EL | lb/in3 | GPa | 2,190,000 | 15.1 | 2,280,000 | 15.7 |
| Perpendicular Normal Modulus | ET | lb/in3 | GPa | 175,000.0 | 1.21 | 148,070.0 | 1.02 |
| Parallel Shear Modulus | GLT | lb/in3 | GPa | 238,438.0 | 1.64 | 252,858.0 | 1.74 |
| Perpendicular Shear Modulus | GTR | lb/in3 | GPa | 83,864.00 | 0.58 | 80,642.00 | 0.56 |
| Poisson’s Ratio | PR | --- | --- | 0.440 | 0.476 | ||
| Parallel Tensile Strength | XT | lb/in3 | MPa | 24,474.00 | 169 | 22,513.00 | 155 |
| Parallel Compressive Strength | XC | lb/in3 | MPa | 12,090.30 | 83.4 | 11,227.02 | 77.4 |
| Perpendicular Tensile Strength | YT | lb/in3 | MPa | 1942.400 | 13.4 | 2163.920 | 14.9 |
| Perpendicular Compressive Strength | YC | lb/in3 | MPa | 1892.600 | 13.1 | 2107.850 | 14.5 |
| Parallel Shear Strength | SXY | lb/in3 | MPa | 3116.300 | 21.5 | 3341.050 | 23.0 |
| Perpendicular Shear Strength | SYZ | lb/in3 | MPa | 4362.800 | 30.1 | 4677.470 | 32.3 |
Table 4.
Charpy Impact model maple and ash wood deflection correlation results.
| Sample ID | Density lb/in3 (kg/m3) | Maximum Deflection in. (cm) | % Difference | |
|---|---|---|---|---|
| Experiment | FE Model | |||
| M35B10 | 0.024 (664.3) | 0.125 (0.318) | 0.126 (0.320) | 0.80% |
| M36C | 0.025 (692.0) | 0.133 (0.338) | 0.132 (0.335) | 0.75% |
| M307 | 0.026 (719.7) | 0.138 (0.350) | 0.137 (0.348) | 0.72% |
| M306 | 0.027 (747.4) | 0.152 (0.386) | 0.149 (0.378) | 1.97% |
| A44B10 | 0.023 (636.6) | 0.136 (0.345) | 0.138 (0.351) | 1.47% |
| A79A10 | 0.025 (692.0) | 0.148 (0.376) | 0.147 (0.373) | 0.68% |
| A41A10 | 0.026 (719.7) | 0.148 (0.376) | 0.148 (0.376) | 0.00% |
Table 5.
Ball material properties.
| Density (blobs/in3) [Kg/m3] | Bulk Modulus (lb/in2) [N/m2] | Initial Shear Modulus (lb/in2) [N/m2] | Long-Term Shear Modulus (lb/in2) [N/m2] | β |
|---|---|---|---|---|
| 7.230 × 10⁻⁵ [772.5] | 13,500 [93.1] | 5000 [34.5] | 1080 [7.45] | 20,000 |
Table 6.
ADC roller and aluminum plate material properties.
| Part | LS-DYNA Material Model | Density (blobs/in3) [Kg/m3] | E (lb/in2) [N/m2] | Poisson’s Ratio |
|---|---|---|---|---|
| Top Rollers | #1 Isotropic Elastic | 2.5880 × 10⁻⁵ [276.5] | 750,000 [5.171 × 10⁹] | 0.3 |
| Bottom Rollers | #1 Isotropic Elastic | 2.5880 × 10⁻⁵ [276.5] | 75,000 [5.171 × 10⁸] | 0.3 |
| Plate | #20 Rigid | 2.5907 × 10⁻⁴ [2768] | 10,000,000 [68.95 × 10⁹] | 0.3 |
© 2018 by the authors. Licensee MDPI, Basel, Switzerland. This article is an open access article distributed under the terms and conditions of the Creative Commons Attribution (CC BY) license (http://creativecommons.org/licenses/by/4.0/).
Share and Cite
MDPI and ACS Style
Fortin-Smith, J.; Sherwood, J.; Drane, P.; Kretschmann, D. Characterization of Maple and Ash Material Properties for the Finite Element Modeling of Wood Baseball Bats. Appl. Sci. 2018, 8, 2256. https://doi.org/10.3390/app8112256
AMA Style
Fortin-Smith J, Sherwood J, Drane P, Kretschmann D. Characterization of Maple and Ash Material Properties for the Finite Element Modeling of Wood Baseball Bats. Applied Sciences. 2018; 8(11):2256. https://doi.org/10.3390/app8112256
Chicago/Turabian StyleFortin-Smith, Joshua, James Sherwood, Patrick Drane, and David Kretschmann. 2018. "Characterization of Maple and Ash Material Properties for the Finite Element Modeling of Wood Baseball Bats" Applied Sciences 8, no. 11: 2256. https://doi.org/10.3390/app8112256
Note that from the first issue of 2016, this journal uses article numbers instead of page numbers. See further details here.