Adsorption of Nonylphenol to Multi-Walled Carbon Nanotubes: Kinetics and Isotherm Study


1
Graduate Institute of Environmental Engineering, National Taiwan University, Taipei 10637, Taiwan
2
Carbon Cycle Research Center, National Taiwan University, Taipei 10637, Taiwan
3
Department of Civil and Environmental Engineering, University of Delaware, Newark, DE 19716, USA
4
Department of Environmental Engineering, University of Seoul, Seoul 02504, Korea
*
Authors to whom correspondence should be addressed.
Appl. Sci. 2018, 8(11), 2295; https://doi.org/10.3390/app8112295
Submission received: 8 October 2018
/
Revised: 6 November 2018
/
Accepted: 7 November 2018
/
Published: 19 November 2018
(This article belongs to the Special Issue Multi-Walled Carbon Nanotubes)
Abstract
:We explored the occurrence and distribution of nonylphenol (NP) in 13 Taiwanese source waters. From all the surveyed waters, NP was detected at a high concentration, which could be attributed to contamination by wastewater discharges. In this study, we applied modified multi-walled carbon nanotubes (MWCNTs) for removing NP from aqueous solution. The impact of a few experimental factors, i.e., pH, contact time, MWCNTs dose, and temperature on the NP removal efficiency of modified MWCNTs was studied. The maximum adsorption capacity of the MWCNTs was observed to be 1040 mg NP/g when the initial NP concentration was 2.5 mg/L, and the solution pH was 4. The adsorption process followed the Elovich kinetics and the Elovich isotherm, indicating it is multilayer adsorption. The thermodynamic analysis demonstrated the NP adsorption by MWCNTs was thermodynamically satisfactory and, for the most part, endothermic as in the case of phenol adsorption. The result of the current study demonstrated the significance of free binding sites and the pore size of MWCNTs in the NP adsorption. This paper will help to better comprehend the adsorption behavior and mechanism of alkyl phenolic compounds onto MWCNTs.
1. Introduction
Nonylphenol (NP), a hydrophobic contaminant, has frequently been found in surface water, groundwater, sediment, and soil [1,2]. It is a significant byproduct of a non-ionic surfactant, nonylphenol polyethoxylate, which is used as an ingredient of pesticides and personal care products, lubricating additive, the catalyst in curing agent of epoxy resin, defoamer in industrial laundries and dispersant in paper industries [2,3,4]. Nonyl phenol has a similar structure to natural estrogen, so it can mimic characteristic hormones by making a connection with estrogen receptors in the environment, which is highly toxic to fish, microorganisms, and aquatic plants. Additionally, the presence of NP in the human body will reduce sperm count and immunity and can cause breast and testicular cancers. Thus, NP has been listed as a priority substance in the EU Water-Framework Directive [5]. As a result, NP has been replaced by alcohol polyethoxylates in the most European, Canadian, and Japanese industries [1,4]. However, alcohol polyethoxylates are expensive and less efficient in general, which boosts the illegal production and usage of NP. Moreover, inadequate NP removal by wastewater treatment plants (WWTPs) results in a high NP concentration in the aquatic environment [6].
In general, the treated wastewater discharged from industrial parks in the Asian region including China, Indonesia, Korea, Laos, Malaysia, Taiwan, Thailand, and Vietnam contains a higher concentration of NP than that in the European Union, America, and Japan [6,7,8]. Table S1 summarizes the levels of NP detected in several major Asian rivers [6,7,9,10,11,12,13,14,15,16,17,18,19,20,21,22,23,24,25,26,27,28]. Generally, these rivers flow by industrial parks and WWTPs, which are the potential sources of NP. It is a great challenge to estimate the exact contribution by each industrial source to NP pollution of water environment, because of other significant sources such as municipal sewage, agriculture runoffs, and animal wastes [7,29]. According to the Taiwan Construction and Planning Agency Ministry of the Interior (CPAMI), only about 50% of the municipal wastewater is treated in 2018 [30].
Adsorption onto sludge particulates [5], biological treatment [31], chemical treatment [32], photocatalysis [33], electrochemical degradation [34], volatilization [5], and ozonation [35] have been applied for the removal of NP from wastewater. Among the technologies, adsorption has been considered as an important option because of the unique physicochemical properties of NP such as low water solubility and a high log KOC value [3,36].
Recently, carbon nanotubes (CNTs) have received much attention as an adsorbent because of its large surface area, highly porous and hollow structure, light mass density, and strong interaction with hydrophobic organic compounds such as NP [37,38]. On the other hand, spent CNTs can be readily regenerated thermally, chemically, or biologically, so it can be readily reused.
In the present investigation, NP in water samples, which were collected from source waters for 13 Taiwanese water treatment plants (WTPs), was adsorbed to modified multi-walled CNTs (MWCNTs); the kinetics and isotherm equilibrium of the adsorption process were studied. In particular, the influence of different experimental parameters, i.e., water pH, MWCNT dose, contact time, and temperature on the adsorption process.
2. Material and Method
2.1. Materials
Nonyl phenol standard was purchased from Sigma Aldrich (Saint Louis, MS, USA). Multi-walled carbon nanotubes of reagent grade were acquired from Kuang-Yuan Biochemistry Technology (New Taipei City, Taiwan). All other chemicals used in this study are of reagent grade and were also purchased from Sigma Aldrich (Saint Louis, MO, USA). N2 of 99.99% purity was bought from Shinn Hwa Gas (Taipei, Taiwan). Table 1 summarizes the general properties of NP and MWCNT used in this study. The surface area and pore volume of the MWCNTs were 122 m2/g and 0.44 cm3/g, respectively.
The purchased MWCNTs were pretreated by HNO3 solution (65%) at 120 °C for 40 min to remove metal impurities from the surface of the MWCNTs. The treated MWCNT samples were, then, washed with deionized (DI) water to remove excess HNO3, which was carried out by refluxing the solution with MWCNTs in an ultrasonic cleaning bath at 80 °C for 2 h. Ultrasonication treatment also helps to remove amorphous carbons from the MWCNTs. Finally, the treated materials were filtered through a glass fiber filter (GC-50, Advantec, Taipei, Taiwan) to harvest modified MWCNTs.
2.2. Water Sample Preparation
Raw water samples were collected at the source water for each of 13 WTPs in Taiwan (2009–2015). Produced water samples were also collected from the 13 plants. As soon as they were collected, the water samples were filtered with a cellulose acetate membrane filter (0.22–0.45 μm, Merck, Taipei, Taiwan). After filtration, samples were acidified to pH 4.0 using 2 N sulfuric acid and kept at 4 °C.
2.3. Instrumentation and Techniques
The surface morphology of the modified MWCNTs was obtained by a scanning electron microscope (SEM, FEI Quanta 200 Environmental Scanning Electron Microscope, Hillsboro, OR, USA) and a transmission electron microscope (TEM, JEM-1400 Transmission Electron Microscope, Peabody, MA, USA). The zeta potential of the MWCNTs during modification at different pHs (1–11) was measured by a zeta analyzer (Brookhaven BI-90 Plus Particle Size Analyzer, Champaign, IL, USA). Using the BET surface area analyzer (Beckman Coulter SA3100 Surface Area Analyzer, Indianapolis, IN, USA), the surface area and pore size of the modified MWCNTs were analyzed. Nonyl phenol in water samples was extracted by solid phase extraction (SPE) and subsequently quantified by high-performance liquid chromatography-mass spectrometry (HPLC-MS) [40]. The SPE was carried out according to the method proposed by Lin and Tsai [41]. Briefly, the Oasis HLB SPE cartridge (500 mg, 6 mL, Waters, Milford, MA, USA) which was first pretreated with methanol and deionized water of 6 mL each. Then, a water sample of 400 mL with 13C6-sulfamethazine (use as a surrogate) added were loaded to the cartridge at 3–6 mL/min. After a sample loaded, the cartridge was rinsed with 6 mL DI water and dried with N2 gas. Then, analytes were eluted with 4 mL methanol and 4 mL methanol-diethyl ether (1:1 ratio, 50:50, v/v). The eluates were collected to pass for drying with N2 gas and reconstituted in 0.4 mL of 25% aqueous methanol. Finally, the obtained liquid was filtered through a 0.45 µm PVDF membrane before the HPLC-MS/MS analysis.
2.4. Batch Adsorption Experiments
In the present investigation, all experiments were carried in a batch mode. In the adsorption isotherm experiments, 10 mL of 2.5 mg/L NP was introduced into a centrifuge tube containing different concentrations (0.5–10 mg/L) of adsorbate. The tube was, then, tightly closed with a Teflon-lined screw cap and shaken at 150 rpm at 25 ± 1 °C over 24 h to reach equilibrium. To study the pH dependency of the adsorption, pH (2–10) of the mixture was adjusted by adding 0.1 M HCl/NaOH solution. Once equilibrium was reached, the adsorbent (i.e., MWCNTs) was separated from the solution using a 0.2-µm membrane filter, and the residual NP concentration was analyzed. For the case of kinetic study, samples were collected after 0.5, 1, 2, 4, 7, 8, 10, 12 and 14 h of reaction, and residual NP concentration of each sample was analyzed. All the experiments were performed three times to determine averages and standard deviations; in fact, the calculated c.v. for each set of experiments was within ±3%.
3. Result and Discussion
3.1. NP Concentrations of the Source and Treated Water Samples
As shown in Figure 1, water samples were collected at various locations covering the whole area of Taiwan, including Ban-shin (A), Bao-shan (B), Bei-dou (C), Carp Lake (D), Chan-shin (E), Chen-chin Lake (F), Dong-shin (G), Feng-shan (H), Feng-yuan (I), Kao-tan (J), and Kin-men (K), Nan-hua (L) and Shin-shan (M). All of them are important source waters of Taiwan, so each of them is withdrawn to a nearby WTP. Raw water and produced water samples were collected 2 to 19 times in 2009–2015.
The NP concentration of each source water is provided in Supporting Information (Table S2). Different unit processes, namely, rapid filtration, pre-chlorination, coagulation/sedimentation, pre-ozonation, post-chlorination, granular activated carbon, ultrafiltration, and low-pressure reverse osmosis, are employed in combination at each of the WTPs (Table S2).
The result shows that NP concentration was in the range from below detection limit to several hundred ng/L for most of the treatment plants (Figure 1). The maximum NP concentration of 986 ng/L was found at the source water of the Site-M, which consists of conventional processes such as pre-chlorination, coagulation/sedimentation, rapid filtration, and post-chlorination. While the range of NP concentrations of source water was found from 46.1 to 986 ng/L, that of produced water (after conventional treatments) was from below detection limit to 117 ng/L, respectively (as shown in Table S2). It was observed that the NP concentration was not varying significantly at the two sites, i.e., Sites-F and -E. On the other hand, the water samples collected from the Sites-I and -L did not show NP; the concentration was below the detection limit. The high NP contents of the raw water samples collected from Sites-M, -B, -E and -H were attributed to discharge from municipal WWTPs and industrial parks [42].
3.2. Characterization of Adsorbent
The physical properties of MWCNTs, such as specific surface area, pore size distribution and pore volume, were modified via acidification and summarized in Table 2. The acidification increased the surface area, average pore diameter and pore volume of the MWCNTs. Probably, amorphous carbons were removed from the structure by the acidification to open the pores of MWCNTs. While the SBET of the modified MWCNTs was comparable with those reported by others [43,44,45], the pore volume was much higher; 0.81 cm3/g was obtained (Table 2). HNO3 treatment reduced metals on the surface of MWCNTs and created new acidic sites, which dominate the roughness of the MWCNTs [46].
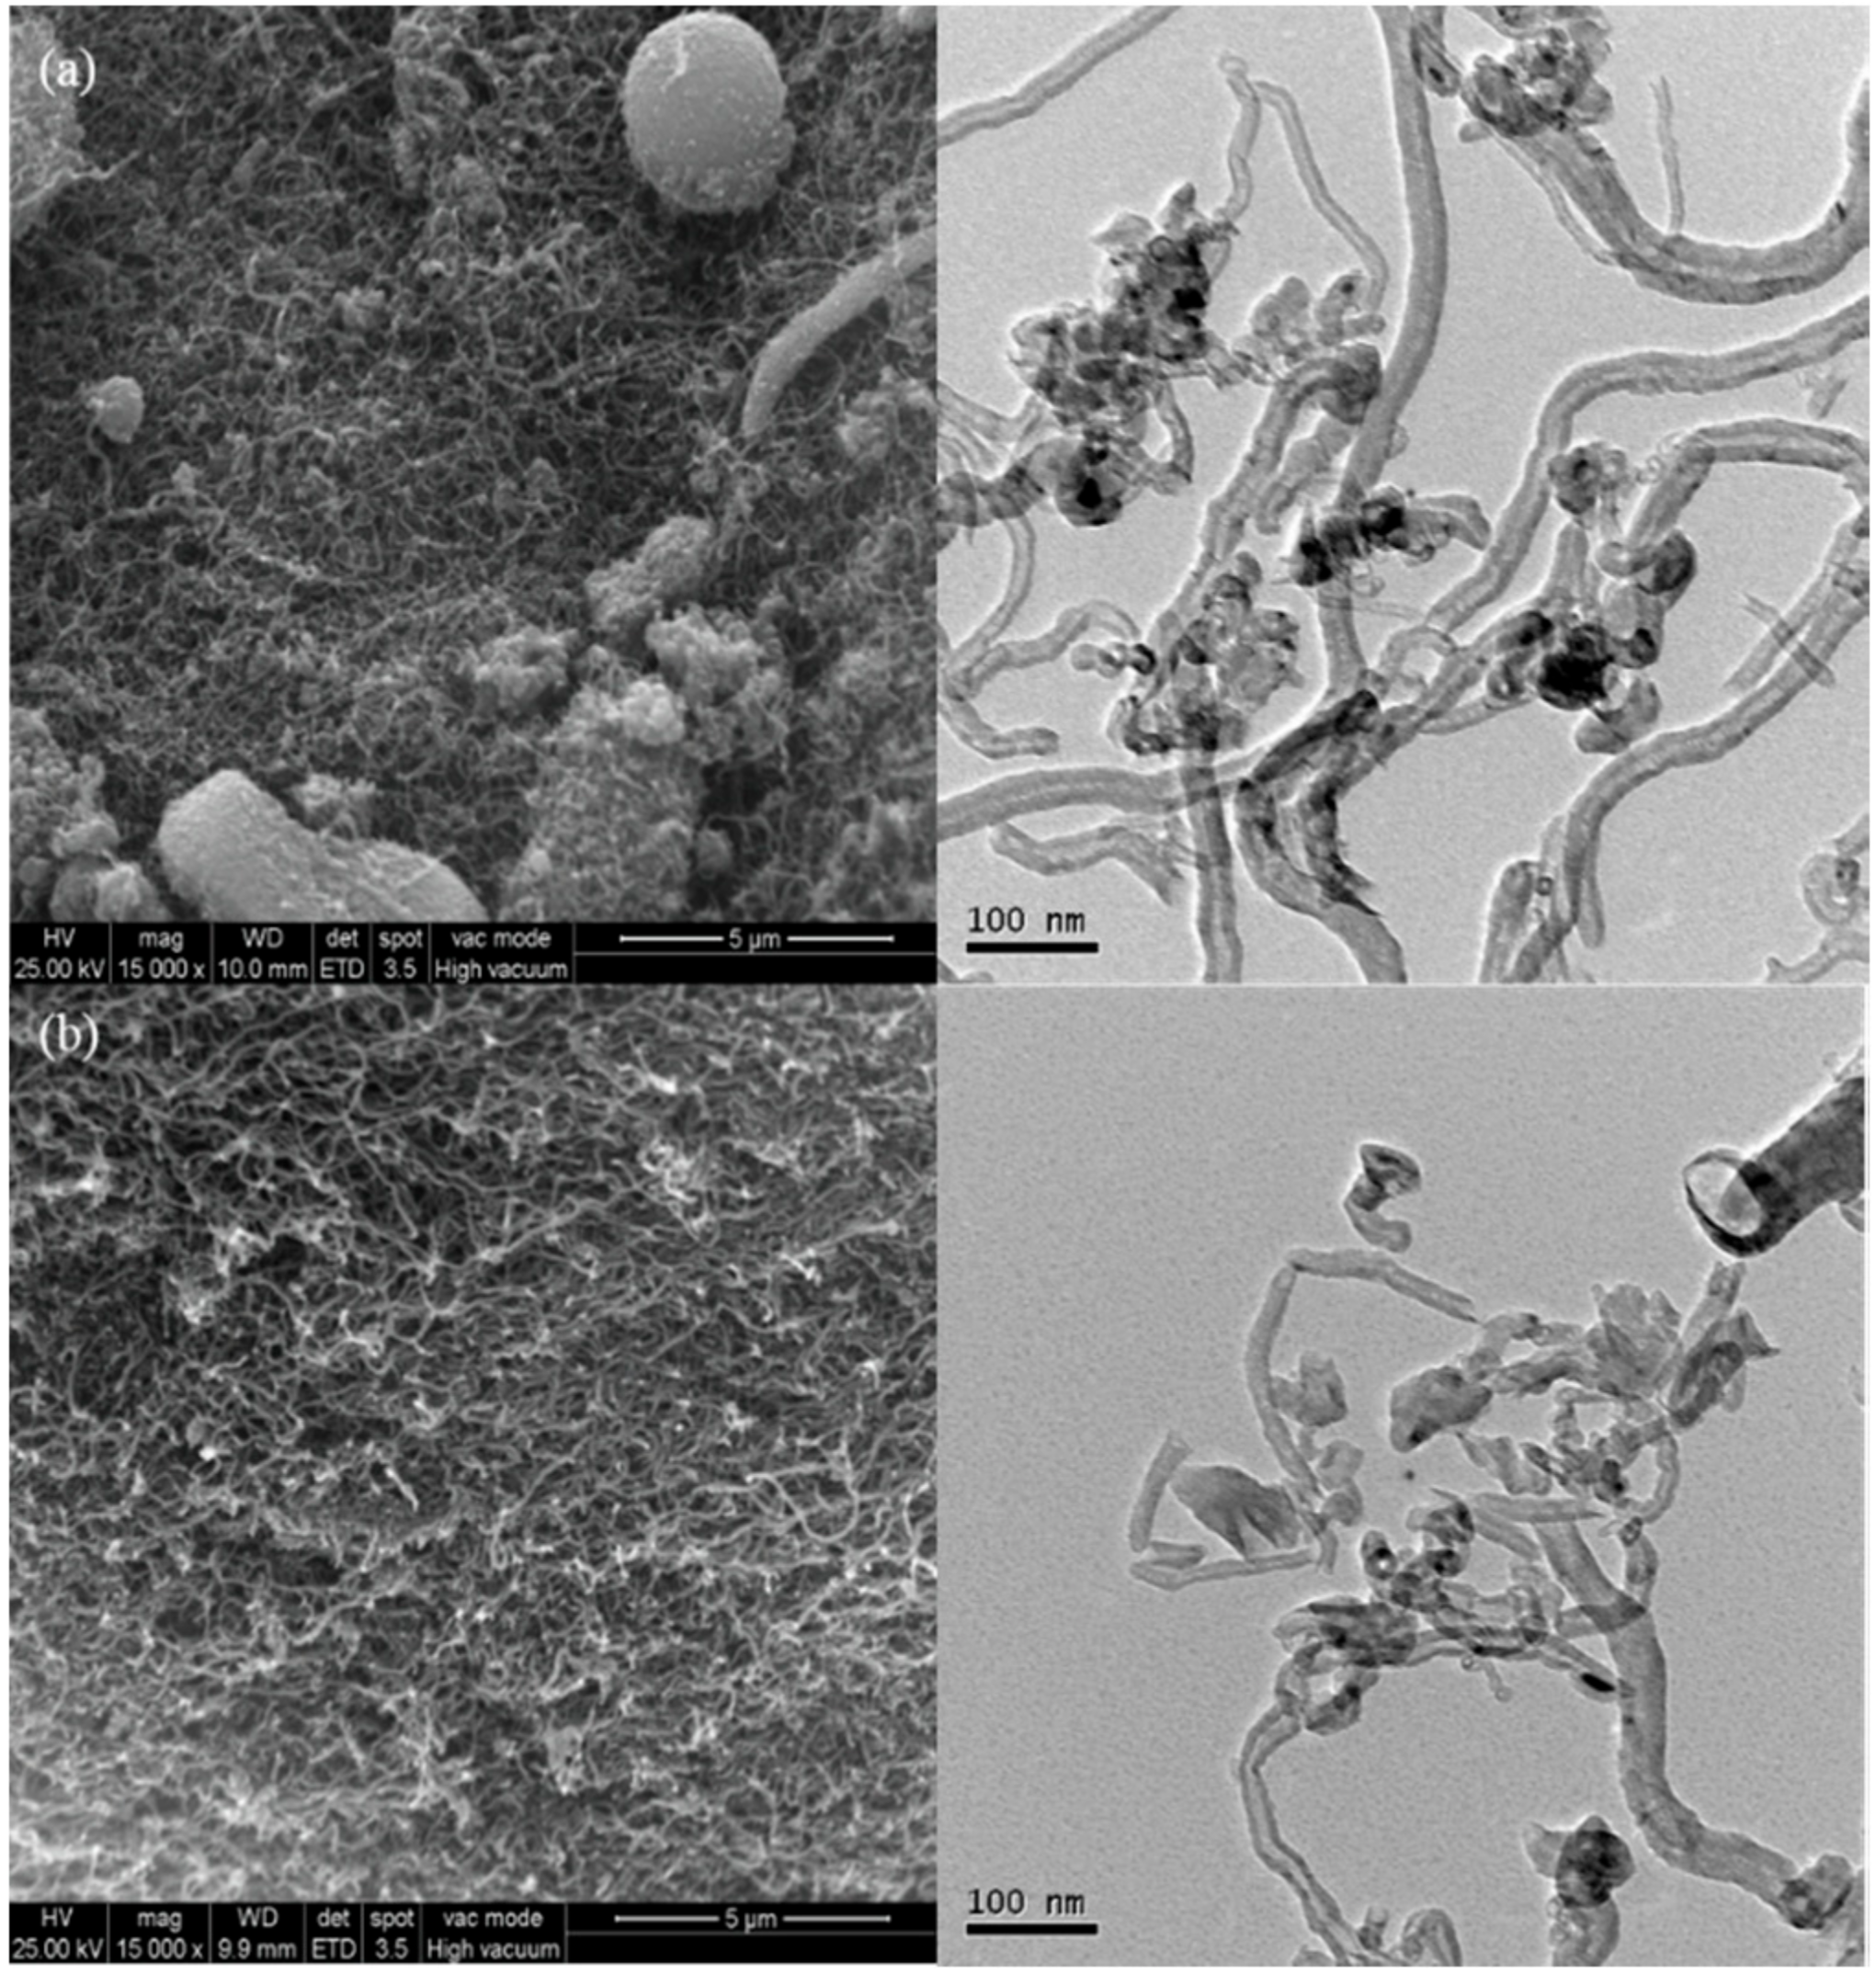
Figure 2a gives the SEM (left) and TEM (right) images of raw MWCNTs, respectively. It can be observed that raw MWCNTs shows typical tubular structure morphology, with a length of 5–15 nm. Figure 2b shows the morphology of the modified MWCNTs. The result shows the tubular structure morphology of the modified MWCNTs that has no particle on its surface. The TEM image presents the tubular structure of the raw MWCNTs (right of Figure 2a) and the modified MWCNTs samples (right of Figure 2b). These TEM images confirm the successful removal of metals from the MWCNT surface, which is consistent with the SEM observation.
Figure 3 shows the zeta potential of the modified MWCNTs as a function of pH which gives the point of zero-charge (ZPC); the ZPC was observed at pH 2.3 (=pHzpc). The zeta potential of the modified MWCNTs was negative in the neutral pH range (Figure 3), indicating that the surface of the MWCNTs was negatively charged. In comparison, the zeta potential of the modified MWCNTs was positive at acidic pHs.
3.3. Effects of pH and MWCNTs Concentration on NP Removal
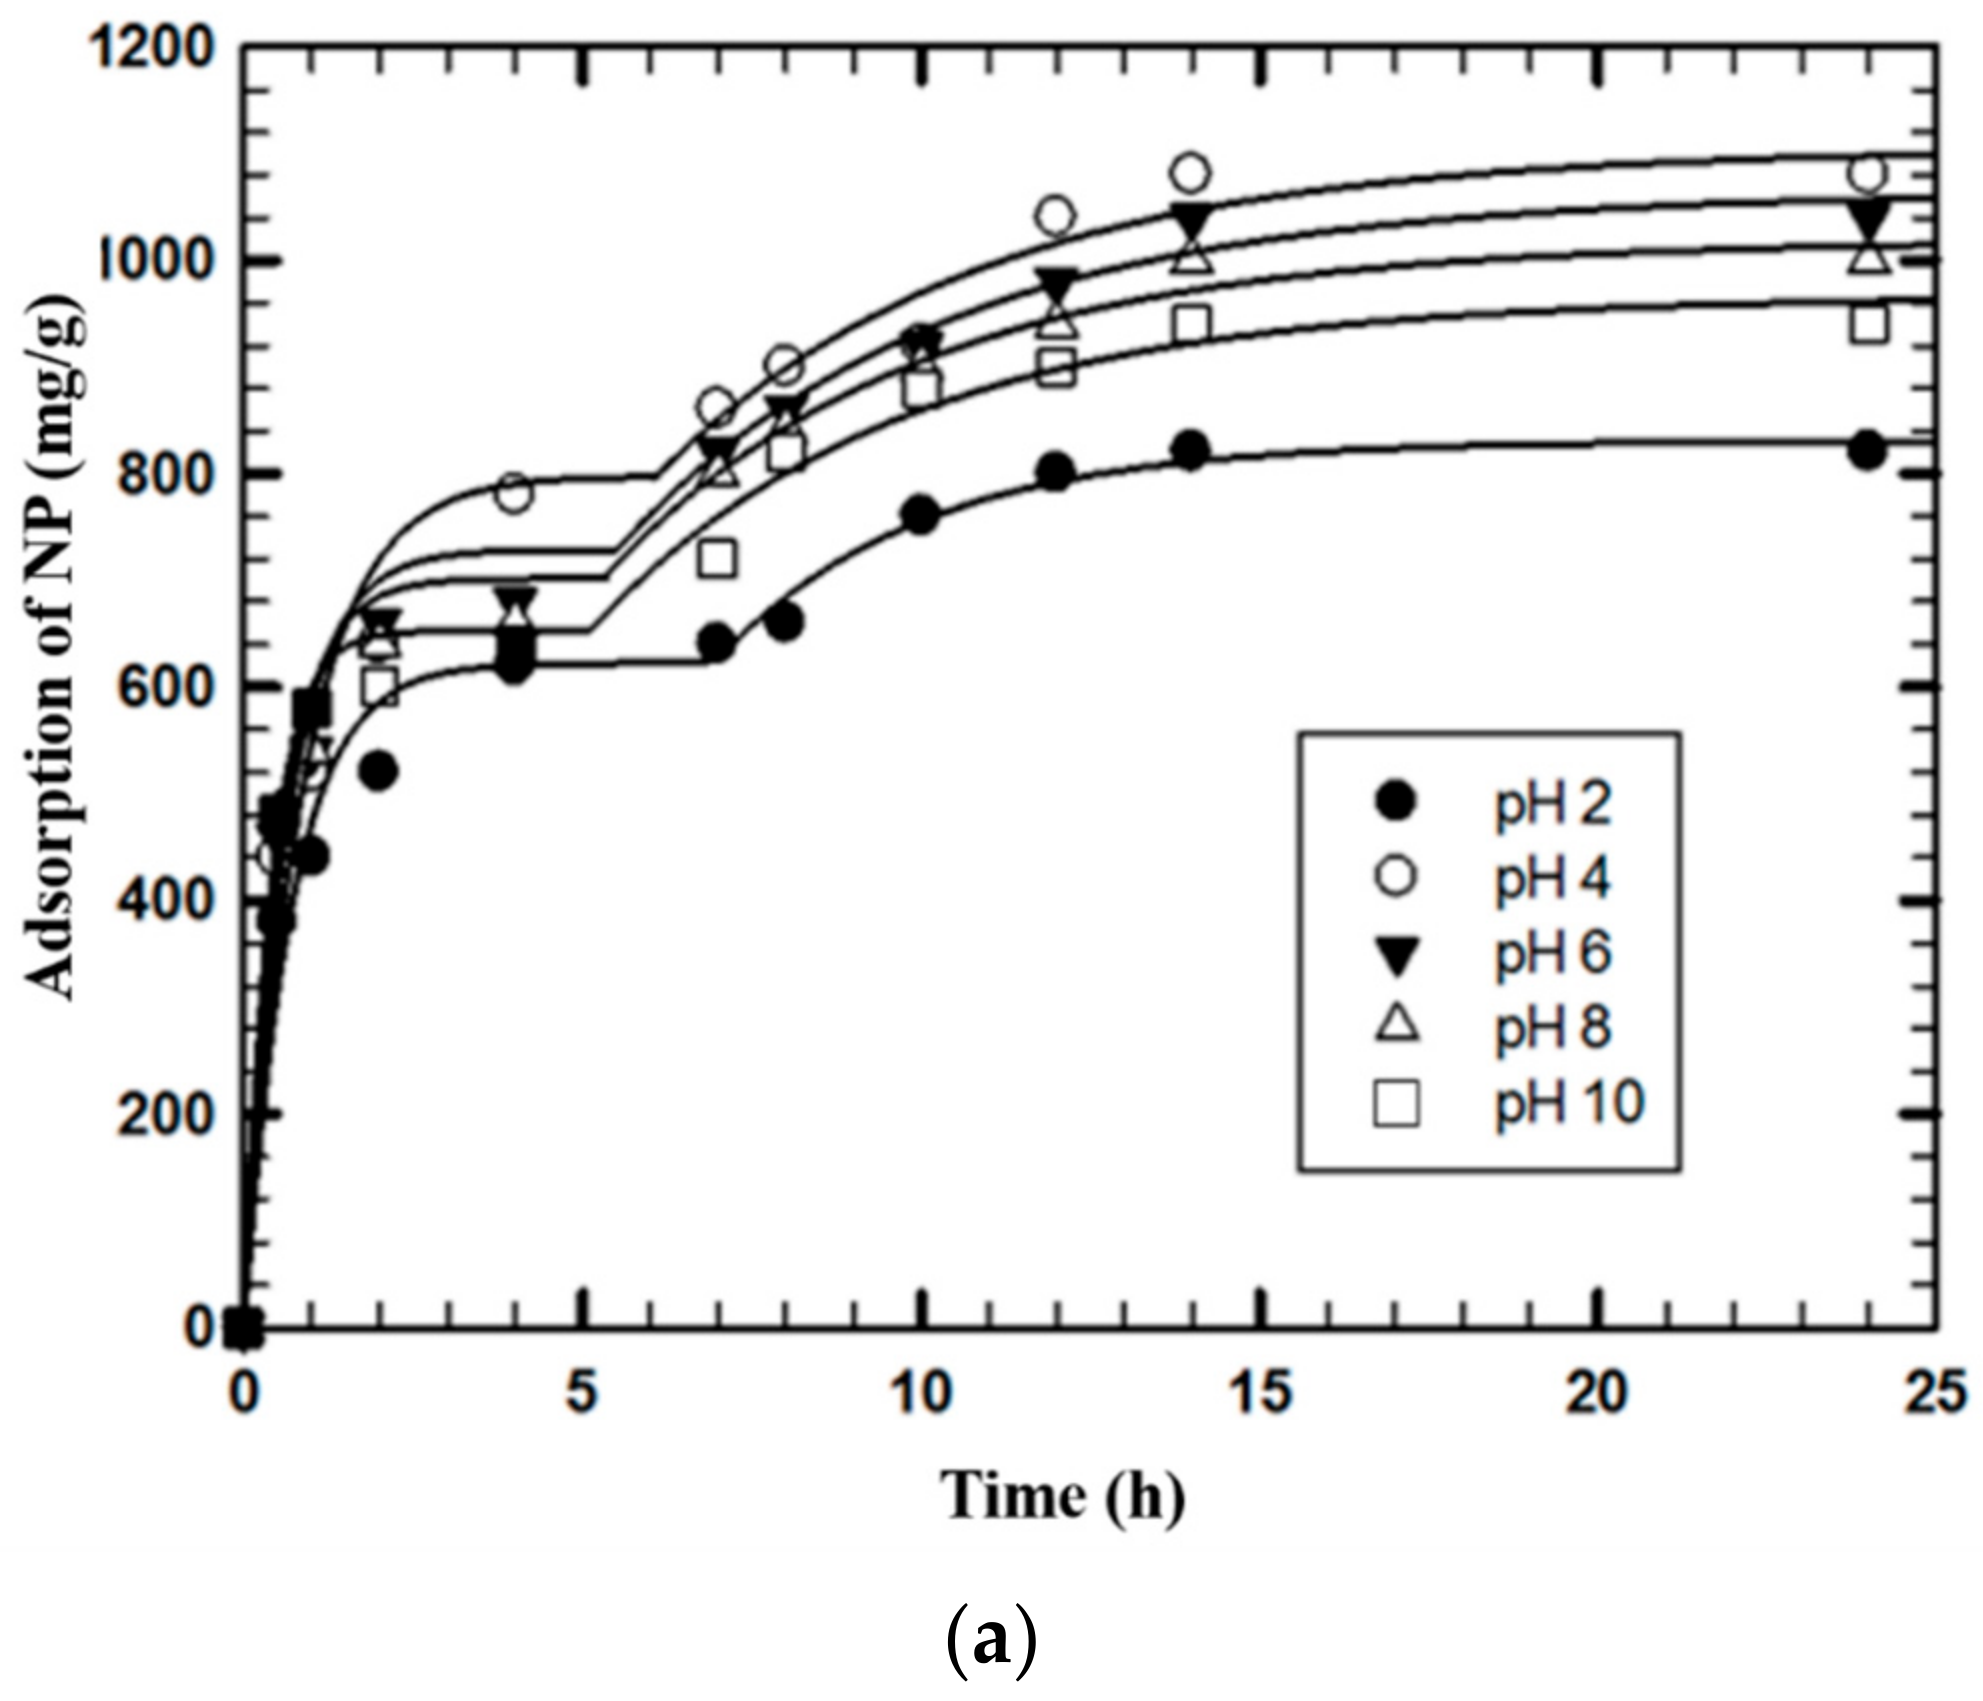
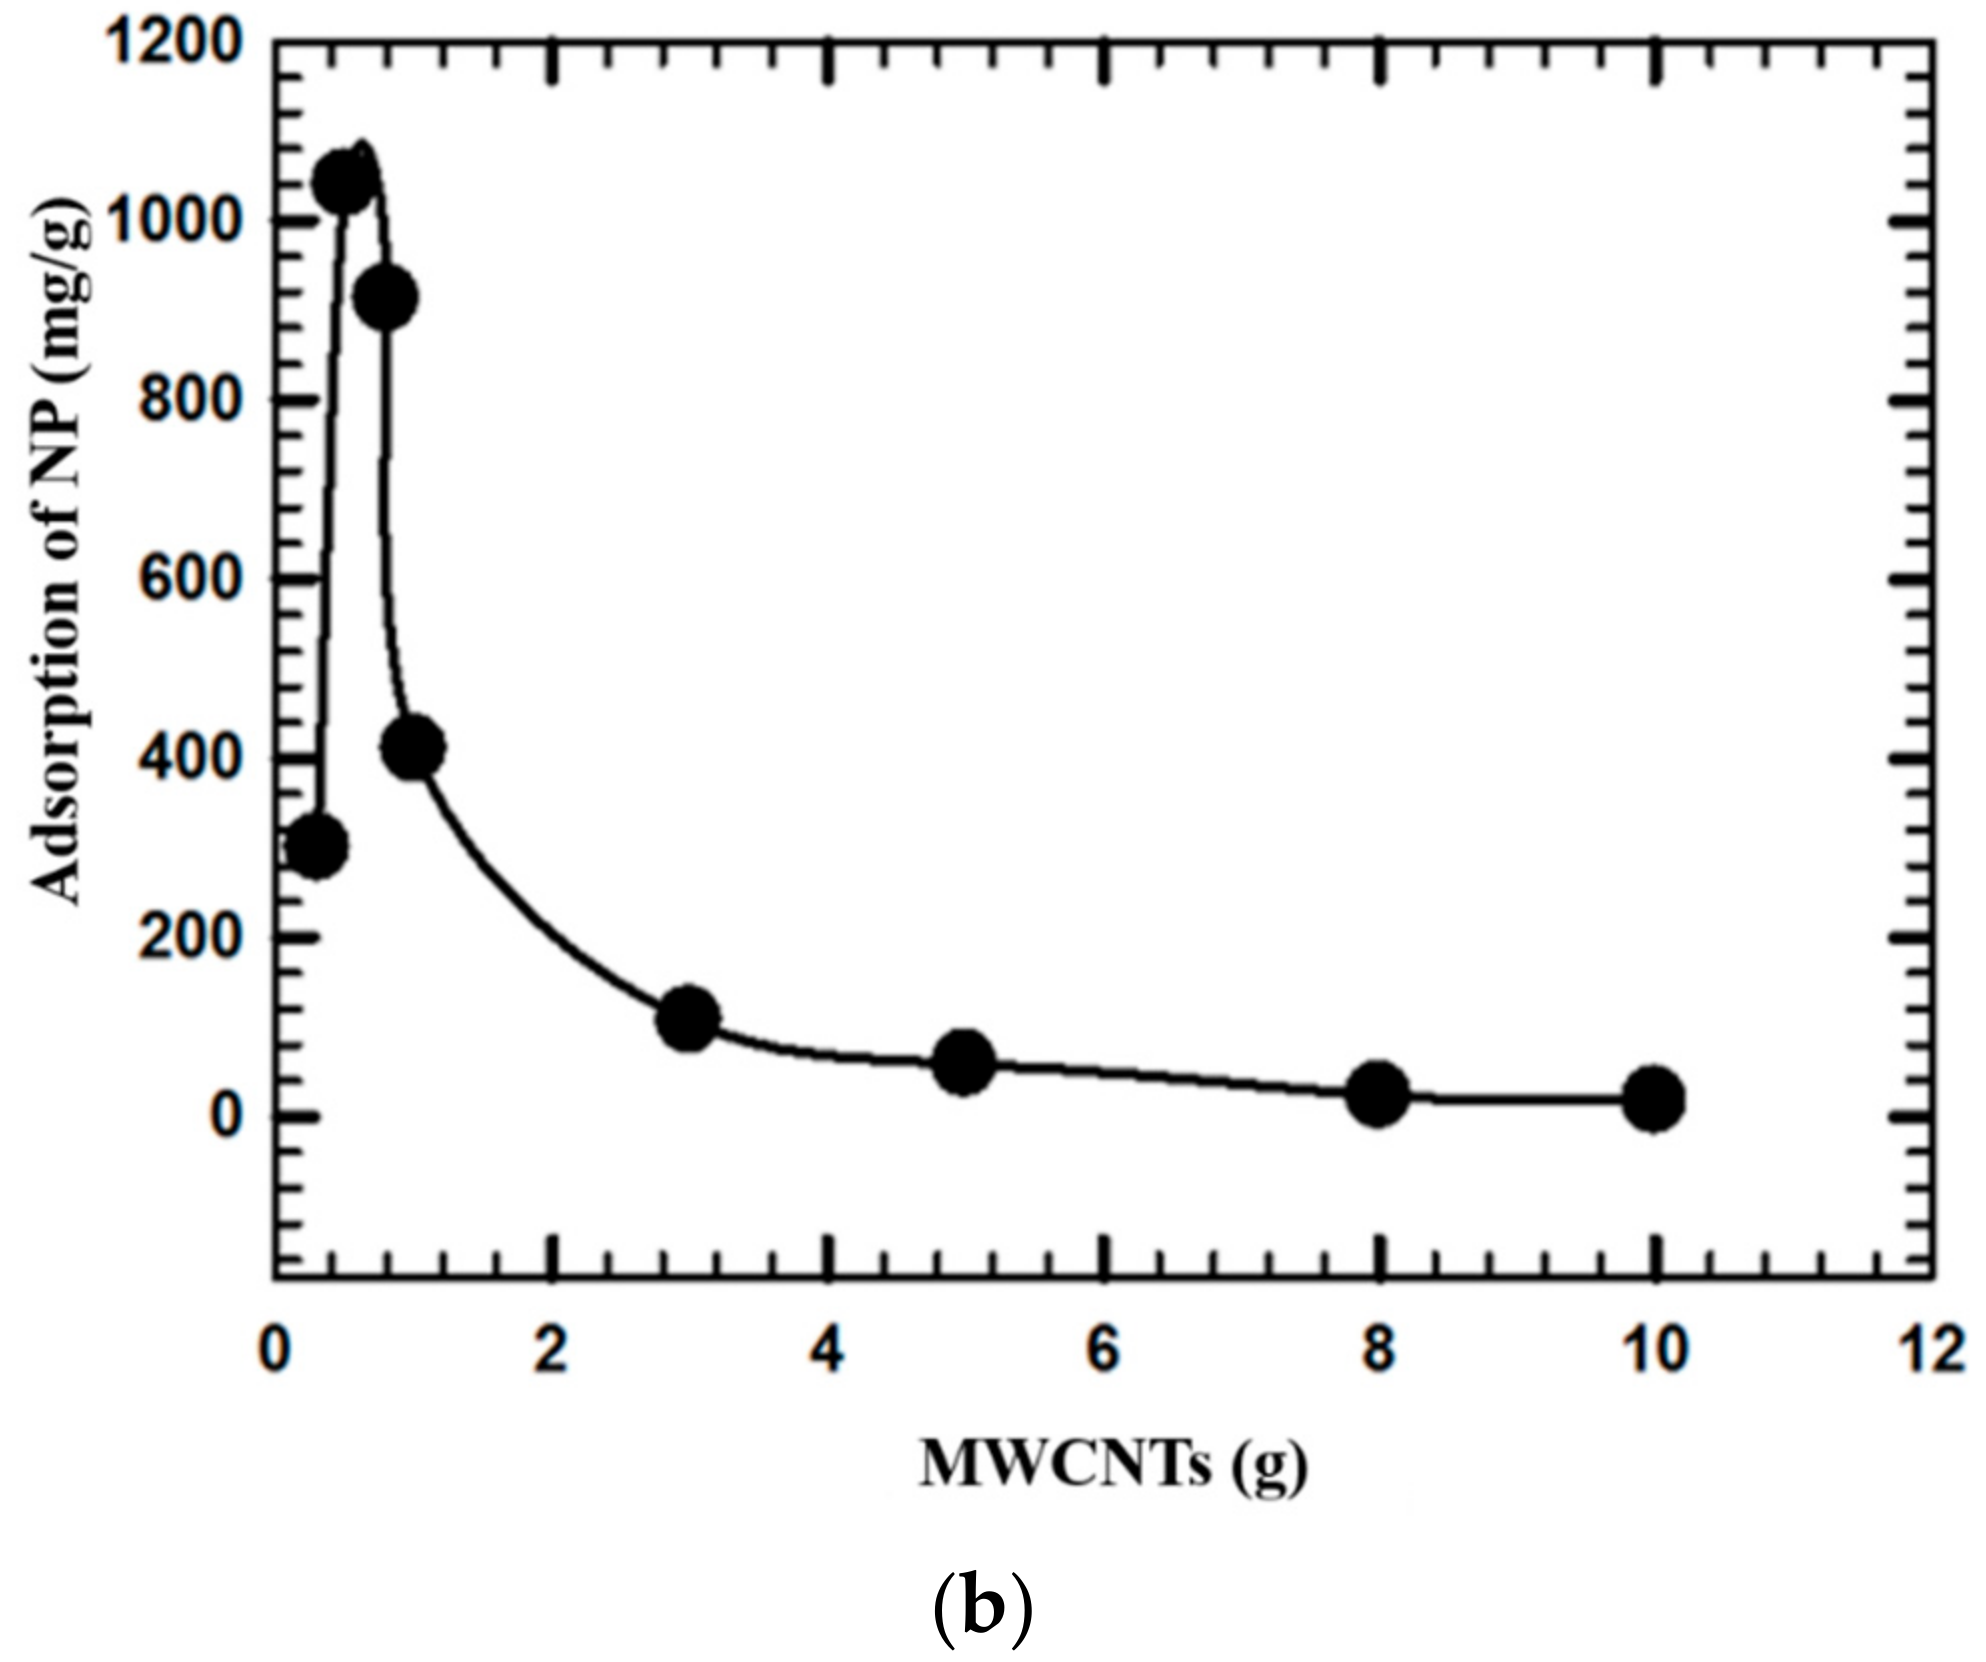
Figure 4a clearly shows the influence of pH on the NP removal. At alkaline pHs, NP adsorption decreased. The obtained results are in line with previously obtained ones that deprotonation of organic molecules (phenolic) took place and promoted diffusions [49]. Considering pHzpc of the modified MWCNTs (i.e., 2.3) and pKa of NP (i.e., 10.7; [39]), at neutral pHs (e.g., 4–10), the adsorption of NP onto the MWCNTs is favored due to the weak electrostatic interaction and H-bond formation between the negatively charged MWCNTs and NP. Figure 4b demonstrates the effect of the modified MWCNTs dosage (0.1 to 10 mg/L) on NP adsorption at pH 4. As the MWCNTs concentration increased, the NP adsorption increased to some extent possibly due to increased free binding sites. As shown in Figure 4b, the highest adsorption capacity of the modified MWCNTs for NP was estimated at 1040 mg/g at pH 4 and 25 °C. In any case, the adsorbent mass higher than 0.5 mg/L did not further improve the adsorption. Therefore, the modified MWCNTs of 0.5 mg/L was used in the following batch experiments.
3.4. Adsorption Kinetics
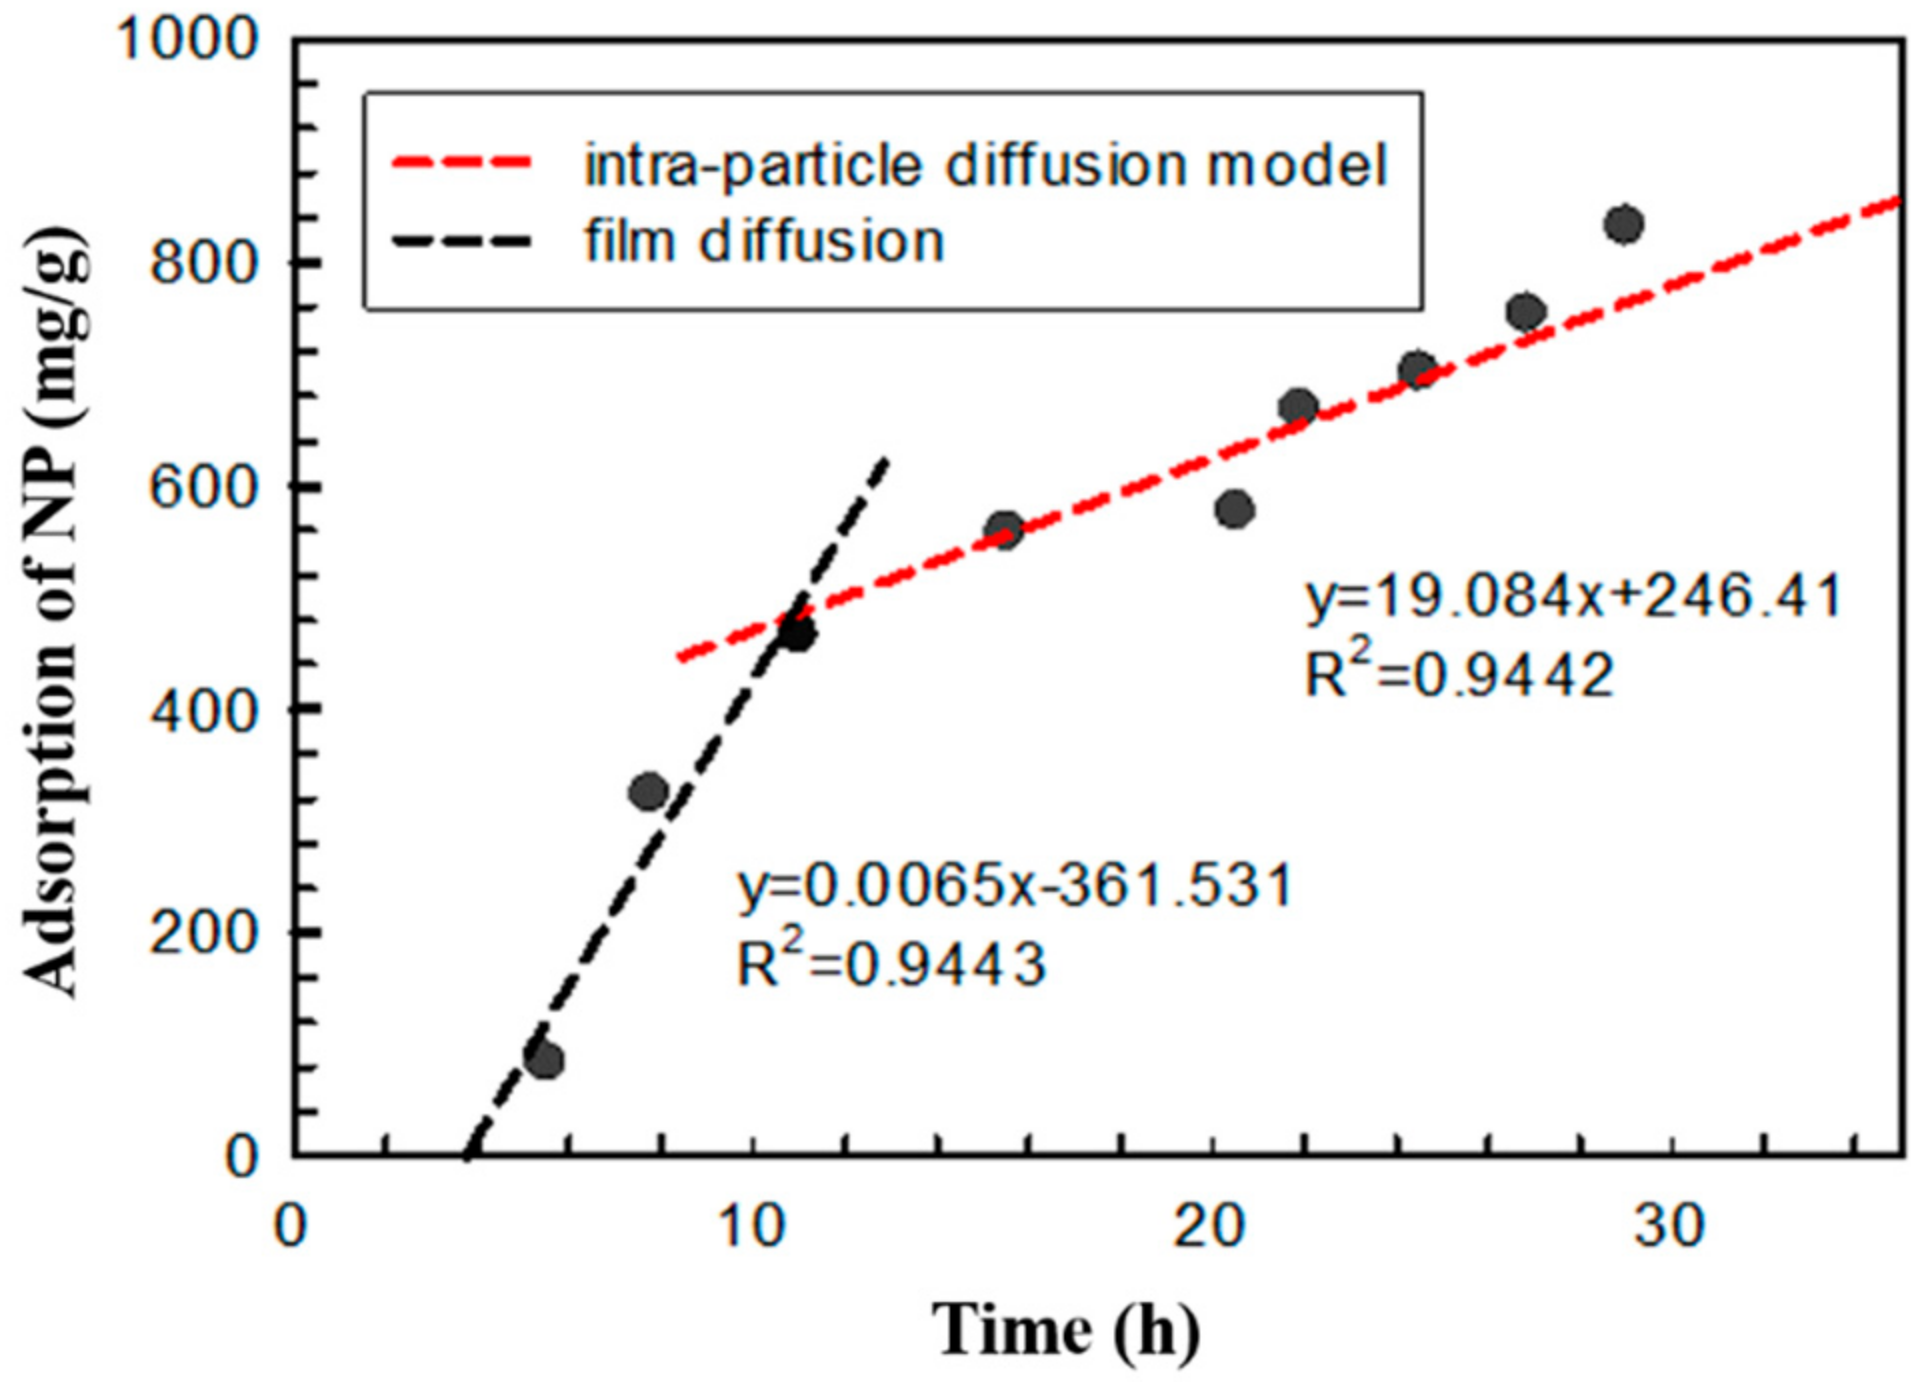
Figure 5 shows the kinetics of NP adsorption onto the modified MWCNTs. The obtained result shows that the equilibrium is established in 14 h (Figure 4a). In the beginning, the rate of adsorption was high probably due to a large number of free surface sites available on the MWCNTs. Afterward, the adsorption rate became slower and finally reached the equilibrium state. Thus, it could be concluded that free binding sites and affinity between the modified MWCNT and NP might be responsible for the NP adsorption, similar to the result from our previous study in which NP was adsorbed to clays and soil materials [50]. In fact, the kinetics profile from the current NP adsorption study is characterized with two linear regions; they are the liquid film diffusion layer and the intra-particle diffusion one [51]. The rate of NP adsorption in the liquid film diffusion layer is expressed as Equation (1):
where S0 is the particle surface area per unit particle volume, and kf is the rate constant.
The intra-particle diffusion model assumes that the adsorption density, qt, varies proportionally with t½, as shown in Equation (2),
where I and kid is the intercept and the intra-particle diffusion rate constant, respectively. The boundary layer effect is indicated by the initial high slope, and the intra-particle diffusion or pore diffusion is demonstrated by the less steep slope (Figure 5).
The NP adsorption capacity increases with the increase in the adsorbent surface area (S0) [45]. Moreover, the increase in the surface area of the adsorbent strongly correlates with the equilibrium adsorption capacity [49]. This kind of relationship has already been described in the literature [52]. It suggests that the pore-filling mechanism is mostly responsible for the adsorption. Generally, small-size organic compounds are responsible for pore-filling [43,53]. In addition, the octanol-water partitioning coefficient (log Kow), an indicator of hydrophobicity of an organic compound, plays an important role in the adsorption [1]. Therefore, the compound with a high log Kow (i.e., log Kow > 4) should exhibit a strong adsorption affinity towards the active binding sites of the adsorbent [1]. Since the log Kow of NP is 4.8–5.3 (Table 1), NP seems to have a strong adsorption affinity.
Table 3 lists the kinetics models that were applied for the NP adsorption to the modified MWCNTs. The coefficients of determination for the kinetics models are in the order of Elovich (R2 = 0.96) > pseudo-first order (0.93) > pseudo-second order (0.46).
The calculated qe value was not in agreement with the experimental data, indicating that the pseudo-second-order kinetic model may not explain the adsorption of NP onto the modified MWCNTs. Preferably, the experimental adsorption capacity data well fit to the Elovich model, which implies that the NP adsorption is governed by chemisorption processes [54].
3.5. Equilibrium Adsorption Isotherm
To examine the effect of the initial NP concentration on the adsorption capacity of the modified MWCNTs, the adsorption isotherm study was carried out. Table 4 shows the adsorption isotherm models applied for the adsorption of NP onto MWCNTs. The Langmuir [55], Freundlich [56], Jovanovic [57], Elovich [54] and Temkin [58] models were respectively employed to fit the adsorption data, and the result is summarized (Table 4).
In short, Freundlich, Jovanovic, Temkin, and Elovich models fitted the data better than the Langmuir. The maximum NP adsorption capacity (qmax, mg/g) of the modified MWCNTs estimated using the Langmuir model at pH 2 and 293 K was 1.11 × 10⁴ mg/g. On the other hand, a much higher qmax value (i.e., 25,000 mg/g) was estimated by the Elovich isotherm. Furthermore, the calculated adsorption data matched well with the observed ones. The current result demonstrated that the adsorption of NP onto the modified MWCNTs is multilayer (chemisorption) rather than Langmuir-mono-layer.
3.6. Thermodynamic Aspects
Temperature affects the adsorption capacity of an adsorbent. It was observed that the amount of NP adsorbed increased as temperature increased, indicating an endothermic process. To evaluate the spontaneity of the adsorption process, the thermodynamic parameters, i.e., changes in the Gibb’s free energy (∆G°, kJ/mol), the enthalpy (∆H°, kJ/mol), and the entropy (∆S°, kJ/mol/K) of the process were calculated by Equations (3)–(5):
where R is the universal gas constant (8.314 × 10⁻³ kJ/mol·K), and T is the absolute temperature (K). The KL (L/g), equilibrium constant, is calculated from the Langmuir constant, qm [55]. The value of ∆G° was calculated from Equation (3), while ∆H° and ∆S° were estimated from the slop and intercept of the graph (straight line) of ((1/T) vs. ln K) (Figure S2). The values of various thermodynamic parameters for the NP adsorption onto the modified MWCNTs are presented in Table 5.
The negative ∆G° values suggest that the adsorption of NP onto the MWCNTs is spontaneous. The ∆G° value negatively increases as the temperature increases. This indicates that the adsorption is more favorable at a higher temperature from the thermodynamics point of view (values of KL increased from 1.47 to 2.29). Additionally, the ∆H° and ∆S° values are all positive, indicating the NP adsorption onto the modified MWCNTs is endothermic at the temperature range of 288–318 K.
From the adsorption and kinetics data, the following three important factors governing the adsorption of NP onto the modified MWCNTs can be drawn; they are (1) physical properties of the adsorbent, i.e., size, shape, surface area, impurities, functional group, and pore size; (2) environmental condition, i.e., pH; (3) π–π interaction between the MWCNTs and NP. In this study, the physical properties of MWCNTs were improved by acidification, which renders the modified MWCNTs surface acidic. In addition to the physical properties, relatively high pKa and Kow values (hydrophobicity) of NP might enhance the interaction between ions/compounds with the modified MWCNTs. Finally, the hydrogen-bond formation was observed between -H of the carbonyl group on the modified MWCNTs and the –OH group of NP. Therefore, H-bond might be a key mechanism responsible for the NP adsorption in this study. In particular, the H and O contents were higher in the modified MWCNTs compared with pristine MWCNTs.
4. Conclusions
In this study, the occurrence of NP in 13 sites of Taiwan from 2009 to 2015 has been comprehensively investigated. The concentration of NP was habitually distinguished at a critical level in Taiwan surface water, especially in 12 of 13 investigated source waters, indicating the traditional water treatment processes are not effective.
Using modified (acid treated) MWCNTs as an adsorbent may be advantageous in future for removal of NP due to its higher surface area and specific surface functionality. The highest NP adsorption capacity on MWCNTs was 1040 mg/g at initial NP concentration of 2.5 mg/L at pH 4. The adsorption process was found to follow the Elovich kinetics model and the Elovich isotherm model, implying that the NP adsorption onto MWCNTs is a multilayer. Three factors namely, physical properties of the adsorbent, environmental conditions, and interaction of the adsorbent with NP are considered as the governing factors for the adsorption process. Also, a result of the thermodynamic analysis shows that the adsorption is endothermic and depends on the solution temperature. In short, all the obtained results indicate that the acidified MWCNTs can be employed successfully for the removal of NP from aqueous solution.
Supplementary Materials
The following are available online at https://www.mdpi.com/2076-3417/8/11/2295/s1, Figure S1: Adsorption kinetics equation of NP. Experimental conditions: [NP] = 2.5 mg/L, T = 25 °C, [MWCNTs] = 0.5 mg/L, Figure S2: Plot of ln (K) versus 1/T (van’t Hoff plot) for various temperature from 288 K to 318 K, [NP] = 2.5 mg/L and [MWCNTs] = 0.5 mg/L, Table S1: The concentration level of NP in various Rivers of Asian Region; Table S2: The concentration of Nonylphenol in Public Water Supply Systems (from 2009 to 2015).
Author Contributions
All the authors equally contributed to this manuscript.
Funding
The authors wish to thank the Ministry of Science and Technology (MOST) of Taiwan (R.O.C.) for the financial support under grant number MOST 107-3113-E-007-002. H. Kim is is financially supported by Korea Environmental Industry & Technology Institute (2015001790002).
Conflicts of Interest
The authors declare no conflict of interest.
References
- Soares, A.; Guieysse, B.; Jefferson, B.; Cartmell, E.; Lester, J.N. Nonylphenol in the environment: A critical review on oCcurrence, fate, toxicity and treatment in wastewaters. Environ. Int. 2008, 34, 1033–1049. [Google Scholar] [CrossRef] [PubMed]
- Ferrara, F.; Ademollo, N.; Delise, M.; Fabietti, F.; Funari, E. Alkylphenols and their ethoxylates in seafood from the Tyrrhenian sea. Chemosphere 2008, 72, 1279–1285. [Google Scholar] [CrossRef] [PubMed]
- Groshart, C.P.; Okkerman, P.C.; Wassenberg, W.B.A.; Pijnenburg, A.M.C.M. Chemical study on alkylphenols. In RIKZ Report 2001.029; Nat. Inst. Coast and Marine Management (RIKZ): The Hague, The Netherlands, 2001. [Google Scholar]
- Careghini, A.; Mastorgio, A.F.; Saponaro, S.; Sezenna, E. Bisphenol a, nonylphenols, benzophenones, and benzotriazoles in soils, groundwater, surface water, sediments, and food: A review. Environ. Sci. Pollut. Res. 2015, 22, 5711–5741. [Google Scholar] [CrossRef] [PubMed] [Green Version]
- Bouki, C.; Dvorakova, M.; Diamadopoulos, E. Adsorption of nonylphenol on activated sludge biomass under aseptic conditions. Clean Soil Air Water 2010, 38, 516–520. [Google Scholar] [CrossRef]
- Mao, Z.; Zheng, X.-F.; Zhang, Y.-Q.; Tao, X.-X.; Li, Y.; Wang, W. Occurrence and biodegradation of nonylphenol in the environment. Int. J. Mol. Sci. 2012, 13, 491–505. [Google Scholar] [CrossRef] [PubMed]
- Duong, C.N.; Ra, J.S.; Cho, J.; Kim, S.D.; Choi, H.K.; Park, J.H.; Kim, K.W.; Inam, E.; Kim, S.D. Estrogenic chemicals and estrogenicity in river waters of south Korea and seven Asian countries. Chemosphere 2010, 78, 286–293. [Google Scholar] [CrossRef] [PubMed]
- Chen, H.W.; Liang, C.H.; Wu, Z.M.; Chang, E.E.; Lin, T.F.; Chiang, P.C.; Wang, G.S. Occurrence, and assessment of treatment efficiency of nonylphenol, octylphenol and bisphenol-A in drinking water in Taiwan. Sci. Total Environ. 2013, 449, 20–28. [Google Scholar] [CrossRef] [PubMed]
- Derbalah, A.S.H.; Nakatani, N.; Sakugawa, H. Distribution, seasonal pattern, flux and contamination source of pesticides and nonylphenol residues in Kurose River water, Higashi-Hiroshima, Japan. GeoChem. J. 2003, 37, 217–232. [Google Scholar] [CrossRef]
- Li, D.; Kim, M.; Oh, J.R.; Park, J. Distribution characteristics of nonylphenols in the artificial Lake Shihwa, and surrounding creeks in Korea. Chemosphere 2004, 56, 783–790. [Google Scholar] [CrossRef] [PubMed]
- Li, D.; Kim, M.; Shim, W.J.; Yim, U.H.; Oh, J.R.; Kwon, Y.J. Seasonal flux of nonylphenol in Han River, Korea. Chemosphere 2004, 56, 1–6. [Google Scholar] [CrossRef] [PubMed]
- Kawahata, H.; Ohta, H.; Inoue, M.; Suzuki, A. Endocrine disrupter nonylphenol and bisphenol A contamination in Okinawa and Ishigaki Islands, Japan—Within coral reefs and adjacent river mouths. Chemosphere 2004, 55, 1519–1527. [Google Scholar] [CrossRef] [PubMed]
- Cheng, C.Y.; Wu, C.Y.; Wang, C.H.; Ding, W.H. Determination and distribution characteristics of degradation products of nonylphenol polyethoxylates in the rivers of Taiwan. Chemosphere 2006, 65, 2275–2281. [Google Scholar] [CrossRef] [PubMed]
- Xu, J.; Wang, P.; Guo, W.; Dong, J.; Wang, L.; Dai, S. Seasonal and spatial distribution of nonylphenol in Lanzhou Reach of Yellow River in China. Chemosphere 2006, 65, 1445–1451. [Google Scholar] [CrossRef] [PubMed]
- Fu, M.; Li, Z.; Gao, H. Distribution characteristics of nonylphenol in Jiaozhou Bay of Qingdao and its adjacent rivers. Chemosphere 2007, 69, 1009–1016. [Google Scholar] [CrossRef] [PubMed]
- Hong, L.; Li, M.H. Acute Toxicity of 4-Nonylphenol to Aquatic Invertebrates in Taiwan. Bull. Environ. Contam. Toxicol. 2007, 78, 445–449. [Google Scholar] [CrossRef] [PubMed]
- Motegi, M.; Nojiri, K.; Hosono, S.; Kawamura, K. Determination and evaluation of estrogenic contamination in an urban river basin. J. Environ. Chem. 2007, 17, 421–431, (In Japanese with English Abstract). [Google Scholar] [CrossRef]
- Wu, Z.; Zhang, Z.; Chen, S.; He, F.; Fu, G.; Liang, W. Nonylphenol and octylphenol in urban eutrophic lakes of the subtropical China. Fresenius Environ. Bull. 2007, 16, 227–234. [Google Scholar]
- Hong, S.; Won, E.J.; Ju, H.J.; Kim, M.S.; Shin, K.H. Current nonylphenol pollution and the past 30 years record in an artificial Lake Shihwa, Korea. Mar. Pollut. Bull. 2010, 60, 308–313. [Google Scholar] [CrossRef] [PubMed]
- Shue, M.F.; Chen, F.A.; Chen, T.C. Total estrogenic activity and nonylphenol concentration in the Donggang River. Taiwan. Environ. Monit. Assess. 2010, 168, 91–101. [Google Scholar] [CrossRef] [PubMed]
- Cherniaev, A.P.; Kondakove, A.S.; Zyk, E.N. Contents of 4-Nonylphenol in Surface Sea Water of Amur Bay (Japan/East Sea). Achiev. Life Sci. 2016, 10, 65–71. [Google Scholar] [CrossRef]
- Diao, P.; Chen, Q.; Wang, R.; Sun, D.; Cai, Z.; Wu, H.; Duan, S. Phenolic endocrine-disruptiong compounds in the Pearl River Estuary: Occurrence, bioaccumulation and risk assessment. Sci. Total Environ. 2017, 584–585, 1100–1107. [Google Scholar] [CrossRef] [PubMed]
- Watanabe, M.; Takano, T.; Nakamura, K.; Watanabe, S.; Seino, K. Water quality and concentration of alkylphenols in river used as source of drinking water and flowing through urban areas. Environ. Health Prev. Med. 2017, 12, 17–24. [Google Scholar] [CrossRef] [PubMed]
- Wu, M.; Wang, L.; Xu, G.; Liu, N.; Tang, L.; Zheng, J.; Bu, T.; Lei, B. Seasonal and spatial distribution of 4-tert-oCtylphenol, 4-nonylphenol and bisphenol A in the Huangpu River and its tributaries, Shanghai, China. Environ. Monit. Assess. 2013, 185, 3149–3161. [Google Scholar] [CrossRef] [PubMed]
- Xu, E.G.B.; Liu, S.; Ying, G.G.; Zheng, G.J.S.; Lee, J.H.W.; Leung, K.M.Y. The occurrence and ecological risks of endocrine disrupting chemicals in sewage effluents from three different sewage treatment plants, and in natural seawater from a marine reserve of Hong Kong. Mar. Pollut. Bull. 2014, 85, 352–362. [Google Scholar] [CrossRef] [PubMed]
- Zhang, Z.F.; Ren, N.Q.; Kannan, K.; Nan, J.; Liu, L.Y.; Ma, W.L.; Qi, H.; Li, Y.F. Occurrence of Endocrine-Disrupting Phenols and Estrogens in Water and Sediment of the Songhua River, Northeastern China. Arch. Environ. Contam. Toxicol. 2014, 66, 361–369. [Google Scholar] [CrossRef] [PubMed]
- Zhong, M.; Yin, P.; Zhao, L. Nonylphenol and octylphenol in riverine waters and surface sediments of the Pearl River Estuaries, South China: Occurrence, ecological and human health risks. Water Sci. Technol. Water Supply 2017, 17, 1070–1079. [Google Scholar] [CrossRef]
- Cheng, J.R.; Wang, K.; Yu, J.; Yu, Z.X.; Yu, X.B.; Zhang, Z.Z. Distribution and fate modeling of 4-nonylphenol, 4-t-oCtylphenol, and bisphenol A in the Yong River of China. Chemosphere 2018, 195, 594–605. [Google Scholar] [CrossRef] [PubMed]
- Zhang, Y.Z.; Tang, C.Y.; Song, X.F.; Li, F.D. Behavior and fate of alkylphenols in surface water of the Jialu river, Henan province, china. Chemosphere 2009, 77, 559–565. [Google Scholar] [CrossRef] [PubMed]
- CPAMI, Construction and Planning Agency Ministry of Interior. 2018. Available online: https://www.cpami.gov.tw/public-information/laws-regulations.html (accessed on 20 July 2018).
- Joss, A.; Andersen, H.; Ternes, T.; Richle, P.R.; Siegrist, H. Removal of estrogens in municipal wastewater treatment under aerobic and anaerobic conditions: Consequences for plant optimization. Environ. Sci. Technol. 2004, 38, 3047–3055. [Google Scholar] [CrossRef] [PubMed]
- Tsutsumi, Y.; Haneda, T.; Nishida, T. Removal of estrogenic activities of bisphenol a and nonylphenol by oxidative enzymes from lignin-degrading basidiomycetes. Chemosphere 2001, 42, 271–276. [Google Scholar] [CrossRef]
- Dzinun, H.; Othman, M.H.D.; Ismail, A.F.; Puteh, M.H.; Rahman, M.A.; Jaafar, J. PhotoCatalytic degradation of nonylphenol by immobilized tio2 in dual layer hollow fibre membranes. Chem. Eng. J. 2015, 269, 255–261. [Google Scholar] [CrossRef]
- Ciorba, G.A.; Radovan, C.; Vlaicu, I.; Masu, S. Removal of nonylphenol ethoxylates by electrochemically-generated coagulants. J. Appl. Electrochem. 2002, 32, 561–567. [Google Scholar] [CrossRef]
- Barrera-Díaz, C.E.; Frontana-Uribe, B.A.; Rodríguez-Peña, M.; Gomez-Palma, J.C.; Bilyeu, B. Integrated advanced oxidation process, ozonation-electrodegradation treatments, for nonylphenol removal in batch and continuous reactor. Catal. Today 2018, 305, 108–116. [Google Scholar] [CrossRef]
- Rashed, M.N. Adsorption technique for the removal of organic pollutants from water and wastewater. In Organic Pollutants-Monitoring, Risk and Treatment; InTech: London, UK, 2013; pp. 167–194. [Google Scholar]
- Ren, X.; Chen, C.; Nagatsu, M.; Wang, X. Carbon nanotubes as adsorbents in environmental pollution management: A review. Chem. Eng. J. 2011, 170, 395–410. [Google Scholar] [CrossRef]
- Amin, M.T.; Alazba, A.A.; Manzoor, U. A review of removal of pollutants from water/wastewater using different types of nanomaterials. Adv. Mater. Sci. Eng. 2014, 2014, 1–24. [Google Scholar] [CrossRef]
- Ahel, M.; Giger, W. Aqueous solubility of alkylphenols and alkylphenol polyethoxylates. Chemosphere 1993, 26, 1461–1470. [Google Scholar] [CrossRef]
- Chokwe, T.B.; Okonkwo, J.O.; Sibali, L.L. Distribution, exposure pathways, sources and toxicity of nonylphenol and nonylphenol ethoxylates in the environment. Water SA 2017, 42, 529–542. [Google Scholar] [CrossRef]
- Lin, A.Y.-C.; Tsai, Y.-T. Occurrence of pharmaceuticals in taiwan’s surface waters: Impact of waste streams from hospitals and pharmaceutical production facilities. Sci. Total Environ. 2009, 407, 3793–3802. [Google Scholar] [CrossRef] [PubMed]
- Aerni, H.R.; Kobler, B.; Rutishauser, B.V.; Wettstein, F.E.; Fischer, R.; Giger, W.; Hungerbuhler, A.; Marazuela, M.D.; Peter, A.; Schonenberger, R.; et al. Combined biological and chemical assessment of estrogenic activities in wastewater treatment plant effluents. Anal. Bioanal. Chem. 2004, 378, 688–696. [Google Scholar] [CrossRef] [PubMed]
- Wang, S.G.; Liu, X.W.; Gong, W.X.; Nie, W.; Gao, B.Y.; Yue, Q.Y. Adsorption of fulvic acids from aqueous solutions by carbon nanotubes. J. Chem. Technol. Biotechnol. 2007, 82, 698–704. [Google Scholar] [CrossRef]
- Wang, H.J.; Zhou, F.P.; Yu, H.; Chen, L.F. Adsorption characteristic of acidified carbon nanotubes for heavy metal Pb(II) in aqueous solution. Mater. Sci. Eng. A 2007, 466, 201–206. [Google Scholar] [CrossRef]
- Liao, Q.; Sun, J.; Gao, L. The adsorption of resorcinol from water using multi-walled carbon nanotubes. Colloids Surf. A 2008, 312, 160–165. [Google Scholar] [CrossRef]
- Reinert, L.; Lasserre, F.; Gachot, C.; Grutzmacher, P.; MacLucas, T.; Souza, M.; Mucklich, F.; Suarez, S. Long-lasting solid lubrication by CNT-coated patterned surfaces. Sci. Rep. 2017, 42873, 1–13. [Google Scholar] [CrossRef] [PubMed]
- Lu, C.; Chung, Y.-L.; Chang, K.-F. Adsorption of trihalomethanes from water with carbon nanotubes. Water Res. 2005, 39, 1183–1189. [Google Scholar] [CrossRef] [PubMed]
- Wang, H.; Zhou, A.; Peng, F.; Yu, H.; Yang, J. Mechanism study on adsorption of acidified multiwalled carbon nanotubes to Pb(II). J. Colloide Interface Sci. 2007, 316, 277–283. [Google Scholar] [CrossRef] [PubMed]
- Shah, K.J.; Pan, S.-Y.; Shukla, A.D.; Shah, D.O.; Chiang, P.C. Mechanism of organic pollutant sorption from aqueous solution by cationic tunable organoClays. J. Colloid Interface Sci. 2018, 529, 90–99. [Google Scholar] [CrossRef] [PubMed]
- Chen, G.; Shah, K.J.; Shi, L.; Chiang, P.C. Removal of cd(ii) and pb(ii) ions from aqueous solutions by synthetic mineral adsorbent: Performance and mechanisms. Appl. Surf. Sci. 2017, 409, 296–305. [Google Scholar] [CrossRef]
- Weber, W.J.; Morris, J.C. Kinetics of adsorption on carbon from solutions. J. Sanit. Eng. Div. 1963, 89, 30. [Google Scholar]
- RoCher, V.; Paffoni, C.; Gonçalves, A.; Guérin, S.; Azimi, S.; Gasperi, J.; Moilleron, R.; Pauss, A. Municipal wastewater treatment by biofiltration: Comparisons of various treatment layouts. Part 1: Assessment of carbon and nitrogen removal. Water Sci. Technol. 2012, 65, 1705. [Google Scholar] [CrossRef] [PubMed]
- Ersan, G.; Kaya, Y.; Apul, O.G.; Karanfil, T. Adsorption of organic contaminants by graphene nanosheets, carbon nanotubes and granular activated carbons under natural organic matter preloading conditions. Sci. Total Environ. 2016, 565, 811–817. [Google Scholar] [CrossRef] [PubMed] [Green Version]
- Elovich, S.Y.; Larionov, O.G. Theory of adsorption from nonelectrolyte solutions on solid adsorbents. Bull. Acad. Sci. USSR Div. Chem. Sci. 1962, 11, 198–203. [Google Scholar] [CrossRef]
- Langmuir, I. The constitution and fundamental properties of solids and liquids part i solids. J. Am. Chem. Soc. 1916, 38, 2221–2295. [Google Scholar] [CrossRef]
- Freundlich, H. Oberflächeneinflüsse beim bler und bei der bierbereitung. Zeitschrift für Chemie und Industrie der Kolloide 1906, 1, 152. [Google Scholar] [CrossRef]
- Jovanović, D.S. Physical adsorption of gases. Kolloid-Zeitschrift Zeitschrift für Polymere 1969, 235, 1214–1225. [Google Scholar] [CrossRef]
- Isik, M. Biosorption of ni(ii) from aqueous solutions by living and non-living ureolytic mixed culture. Colloids Surf. B Biointerfaces 2008, 62, 97–104. [Google Scholar] [CrossRef] [PubMed]
- Basha, S.; Murthy, Z.V.P.; Jha, B. Sorption of hg(ii) from aqueous solutions ontoCarica papaya: Application of isotherms. Ind. Eng. Chem. Res. 2008, 47, 980–986. [Google Scholar] [CrossRef]
Figure 1.
(a) Sampling Locations and (b) NP concentration of source waters. The highest, second highest, and the third highest NP concentrations were detected at (M) Shin-shan, (F) Chen-chin Lake, and (C) Bei-dou, respectively.
Figure 1.
(a) Sampling Locations and (b) NP concentration of source waters. The highest, second highest, and the third highest NP concentrations were detected at (M) Shin-shan, (F) Chen-chin Lake, and (C) Bei-dou, respectively.
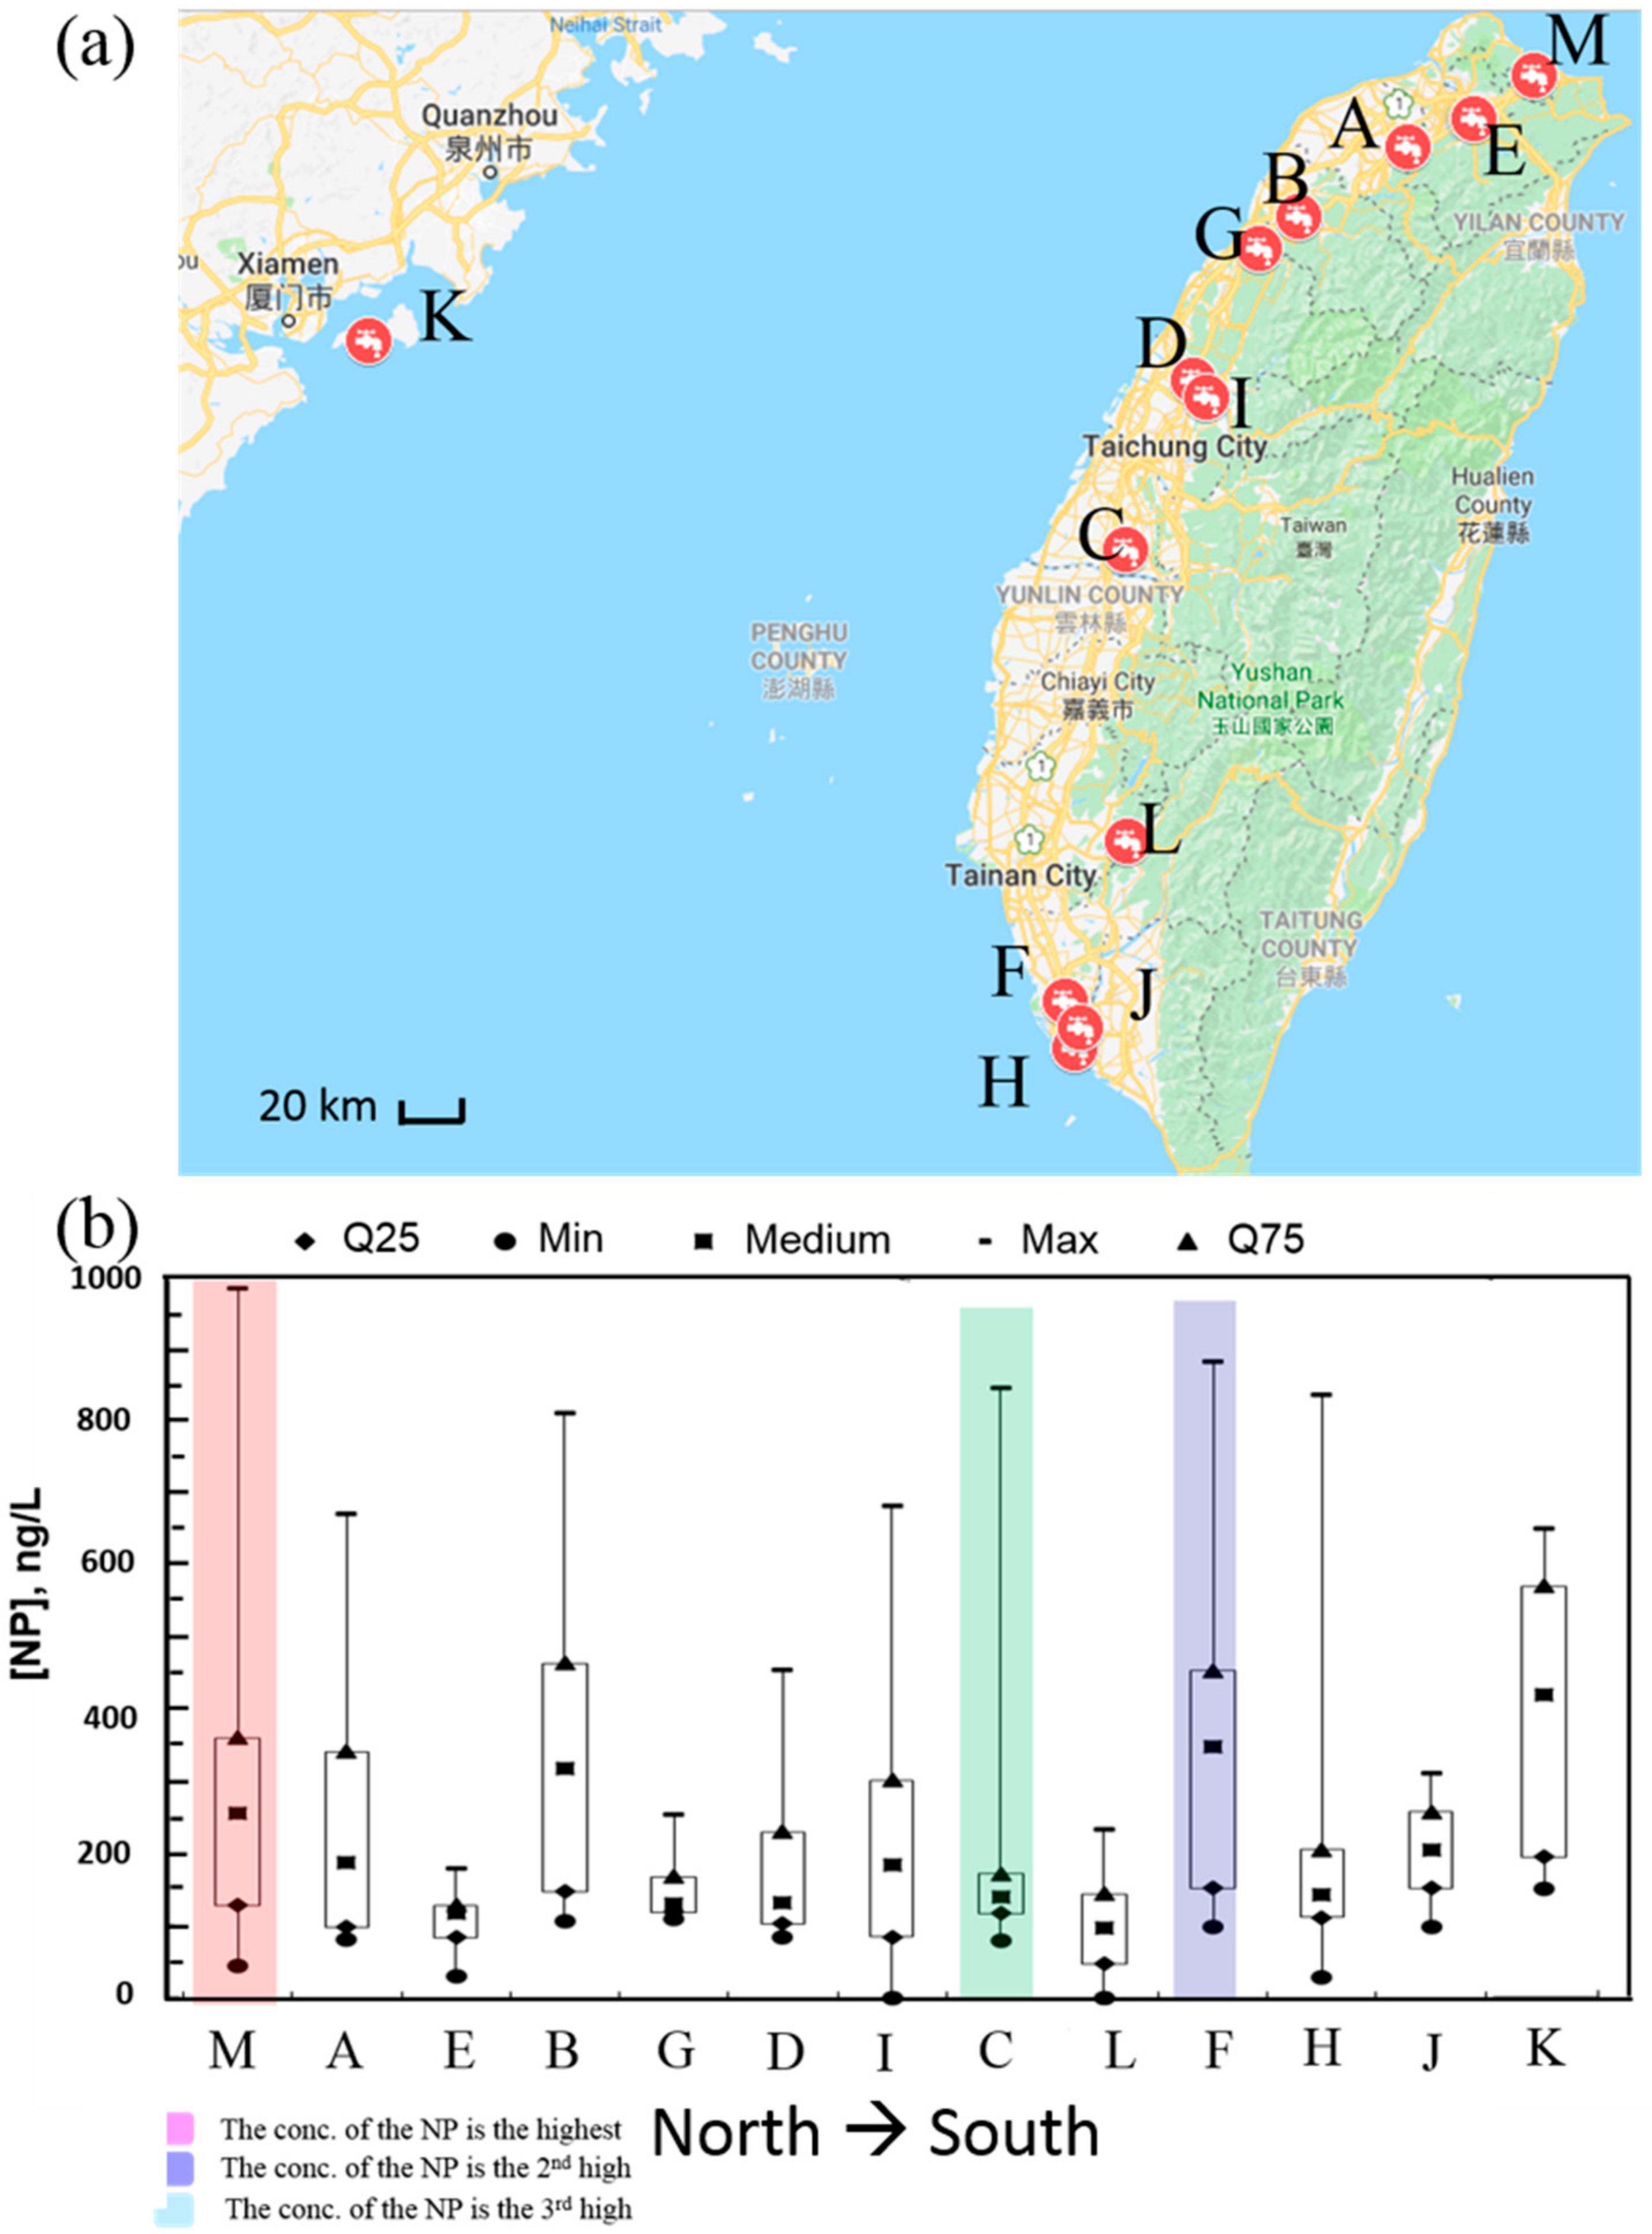
Figure 2.
SEM (left) and TEM (right) images of the MWCNTs (a) before and (b) after modification.

Figure 3.
Zeta potential of modified MWCNTs for different pHs.
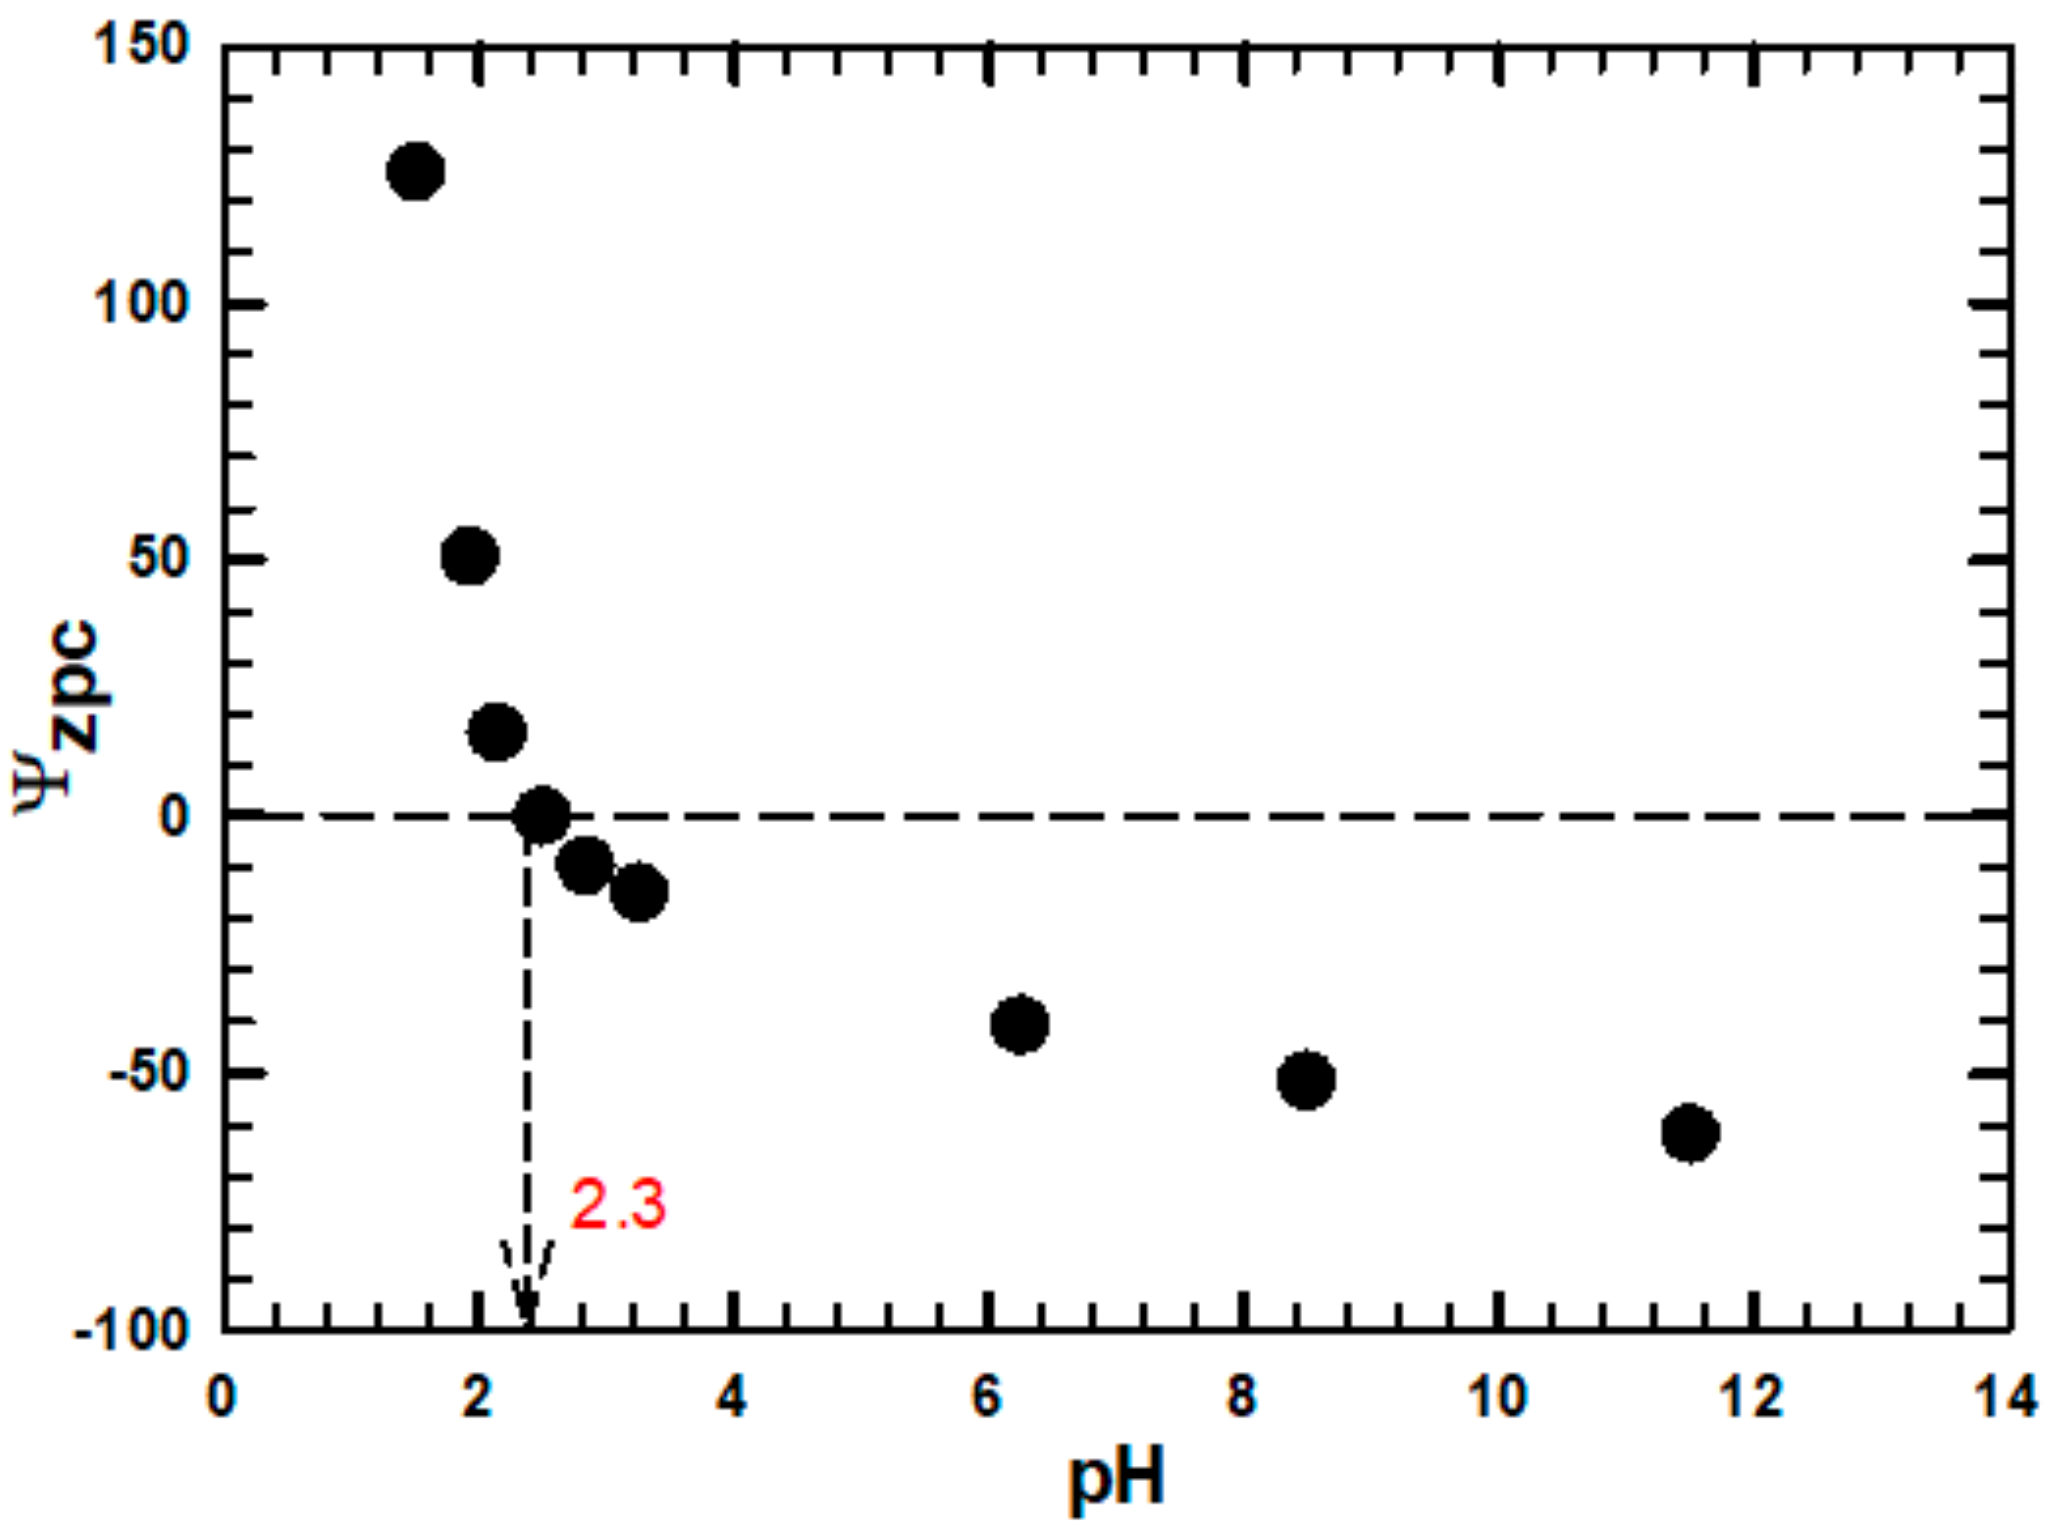
Figure 4.
Effect of (a) pH ([MWCNT] = 0.5 mg/L) and (b) adsorbent (MWCNTs) dose (at pH 4) on the adsorption of NP by MWCNTs. Experimental conditions: [NP] = 2.5 mg/L, T = 25 °C).
Figure 4.
Effect of (a) pH ([MWCNT] = 0.5 mg/L) and (b) adsorbent (MWCNTs) dose (at pH 4) on the adsorption of NP by MWCNTs. Experimental conditions: [NP] = 2.5 mg/L, T = 25 °C).


Figure 5.
The kinetics of NP adsorption described by the film diffusion and the intra-particle diffusion models. Experimental conditions: [NP] = 2.5 mg/L, T = 25 °C, pH = 4, and [MWCNT] = 0.5 mg/L.
Figure 5.
The kinetics of NP adsorption described by the film diffusion and the intra-particle diffusion models. Experimental conditions: [NP] = 2.5 mg/L, T = 25 °C, pH = 4, and [MWCNT] = 0.5 mg/L.

Table 1.
Characteristics of NP and MWCNTs.
| Nonylphenol [39] | CNTs | ||
|---|---|---|---|
| Characteristics | Characteristics | ||
| CAS registry number | 84852-15-3 | Type | MWCNT |
| Synonyms | p-nonylphenol, 4-nonylphenol, | Length | 5–15 µm |
| Molecular formula | C9H19-C6H5O | Purity | ≥95% (v/v) |
| Molecular weight (g/mol) | 220.35 | Amorphous carbon | <3% |
| pKa | 10.7 | Ash | ≤0.2% (w/w) |
| log Kow | 4.8–5.3 | Brunauer–Emmett–Teller (BET) Surface Area | 122.2 m2/g |
| Henry’s law constant (Pa m3/mol) | 11.2 | Interlayer distance | 0.34 nm |
| Solubility (mg/L) | 5.4–8 | ||
Table 2.
Specific surface area and pore diameter of MWCNTs.
| Adsorbent | SBET (m2/g) | Pore Diameter (nm) | Pore Volume (cm3/g) | References |
|---|---|---|---|---|
| MWCNTs | 122 | 15.1 | 0.44 | |
| Modified MWCNTs (Acidified) | 211 | 15.5 | 0.81 | |
| Acidified MWCNTs | 237 | 15.7 | 0.0042 | [44] |
| Acidified MWCNTs | 121 | 0.49 | [45] | |
| Acidified MWCNTs | 295 | 20–40 | 0.21 | [47] |
| Acidified MWCNTs | 254 | [48] |
Table 3.
Kinetic models and parameters for adsorption of NP to MWCNTs.
| Kinetic model | Parameter | Value | R2 | |
|---|---|---|---|---|
| Pseudo-first-order | qe (mg/g) | 2.1 × 101 | 0.93 | |
| k1 (/min) | 2.7 × 10⁻¹ | |||
| Pseudo-second-order | qe (mg/g) | 3 × 10² | 0.46 | |
| k2 (g/mg/min) | 1.1 × 10⁻³ | |||
| Elovich | a | 4.3 × 10⁻³ | 0.96 | |
| α (g/mg/min) | 4.3 × 10² | |||
| Double exponential model (DEM) | D1 (mg/L) | 8.4 × 10⁻³ | -- | |
| Dk1 (/s) | 1.4 × 10⁻³ | |||
| D2 (mg/L) | 8.5 × 10⁻³ | |||
| Dk2 (/s) | 1.4 × 10⁻³ | |||
Note: qe and qt are the amount of NP adsorbed at equilibrium at time t (mg/g), respectively. k1 and k2 are the rate constant of the pseudo-first-order, pseudo-second order, respectively. a is the Elovich constant and α is the initial sorption rate constant for the Elovich model (g/mg/min). D1 and D2 are the 1st and 2nd stage concentrations (mg/L) in the DEM model, while Dk1, and Dk2 are the 1st and 2nd stage rate constants (1/s). Lastly, ma is dosage of an adsorbent in the DEM model (g/L).
Table 4.
Parameters of NP adsorption based on various models.
| Isotherm model | Parameter | Value | R2 | Reference | |
|---|---|---|---|---|---|
| Langmuir | qm (mg/g) | 1.11 × 10⁴ | 0.9763 | [55] | |
| KL (L/mg) | 1.5 | ||||
| Freundlich | Kf ((mg/g) (mg/L)1/n) | 33.20 | 0.994 | [56] | |
| nf | 0.89 | ||||
| Temkin | Ce (g/mg) | 6.03 × 10⁴ | 0.9986 | [57,59] | |
| AT (L/mg) | 0.60 | ||||
| Elovich | qm (mg/g) | 2.5 × 10⁴ | 0.9996 | [53] | |
| KE (L/mg) | 0.38 | ||||
| Jovanovic | Kj (L/mg) | 0.22 | 0.9984 | [57] | |
| qm (g/mg) | 47.37 | ||||
Table 5.
Values of various thermodynamic parameters for adsorption of NP to MWCNTs.
| Temp. (°C) | K (L/mol) | ∆G° (kJ/mol) | ∆H° (kJ/mol) | ∆S° (J/K mol) |
|---|---|---|---|---|
| 15 | 1.47 | −0.93 | 11.18 | 42.02 |
| 25 | 1.72 | −1.35 | ||
| 35 | 2.00 | −1.77 | ||
| 45 | 2.29 | −2.19 |
© 2018 by the authors. Licensee MDPI, Basel, Switzerland. This article is an open access article distributed under the terms and conditions of the Creative Commons Attribution (CC BY) license (http://creativecommons.org/licenses/by/4.0/).
Share and Cite
MDPI and ACS Style
Dai, Y.-D.; Shah, K.J.; Huang, C.P.; Kim, H.; Chiang, P.-C. Adsorption of Nonylphenol to Multi-Walled Carbon Nanotubes: Kinetics and Isotherm Study. Appl. Sci. 2018, 8, 2295. https://doi.org/10.3390/app8112295
AMA Style
Dai Y-D, Shah KJ, Huang CP, Kim H, Chiang P-C. Adsorption of Nonylphenol to Multi-Walled Carbon Nanotubes: Kinetics and Isotherm Study. Applied Sciences. 2018; 8(11):2295. https://doi.org/10.3390/app8112295
Chicago/Turabian StyleDai, Yung-Dun, Kinjal J. Shah, Ching P. Huang, Hyunook Kim, and Pen-Chi Chiang. 2018. "Adsorption of Nonylphenol to Multi-Walled Carbon Nanotubes: Kinetics and Isotherm Study" Applied Sciences 8, no. 11: 2295. https://doi.org/10.3390/app8112295
Note that from the first issue of 2016, this journal uses article numbers instead of page numbers. See further details here.