Application of an Artificial Fish Swarm Algorithm in an Optimum Tuned Mass Damper Design for a Pedestrian Bridge


Abstract
:1. Introduction
2. Optimization Algorithm of TMD
2.1. Artificial Fish Swarm Algorithm
2.2. Optimization Goal
3. Optimum TMD Parameters Based on AFSA
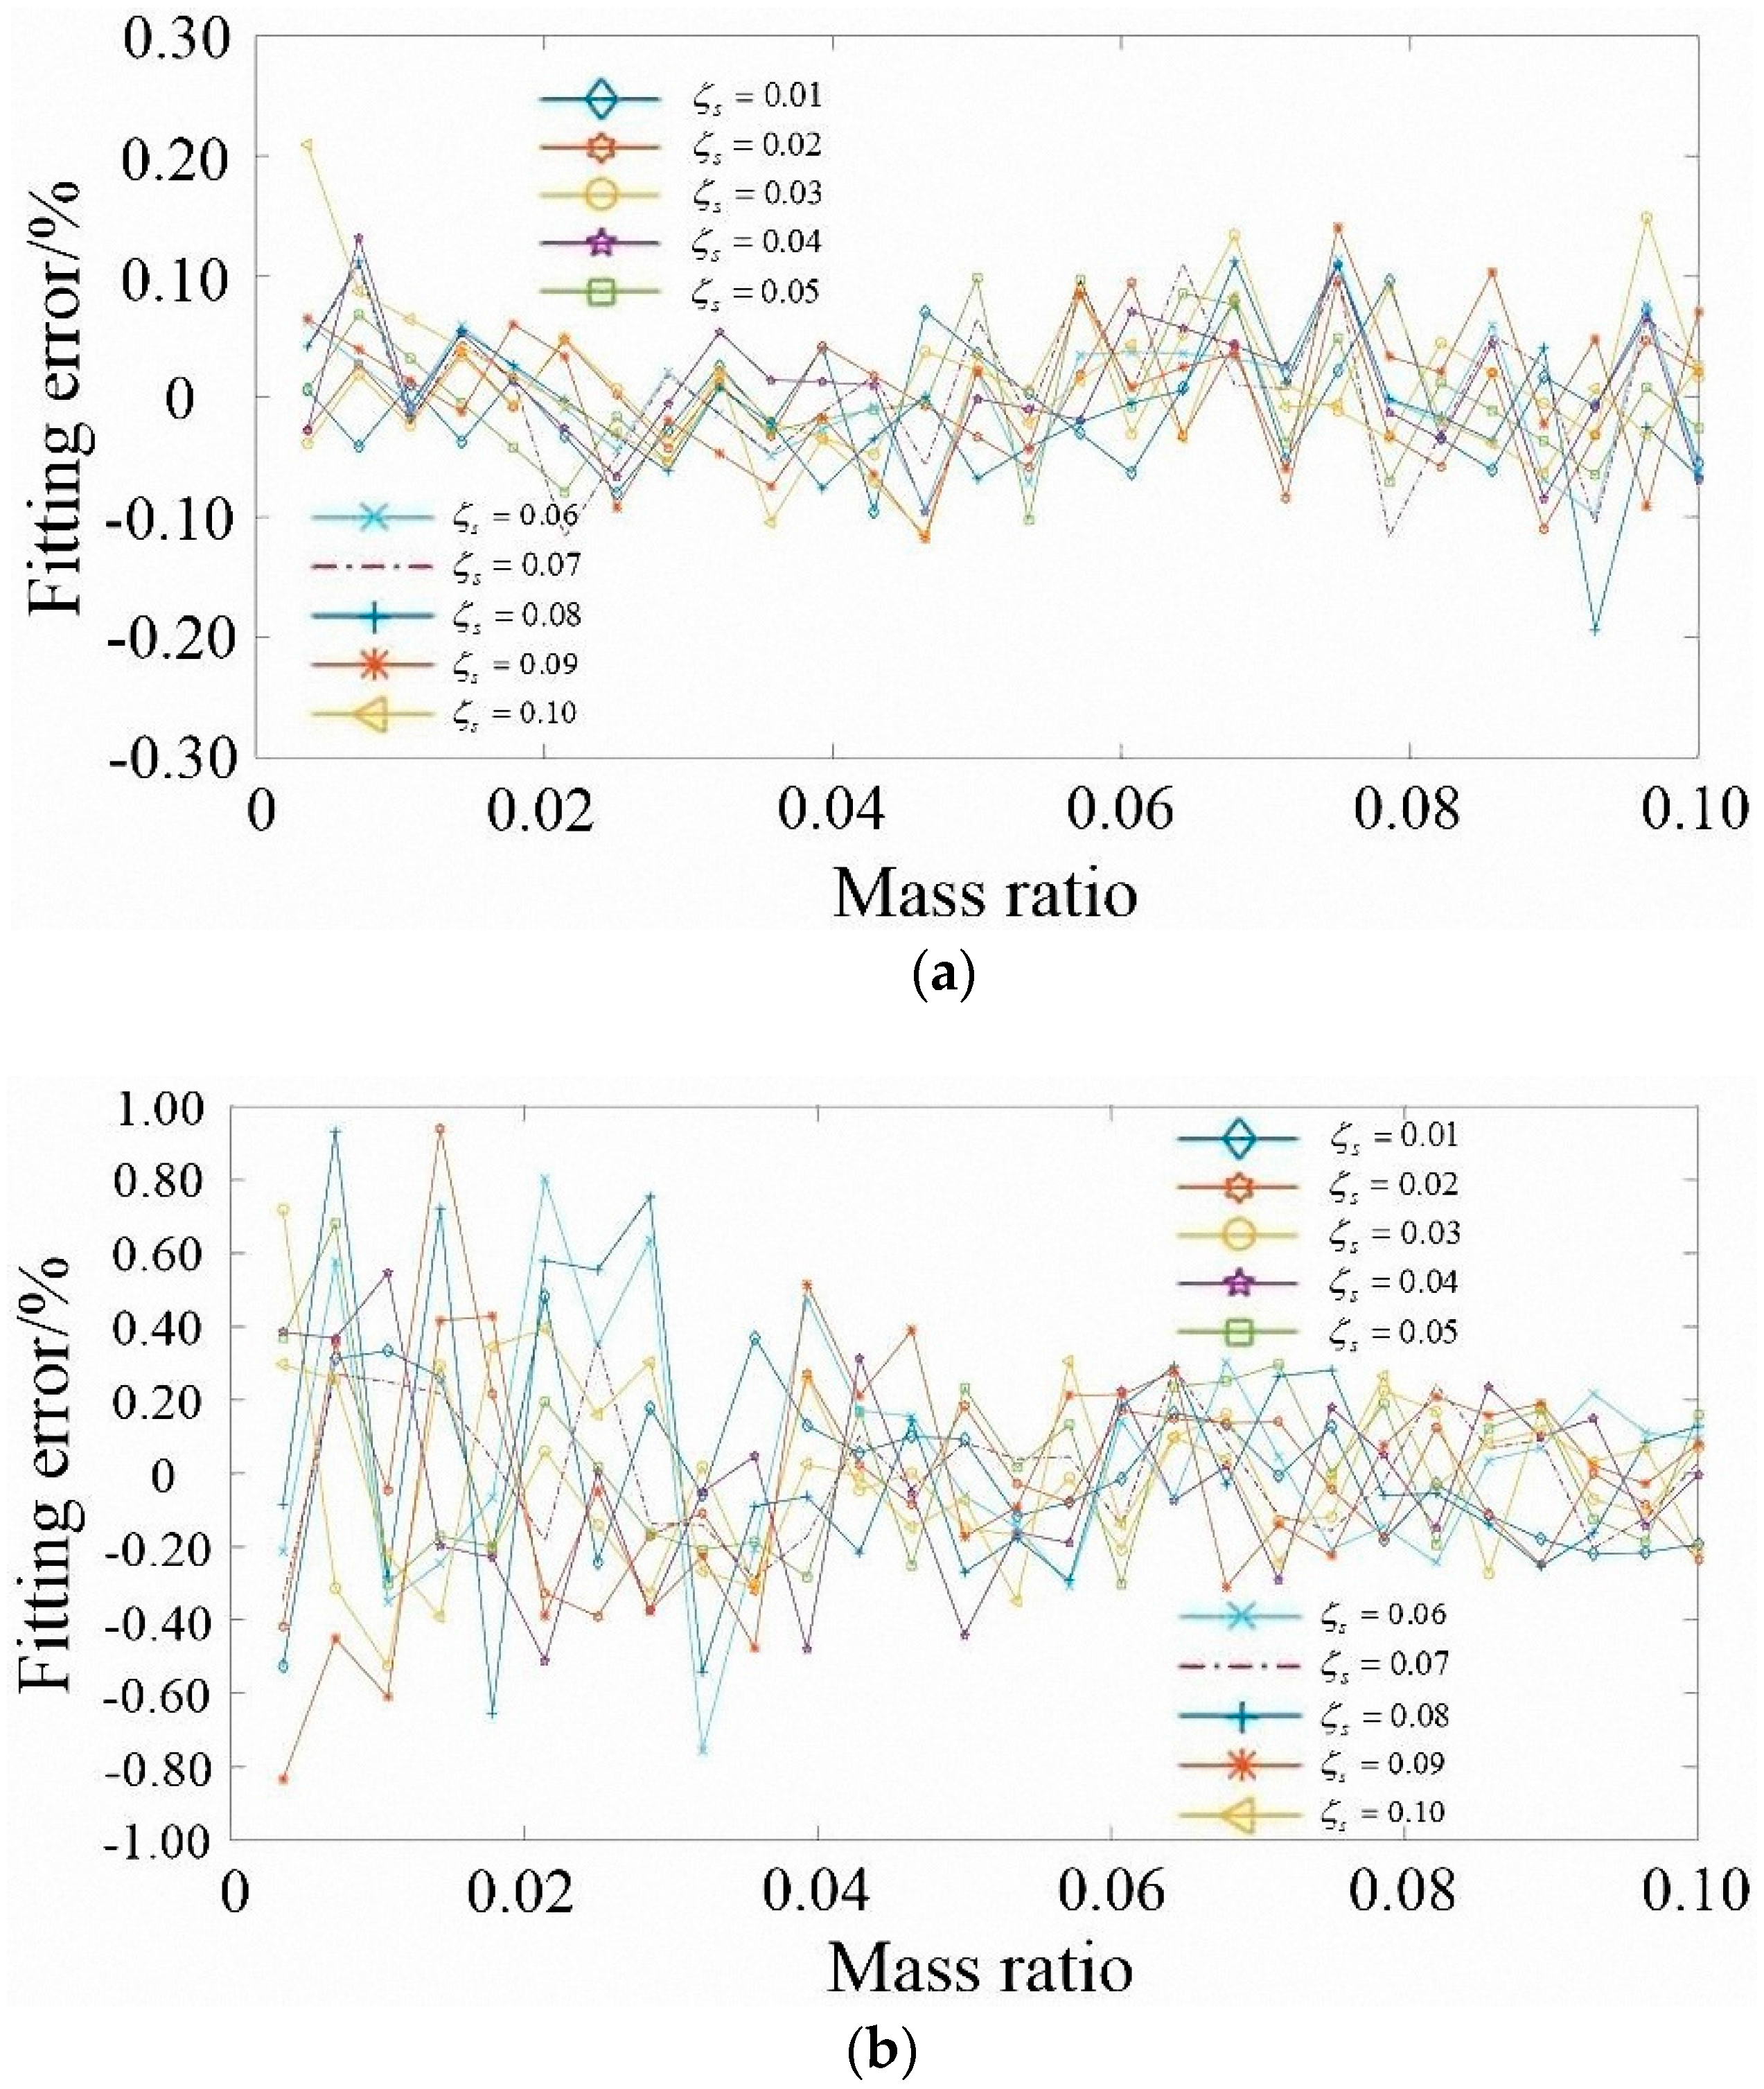
3.1. Optimum TMD Parameters and Fitting Formulas
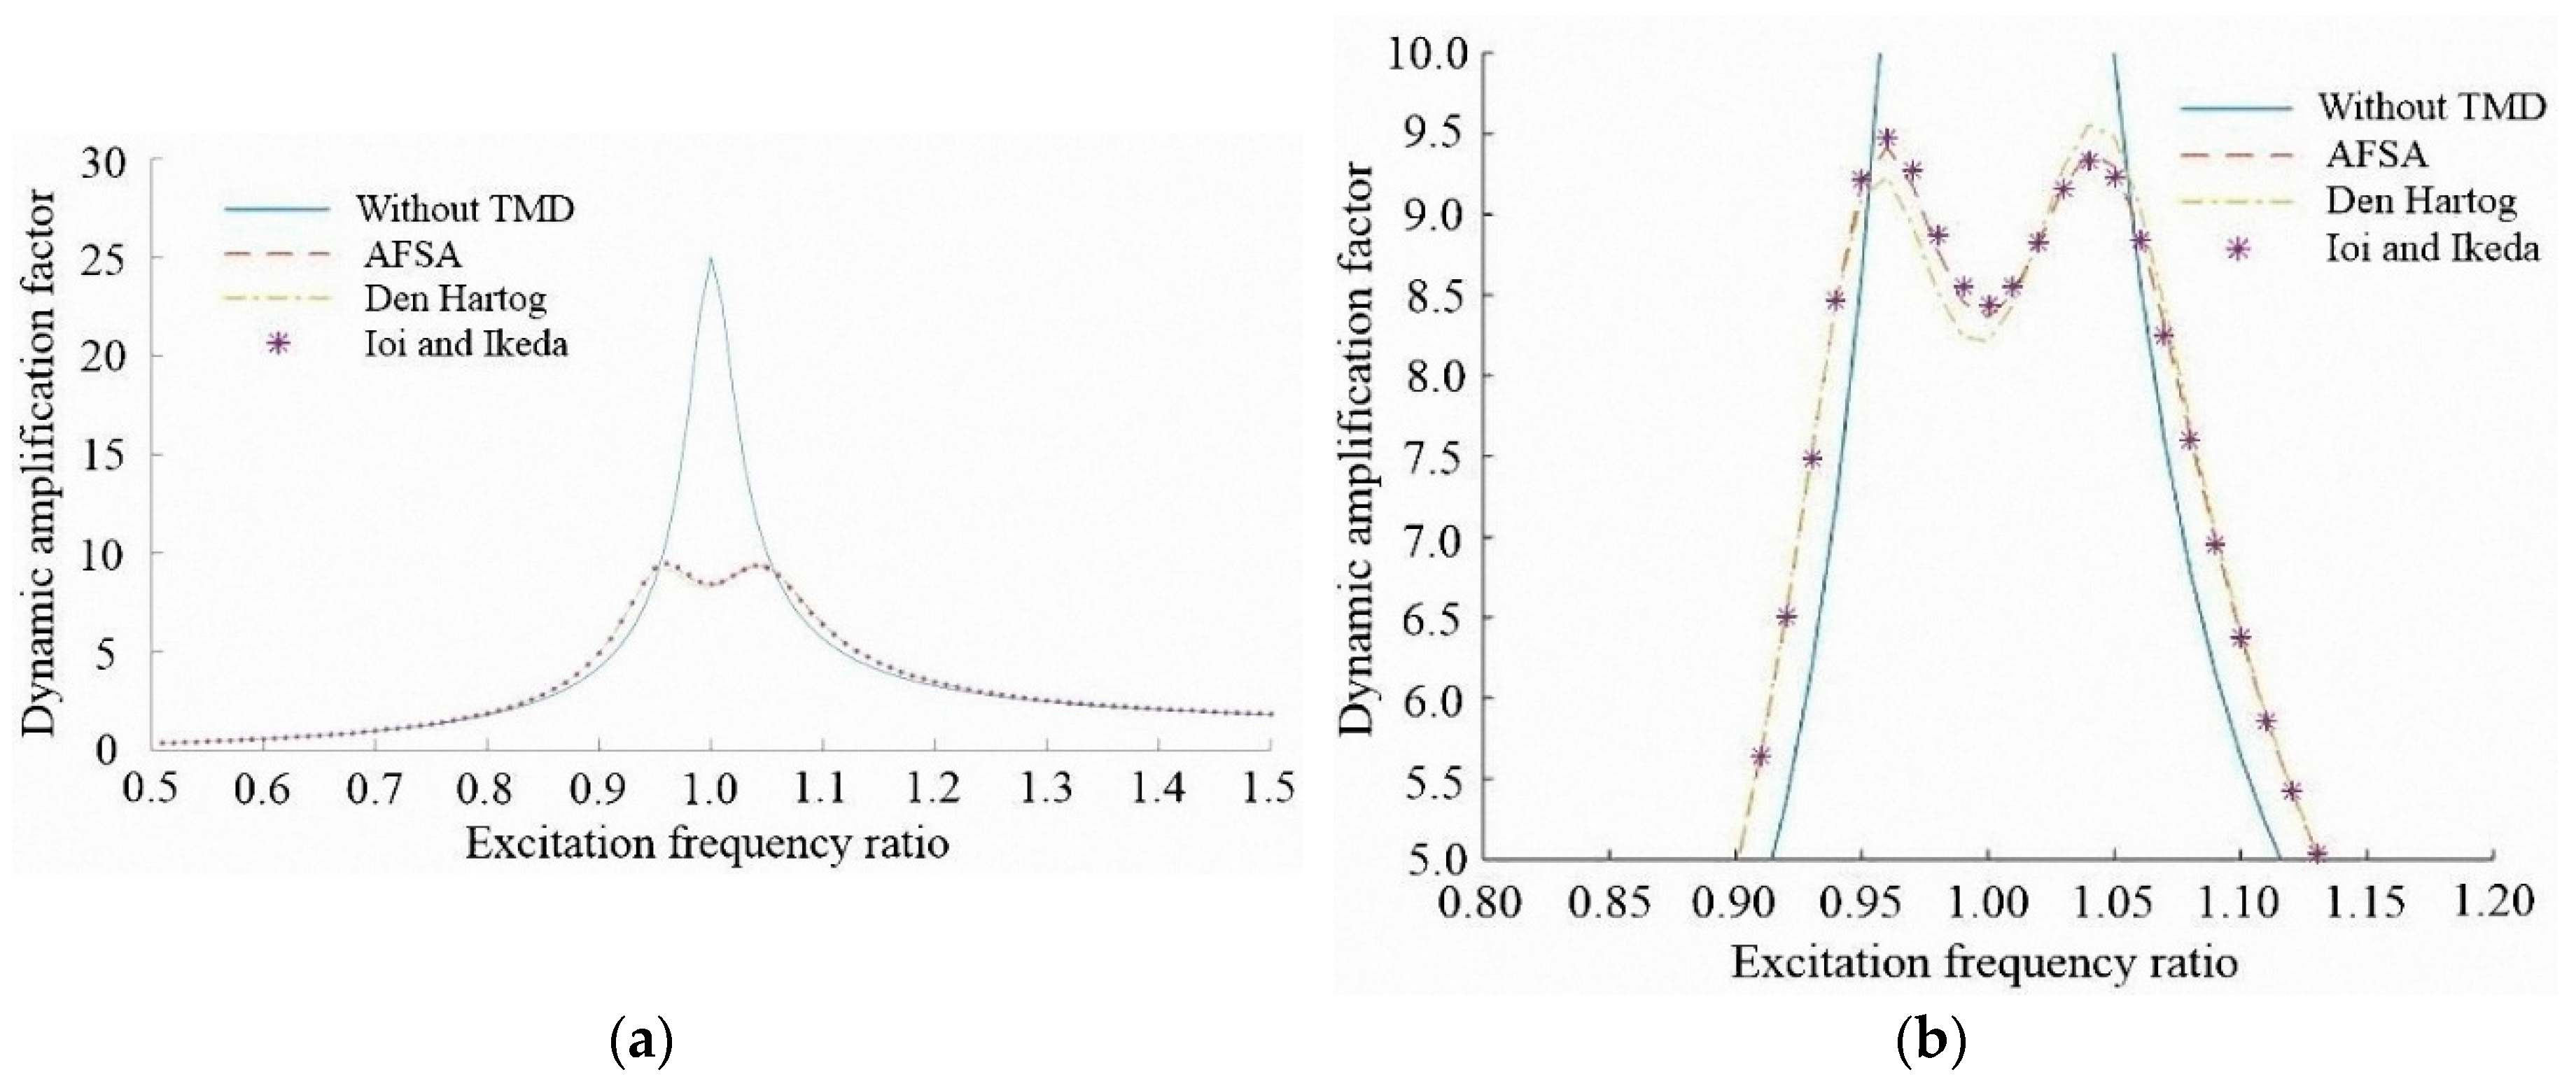
3.2. Comparison Study
4. Case Study
5. Conclusions
- (1)
- (2)
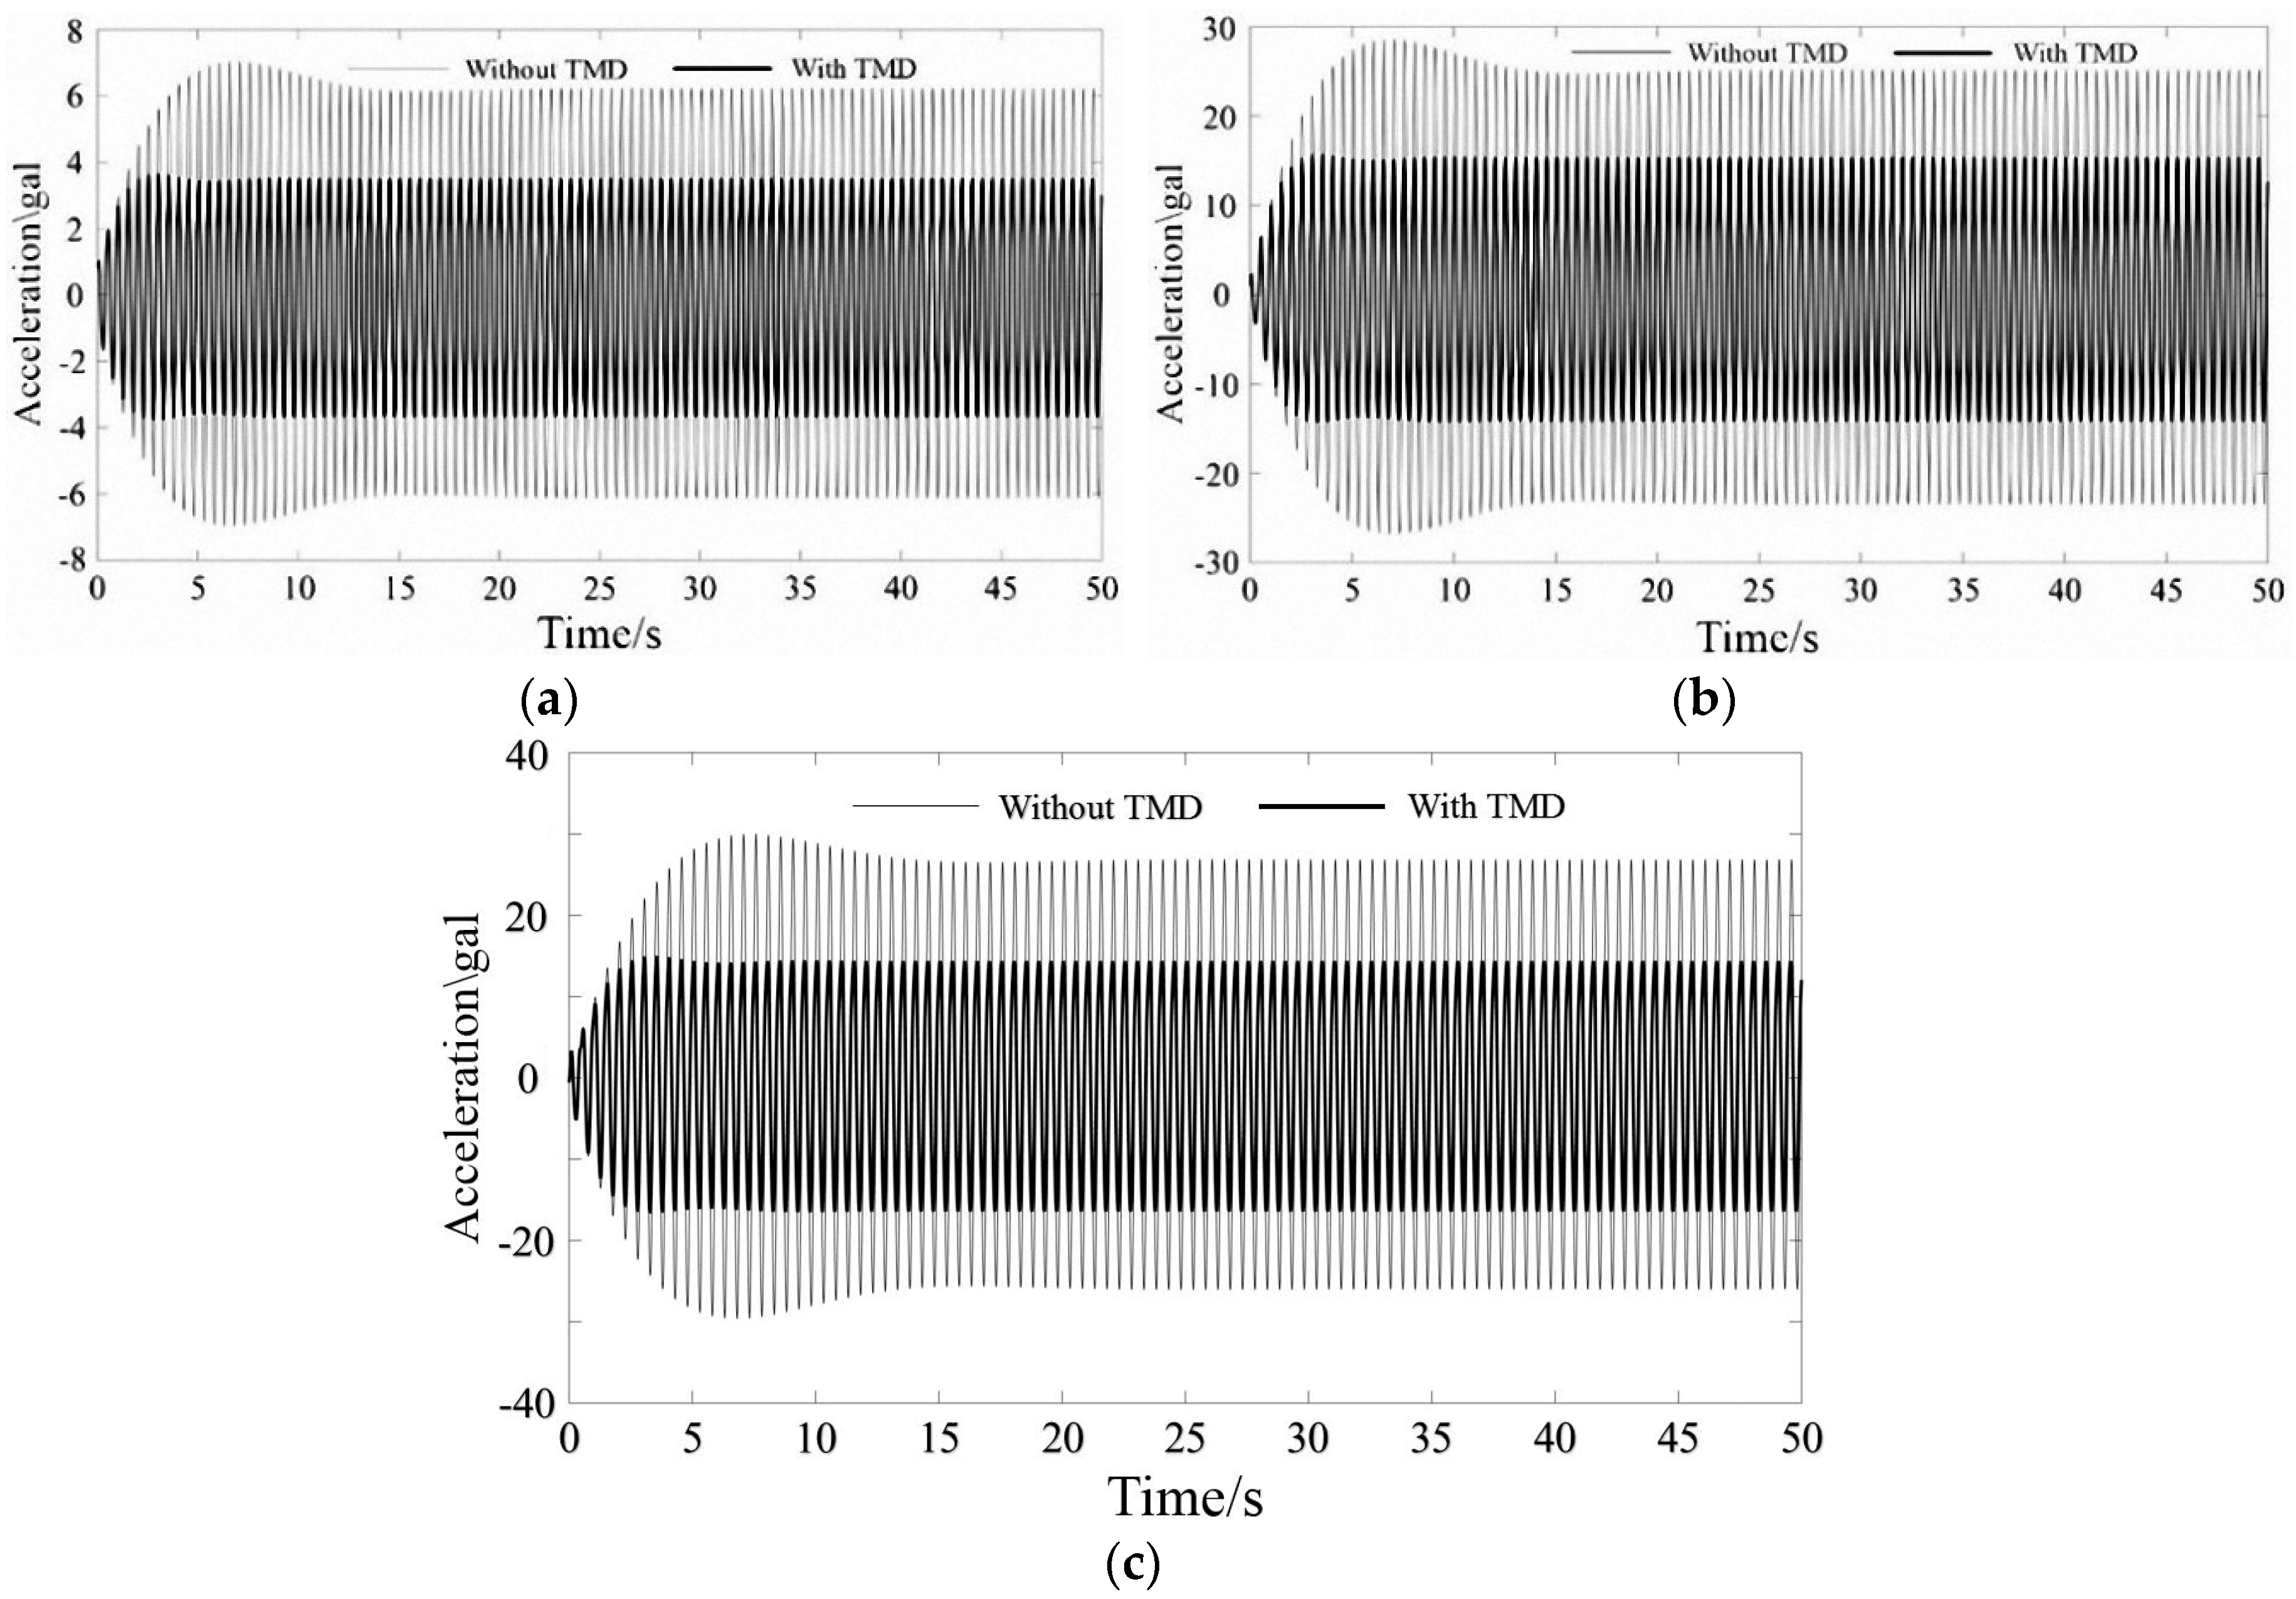
- The novel optimization method proposed in this paper has a smaller maximum acceleration dynamic amplification factor than the classic Den Hartog method and the Ioi and Ikeda method.
- (3)
- The optimized TMD has a good effect in controlling human-induced vibrations at different frequencies for a pedestrian bridge, indicating its good robustness.
Acknowledgments
Author Contributions
Conflicts of Interest
References
- Shi, W.; Wang, L.; Lu, Z. Study on self-adjustable tuned mass damper with variable mass. Struct. Control Health Monit. 2017, e2114. [Google Scholar] [CrossRef]
- Lu, Z.; Wang, D.; Masri, S.; Lu, X. An experimental study of vibration control of wind-excited high-rise buildings using particle tuned mass dampers. Smart Struct. Syst. 2016, 25, 1–7. [Google Scholar] [CrossRef]
- Lu, Z.; Chen, X.; Zhang, D.; Dai, K. Experimental and analytical study on the performance of particle tuned mass dampers under seismic excitation. Earthq. Eng. Struct. Dyn. 2017, 46, 697–714. [Google Scholar] [CrossRef]
- Wang, W.X.; Hua, X.G.; Wang, X.Y.; Chen, Z.Q.; Song, G.B. Optimum design of a novel pounding tuned mass damper under harmonic excitation. Smart Mater. Struct. 2017, 26, 055024. [Google Scholar] [CrossRef]
- Song, G.B.; Zhang, P.; Li, L.Y.; Singla, M.; Patil, D.; Li, H.N.; Mo, Y.L. Vibration control of a pipeline structure using pounding tuned mass damper. J. Eng. Mech. 2016, 142, 04016031. [Google Scholar] [CrossRef]
- Zhang, P.; Song, G.B.; Li, H.N.; Lin, Y.X. Seismic control of power transmission tower using pounding TMD. J. Eng. Mech. 2013, 139, 1395–1406. [Google Scholar] [CrossRef]
- Lu, Z.; Lu, X.; Jiang, H.; Masri, S. Discrete element method simulation and experimental validation of particle damper system. Eng. Comput. 2014, 31, 810–823. [Google Scholar] [CrossRef]
- Lu, Z.; Chen, X.; Lu, X.; Yang, Z. Shaking table test and numerical simulation of an RC frame-core tube structure for earthquake-induced collapse. Earthq. Eng. Struct. Dyn. 2016, 45, 1537–1556. [Google Scholar] [CrossRef]
- Lu, Z.; Wang, Z.; Masri, S.F.; Lu, X. Particle Impact Dampers: Past, Present, and Future. Struct. Control Health Monit. 2018, 25, e2058. [Google Scholar] [CrossRef]
- Lu, Z.; Chen, X.; Zhou, Y. An equivalent method for optimization of particle tuned mass damper based on experimental parametric study. J. Sound Vib. 2017, 9. [Google Scholar] [CrossRef]
- Lu, Z.; Huang, B.; Zhou, Y. Theoretical study and experimental validation on the energy dissipation mechanism of particle dampers. Struct. Control Health Monit. 2017, 11. [Google Scholar] [CrossRef]
- Dai, K.; Wang, J.; Mao, R.; Lu, Z.; Chen, S. Experimental investigation on dynamic characterization and seismic control performance of a TLPD system. Struct. Des. Tall Spec. Build. 2017, 26, e1350. [Google Scholar] [CrossRef]
- Lu, Z.; Lu, X.; Masri, S.F. Studies of the performance of particle dampers under dynamic loads. J. Sound Vib. 2010, 329, 5415–5433. [Google Scholar] [CrossRef]
- Casciati, F.; Casciati, S.; Faravelli, L. A contribution to the modelling of human induced excitation on pedestrian bridges. Struct. Saf. 2017, 66, 51–61. [Google Scholar] [CrossRef]
- Brownjohn, J.M.W.; Paivc, A. Experimental methods for estimating modal mass in footbridges using human-induced dynamic excitation. Eng. Struct. 2007, 29, 2833–2843. [Google Scholar] [CrossRef]
- Nakhorn, P.; Sopak, K.; Pennung, W. Application of non-linear multiple tuned mass dampers to suppress man-induced vibrations of a pedestrian bridge. Earthq. Eng. Struct. Dyn. 2010, 32, 1117–1131. [Google Scholar]
- Chen, S.R.; Wu, J. Performance enhancement of bridge infrastructure systems: Long-span bridge, moving trucks and wind with tuned mass dampers. Eng. Struct. 2008, 30, 3316–3324. [Google Scholar] [CrossRef]
- Carpineto, N.; Lacarbonara, W.; Vestroni, F. Mitigation of pedestrian-induced vibrations in suspension footbridges via multiple tuned mass dampers. J. Vib. Control 2010, 16, 749–776. [Google Scholar] [CrossRef]
- Lu, X.; Ding, K.; Shi, W.; Weng, D. Tuned mass dampers for human-induced vibration control of the Expo Culture Centre at the World Expo 2010 in Shanghai, China. Struct. Eng. Mech. 2012, 43, 607–621. [Google Scholar] [CrossRef]
- Li, Q.; Fan, J.; Nie, J.; Li, Q.; Chen, Y. Crowd-induced random vibration of footbridge and vibration control using multiple tuned mass dampers. J. Sound Vib. 2010, 329, 4068–4092. [Google Scholar] [CrossRef]
- Lievens, K.; Lombaert, G.; Roeck, G.; Broeck, P. Robust design of a TMD for the vibration serviceability of a footbridge. Eng. Struct. 2016, 123, 408–418. [Google Scholar] [CrossRef]
- Caetano, E.; Cunha, Á.; Moutinho, C.; Magalhães, F. Studies for controlling human-induced vibration of the Pedro e Inês footbridge, Portugal. Part 2: Implementation of tuned mass dampers. Eng. Struct. 2010, 32, 1082–1091. [Google Scholar] [CrossRef]
- Casciati, F.; Giuliano, F. Performance of multi-TMD in the towers of suspension bridges. J. Vib. Control 2009, 15, 821–847. [Google Scholar] [CrossRef]
- Nagarajaiah, S. Adaptive passive, semi-active, smart tuned mass dampers: Identification and control using empirical mode decomposition, Hilbert transform, and short-term Fourier transform. Struct. Control Health Monit. 2009, 16, 800–841. [Google Scholar] [CrossRef]
- Sun, C.; Nagarajaiah, S.; Dick, A.J. Family of smart tuned mass damper with variable frequency under harmonic excitation and ground motions: Closed-form evaluation. Smart Struct. Syst. 2014, 13, 319–341. [Google Scholar] [CrossRef]
- Sun, C.; Nagarajaiah, S. Study on semi-active tuned mass damper with variable damping and stiffness under seismic excitations. Struct. Control Health Monit. 2013, 21, 890–906. [Google Scholar] [CrossRef]
- Lu, Z.; Yang, Y.; Lu, X.; Liu, C. Preliminary study on the damping effect of a lateral damping buffer under a debris flow load. Appl. Sci. 2017, 7, 201. [Google Scholar] [CrossRef]
- Lu, X.; Liu, Z.; Lu, Z. Optimization design and experimental verification of track nonlinear energy sink for vibration control under seismic excitation. Struct. Control Health Monit. 2017, 24, e2033. [Google Scholar] [CrossRef]
- Den Hartog, J.P. Mechanical Vibration, 4th ed.; McGraw-Hill: New York, NY, USA, 1956. [Google Scholar]
- Leung, A.Y.T.; Zhang, H. Particle swarm optimization of tuned mass dampers. Eng. Struct. 2009, 31, 715–728. [Google Scholar] [CrossRef]
- Leung, A.Y.T.; Zhang, H.; Cheng, C.C.; Lee, Y.Y. Particle swarm optimization of TMD by non-stationary base excitation during earthquake. Earthq. Eng. Struct. Dyn. 2008, 37, 1223–1246. [Google Scholar] [CrossRef]
- Bekdas, G.; Nigdeli, S.M. Estimating optimum parameters of tuned mass dampers using harmony search. Eng. Struct. 2011, 33, 2716–2723. [Google Scholar] [CrossRef]
- Mohebbi, M.; Shakeri, K.; Ghanbarpour, Y.; Majzoub, H. Designing optimal multiple tuned mass dampers using genetic algorithms (GAs) for mitigating the seismic response of structures. J. Vib. Control 2012, 19, 605–625. [Google Scholar] [CrossRef]
- Jiménez-Alonso, J.F.; Sáez, A. Robust optimum design of TMDs to mitigate pedestrian induced vibrations using multi-objective genetic algorithms. Struct. Eng. Int. 2017, 4, 492–501. [Google Scholar] [CrossRef]
- Li, X.; Shao, Z.; Qian, J. An optimizing method based on autonomous animates: Fish swarm algorithm. Chin. J. Syst. Eng. Theory Pract. 2002, 22, 32–38. [Google Scholar]
- Wang, L.; An, L.; Pi, J.; Fei, M.; Pardalos, P. A diverse human learning optimization algorithm. J. Glob. Optim. 2017, 67, 283–323. [Google Scholar] [CrossRef]
- Toi, T.; Ikeda, K. On the dynamic vibration damped absorber of the vibration system. JSME Int. J. 1978, 21, 64–71. [Google Scholar]
- Ikeda, K.; Toi, T. On the houde damper for a damped vibration system. Trans. Jpn. Soc. Mech. Eng. Ser. C 1979, 45, 663–670. [Google Scholar] [CrossRef]
- Butz, C.; Feldmann, M.; Heinemeyer, C. Advanced load models for synchronous pedestrian excitation and optimised design guidelines for steel footbridges. Agrociencia 2013, 47, 781–794. [Google Scholar]
- Van Nimmen, K.; Verbeke, P.; Lombaert, G.; De Roeck, G. Numerical and experimental evaluation of the dynamic performance of a footbridge with tuned mass dampers. J. Bridg. Eng. ASCE 2016, 21, C4016001. [Google Scholar] [CrossRef]
- Asami, T.; Nishihara, O.; Baz, A.M. Analytical solutions to H∞ and H2 optimization of dynamic vibration absorbers attached to damped linear systems. J. Vib. Acoust. 2002, 124, 284–295. [Google Scholar] [CrossRef]
- Wang, H.; Fan, C.; Tu, X. AFSAOCP: A novel artificial fish swarm optimization algorithm aided by ocean current power. Appl. Intell. 2016, 45, 992–1007. [Google Scholar] [CrossRef]
- Liu, Q.; Odaka, T.; Kuroiwa, J.; Shirai, H.; Ogura, H. An artificial fish swarm algorithm for the multicast routing problem. Ieice Trans. Commun. 2014, 97, 996–1011. [Google Scholar] [CrossRef]
- Neshat, M.; Sepidnam, G.; Sargolzaei, M.; Toosi, A. Artificial fish swarm algorithm: A survey of the state-of-the-art, hybridization, combinatorial and indicative applications. Artif. Intell. Rev. 2014, 42, 965–997. [Google Scholar] [CrossRef]
- Zhu, X.; Ni, Z.; Cheng, M.; Jin, F.; Li, J.; Weckman, G. Selective ensemble based on extreme learning machine and improved discrete artificial fish swarm algorithm for haze forecast. Appl. Intell. 2017, 3, 1–19. [Google Scholar] [CrossRef]
- Casado, C.; Díaz, I.; Sebastián, J.; Poncela, A.; Lorenzana, A. Implementation of passive and active vibration control on an in-service footbridge. Struct. Control Health Monit. 2013, 20, 70–87. [Google Scholar] [CrossRef]
- Nimmen, K.; Lombaert, G.; Roeck, G.; Broeck, P. Vibration serviceability of footbridges: Evaluation of the current codes of practice. Eng. Struct. 2014, 59, 448–461. [Google Scholar] [CrossRef]
- Occhiuzzi, A.; Spizzuoco, M.; Ricciardelli, F. Loading models and response control of footbridges excited by running pedestrians. Struct. Control Health Monit. 2008, 15, 349–368. [Google Scholar] [CrossRef]
- Shi, W.; Wang, L.; Lu, Z.; Gao, H. Study on adaptive-passive and semi-active eddy current tuned mass damper with variable damping. Sustainability 2018, 10, 99. [Google Scholar] [CrossRef]


| 0.001 | 1.000 | 0.019 | 24.024 | 1.001 | 0.024 | 17.000 | 1.002 | 0.025 | 12.877 | 1.003 | 0.026 | 10.341 | 1.004 | 0.027 | 8.616 |
| 0.002 | 1.000 | 0.032 | 20.227 | 1.000 | 0.028 | 14.782 | 1.001 | 0.032 | 11.562 | 1.001 | 0.035 | 9.502 | 1.003 | 0.032 | 8.054 |
| 0.003 | 0.999 | 0.030 | 17.676 | 1.000 | 0.034 | 13.354 | 1.001 | 0.038 | 10.725 | 1.002 | 0.037 | 8.931 | 1.003 | 0.038 | 7.636 |
| 0.004 | 0.999 | 0.038 | 15.907 | 0.999 | 0.044 | 12.399 | 1.000 | 0.043 | 10.102 | 1.001 | 0.042 | 8.499 | 1.003 | 0.046 | 7.332 |
| 0.005 | 0.998 | 0.048 | 14.698 | 0.999 | 0.046 | 11.665 | 1.000 | 0.047 | 9.592 | 1.001 | 0.051 | 8.151 | 1.003 | 0.050 | 7.078 |
| 0.006 | 0.998 | 0.049 | 13.804 | 0.998 | 0.048 | 11.019 | 0.999 | 0.053 | 9.182 | 1.001 | 0.050 | 7.851 | 1.003 | 0.051 | 6.842 |
| 0.007 | 0.998 | 0.049 | 12.937 | 0.998 | 0.055 | 10.504 | 0.999 | 0.055 | 8.826 | 1.001 | 0.058 | 7.592 | 1.002 | 0.059 | 6.651 |
| 0.008 | 0.997 | 0.056 | 12.258 | 0.998 | 0.059 | 10.076 | 0.999 | 0.061 | 8.531 | 1.000 | 0.060 | 7.373 | 1.002 | 0.061 | 6.496 |
| 0.009 | 0.996 | 0.061 | 11.724 | 0.997 | 0.065 | 9.720 | 0.998 | 0.060 | 8.266 | 0.999 | 0.065 | 7.176 | 1.001 | 0.067 | 6.342 |
| 0.010 | 0.996 | 0.065 | 11.269 | 0.997 | 0.063 | 9.400 | 0.998 | 0.065 | 8.022 | 0.999 | 0.067 | 7.002 | 1.001 | 0.065 | 6.197 |
| 0.015 | 0.993 | 0.077 | 9.533 | 0.994 | 0.081 | 8.161 | 0.996 | 0.077 | 7.121 | 0.997 | 0.083 | 6.304 | 0.999 | 0.083 | 5.656 |
| 0.020 | 0.992 | 0.086 | 8.439 | 0.992 | 0.090 | 7.336 | 0.994 | 0.093 | 6.490 | 0.995 | 0.095 | 5.811 | 0.997 | 0.097 | 5.254 |
| 0.025 | 0.988 | 0.099 | 7.672 | 0.990 | 0.098 | 6.756 | 0.991 | 0.101 | 6.026 | 0.994 | 0.102 | 5.438 | 0.995 | 0.104 | 4.947 |
| 0.030 | 0.986 | 0.109 | 7.072 | 0.988 | 0.109 | 6.285 | 0.989 | 0.114 | 5.655 | 0.991 | 0.112 | 5.134 | 0.992 | 0.118 | 4.699 |
| 0.035 | 0.984 | 0.116 | 6.602 | 0.986 | 0.113 | 5.913 | 0.987 | 0.119 | 5.348 | 0.989 | 0.120 | 4.881 | 0.992 | 0.121 | 4.485 |
| 0.040 | 0.982 | 0.125 | 6.209 | 0.983 | 0.127 | 5.597 | 0.984 | 0.130 | 5.091 | 0.987 | 0.130 | 4.668 | 0.988 | 0.134 | 4.306 |
| 0.045 | 0.980 | 0.130 | 5.885 | 0.980 | 0.135 | 5.333 | 0.983 | 0.133 | 4.870 | 0.984 | 0.138 | 4.481 | 0.987 | 0.137 | 4.146 |
| 0.050 | 0.977 | 0.138 | 5.599 | 0.979 | 0.141 | 5.098 | 0.980 | 0.143 | 4.674 | 0.982 | 0.146 | 4.316 | 0.984 | 0.148 | 4.006 |
| 0.055 | 0.974 | 0.149 | 5.360 | 0.976 | 0.146 | 4.897 | 0.977 | 0.152 | 4.507 | 0.980 | 0.150 | 4.171 | 0.982 | 0.153 | 3.882 |
| 0.060 | 0.973 | 0.149 | 5.141 | 0.975 | 0.151 | 4.715 | 0.976 | 0.155 | 4.350 | 0.978 | 0.157 | 4.038 | 0.981 | 0.158 | 3.766 |
| 0.065 | 0.970 | 0.157 | 4.950 | 0.971 | 0.163 | 4.554 | 0.974 | 0.162 | 4.215 | 0.975 | 0.168 | 3.922 | 0.978 | 0.167 | 3.665 |
| 0.070 | 0.967 | 0.165 | 4.781 | 0.970 | 0.164 | 4.409 | 0.972 | 0.165 | 4.090 | 0.974 | 0.169 | 3.812 | 0.977 | 0.169 | 3.570 |
| 0.075 | 0.966 | 0.167 | 4.621 | 0.968 | 0.170 | 4.273 | 0.969 | 0.173 | 3.973 | 0.972 | 0.173 | 3.713 | 0.974 | 0.178 | 3.481 |
| 0.080 | 0.964 | 0.173 | 4.481 | 0.965 | 0.176 | 4.154 | 0.967 | 0.180 | 3.869 | 0.969 | 0.180 | 3.621 | 0.972 | 0.183 | 3.401 |
| 0.085 | 0.961 | 0.180 | 4.351 | 0.964 | 0.180 | 4.042 | 0.965 | 0.184 | 3.772 | 0.968 | 0.184 | 3.535 | 0.970 | 0.187 | 3.327 |
| 0.090 | 0.959 | 0.184 | 4.230 | 0.961 | 0.186 | 3.936 | 0.963 | 0.190 | 3.680 | 0.965 | 0.191 | 3.454 | 0.968 | 0.194 | 3.255 |
| 0.095 | 0.956 | 0.192 | 4.119 | 0.958 | 0.192 | 3.841 | 0.959 | 0.198 | 3.597 | 0.962 | 0.200 | 3.381 | 0.965 | 0.200 | 3.190 |
| 0.100 | 0.955 | 0.192 | 4.018 | 0.956 | 0.199 | 3.752 | 0.958 | 0.199 | 3.519 | 0.961 | 0.199 | 3.312 | 0.963 | 0.205 | 3.128 |
| 0.001 | 1.005 | 0.023 | 7.388 | 1.007 | 0.029 | 6.468 | 1.009 | 0.023 | 5.747 | 1.011 | 0.024 | 5.170 | 1.012 | 0.032 | 4.703 |
| 0.002 | 1.005 | 0.031 | 6.976 | 1.006 | 0.037 | 6.152 | 1.008 | 0.037 | 5.505 | 1.011 | 0.039 | 4.979 | 1.013 | 0.039 | 4.542 |
| 0.003 | 1.005 | 0.040 | 6.670 | 1.007 | 0.040 | 5.922 | 1.009 | 0.040 | 5.318 | 1.011 | 0.044 | 4.831 | 1.013 | 0.045 | 4.425 |
| 0.004 | 1.004 | 0.049 | 6.443 | 1.006 | 0.046 | 5.740 | 1.008 | 0.050 | 5.175 | 1.011 | 0.052 | 4.713 | 1.013 | 0.051 | 4.323 |
| 0.005 | 1.004 | 0.050 | 6.241 | 1.006 | 0.055 | 5.587 | 1.008 | 0.054 | 5.055 | 1.010 | 0.053 | 4.612 | 1.013 | 0.058 | 4.242 |
| 0.006 | 1.004 | 0.055 | 6.070 | 1.007 | 0.054 | 5.451 | 1.008 | 0.056 | 4.941 | 1.010 | 0.060 | 4.523 | 1.013 | 0.059 | 4.168 |
| 0.007 | 1.004 | 0.061 | 5.922 | 1.006 | 0.061 | 5.330 | 1.008 | 0.062 | 4.844 | 1.011 | 0.062 | 4.441 | 1.013 | 0.063 | 4.098 |
| 0.008 | 1.003 | 0.065 | 5.793 | 1.005 | 0.065 | 5.224 | 1.008 | 0.066 | 4.761 | 1.010 | 0.067 | 4.370 | 1.013 | 0.066 | 4.040 |
| 0.009 | 1.003 | 0.065 | 5.671 | 1.005 | 0.071 | 5.130 | 1.007 | 0.070 | 4.682 | 1.010 | 0.071 | 4.303 | 1.012 | 0.075 | 3.983 |
| 0.010 | 1.003 | 0.070 | 5.560 | 1.005 | 0.070 | 5.041 | 1.007 | 0.071 | 4.606 | 1.010 | 0.075 | 4.243 | 1.013 | 0.073 | 3.932 |
| 0.015 | 1.001 | 0.083 | 5.121 | 1.003 | 0.088 | 4.681 | 1.006 | 0.085 | 4.307 | 1.008 | 0.091 | 3.989 | 1.011 | 0.090 | 3.715 |
| 0.020 | 0.999 | 0.099 | 4.797 | 1.001 | 0.099 | 4.407 | 1.004 | 0.102 | 4.078 | 1.007 | 0.102 | 3.792 | 1.010 | 0.102 | 3.546 |
| 0.025 | 0.998 | 0.105 | 4.542 | 1.000 | 0.106 | 4.192 | 1.002 | 0.110 | 3.895 | 1.006 | 0.109 | 3.636 | 1.009 | 0.113 | 3.410 |
| 0.030 | 0.995 | 0.116 | 4.331 | 0.997 | 0.120 | 4.014 | 1.001 | 0.120 | 3.741 | 1.003 | 0.124 | 3.502 | 1.006 | 0.126 | 3.291 |
| 0.035 | 0.994 | 0.123 | 4.151 | 0.996 | 0.125 | 3.860 | 0.999 | 0.129 | 3.608 | 1.002 | 0.131 | 3.386 | 1.005 | 0.133 | 3.190 |
| 0.040 | 0.991 | 0.133 | 3.997 | 0.993 | 0.139 | 3.727 | 0.997 | 0.137 | 3.491 | 0.999 | 0.142 | 3.284 | 1.003 | 0.141 | 3.099 |
| 0.045 | 0.989 | 0.141 | 3.860 | 0.992 | 0.141 | 3.608 | 0.995 | 0.145 | 3.388 | 0.998 | 0.146 | 3.193 | 1.001 | 0.150 | 3.019 |
| 0.050 | 0.987 | 0.151 | 3.738 | 0.989 | 0.152 | 3.501 | 0.993 | 0.153 | 3.294 | 0.996 | 0.154 | 3.110 | 1.000 | 0.155 | 2.945 |
| 0.055 | 0.985 | 0.155 | 3.629 | 0.988 | 0.155 | 3.408 | 0.990 | 0.161 | 3.211 | 0.994 | 0.160 | 3.035 | 0.997 | 0.166 | 2.878 |
| 0.060 | 0.983 | 0.161 | 3.529 | 0.986 | 0.163 | 3.319 | 0.989 | 0.164 | 3.133 | 0.993 | 0.166 | 2.966 | 0.996 | 0.170 | 2.816 |
| 0.065 | 0.980 | 0.170 | 3.440 | 0.983 | 0.172 | 3.240 | 0.986 | 0.173 | 3.062 | 0.989 | 0.177 | 2.903 | 0.994 | 0.177 | 2.759 |
| 0.070 | 0.979 | 0.174 | 3.356 | 0.983 | 0.173 | 3.166 | 0.985 | 0.179 | 2.996 | 0.988 | 0.180 | 2.844 | 0.991 | 0.185 | 2.706 |
| 0.075 | 0.977 | 0.181 | 3.278 | 0.980 | 0.181 | 3.096 | 0.983 | 0.183 | 2.934 | 0.986 | 0.185 | 2.789 | 0.990 | 0.189 | 2.656 |
| 0.080 | 0.974 | 0.188 | 3.207 | 0.977 | 0.190 | 3.033 | 0.981 | 0.190 | 2.877 | 0.983 | 0.194 | 2.737 | 0.988 | 0.195 | 2.609 |
| 0.085 | 0.973 | 0.190 | 3.140 | 0.975 | 0.195 | 2.974 | 0.978 | 0.197 | 2.824 | 0.982 | 0.197 | 2.689 | 0.986 | 0.200 | 2.566 |
| 0.090 | 0.971 | 0.195 | 3.077 | 0.974 | 0.198 | 2.917 | 0.978 | 0.198 | 2.773 | 0.979 | 0.205 | 2.643 | 0.983 | 0.206 | 2.525 |
| 0.095 | 0.967 | 0.205 | 3.018 | 0.970 | 0.207 | 2.864 | 0.974 | 0.208 | 2.725 | 0.978 | 0.209 | 2.599 | 0.981 | 0.213 | 2.485 |
| 0.100 | 0.955 | 0.192 | 4.018 | 0.956 | 0.199 | 3.752 | 0.958 | 0.199 | 3.519 | 0.961 | 0.199 | 3.312 | 0.963 | 0.205 | 3.128 |
| 0.010 | 0.020 | 0.030 | 0.040 | 0.050 | 0.060 | 0.070 | 0.080 | 0.090 | 0.100 | ||
|---|---|---|---|---|---|---|---|---|---|---|---|
| 0.001 | 1.039 | 1.006 | 1.887 | 1.952 | 1.989 | 2.001 | 2.341 | 2.548 | 2.625 | 2.546 | |
| 0.002 | 1.046 | 1.125 | 1.328 | 2.299 | 2.625 | 2.799 | 2.796 | 2.940 | 3.150 | 3.300 | |
| 0.003 | 0.503 | 1.402 | 2.281 | 2.553 | 2.622 | 3.117 | 3.366 | 3.532 | 3.486 | 3.537 | |
| 0.004 | 0.767 | 1.843 | 2.079 | 2.362 | 3.016 | 3.280 | 3.418 | 3.597 | 3.836 | 4.020 | |
| 0.005 | 1.373 | 1.506 | 2.004 | 2.785 | 3.073 | 3.262 | 3.595 | 3.841 | 4.022 | 4.047 | |
| 0.006 | 0.869 | 1.357 | 2.417 | 2.891 | 3.133 | 3.542 | 3.843 | 4.026 | 4.074 | 4.325 | |
| 0.007 | 1.149 | 1.896 | 2.558 | 2.783 | 3.360 | 3.701 | 3.903 | 4.097 | 4.370 | 4.549 | |
| 0.008 | 0.943 | 2.063 | 2.343 | 2.814 | 3.290 | 3.628 | 3.886 | 4.241 | 4.473 | 4.548 | |
| 0.009 | 1.232 | 1.862 | 2.078 | 2.979 | 3.326 | 3.577 | 4.048 | 4.311 | 4.501 | 4.719 | |
| 0.010 | 1.182 | 1.601 | 2.387 | 2.972 | 3.354 | 3.789 | 4.131 | 4.380 | 4.580 | 4.851 | |
| 0.015 | 1.025 | 1.904 | 2.246 | 3.111 | 3.501 | 3.954 | 4.376 | 4.671 | 4.970 | 5.256 | |
| 0.020 | 1.121 | 1.977 | 2.607 | 3.074 | 3.758 | 4.088 | 4.587 | 4.938 | 5.220 | 5.554 | |
| 0.025 | 0.954 | 1.740 | 2.526 | 3.161 | 3.737 | 4.232 | 4.644 | 5.059 | 5.392 | 5.668 | |
| 0.030 | 0.995 | 1.875 | 2.528 | 3.183 | 3.773 | 4.241 | 4.767 | 5.111 | 5.554 | 5.882 | |
| 0.035 | 0.937 | 1.795 | 2.580 | 3.235 | 3.844 | 4.371 | 4.821 | 5.273 | 5.610 | 5.996 | |
| 0.040 | 1.030 | 1.802 | 2.602 | 3.207 | 3.865 | 4.361 | 4.909 | 5.307 | 5.766 | 6.110 | |
| 0.045 | 0.846 | 1.803 | 2.543 | 3.267 | 3.878 | 4.456 | 4.933 | 5.412 | 5.797 | 6.209 | |
| 0.050 | 1.057 | 1.811 | 2.661 | 3.239 | 3.954 | 4.441 | 5.044 | 5.453 | 5.933 | 6.291 | |
| 0.055 | 0.959 | 1.818 | 2.544 | 3.305 | 3.883 | 4.520 | 4.999 | 5.528 | 5.937 | 6.381 | |
| 0.060 | 0.950 | 1.865 | 2.632 | 3.341 | 3.989 | 4.556 | 5.110 | 5.578 | 6.027 | 6.430 | |
| 0.065 | 1.010 | 1.790 | 2.621 | 3.263 | 3.975 | 4.532 | 5.117 | 5.609 | 6.079 | 6.512 | |
| 0.070 | 0.945 | 1.810 | 2.572 | 3.336 | 3.940 | 4.595 | 5.107 | 5.646 | 6.105 | 6.547 | |
| 0.075 | 0.974 | 1.887 | 2.622 | 3.322 | 4.021 | 4.619 | 5.204 | 5.681 | 6.169 | 6.588 | |
| 0.080 | 0.954 | 1.799 | 2.620 | 3.290 | 4.018 | 4.604 | 5.199 | 5.722 | 6.203 | 6.670 | |
| 0.085 | 0.967 | 1.782 | 2.614 | 3.350 | 3.990 | 4.644 | 5.176 | 5.738 | 6.224 | 6.681 | |
| 0.090 | 0.989 | 1.878 | 2.617 | 3.403 | 4.040 | 4.670 | 5.261 | 5.759 | 6.268 | 6.719 | |
| 0.095 | 0.956 | 1.850 | 2.620 | 3.359 | 4.043 | 4.661 | 5.270 | 5.808 | 6.304 | 6.781 | |
| 0.010 | 0.928 | 1.798 | 2.624 | 3.332 | 4.039 | 4.671 | 5.238 | 5.818 | 6.317 | 6.809 | |
| 0.010 | 0.020 | 0.030 | 0.040 | 0.050 | 0.060 | 0.070 | 0.080 | 0.090 | 0.100 | ||
|---|---|---|---|---|---|---|---|---|---|---|---|
| 0.001 | 3.286 | 1.543 | 1.968 | 1.834 | 1.783 | 1.779 | 1.657 | 1.554 | 1.492 | 1.308 | |
| 0.002 | 0.964 | 1.531 | 1.914 | 1.812 | 1.721 | 1.746 | 1.699 | 1.542 | 1.434 | 1.567 | |
| 0.003 | 0.989 | 1.293 | 1.232 | 1.391 | 1.619 | 1.712 | 1.715 | 1.778 | 1.693 | 1.580 | |
| 0.004 | 0.126 | 0.817 | 1.277 | 1.518 | 1.552 | 1.524 | 1.531 | 1.531 | 1.591 | 1.680 | |
| 0.005 | 0.971 | 1.131 | 1.546 | 1.553 | 1.550 | 1.671 | 1.626 | 1.559 | 1.553 | 1.467 | |
| 0.006 | 0.651 | 1.286 | 1.275 | 1.365 | 1.568 | 1.549 | 1.575 | 1.638 | 1.573 | 1.529 | |
| 0.007 | 0.895 | 0.893 | 0.884 | 1.074 | 1.286 | 1.280 | 1.409 | 1.520 | 1.541 | 1.573 | |
| 0.008 | 0.488 | 0.773 | 1.021 | 1.259 | 1.223 | 1.323 | 1.398 | 1.343 | 1.380 | 1.432 | |
| 0.009 | 0.615 | 0.878 | 1.090 | 1.260 | 1.252 | 1.379 | 1.388 | 1.368 | 1.394 | 1.326 | |
| 0.010 | 0.671 | 0.786 | 1.093 | 1.093 | 1.260 | 1.322 | 1.322 | 1.399 | 1.369 | 1.352 | |
| 0.015 | 0.395 | 0.646 | 0.764 | 0.920 | 0.942 | 1.074 | 1.082 | 1.138 | 1.154 | 1.132 | |
| 0.020 | 0.144 | 0.351 | 0.520 | 0.655 | 0.795 | 0.811 | 0.897 | 0.893 | 0.930 | 0.981 | |
| 0.025 | 0.208 | 0.277 | 0.388 | 0.437 | 0.593 | 0.601 | 0.736 | 0.761 | 0.814 | 0.833 | |
| 0.030 | 0.020 | 0.278 | 0.342 | 0.438 | 0.499 | 0.557 | 0.613 | 0.646 | 0.674 | 0.689 | |
| 0.035 | 0.101 | 0.121 | 0.196 | 0.224 | 0.327 | 0.364 | 0.458 | 0.499 | 0.562 | 0.587 | |
| 0.040 | 0.036 | 0.151 | 0.245 | 0.271 | 0.343 | 0.375 | 0.429 | 0.456 | 0.477 | 0.497 | |
| 0.045 | 0.062 | 0.049 | 0.118 | 0.124 | 0.220 | 0.243 | 0.321 | 0.345 | 0.405 | 0.419 | |
| 0.050 | 0.075 | 0.073 | 0.169 | 0.187 | 0.246 | 0.262 | 0.313 | 0.316 | 0.320 | 0.309 | |
| 0.055 | 0.060 | 0.083 | 0.065 | 0.125 | 0.132 | 0.193 | 0.214 | 0.260 | 0.282 | 0.305 | |
| 0.060 | 0.024 | 0.048 | 0.029 | 0.072 | 0.123 | 0.134 | 0.160 | 0.150 | 0.178 | 0.223 | |
| 0.065 | 0.061 | 0.061 | 0.083 | 0.085 | 0.123 | 0.130 | 0.170 | 0.182 | 0.191 | 0.188 | |
| 0.070 | 0.016 | -0.007 | -0.005 | 0.008 | 0.016 | 0.063 | 0.090 | 0.116 | 0.146 | 0.153 | |
| 0.075 | 0.066 | 0.091 | 0.036 | 0.008 | 0.072 | 0.082 | 0.098 | 0.079 | 0.048 | 0.086 | |
| 0.080 | 0.041 | 0.030 | 0.037 | 0.034 | 0.062 | 0.066 | 0.094 | 0.097 | 0.102 | 0.091 | |
| 0.085 | 0.041 | 0.011 | 0.043 | 0.016 | 0.013 | 0.014 | 0.011 | 0.038 | 0.056 | 0.060 | |
| 0.090 | 0.078 | 0.087 | 0.072 | 0.091 | 0.035 | 0.051 | 0.046 | 0.008 | 0.008 | 0.015 | |
| 0.095 | 0.058 | 0.077 | 0.025 | 0.066 | 0.039 | 0.044 | 0.052 | 0.045 | 0.033 | 0.041 | |
| 0.010 | 0.000 | 0.041 | 0.046 | 0.025 | 0.048 | 0.027 | 0.021 | 0.041 | 0.040 | 0.055 | |
| Mode | Frequency/Hz | UX/% | UY/% | UZ/% | RX/% | RY/% | RZ/% |
|---|---|---|---|---|---|---|---|
| 1 | 1.006 | 94.445 | 3.788 | 0.058 | 0.033 | 0.001 | 0.588 |
| 2 | 1.488 | 3.564 | 84.251 | 0.000 | 6.749 | 0.011 | 0.007 |
| 3 | 1.946 | 0.063 | 0.026 | 75.499 | 0.208 | 0.014 | 0.000 |
| 4 | 2.098 | 0.055 | 2.405 | 0.097 | 41.152 | 0.225 | 0.019 |
| 5 | 2.482 | 0.133 | 8.134 | 0.035 | 28.389 | 0.040 | 0.000 |
| 6 | 2.726 | 0.594 | 0.006 | 0.001 | 0.029 | 0.000 | 94.733 |
| 7 | 4.276 | 0.000 | 0.000 | 0.003 | 0.000 | 0.000 | 0.000 |
| 8 | 4.278 | 0.000 | 0.000 | 0.000 | 0.000 | 0.002 | 0.000 |
| 9 | 4.425 | 0.026 | 0.002 | 0.000 | 0.002 | 0.390 | 0.003 |
| 10 | 4.681 | 0.000 | 0.006 | 0.000 | 0.005 | 43.800 | 0.109 |
© 2018 by the authors. Licensee MDPI, Basel, Switzerland. This article is an open access article distributed under the terms and conditions of the Creative Commons Attribution (CC BY) license (http://creativecommons.org/licenses/by/4.0/).
Share and Cite
Shi, W.; Wang, L.; Lu, Z.; Zhang, Q. Application of an Artificial Fish Swarm Algorithm in an Optimum Tuned Mass Damper Design for a Pedestrian Bridge. Appl. Sci. 2018, 8, 175. https://doi.org/10.3390/app8020175
Shi W, Wang L, Lu Z, Zhang Q. Application of an Artificial Fish Swarm Algorithm in an Optimum Tuned Mass Damper Design for a Pedestrian Bridge. Applied Sciences. 2018; 8(2):175. https://doi.org/10.3390/app8020175
Chicago/Turabian StyleShi, Weixing, Liangkun Wang, Zheng Lu, and Quanwu Zhang. 2018. "Application of an Artificial Fish Swarm Algorithm in an Optimum Tuned Mass Damper Design for a Pedestrian Bridge" Applied Sciences 8, no. 2: 175. https://doi.org/10.3390/app8020175
APA StyleShi, W., Wang, L., Lu, Z., & Zhang, Q. (2018). Application of an Artificial Fish Swarm Algorithm in an Optimum Tuned Mass Damper Design for a Pedestrian Bridge. Applied Sciences, 8(2), 175. https://doi.org/10.3390/app8020175