Visible and Near-Infrared Hyperspectral Imaging for Cooking Loss Classification of Fresh Broiler Breast Fillets


1
College of Engineering, China Agricultural University, Beijing 100083, China
2
Quality & Safety Assessment Research Unit, U.S. National Poultry Research Center, USDA-ARS, 950 College Station Rd., Athens, GA 30605, USA
3
State Environmental Protection Engineering Center for Mercury Pollution Prevention and Control, and CAS Key Laboratory for Biological Effects of Nanomaterials and Nanosafety, Institute of High Energy Physics, Chinese Academy of Sciences, Beijing 100049, China
*
Authors to whom correspondence should be addressed.
Appl. Sci. 2018, 8(2), 256; https://doi.org/10.3390/app8020256
Submission received: 2 January 2018
/
Revised: 25 January 2018
/
Accepted: 28 January 2018
/
Published: 9 February 2018
(This article belongs to the Special Issue Hyperspectral Chemical Imaging for Food Authentication)
Abstract
:Cooking loss (CL) is a critical quality attribute directly relating to meat juiciness. The potential of the hyperspectral imaging (HSI) technique was investigated for non-invasively classifying and visualizing the CL of fresh broiler breast meat. Hyperspectral images of total 75 fresh broiler breast fillets were acquired by the system operating in the visible and near-infrared (VNIR, 400–1000 nm) range. Mean spectra were extracted from regions of interest (ROIs) determined by pure muscle tissue pixels. CL was firstly measured by calculating the weight loss in cooking, and then fillets were grouped into high-CL and low-CL according to the threshold of 20%. The classification methods partial least square-discriminant analysis (PLS-DA) and radial basis function-support vector machine (RBF-SVM) were applied, respectively, to determine the optimal spectral calibration strategy. Results showed that the PLS-DA model developed using the data, that is, first-order derivative (Der1) of VNIR full spectra, performed best with correct classification rates (CCRs) of 0.90 and 0.79 for the calibration and prediction sets, respectively. Furthermore, to simplify the optimal PLS-DA model and make it practical, effective wavelengths were individually selected using uninformative variable elimination (UVE) and competitive adaptive reweighted sampling (CARS). Through performance comparison, the CARS-PLS-DA combination was identified as the optimal method and the PLS-DA model built with 18 informative wavelengths selected by CARS resulted in good CCRs of 0.86 and 0.79. Finally, classification maps were created by predicting CL categories of each pixel in the VNIR hyperspectral images using the CARS-PLS-DA model, and the general CL categories of fillets were readily discernible. The overall results were encouraging and showed the promising potential of the VNIR HSI technique for classifying fresh broiler breast fillets into different CL categories.
1. Introduction
Poultry meat is considered as a popular muscle food due to its low price, abundant nutritional values, and product diversity [1]. The consumption of chicken meat is growing rapidly worldwide, however quality assurance and control are critical for encouraging their purchase. Therefore, it is essential for the poultry industry to perform quality control, assessing the quality attributes of chicken meat in order to ensure their acceptance by consumers.
Cooking loss (CL, %), one of the methods for water-holding capacity (WHC) determination, is measured as the weight loss of water and soluble matter from the meat during cooking [2]. From a sensory point of view, CL is important because it is negatively correlated with eating quality, including meat juiciness [2]. Thus, evaluating the CL of meat is of interest not only to optimize the eating quality but also for economic reasons. It is well known that most of the water in living muscle is held within the myofibrils, and the CL is mainly due to weight loss caused by protein denaturation and a series of structural changes that occur in myofibrils during heating in cooking [3]. However, other factors, including ultimate pH and concentration of glycogen, could also influence the CL [4], but it so far this is not quite clear. Traditionally, the CL is measured as the weight difference (as a percentage) before and after cooking [5]. Although it can provide reliable information on CL, this reference method is laborious, time-consuming, invasive, and must be conducted on the basis of cooked meat. Therefore, the development of an efficient, rapid, and non-destructive technique to assess CL, especially with respect to fresh intact chicken meat, is extremely desirable.
Near-infrared (NIR) spectroscopy has been successfully tested as an efficient and rapid method for meat quality assessment [6,7,8]. However, thus far attempts to assess meat CL are few and have not been very successful [9,10,11,12]. It may be speculated that this conventional NIR spectroscopic method is limited by the small sample area (limited spatial information) which is not representative of the CL of the whole heterogeneous meat sample. Hyperspectral imaging (HSI) is an emerging, rapid, and non-contact analytical method that combines conventional spectroscopy and imaging in a single system to acquire spectral and spatial information simultaneously from the target. Although the HSI was originally developed for remote sensing applications, it has received ample attention in many kinds of agro-foods [13] such as cereals [14,15,16], fruits [17,18], vegetables [19,20], eggs [21], and many other animal or plant products [22,23].
Recently, in the meat industry, considerable research endeavors have been conducted with respect to meat and meat products. The reason could be that when the hyperspectral data are appropriately processed, it is possible to automatically identify the location of features that display specific spectral characteristics and to map the gradients or classes to show spatial distribution of specific attributes such as color, texture, water, fat, and protein. In the literature, reports have proved that HSI could be successfully implemented in qualitative or quantitative analysis in evaluating the quality and safety traits of pork [24,25,26], beef [27,28], lamb [29], and fish [30]. For chicken meat in particular, HSI was also attempted for evaluating springiness [31], freshness [32], bacterial load [33,34], surface contamination [35], and hydroxyproline content [36]. Due to the close relationship between CL and eating quality, the feasibility of HSI for evaluating the CL of fresh chicken meat should also be studied. Therefore, the prime focus of this study was to investigate visible and near-infrared (VNIR) HSI to assess and visualize CL of fresh broiler breast fillets.
The specific objectives of the present study were to: (1) generate the reasonable regions of interest (ROIs) most closely related to CL information; (2) build qualitative relationships between the spectra and pre-assigned high-CL and low-CL groups; (3) select and identify the important wavelengths that carry the most useful information; and (4) develop image processing algorithms to generate pixel-level and fillet-level classification maps for visualizing the CL of chicken fillets.
2. Materials and Methods
2.1. Sample Preparation
During each of the five trial days, 15 broiler carcasses (approximately 6 weeks old) were collected from the post-chilling line of a local processing plant (Athens, GA, USA) at about 60–65 min postmortem (PM). Carcasses were placed in 36-L coolers, covered with ice, and transported to the laboratory within 20 min [37]. The carcass with fillets was then placed in a Ziploc freezer bag (Ziploc Brand Freezer Bags, Johnson & Son Inc., Racine, WI, USA) and stored about 22 h at 1 to 2 °C before deboning. One fillet (alternating left or right fillet) from each carcass was used to make reference measurements independent, and visible fat and connective tissue were trimmed out from the fillets. Surface liquid was removed with paper towel prior to image capture.
After sample preparation, color and pH were first evaluated for the fresh fillets, and then the samples were scanned by the VNIR HSI system one by one. After image acquisition, CL and Warner-Bratzler shear force (WBSF) values were determined immediately based on the cooked meat. All the fillets were grouped into high-CL and low-CL according to their CL values. One third of the samples formed part of the prediction set and remaining samples formed part of the calibration set. On the other hand, by ROI identification, spectra were extracted from the hyperspectral images. Chemometric modeling algorithms, wavelength selection strategies, and the post-processing method for the final visualized images were applied, respectively. The main steps for the whole procedure are presented in detail in Figure 1.
2.2. Quality Attributes Measurements
After the deboning, color and pH measurements were conducted on the dorsal side surface of the fillet. CIELAB (Commission Internationale de L’Eclairage, L* a* and b*) values were measured with a Minolta Spectrophotometer CM-2600d (Konica Minolta Inc., Ramsey, NJ, USA). The spectrophotometer was calibrated to zero with a white plate before measurements, and had illuminant C, the specular component excluded, a 10° observer, and an 8-mm aperture. Color values were recorded as the average of the three readings at three different locations. The pH values were determined by averaging measurements at two different locations at the cranial end with a Hach H280GB pH meter and a PH57-SS spear-tipped pH probe (Hach Inc., Loveland, CO, USA). The pH meter was calibrated with pH 4.0 and pH 7.0 standard buffers, and the probe was rinsed with de-ionized water between measurements.
Prior to the WBSF and CL measurements, fresh fillets were cooked in a Henny Penny MCS-6 combination oven (Henny Penny Corporation, Eaton, OH, USA) at 85 °C with the tender steam setting to reach an internal temperature of 78 °C. Endpoint temperatures of each fillet were checked in the thickest part using a hand-held digital thermometer equipped with a hypodermic needle probe (Doric Digital Thermometer, Model 450-ET, Doric Scientific, San Diego, CA, USA). After the cooked fillets reached the desired temperature (i.e., 78 °C), CL was calculated by the following formula:
where Wfresh (g) represents fresh meat sample weight and Wcooked (g) refers to sample weight after cooking.
CL (%) = 100 × (Wfresh − Wcooked)/Wfresh,
After that, two 1.9-cm-wide and 1.9-cm-thick strips were removed by cutting parallel to the muscle fibers in the cranial end from the breast. The WBSF value of fillet was measured using a TA-XT Plus Texture Analyzer (Stable Micro Systems, Surrey, UK) combined with a TA-7 WB shear type blade, and averaged by two strip measurements. Strips were sheared through the middle parts and the maximum forces were recorded as kilogram force (kgf) [38].
2.3. Image Acquisition and Calibration
The hyperspectral images of broiler breast fillets were acquired in the National Poultry Research Center, USDA-ARS in Athens, GA. The fillets were scanned by an HSI system in reflectance mode in the VNIR spectral region (400–1000 nm). The hardware of the HSI system consisted of a line-scan hyperspectral camera, a pair of 50 W halogen MR16 lamps (Solux, EiKo, Shawnee, Kans), power supplies, a computer, and a translation stage. The VNIR hyperspectral camera consisted of a spectrograph (ImSpector V10E, Specim, Oulu, Finland), a 12-bit charge coupled device (CCD) sensor (SensiCam QE SVGA, Cooke Corp., Auburn Hills, MI, USA) with optical sensitivity from 400 to 1000 nm (473 spectral bands) and 688 × 500-pixel resolution, and a C-mount focusing lens (XNP 1.4/17-0303, Schneider Optics, Hauppage, NY, USA). The nominal spectral resolution of the imaging spectrograph was 2.8 nm, and the field of view was 115 mm (width) × 93 mm (height) corresponding to 688 lines × 500 pixels. Fillets were put on the motorized translation stage under the hyperspectral camera so that image acquisition would proceed by successive line scanning.
To remove the dark current effect of the camera and to obtain the relative reflectance from each image, image calibration was performed for the raw images. A white reference image was acquired from a white reference panel (~99.9% reflectance) and a dark reference image (~0% reflectance) was obtained by covering the camera with its own opaque cap [39]. A relative reflectance image was calculated using the following equation:
where Rc is the resulting calibrated image and Ro is original acquired images. D is the dark current image and W is the white reference image.
2.4. Image Pretreatment and Spectra Extraction
The image segmentation is a crucial image processing method, and the precision of operation might highly influence the subsequent extracted data. Since the WHC is closely related to bound and entrapped water loss especially determined by myofibrillar structures and compositions [40], pure chicken muscle tissues were extracted manually and defined as ROIs, with background, irregular shadow, and specular reflective or fat portions of the fillet excluded. The main steps for VNIR hyperspectral image segmentation and ROI extraction in this study are depicted in detail in Figure 2. Firstly, the whole meat mask (Figure 2a) was created by subtracting the lowest reflectance band (Figure 2b) from the highest reflectance band (Figure 2c), followed by thresholding with a value of 0. Similarly, an irregular shadow mask was created by thresholding values ranging from 0 to 12.5 (Figure 2d). In addition, the specular reflection or fat mask (Figure 2e) was obtained at the lowest reflectance band with a threshold of 1.5. Finally, the muscle tissue (Figure 2f) was isolated by subtracting irregular shadow (Figure 2d) and fat (Figure 2e) images from the whole segmented meat image (Figure 2a). Then, the pure muscle tissue was treated as the main ROI to be used for spectral data extraction. The mean spectra of fillets were acquired by extracting spectrum of each ROI corresponding to each sample. The image segmentation and spectra extraction processes were carried out using ENVI software (ENVI 5.1, Research Systems Inc., Solutions, Boulder, CO, USA, 2014).
2.5. Reference Measurements Statistics and Spectral Data Processing
Statistical analysis of meat quality measurements (fillet color, pH, WBSF, and CL values) were conducted using the SPSS software (SPSS version 19.0, IBM Corporation, Armonk, NY, USA, 2010). Means of the different groups were separated using student’s t-test procedure with the level of p < 0.1.
Prior to the establishment of classification models, all the samples were partitioned into the calibration set and prediction set based on a ratio of approximately 2:1. That is, 50 samples of high-CL (n = 25) and low-CL (n = 25) were attributed to the calibration set and the others to the prediction set. With regards to multivariable spectra analysis, several preprocessing techniques, including standard normal variate (SNV), multiplicative scatter correction (MSC), and derivatives (first- and second-order, Der1 and Der2) based on the Savitzky-Golay algorithm with a third-order polynomial fitting within a moving window of a width of 15, were separately applied to the spectra. Two modeling methods were applied. One was linear partial least square-discriminant analysis (PLS-DA) algorithm and the other was nonlinear radial basis function support vector machine (RBF-SVM) algorithm. PLS-DA predicts the values and assigns samples into their corresponding groups based on the modeling with PLS regression [41]. The latent variables (LVs) are orthogonal directions in the space of the sample matrix characterized by maximizing the covariance with the pre-defined classes. The class of unknown samples was assigned based on the predicted Y value and the classification threshold of the developed model. The smallest number of LVs at the minimum value of the corresponding error rate of venetian blinds cross-validation was chosen. With regards to the RBF-SVM method, the RBF was used as the kernel function of SVM and optimal separation of groups was achieved based on statistical learning [42]. In this study, the parameters of c and g for the RBF-SVM method were chosen in an automatic optimization process. Finally, the performance of established models was evaluated by calculating correct classification rate (CCR) in both the calibration set and the prediction set, which is expressed by the following equation:
where CCR represents the correct classification rate, N1 is the number of correctly classified samples in the calibration or prediction set, and N2 is the total number of samples in the calibration or prediction set.
Classification performance was further assessed in terms of sensitivity and specificity. Sensitivity was estimated as the number of positives in the dataset corrected by the model divided by the total number of positives. Specificity was determined as the number of negatives correctly classified divided by the total number of negatives. The definitions of the two indicators are as below:
where TP, TN, FN and FP denote the true positive, the true negative, the false negative and the false positive, respectively.
Uninformative variable elimination (UVE) and competitive adaptive reweighted sampling (CARS) are employed to identify and select informative variables for model optimization, respectively. UVE is a variable selection method based on stability analysis of the regression coefficient (RC) in the partial least squares regression (PLSR) model. A noise matrix with the same dimensions is added to the original spectral data matrix, and the PLSR model is built by the combined data [43]. The wavelengths in original data with RC values lower than cutoff threshold will be eliminated. CARS used the Monte Carlo sampling method to evaluate the significance of each wavelength on the basis of RC absolute coefficients in PLSR model. Wavelengths with little influence due to established principles will be removed, and the next iteration always starts with the remaining variables until iterations are finished [44]. The use of the two variable selection methods can possibly improve model performances and meanwhile enable the development of simplified multispectral imaging systems, so that detection can meet industrial requirements. Steps described for wavelength selection were performed with a homemade procedure with Matlab software (Matlab 2012b, The Mathworks Inc., Natick, MA, USA, 2012).
2.6. Visualization of CL Classification Results
The CL categories vary not only among different fillets, but also in different locations in one same fillet. Using the HSI technique, the classification results of different pixels located at different spatial locations can be calculated and visualized. Spectra at the selected wavelengths were used to transfer classification results of optimal simplified model into each pixel to achieve visualization. Thus, a pixel-level pseudo color map was obtained and a color scale bar was used, so that pixels that belong to the same CL category would appear in the same color in the classification map. Then, a median-filtering operation programmed in Matlab software was applied to reduce noise and smooth the images to make the results clearer. Furthermore, to evaluate the overall degree of CL for the intact fillet, a fillet-level classification map was subsequently generated according to the distribution of the majority of pixels within the fillet. All visualization steps were conducted in Matlab software.
3. Results and Discussion
3.1. Threshold Determination and Quality Characteristics of High-CL and Low-CL Broiler Breast Fillets
In a previous report of WHC values statistics of broiler breast fillets, average CL values for high-WHC and low-WHC groups were of 18.4–19.6% and 21.6–22.3%, respectively [45]. Referring to these results, in our study, fillets were classified as having high-CL when CL was ≥20% and as having low-CL when CL was <20%. The sample distribution of CL values of 74 fillets (one of the 75 was excluded due to image damage) is illustrated in Figure 3, and the number of samples in two groups accounted for half (n = 37) of the total based on this threshold standard (20%) fittingly.
Besides CL values, descriptive statistics such as mean, range, and standard deviation (SD) of the other six quality attributes of the broiler breast fillets with high-CL and low-CL are also shown in Table 1. The CL values of all fillets ranged from 15.17% to 36.18%, and mean values for high-CL and low-CL were 22.05% and 18.15%, respectively. No differences at the significance level of 0.1 were observed for the color attributes. However, numerical differences of overall average values could be observed. For example, for high-CL samples the overall a* and b* values were 0.20 and 12.61, respectively, compared with −0.11 and 12.17 for low-CL samples, which demonstrated that high-CL fillets exhibited a little more red and yellow than low-CL fillets. Because poor WHC is closely associated with pale color and low muscle pH in chicken meat [46], as expected, high-CL fillets exhibited higher overall average L* values and lower pH values than low-CL fillets. Also, a significant difference is shown in the t-test (p < 0.1) for the average WBSF values between high-CL and low-CL groups, which indicated that less juicy fillets also generally presented lower tenderness.
3.2. Spectral Features
Spectra of all ROIs were extracted from VNIR hyperspectral images. The mean spectra of fillets of high-CL and low-CL groups are shown in Figure 4. The mean spectra of high-CL and low-CL fillets exhibited overall similar patterns, and curves in the visible spectral region (400–700 nm) showed low reflectance in the blue and green regions (about 400–550 nm) and high reflectance in red region (about 600–700 nm), which explains why broiler breast meat gets its red or pink color. However, the spectral profiles could also be distinguished from each other in several small reflectance differences. In spectral set of 400–1000 nm, the bands at 422 nm, 550 nm and 492 nm were related to deoxymyoglobin, and oxymyoglobin, and metmyoglobin, respectively [47]. Low-CL fillets exhibited higher reflectance signals at 550 nm and 492 nm than high-CL fillets, which indicated that the samples could be initially screened by meat color attributes (in accordance with the statistics in Table 1). Specifically, the bands at 980 nm and the weak valley at 762 nm were closely related to the presence of water in muscles, which could be attributed to the second and third overtone of O-H stretching mode of water, respectively [8,30]. Only minor differences were observed in the moisture contents of the high-CL and low-CL muscles. As also indicated in previous study [8], the WHC is closely connected with the membrane and structural integrity of cells in the muscle tissue.
3.3. Classification Models Using Full-Wavelength Range
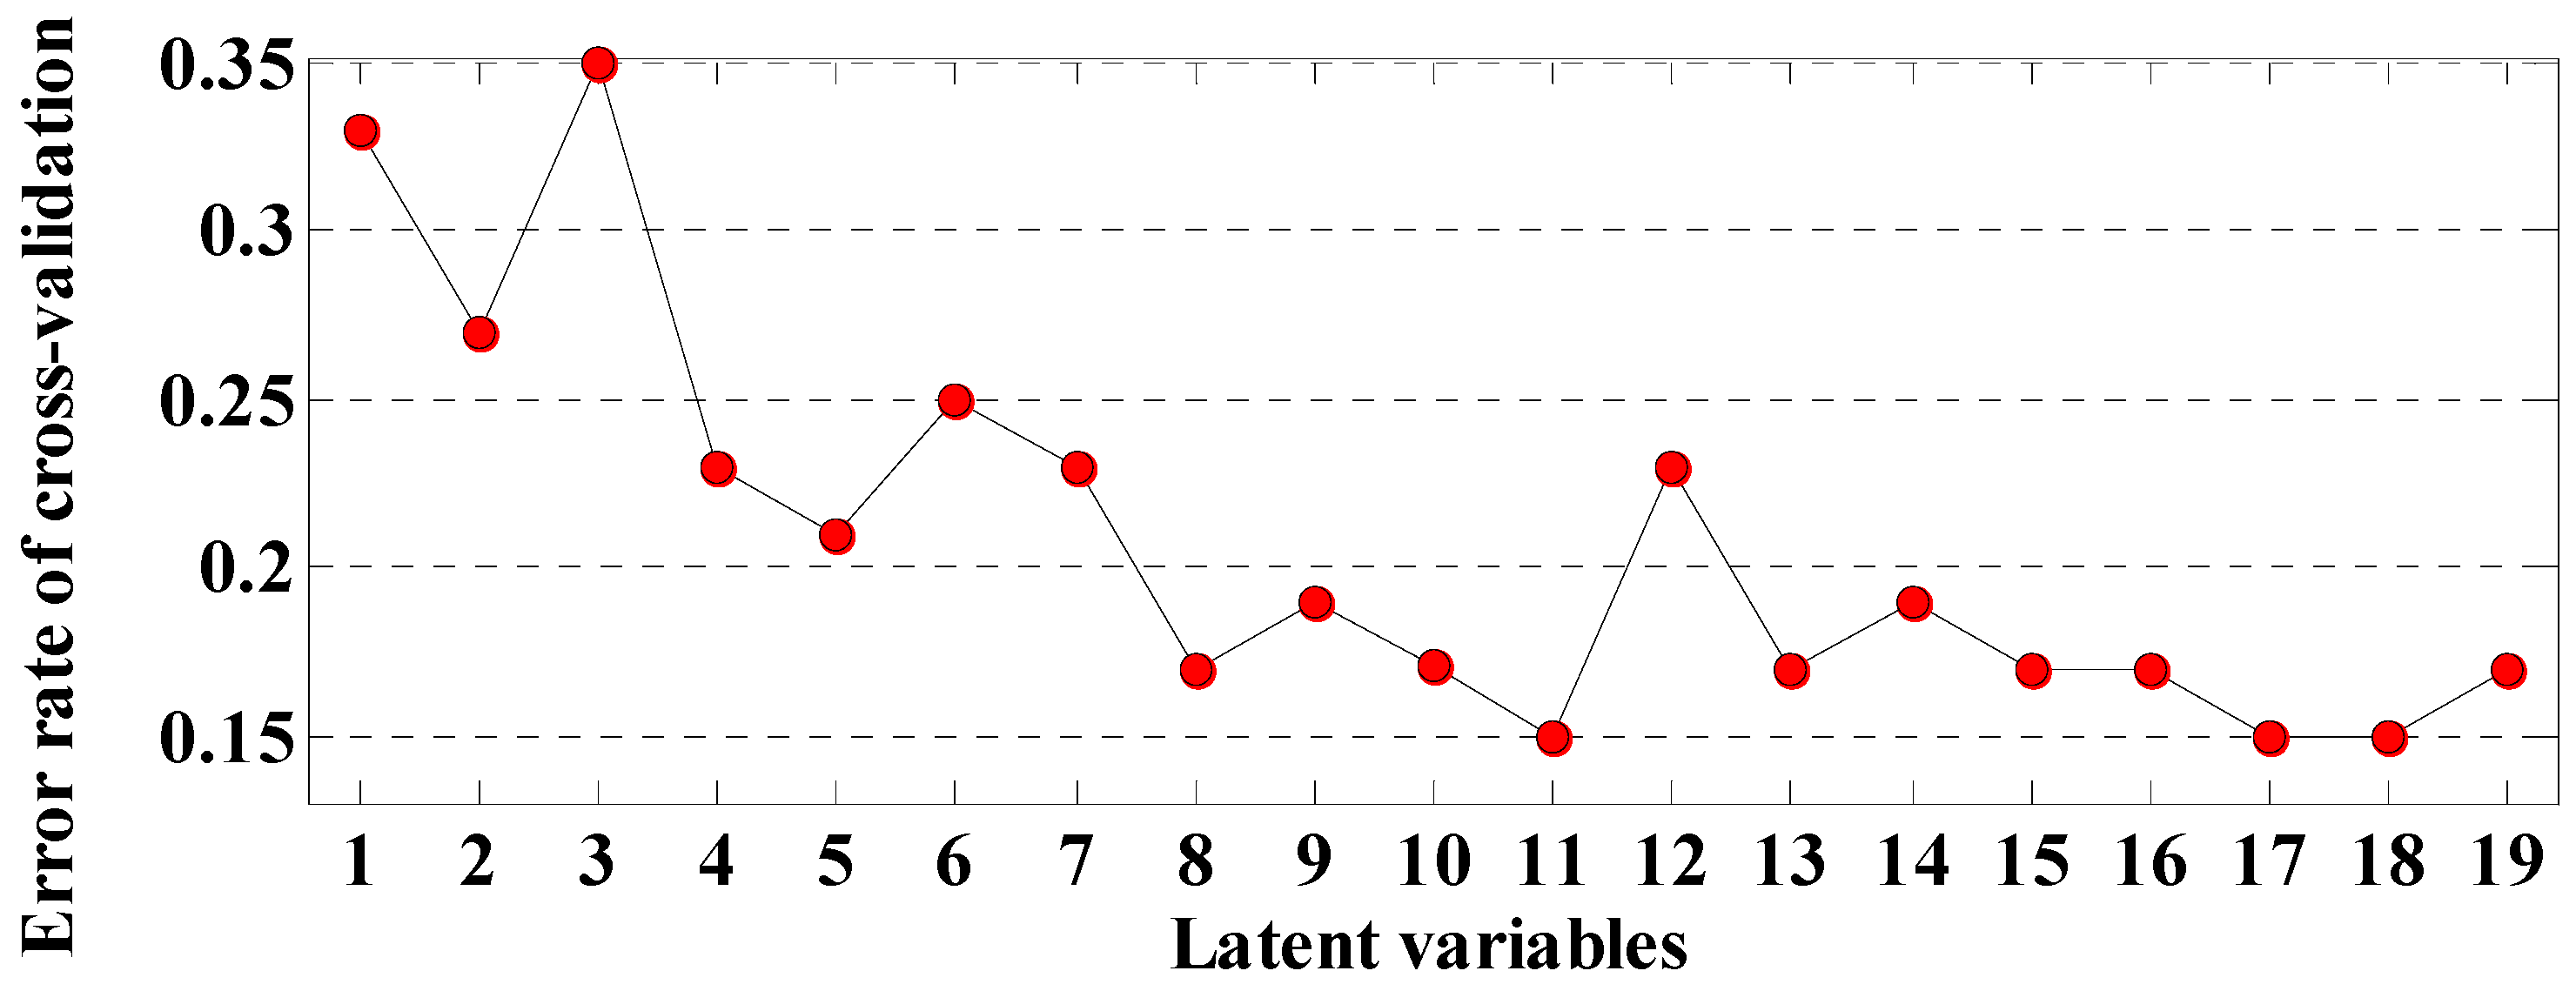
Table 2 shows the performances of models developed using PLS-DA and RBF-SVM with optimal preprocessing methods, respectively. The PLS-DA model with preprocessing of Der1 achieved good performance in classification of high and low CL with CCRs of 0.90 for the calibration set and 0.79 for the prediction set. The optimum number of LV determinations is shown in Figure 5 and 11 latent variables were selected. When RBF-SVM was considered, similar classification results of CCR = 1.00 and 0.79 for the calibration and prediction set, respectively, were obtained. This overall good result might be due to content differences of the myoglobin and heme pigments [48] in fillets of the two groups. Moreover, the previous works showed that visible spectra are helpful for classifying raw fillets into high- and low-WHC groups [8] as important wavelengths with high loadings were mostly in that region [48]. Although PLS-DA and RBF-SVM models had similar performance, the former model was more robust as there was a smaller absolute difference between CCRs in the calibration and prediction processes. Therefore, in this work, the established PLS-DA model based on full spectra was selected for further evaluation. In the literature there are few reports concerning the qualitative or quantitative prediction of meat CL using the spectroscopic method [9,10,11,12]. Leroy et al. [9] reported the R2cv range of 0.25 to 0.47 for beef CL prediction using NIR spectroscopy, while an R2 value of 0.001 for young cattle meat and 0.138 for oxen meat was obtained in Prieto et al. [11]. Prevolnik et al. [12] reported unsuccessful prediction of pork CL with NIR spectroscopy by showing the Rp2 of 0.26–0.39, and in the study of Liu et al. [10], an R2 value of 0.49 for chicken meat CL was obtained. Despite the meat species and discrepancies in experimental designs, the performance in our study was better than in the published studies using NIR spectroscopy. Our results support the suggestion that conventional NIR spectroscopy is limited by the small sampling area, while hyperspectral images may better correspond to the CL of whole sample. On the other hand, WHC is also well-related to meat color, which could explain how by including spectra in visible wavebands in the present study, better results were achieved.
3.4. Establishment of a Multi-Spectral Classification Model by PLS-DA
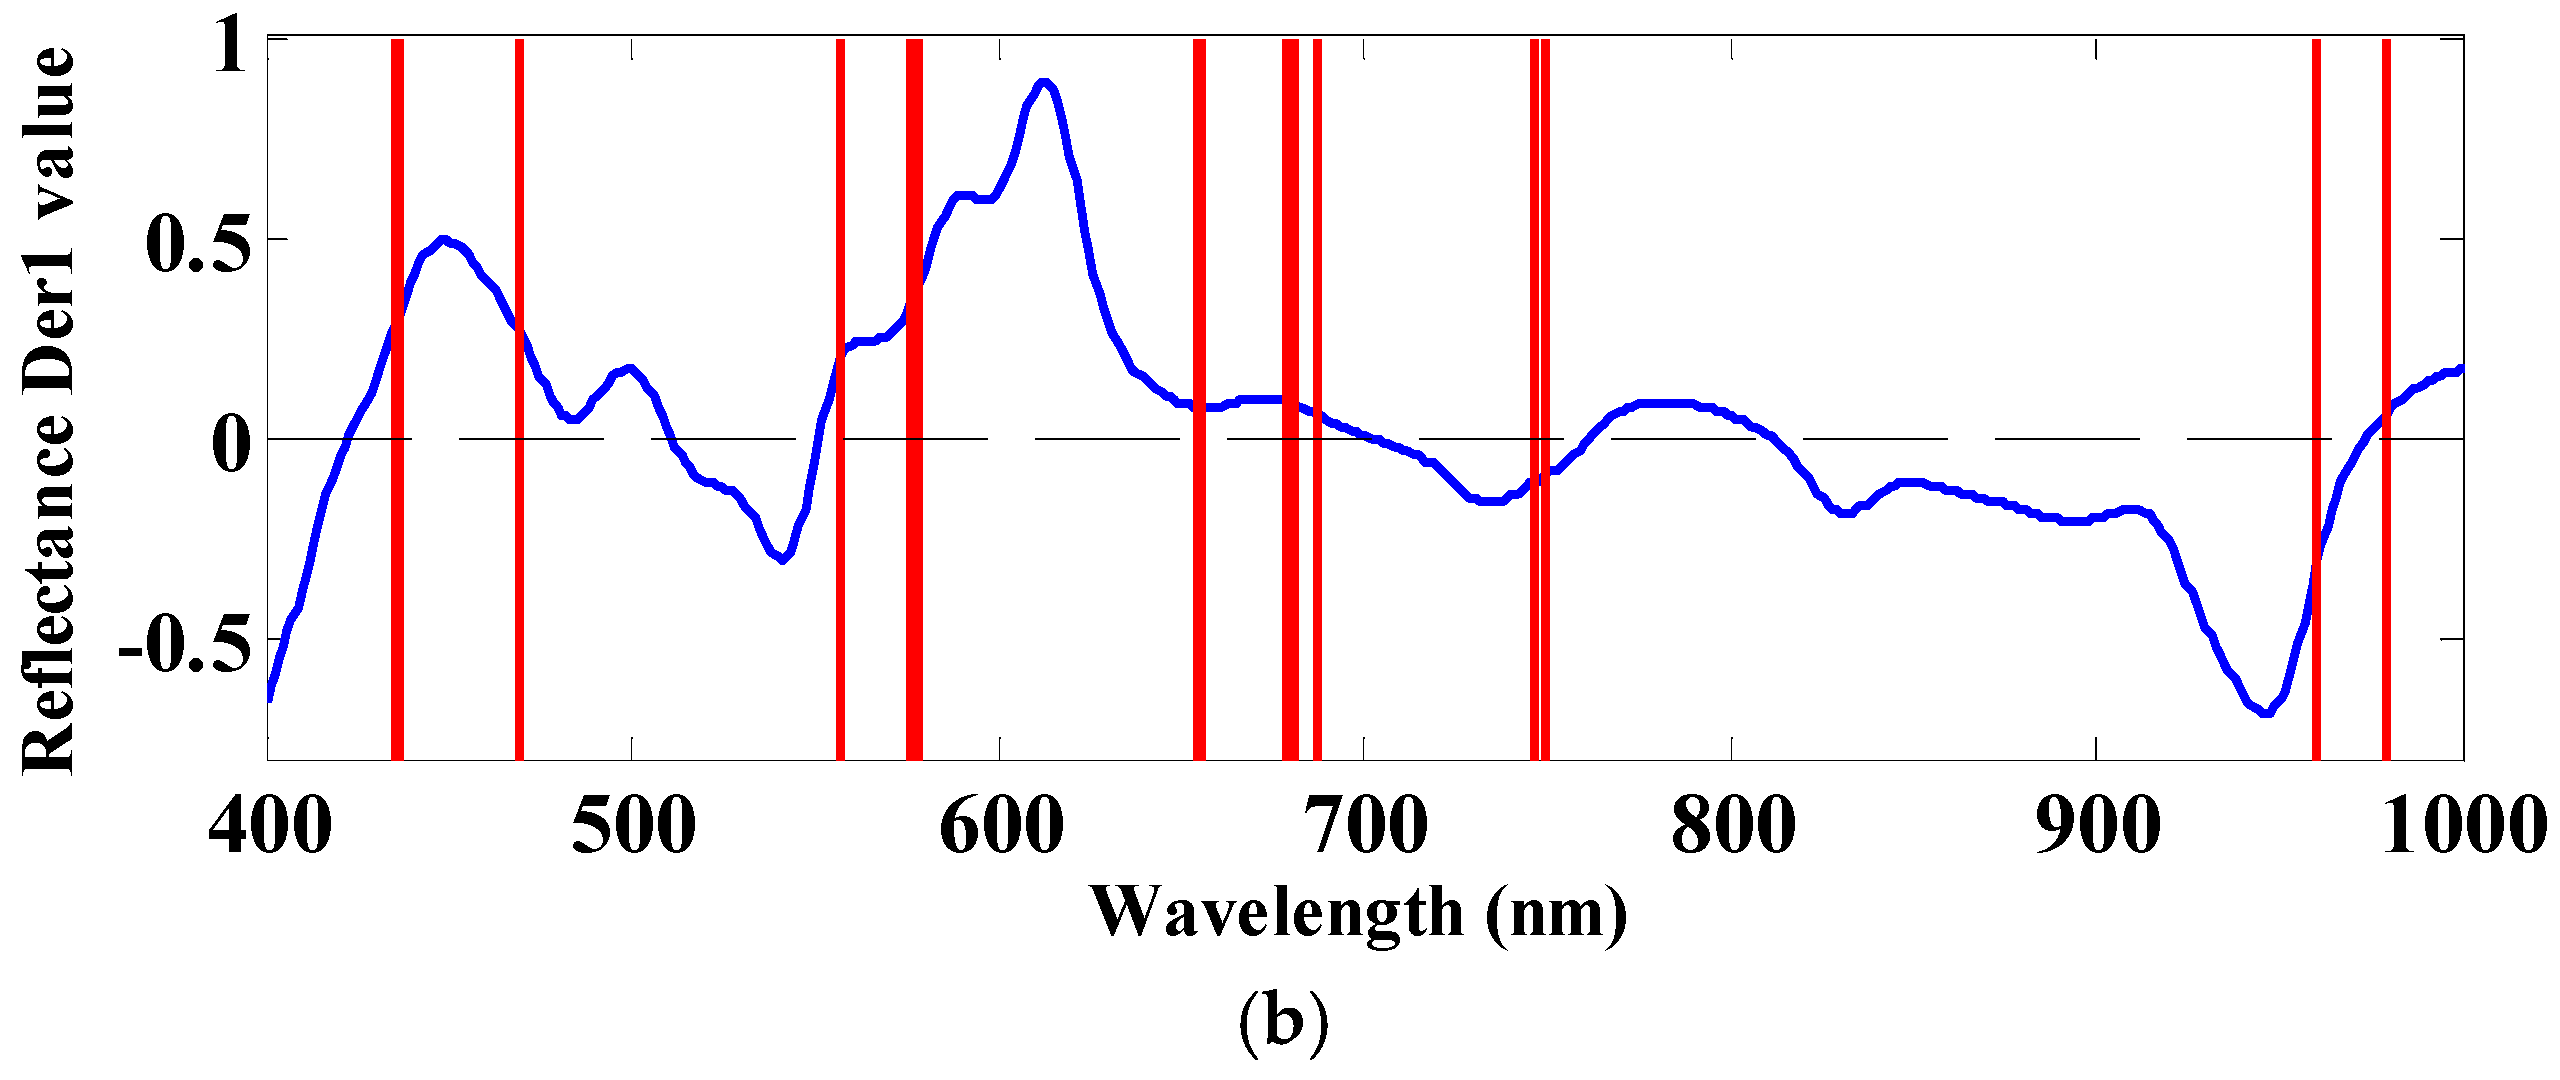
Although spectra of full wavelengths performed well in high-CL and low-CL classification, the contiguous wavelengths made the data processing time-consuming and inefficient. The utilization of fewer wavelengths is preferable for easier implementation of the multispectral imaging system. In total, 18 and 25 wavelengths were selected using CARS and UVE, respectively, and the distribution of selected wavelengths is shown in Figure 6. It is clear that CARS identifies relevant wavelengths across the entire spectral range, whereas UVE tends to spread relevant wavelengths only in the spectral range low to 600 nm. Furthermore, simplified PLS-DA models were developed using the two sets of selected wavelengths, respectively, and the CARS-PLS-DA model revealed overall better performance than the UVE-PLS-DA model (Table 3). This finding may be due to the addition of more visible wavelengths when using CARS, including more effective color information for the classification. Additionally, compared to the original PLS-DA model using the spectra of full wavelengths within the VNIR range (also presented in Table 3), comparable predictive power (CCR = 0.86 vs. 0.90 and 0.79 vs. 0.79) of the CARS-PLS-DA model could be observed.
To further evaluate the performance of the CARS-PLS-DA model, the actual categories against the predicted category of all samples predicted by the full-wavelength PLS-DA model and CARS-PLS-DA are compared in Figure 7. It could be observed that majority of predicted categories by CARS-PLS-DA model were the same as those by full-wavelength PLS-DA model, which indicated that the simplified model worked as effectively as the original model. Generally, the CARS-PLS-DA model performed acceptably regardless of considering the calibration set or prediction set (Figure 7c,d). As for the prediction set, 9 out of 12 high-CL fillets were correctly identified (sensitivity = 0.75), whilst only two low-CL fillets were misclassified as high-CL fillets (specificity = 0.83). This was mainly due to similarity in the membrane and structural integrity of cells of high-CL and low-CL samples when CL values were around 20%, which might lead to misclassification.
3.5. Classification Map of CL Categories
In contrast to conventional spectroscopy, the major advantage of HSI is the spatial distribution information involved. Since both detailed spectral and spatial information was included, the developed multivariate model obtained can be applied back to the hyperspectral images to map quality properties and/or the chemical distribution of pixels within each sample. In the literature, several researchers have implemented HSI successfully for meat classification in visualization forms [25,49,50]. For example, in predicting classifying pork muscle into three classes—pale, soft, and exudative (PSE), dark, firm, and dry (DFD), and reddish-pink, firm, and non-exudative (RFN) by HSI, Barbin et al. [25] created classification maps to present the diverse grades in all pixels within the samples. Kamruzzaman et al. [49] created the classification maps of different kinds of red meat (pork, beef, and lamb muscles) using a PLS-DA model. Pu et al. [50] built the classification maps using HSI system to classify and observe fresh and frozen-thawed pork. The overall results suggested that HSI could be implemented as a key component of a computer-integrated system to generate classification maps for the discrimination purposes. In this study, classification maps were generated tentatively by transferring the CARS-PLS-DA model to the pixels in hyperspectral images at selected wavelengths. Although it is hard to differentiate CL categories by the naked eye only by their RGB images in Figure 8 (Figure 8a,d), the spatial CL variation within a fillet could be identified via the classification maps. In pixel-level classification maps (Figure 8b,e), different categories representing high-CL and low-CL were visualized in red and green, respectively. The reference CL values were 29.08% and 16.31% for fillet A and B, respectively. As presented, the corresponding general CL category of fillets A and B can be identified by observing the color of the majority of the pixels (exceeding 50%) within each fillet to make a correct recognition. Furthermore, the classification maps at the fillet-level were also generated (Figure 8c,f) to show the finally classified results which could be used to automate the inspection in final quality grading. Overall, classification maps could also be successfully generated for CL classification in chicken fillets. HSI reveals that the advantages (which could benefit poultry meat producers and processors, retailers, and consumers alike) cannot be achieved by either conventional imaging or spectroscopy.
4. Conclusions
HSI and multivariate analyses have the potential to be used as rapid and non-destructive tools to classify the fresh broiler breast fillets into two categories, that is, high-CL and low-CL. Generally, the attempt to extract only the spectra in pixels of pure muscle tissue (related to water holding) showed satisfactory results. The optimal model developed by the VNIR full wavelengths using PLS-DA obtained CCRs of 0.90 and 0.79 for calibration and prediction sets, respectively. Moreover, 18 dominant wavelengths were selected by CARS to build the optimal simplified PLS-DA model, and comparable performance was yielded with CCRs of 0.86 and 0.79 for calibration and prediction sets, respectively. In order to facilitate the practical application of the CL classification results of chicken fillets, classification maps were generated. Although not very high accuracy was achieved (prediction set CCR = 0.79), the performance was better than in previous studies related to CL prediction by NIR spectroscopy in the meat industry. This encouraging result demonstrated that HSI is a promising tool for the CL evaluation of fresh chicken meat, and it could also be applied to CL classification of red meat species in further studies.
Acknowledgments
The authors would like to thank the organizations or individuals who contributed to this manuscript. This study is supported by the National Natural Science Foundation of China (No. 31772062).
Author Contributions
Hong Zhuang and Seungchul Yoon conceived and designed the experiments; Hong Zhuang and Seungchul Yoon performed the experiments; Hongzhe Jiang, Wei Wang and Yufeng Li analyzed the data; Hongzhe Jiang, Wei Wang and Yi Yang wrote the paper. All authors collaborated in the interpretation of the results and on the preparation of the manuscript.
Conflicts of Interest
The authors declare no conflict of interest.
References
- Barbut, S. Poultry Products Processing: An Industry Guide; CRC Press: Boca Raton, FL, USA, 2016; pp. 1–26. [Google Scholar]
- Bertram, H.C.; Andersen, H.J.; Karlsson, A.H.; Horn, P.; Hedegaard, J.; Nørgaard, L.; Engelsen, S.B. Prediction of technological quality (cooking loss and Napole Yield) of pork based on fresh meat characteristics. Meat Sci. 2003, 65, 707–712. [Google Scholar] [CrossRef]
- Tornberg, E. Effects of heat on meat proteins—Implications on structure and quality of meat products. Meat Sci. 2005, 70, 493–508. [Google Scholar] [CrossRef] [PubMed]
- Aaslyng, M.D.; Bejerholm, C.; Ertbjerg, P.; Bertram, H.C.; Andersen, H.J. Cooking loss and juiciness of pork in relation to raw meat quality and cooking procedure. Food Qual. Preference 2003, 14, 277–288. [Google Scholar] [CrossRef]
- Honikel, K.O. Reference methods for the assessment of physical characteristics of meat. Meat Sci. 1998, 49, 447–457. [Google Scholar] [CrossRef]
- Andrés, S.; Murray, I.; Navajas, E.A.; Fisher, A.V.; Lambe, N.R.; Bünger, L. Prediction of sensory characteristics of lamb meat samples by near infrared reflectance spectroscopy. Meat Sci. 2007, 76, 509–516. [Google Scholar] [CrossRef] [PubMed]
- Kapper, C.; Klont, R.E.; Verdonk, J.; Urlings, H. Prediction of pork quality with near infrared spectroscopy (NIRS): 1. Feasibility and robustness of NIRS measurements at laboratory scale. Meat Sci. 2012, 91, 294–299. [Google Scholar] [CrossRef] [PubMed]
- Bowker, B.; Hawkins, S.; Zhuang, H. Measurement of water-holding capacity in raw and freeze-dried broiler breast meat with visible and near-infrared spectroscopy. Poult. Sci. 2014, 93, 1834–1841. [Google Scholar] [CrossRef] [PubMed]
- Leroy, B.; Lambotte, S.; Dotreppe, O.; Lecocq, H.; Istasse, L.; Clinquart, A. Prediction of technological and organoleptic properties of beef longissimus thoracis from near-infrared reflectance and transmission spectra. Meat Sci. 2003, 66, 45–54. [Google Scholar] [CrossRef]
- Liu, Y.; Lyon, B.G.; Windham, W.R.; Lyon, C.E.; Savage, E.M. Prediction of physical, color, and sensory characteristics of broiler breasts by visible/near infrared reflectance spectroscopy. Poult. Sci. 2004, 83, 1467–1474. [Google Scholar] [CrossRef] [PubMed]
- Prieto, N.; Andrés, S.; Giráldez, F.J.; Mantecón, A.R.; Lavín, P. Ability of near infrared reflectance spectroscopy (NIRS) to estimate physical parameters of adult steers (oxen) and young cattle meat samples. Meat Sci. 2008, 79, 692–699. [Google Scholar] [CrossRef] [PubMed]
- Prevolnik, M.; Čandek-Potokar, M.; Škorjanc, D. Predicting pork water-holding capacity with NIR spectroscopy in relation to different reference methods. J. Food Eng. 2010, 98, 347–352. [Google Scholar] [CrossRef]
- Elmasry, G.M.; Nakauchi, S. Image analysis operations applied to hyperspectral images for non-invasive sensing of food quality—A comprehensive review. Biosyst. Eng. 2016, 142, 53–82. [Google Scholar] [CrossRef]
- Caporaso, N.; Whitworth, M.B.; Fisk, I.D. Protein content prediction in single wheat kernels using hyperspectral imaging. Food Chem. 2017, 240, 32–42. [Google Scholar] [CrossRef] [PubMed]
- Wang, W.; Lawrence, K.C.; Ni, X.; Yoon, S.C.; Heitschmidt, G.W.; Feldner, P. Near-infrared hyperspectral imaging for detecting aflatoxin B1, ofmaize kernels. Food Control 2015, 51, 347–355. [Google Scholar] [CrossRef]
- Caporaso, N.; Whitworth, M.B.; Fisk, I.D. Application of calibrations to hyperspectral images of food grains: Example for wheat falling number. J. Spectr. Imaging 2017, 6, 1–15. [Google Scholar] [CrossRef]
- Sun, M.; Zhang, D.; Li, L.; Wang, Z. How to predict the sugariness and hardness of melons: A near-infrared hyperspectral imaging method. Food Chem. 2017, 218, 413–421. [Google Scholar] [CrossRef] [PubMed]
- Leiva-Valenzuela, G.A.; Lu, R.; Aguilera, J.M. Prediction of firmness and soluble solids content of blueberries using hyperspectral reflectance imaging. J. Food Eng. 2013, 115, 91–98. [Google Scholar] [CrossRef]
- Liu, Y.; Chen, Y.R.; Wang, C.Y.; Chan, D.E.; Kim, M.S. Development of a simple algorithm for the detection of chilling injury in cucumbers from visible/near-infrared hyperspectral imaging. Appl. Spectrosc. 2005, 59, 78–85. [Google Scholar] [CrossRef] [PubMed]
- Lorente, D.; Aleixos, N.; Gómez-Sanchis, J.; Cubero, S.; García-Navarrete, O.L.; Blasco, J. Recent advances and applications of hyperspectral imaging for fruit and vegetable quality assessment. Food Bioprocess Technol. 2012, 5, 1121–1142. [Google Scholar] [CrossRef]
- Liu, L.; Ngadi, M.O. Detecting fertility and early embryo development of chicken eggs using near-infrared hyperspectral imaging. Food Bioprocess Technol. 2013, 6, 2503–2513. [Google Scholar] [CrossRef]
- Qu, J.H.; Cheng, J.H.; Sun, D.W.; Pu, H.; Wang, Q.J.; Ma, J. Discrimination of shelled shrimp (Metapenaeus ensis) among fresh, frozen-thawed and cold-stored by hyperspectral imaging technique. LWT-Food Sci. Technol. 2015, 62, 202–209. [Google Scholar] [CrossRef]
- Caporaso, N.; Whitworth, M.B.; Grebby, S.; Fisk, I.D. Non-destructive analysis of sucrose, caffeine and trigonelline on single green coffee beans by hyperspectral imaging. Food Res. Int. 2018, 106, 193–203. [Google Scholar] [CrossRef]
- Barbin, D.F.; Elmasry, G.M.; Sun, D.W.; Allen, P. Non-destructive determination of chemical composition in intact and minced pork using near-infrared hyperspectral imaging. Food Chem. 2013, 138, 1162–1171. [Google Scholar] [CrossRef] [PubMed]
- Barbin, D.F.; Elmasry, G.M.; Sun, D.W.; Allen, P. Near-infrared hyperspectral imaging for grading and classification of pork. Meat Sci. 2012, 90, 259–268. [Google Scholar] [CrossRef] [PubMed]
- Barbin, D.F.; Sun, D.W.; Su, C. NIR hyperspectral imaging as non-destructive evaluation tool for the recognition of fresh and frozen–thawed porcine longissimus dorsi, muscles. Innov. Food Sci. Emerg. Technol. 2013, 18, 226–236. [Google Scholar] [CrossRef]
- Elmasry, G.M.; Sun, D.W.; Allen, P. Chemical-free assessment and mapping of major constituents in beef using hyperspectral imaging. J. Food Eng. 2013, 117, 235–246. [Google Scholar] [CrossRef]
- Elmasry, G.M.; Sun, D.W.; Allen, P. Non-destructive determination of water-holding capacity in fresh beef by using NIR hyperspectral imaging. Food Res. Int. 2011, 44, 2624–2633. [Google Scholar] [CrossRef]
- Kamruzzaman, M.; Elmasry, G.M.; Sun, D.W.; Allen, P. Non-destructive assessment of instrumental and sensory tenderness of lamb meat using NIR hyperspectral imaging. Food Chem. 2013, 141, 389–396. [Google Scholar] [CrossRef] [PubMed]
- Wu, D.; Sun, D.W. Application of visible and near infrared hyperspectral imaging for non-invasively measuring distribution of water-holding capacity in salmon flesh. Talanta 2013, 116, 266–276. [Google Scholar] [CrossRef] [PubMed]
- Xiong, Z.; Sun, D.W.; Dai, Q.; Han, Z.; Zeng, X.A.; Wang, L. Application of visible hyperspectral imaging for prediction of springiness of fresh chicken meat. Food Anal. Methods 2015, 8, 380–391. [Google Scholar] [CrossRef]
- Xiong, Z.; Sun, D.W.; Pu, H.; Xie, A.; Han, Z.; Luo, M. Non-destructive prediction of thiobarbituricacid reactive substances (TBARS) value for freshness evaluation of chicken meat using hyperspectral imaging. Food Chem. 2015, 179, 175–181. [Google Scholar] [CrossRef] [PubMed]
- Feng, Y.Z.; Sun, D.W. Near-infrared hyperspectral imaging in tandem with partial least squares regression and genetic algorithm for non-destructive determination and visualization of Pseudomonas loads in chicken fillets. Talanta 2013, 109, 74–83. [Google Scholar] [CrossRef] [PubMed]
- Feng, Y.Z.; ElMasry, G.M.; Sun, D.W.; Scannell, A.G.; Walsh, D.; Morcy, N. Near-infrared hyperspectral imaging and partial least squares regression for rapid and reagentless determination of Enterobacteriaceae on chicken fillets. Food Chem. 2013, 138, 1829–1836. [Google Scholar] [CrossRef] [PubMed]
- Yoon, S.C.; Park, B.; Lawrence, K.C.; Windham, W.R.; Heitschmidt, G.W. Line-scan hyperspectral imaging system for real-time inspection of poultry carcasses with fecal material and ingesta. Comput. Electron. Agric. 2011, 79, 159–168. [Google Scholar] [CrossRef]
- Xiong, Z.; Sun, D.W.; Xie, A.; Han, Z.; Wang, L. Potential of hyperspectral imaging for rapid prediction of hydroxyproline content in chicken meat. Food Chem. 2015, 175, 417–422. [Google Scholar] [CrossRef] [PubMed]
- Zhuang, H.; Savage, E.M. Postmortem aging and freezing and thawing storage enhance ability of early deboned chicken pectoralis major muscle to hold added salt water. Poult. Sci. 2012, 91, 1203–1209. [Google Scholar] [CrossRef] [PubMed]
- Zhuang, H.; Savage, E.M. Variation and Pearson correlation coefficients of Warner-Bratzler shear force measurements within broiler breast fillets. Poult. Sci. 2009, 88, 214–220. [Google Scholar] [CrossRef] [PubMed]
- Yoon, S.C.; Lawrence, K.C.; Siragusa, G.R.; Line, J.E.; Park, B.; Feldner, P.W. Hyperspectral reflectance imaging for detecting a foodborne pathogen: Campylobacter. Trans. ASABE 2009, 52, 651–662. [Google Scholar] [CrossRef]
- Huff-Lonergan, E.; Lonergan, S.M. Mechanisms of water-holding capacity of meat: The role of postmortem biochemical and structural changes. Meat Sci. 2005, 71, 194–204. [Google Scholar] [CrossRef] [PubMed]
- Barker, M.; Rayens, W. Partial least squares for discrimination. J. Chemom. 2003, 17, 166–173. [Google Scholar] [CrossRef]
- Chen, Q.; Zhao, J.; Fang, C.H.; Wang, D. Feasibility study on identification of green, black and Oolong teas using near-infrared reflectance spectroscopy based on support vector machine (SVM). Spectrochim. Acta Part A 2007, 66, 568–574. [Google Scholar] [CrossRef] [PubMed]
- Centner, V.; Massart, D.L.; De Noord, O.E.; De, J.S.; Vandeginste, B.M.; Sterna, C. Elimination of uninformative variables for multivariate calibration. Anal. Chem. 1996, 68, 3851–3858. [Google Scholar] [CrossRef] [PubMed]
- Li, H.; Liang, Y.; Xu, Q.; Cao, D. Key wavelengths screening using competitive adaptive reweighted sampling method for multivariate calibration. Anal. Chim. Acta 2009, 648, 77–84. [Google Scholar] [CrossRef] [PubMed]
- Bowker, B.; Zhuang, H. Relationship between water-holding capacity and protein denaturation in broiler breast meat. Poult. Sci. 2015, 94, 1657–1664. [Google Scholar] [CrossRef] [PubMed]
- Qiao, M.; Fletcher, D.L.; Smith, D.P.; Northcutt, J.K. Effects of raw broiler breast meat color variation on marination and cooked meat quality. Poult. Sci. 2002, 81, 276–280. [Google Scholar] [CrossRef] [PubMed]
- Liu, Y.L.; Chen, Y.R. Two-dimensional correlation spectroscopy study of visible and near-infrared spectral variations of chicken meats in cold storage. Appl. Spectrosc. 2000, 54, 1458–1470. [Google Scholar] [CrossRef]
- Samuel, D.; Park, B.; Sohn, M.; Wicker, L. Visible-near-infrared spectroscopy to predict water-holding capacity in normal and pale broiler breast meat. Poult. Sci. 2011, 90, 914–921. [Google Scholar] [CrossRef] [PubMed]
- Kamruzzaman, M.; Barbin, D.; Elmasry, G.M.; Sun, D.W.; Allen, P. Potential of hyperspectral imaging and pattern recognition for categorization and authentication of red meat. Innov. Food Sci. Emerg. Technol. 2012, 16, 316–325. [Google Scholar] [CrossRef]
- Pu, H.; Sun, D.W.; Ma, J.; Cheng, J.H. Classification of fresh and frozen-thawed pork muscles using visible and near infrared hyperspectral imaging and textural analysis. Meat Sci. 2015, 99, 81–88. [Google Scholar] [CrossRef] [PubMed]
Figure 1.
Main steps for experimental procedure and CL analysis of broiler breast meat by VNIR HSI. VNIR: visible and near infrared; HSI: hyperspectral imaging; ROI: region of interest; SNV: standard normal variate; MSC: multiplicative scatter correction; Der1: first-order derivative; Der2: second-order derivative; PLS-DA: partial least square-discriminant analysis; RBF-SVM: radial basis function support vector machine; CARS: competitive adaptive reweighted sampling; UVE: uninformative variable elimination; CL: cooking loss; WBSF: Warner-Bratzler shear force.

Figure 2.
The main steps of image segmentation. (a) Whole meat mask (band 695–band 422); (b) Lowest reflectance image (band 422); (c) Highest reflectance image (band 695); (d) Irregular shadow mask; (e) Specular reflection or fat mask; (f) Muscle tissue mask to be used as the region of interest (ROI).

Figure 3.
Sample distribution of 74 fillets based on mean CL values.

Figure 4.
Mean VNIR spectra of broiler breast fillets with high CL and low CL.

Figure 5.
The optimal number of latent variables determination in the PLS-DA model.

Figure 6.
The indication of selected wavelengths by (a) CARS and (b) UVE. Blue lines: original Der1 spectral curve; Red lines: selected wavelengths.
Figure 6.
The indication of selected wavelengths by (a) CARS and (b) UVE. Blue lines: original Der1 spectral curve; Red lines: selected wavelengths.
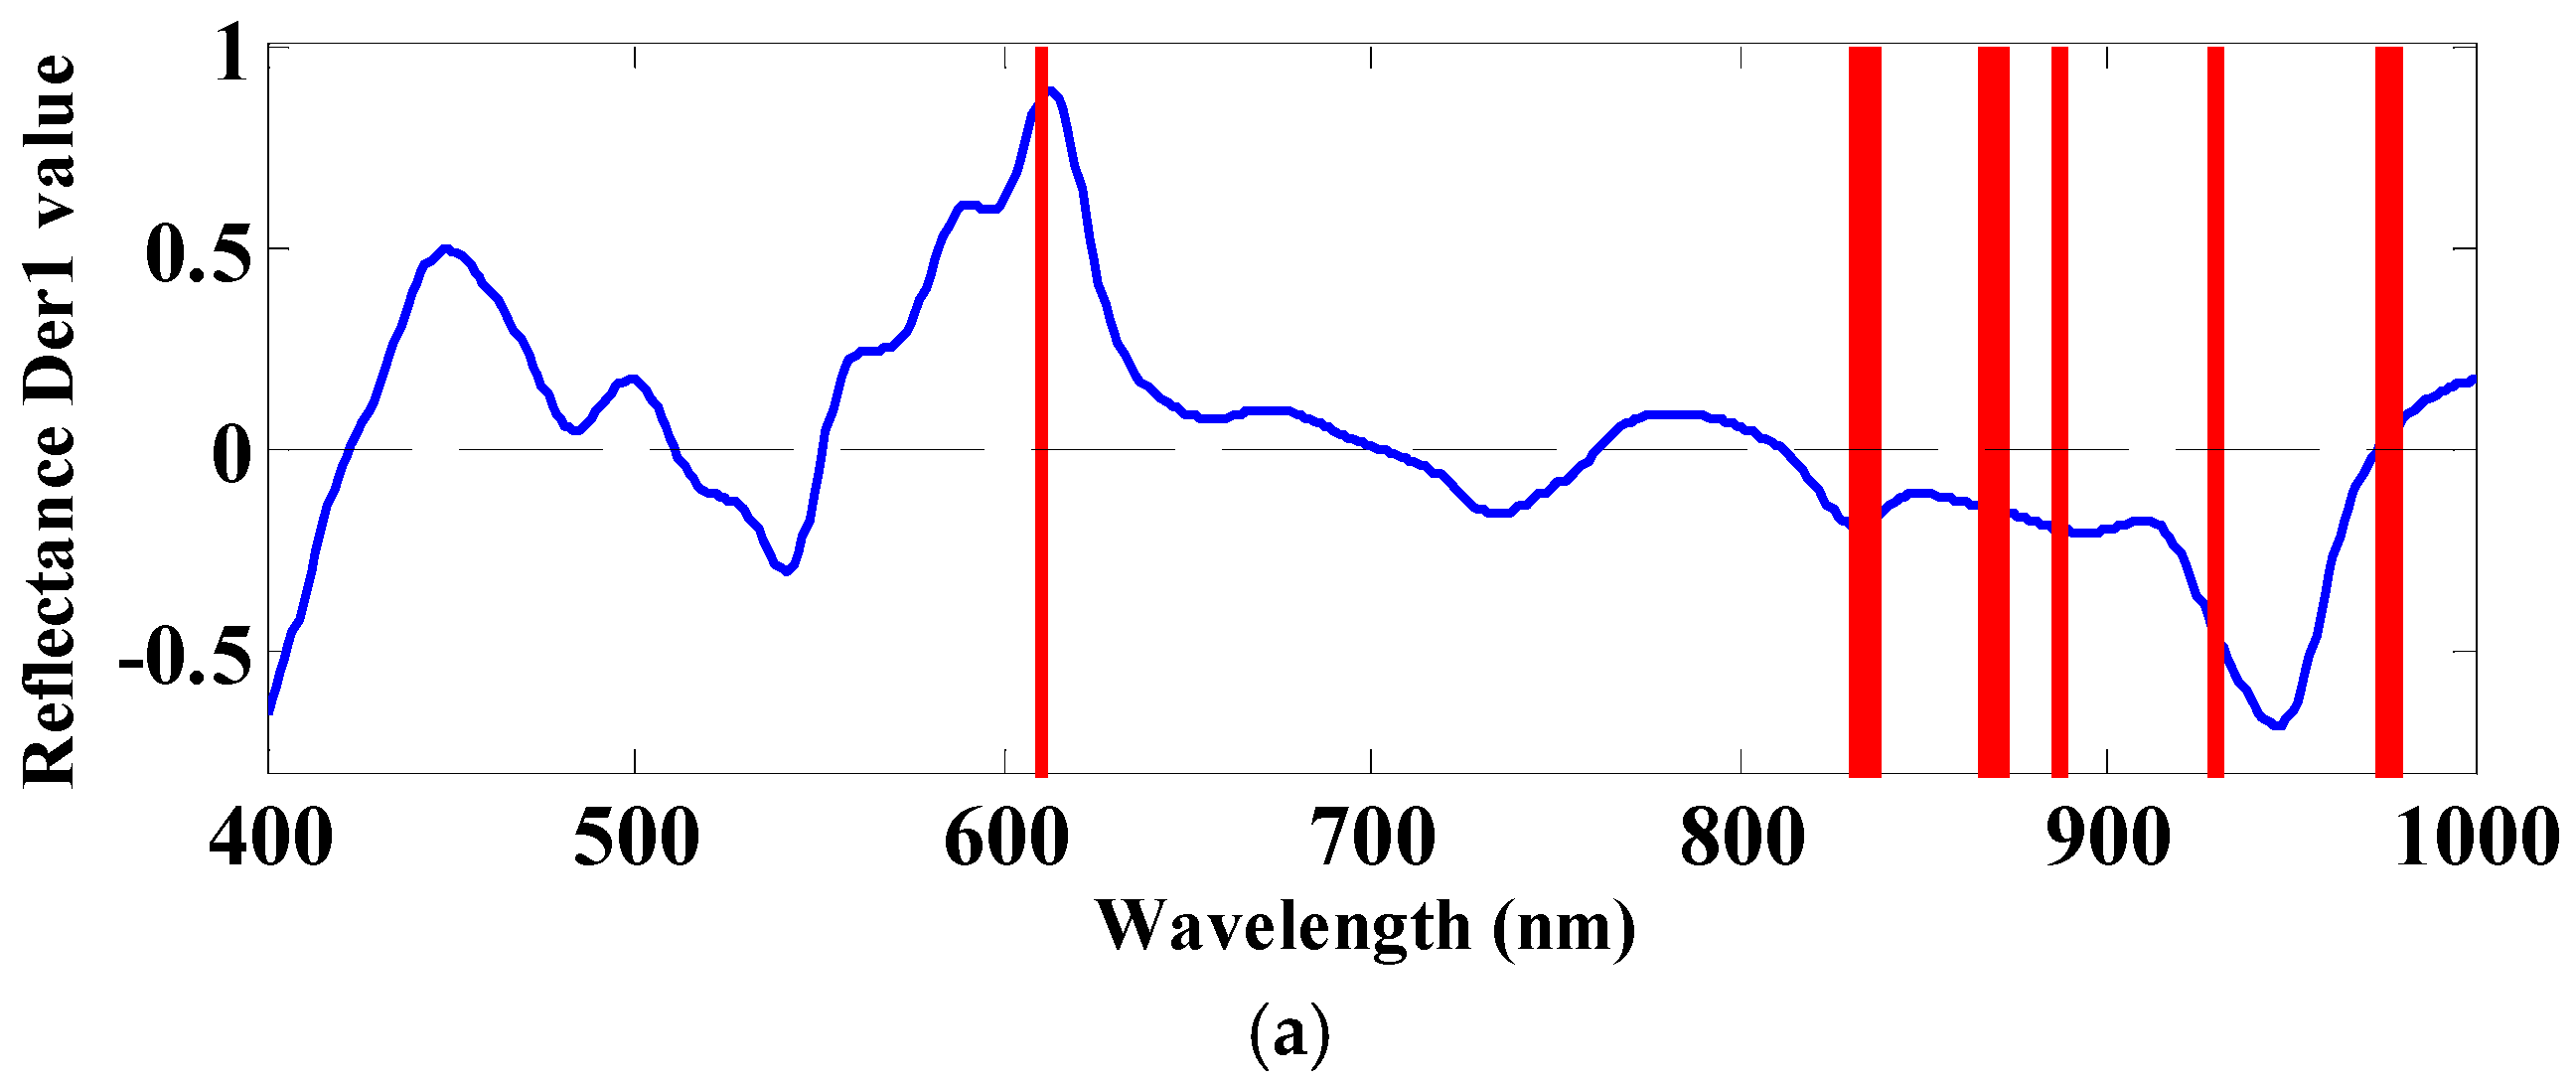

Figure 7.
Performance of the full-wavelength PLS-DA model and the CARS-PLS-DA model. (a) Calibration set of the full-wavelength PLS-DA model; (b) Prediction set of the full-wavelength PLS-DA model; (c) Calibration set of the simplified CARS-PLS-DA model; (d) Prediction set of the simplified CARS-PLS-DA model.

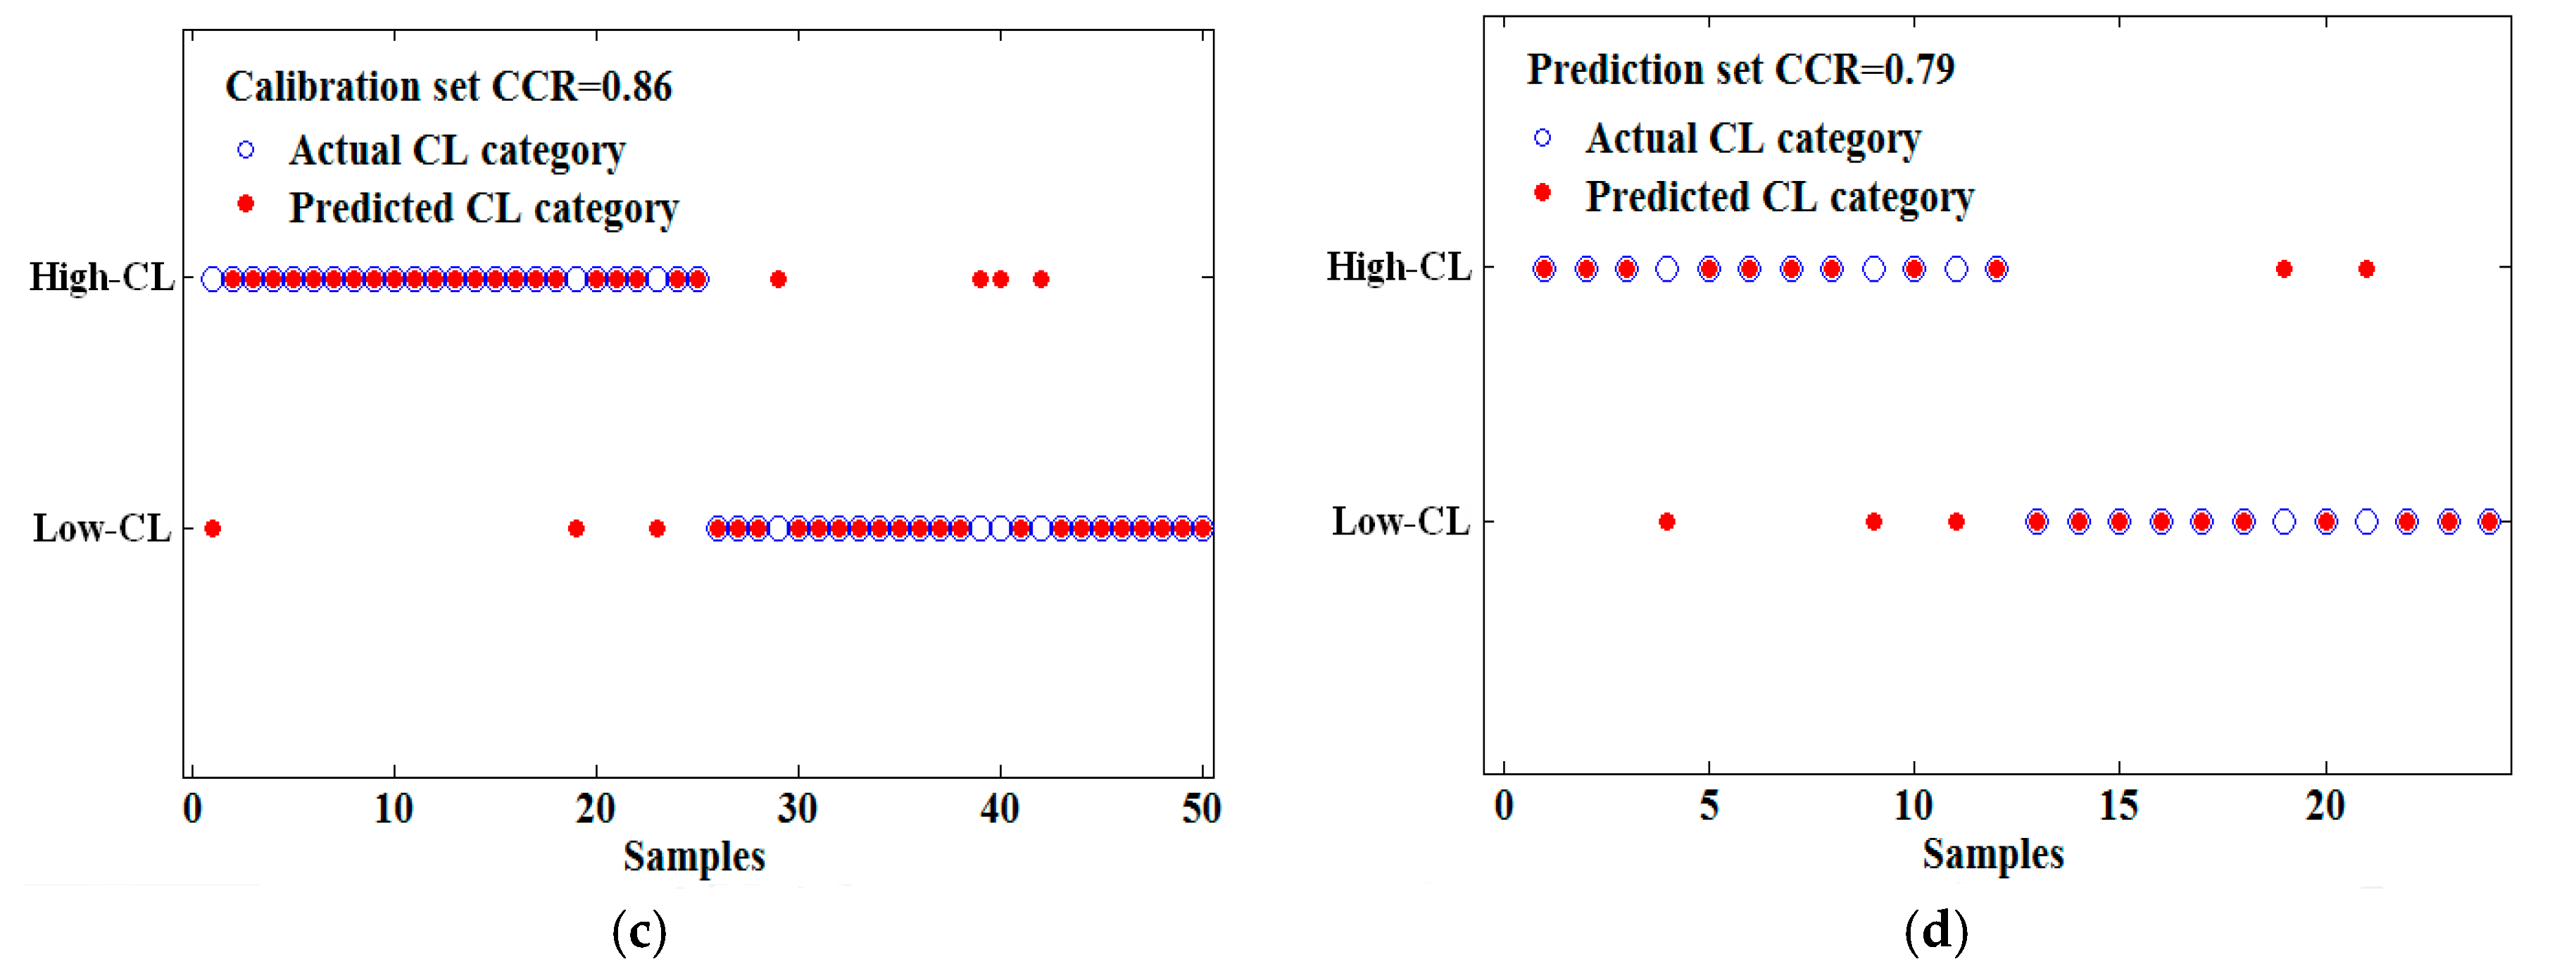
Figure 8.
Classification maps of CL categories at the pixel and fillet level. (a,d) Fillet pseudo-color images; (b,e) Pixel-level classification maps; (c,f) Fillet-level classification maps.
Figure 8.
Classification maps of CL categories at the pixel and fillet level. (a,d) Fillet pseudo-color images; (b,e) Pixel-level classification maps; (c,f) Fillet-level classification maps.


Table 1.
Quality attributes of broiler breast fillets with high-CL and low-CL.
| Trait | High-CL Fillets (n = 37) | Low-CL Fillets (n = 37) | ||||
|---|---|---|---|---|---|---|
| Min. | Max. | Mean ± SD | Min. | Max. | Mean ± SD | |
| L* | 47.29 | 63.76 | 57.35 ± 3.26 a | 48.39 | 61.60 | 56.45 ± 2.79 a |
| a* | −1.51 | 1.71 | 0.20 ± 0.84 a | −1.39 | 1.96 | −0.11 ± 0.84 a |
| b* | 8.88 | 16.32 | 12.61 ± 1.78 a | 8.55 | 17.48 | 12.17 ± 1.90 a |
| pH | 5.75 | 6.24 | 6.01 ± 0.11 b | 5.84 | 6.27 | 6.06 ± 0.12 a |
| WBSF (kgf) | 1.66 | 12.08 | 5.06 ± 2.43 a | 2.64 | 8.24 | 4.27 ± 1.26 b |
| CL (%) | 20.02 | 36.18 | 22.05 ± 2.96 a | 15.17 | 19.76 | 18.15 ± 1.25 b |
a,b Mean values with no common superscript in the same row are significantly different from each other (p < 0.1). kgf: kilogram force. SD, standard deviation.
Table 2.
Performance of models based on visible and near-infrared (VNIR) full wavelengths with optimal preprocessing. LV: latent variable; CCR: correct classification rate 1.
Table 2.
Performance of models based on visible and near-infrared (VNIR) full wavelengths with optimal preprocessing. LV: latent variable; CCR: correct classification rate 1.
| Method | Preprocessing | LVs | Calibration Set CCR | Prediction Set CCR |
|---|---|---|---|---|
| PLS-DA | Der1 | 11 | 0.90 | 0.79 |
| RBF-SVM | Der2 | - | 1.00 | 0.79 |
1 PLS-DA, partial least square-discriminant analysis; RBF-SVM, radial basis function-support vector machine.
Table 3.
Performance comparison of full-wavelength and simplified PLS-DA models based on selected wavelengths by competitive adaptive reweighted sampling (CARS) and uninformative variable elimination (UVE).
Table 3.
Performance comparison of full-wavelength and simplified PLS-DA models based on selected wavelengths by competitive adaptive reweighted sampling (CARS) and uninformative variable elimination (UVE).
| Methods | Wavelengths (nm) | Number | LVs | Calibration CCR | Prediction CCR |
|---|---|---|---|---|---|
| CARS | 434, 435, 436, 469, 557, 576, 578, 654, 656, 679, 681, 686, 687, 747, 750, 960, 978, 979 | 18 | 13 | 0.86 | 0.79 |
| UVE | 610, 611, 831, 832, 833, 835, 836, 837, 838, 866, 867, 868, 870, 871, 872, 886, 888, 929, 930, 931, 974, 976, 977, 978, 979 | 25 | 12 | 0.78 | 0.71 |
© 2018 by the authors. Licensee MDPI, Basel, Switzerland. This article is an open access article distributed under the terms and conditions of the Creative Commons Attribution (CC BY) license (http://creativecommons.org/licenses/by/4.0/).
Share and Cite
MDPI and ACS Style
Jiang, H.; Wang, W.; Zhuang, H.; Yoon, S.; Li, Y.; Yang, Y. Visible and Near-Infrared Hyperspectral Imaging for Cooking Loss Classification of Fresh Broiler Breast Fillets. Appl. Sci. 2018, 8, 256. https://doi.org/10.3390/app8020256
AMA Style
Jiang H, Wang W, Zhuang H, Yoon S, Li Y, Yang Y. Visible and Near-Infrared Hyperspectral Imaging for Cooking Loss Classification of Fresh Broiler Breast Fillets. Applied Sciences. 2018; 8(2):256. https://doi.org/10.3390/app8020256
Chicago/Turabian StyleJiang, Hongzhe, Wei Wang, Hong Zhuang, Seungchul Yoon, Yufeng Li, and Yi Yang. 2018. "Visible and Near-Infrared Hyperspectral Imaging for Cooking Loss Classification of Fresh Broiler Breast Fillets" Applied Sciences 8, no. 2: 256. https://doi.org/10.3390/app8020256
Note that from the first issue of 2016, this journal uses article numbers instead of page numbers. See further details here.