Article

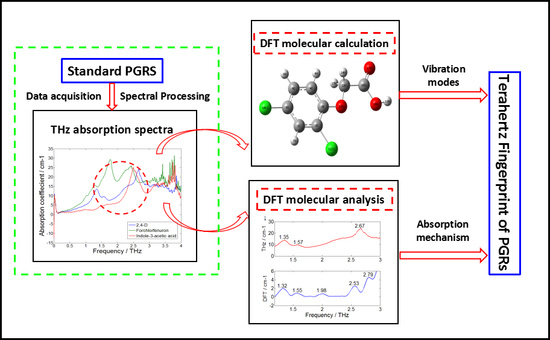
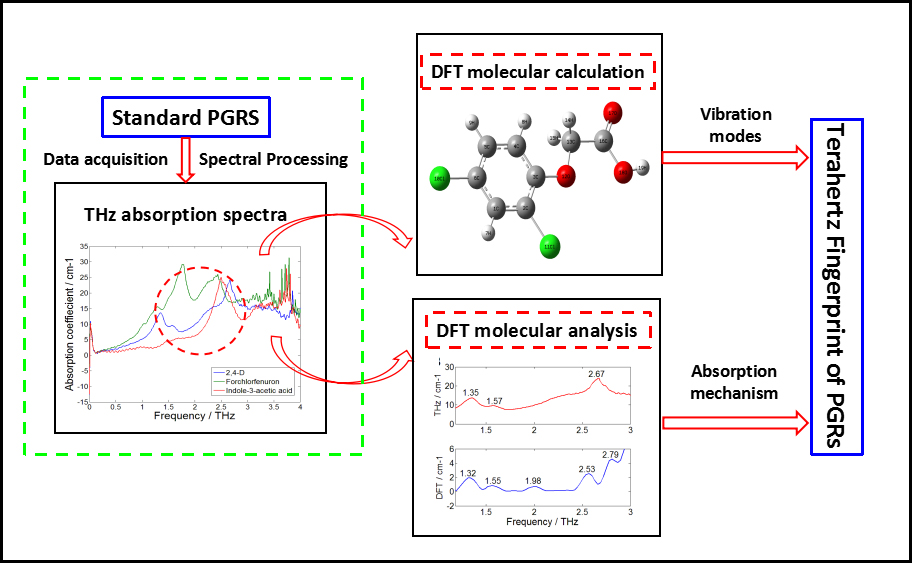
Molecular Characterization and Theoretical Calculation of Plant Growth Regulators Based on Terahertz Time-Domain Spectroscopy

1
College of Biosystems Engineering and Food Science, Zhejiang University, Hangzhou 310058, China
2
Key Laboratory of Sensors Sensing, Ministry of Agriculture, Zhejiang University, Hangzhou 310058, China
3
State Key Laboratory of Modern Optical Instrumentation, Zhejiang University, Hangzhou 310058, China
*
Author to whom correspondence should be addressed.
Appl. Sci. 2018, 8(3), 420; https://doi.org/10.3390/app8030420
Submission received: 21 January 2018 / Revised: 15 February 2018 / Accepted: 4 March 2018 / Published: 12 March 2018
(This article belongs to the Special Issue Laser Processing for Bioengineering Applications)

Abstract

:

Featured Application

Identification and detection of pesticide residues in crops.

Abstract

Terahertz (THz), as an advanced spectral technology, has unique absorption characteristics for most biological macromolecules. In this work, the theoretical fundamentals for the application of THz time-domain spectroscopy (THz-TDS) to molecular characterization and fingerprint peak detection of three plant growth regulators (PGRs), including 2,4-Dichlorophenoxyacetic acid (2,4-D), forchlorfenuron (CPPU) and indole-3-acetic acid (IAA) were researched. Meanwhile, the effects of eight types of window functions on THz spectra were studied when converting time-domain spectra into frequency-domain spectra by Fourier transform. Based on the optimal window function, the THz absorption coefficient and refractive index of PGRs in frequencies of 0.2–3 THz were extracted. The molecule structure and vibration mode of three PGR samples were simulated by using density functional theory (DFT). The results showed that the three PGRs had different fingerprint peaks. Characteristic absorption and anomalous dispersion of 2,4-D were found at 1.35, 1.57 and 2.67 THz, those of CPPU were found at 1.77 and 2.44 THz, and the absorption peak of IAA was located at 2.5 THz. The absorption peaks obtained from THz spectra were identified according to the theoretical calculation results of DFT. These fingerprint peaks in THz spectra were generated by the interior stretching vibration and external deformation vibration of molecular groups. The experimental results revealed the feasibility of identifying PGRs species and detecting residues using THz-TDS.

Graphical Abstract

1. Introduction

Plant growth regulators (PGRs) are synthetic organic compounds with natural plant hormone activity, which can be used to regulate the growth process of plants [1,2]. Among them, 2,4-Dichlorophenoxyacetic acid (2,4-D), forchlorfenuron (CPPU) and indole-3-acetic acid (IAA) are widely applied in agricultural and horticultural practices. 2,4-D is a commonly used auxin analogue for inducing callus formation [3]. It effectively stimulates the growth of plants at low concentration. However, it inhibits growth or even poisons plants when the concentration is high [4]. Thus, it is widely used as a herbicide to control broad-leaved weeds and gramineous weeds [5]. CPPU is a phenyl-urea plant growth regulator with cytokinin activity that can promote cell division and expansion, improve photosynthesis efficiency and enzyme activity, promote organ formation and protein synthesis, increase resistance and delay aging [6]. It has wide application prospects in agricultural production, such as the promotion of fruit growth and the prevention of fruits dropping [7]. IAA is a hormone reagent that stimulates plant growth, which can promote plant cell growth, division and vascular bundle differentiation [8]. At the same time, it plays an important regulatory role in plant rooting, sex differentiation, fruit formation, maturation, aging and shedding, and it has been widely used in agricultural production regulation and ripening of vegetables and fruits [9,10]. With the development of new types of PGRs, the applications of PGRs are becoming increasingly widespread, and they are important measures for realizing agricultural overproduction [11]. However, due to the toxicity and harmfulness of PGRs, blind and excessive use of PGRs will cause environmental pollution and food safety issues [12]. In agricultural production, we should not only pay attention to the effects of PGRs on plants, but also the toxicity and residue of PGRs. At present, the main methods for detecting PGR residues are high-performance liquid chromatography (HPLC), gas chromatography (GC) and ultra-performance liquid chromatography–tandem mass spectrometry (UPLC-MS) [13,14,15]. However, the pretreatment processes of these methods are complicated, and the detection efficiency is low [16]. Therefore, it is of urgent need to develop an accurate, convenient, sensitive and qualitative method for PGR detection.
As an advanced technology, terahertz (THz) has received more and more attention in the field of biological sciences [17,18,19]. It has unique absorption characteristics for heterogeneous and biological macromolecules. In general, the vibrational absorption frequency of organic intramolecular chemical bonds is mainly in the infrared band [20,21], apart from the weak interaction between molecules, such as hydrogen bonds, Van Der Waals force, dipole rotation and vibrational transition, and the low-frequency vibrational absorption of crystal lattices are all in the THz band (0.1–10 THz) [22]. The molecular structure and environmental information reflected by these vibrations have obvious responses in different absorption locations and absorption intensities in the THz band. Therefore, material composition, structure and other information can be analyzed through the characteristic absorption of THz radiation [23,24]. Researchers have achieved many remarkable results in the field of chemical composition analysis of substances using THz-TDS. Yan et al. [25] obtained the optical characteristics of organophosphorus pesticide acephate using THz-TDS, and absorption peaks were found at 1.58 and 2.10 THz. The calculated results by DFT showed that the absorption features were caused by the collective vibrational and torsional modes, and different absorption peaks corresponded to different vibrational modes. Baek et al. [26] investigated the feasibility of detecting melamine in foodstuffs using THz-TDS. Characteristic absorption peaks of melamine were found at 2, 2.26, and 2.6 THz. The calibration curve of melamine showed a regression coefficient was higher than 0.913, and the detection limit was lower than 13%. Zhang et al. [27] illustrated the theory for the application of THz vibrational spectroscopy to molecular characterization of saccharide molecules. In addition, the percentage contributions of the intermolecular and intramolecular vibrations to the normal mode was quantified. Cheon et al. [28] presented THz molecular resonance fingerprints of DNA methylation in cancer DNA. The results showed that the resonance signals could be quantified to identify the types of cancer cells with a certain degree of DNA methylation. All this research revealed the existence of molecular resonance fingerprints and their pioneering applications by using the technology of THz radiation.
In this paper, the THz absorption and refraction properties of 2,4-D, CPPU and IAA were studied by using THz-TDS. The window functions, including Boxcar, Triangular, Happ Genzel, Blackman-Harris 3 term, Blackman-Harris 4 term, Norton-Beer Weak, Norton-Beer Medium and Norton-Beer Strong, were applied to process the THz spectra of the PGRs. The geometric structure and absorption peaks of PGRs in frequencies of 0.2–3 THz were identified by using the density functional theory (DFT) in Gaussian 2009 software. The present work was undertaken to identify the characteristic absorption peaks of PGRs in the THz region, discuss the effect of window functions on THz spectra, and evaluate the feasibility of detecting PGR species and residues using THz-TDS.

2. Materials and Methods

2.1. Sample Preparation

The three PGR powders (analytic grade ≥ 98.8%) listed in Table 1 were purchased from Sigma-Aldrich (St. Louis, MO, USA). PGR samples were prepared by homogenizing the powder in agate mortar, sifting with 100 mesh, mixing with polyethylene powder (Sigma-Aldrich) at a ratio of 1:1, and then pressing the mixture into pellets with a pressure of 30 MPa for 4 min. For comparison, the pellet of pure polyethylene was prepared as reference. It had very weak absorption to THz wave and nearly had no influence on the absorption characteristic of the PGRs. The prepared PGR samples were disc-shaped tablets with diameters of 13 mm and thicknesses of about 1.3–1.6 mm. Qualified samples should have a smooth surface, uniform structure and no breakage. Additionally, the two surfaces need to be parallel to reduce the multiple reflections during the measurement.

2.2. Spectral Acquisition

A THz time-domain spectrometer (Teraview, UK) was applied for spectral acquisition. The central wavelength of the femtosecond laser pulse was 1030 nm, the pulse width was 90 fs, the spectral range was 0.06–4 THz, the spectral resolution was 1.7 GHz, and the scanning precision was 50–150 um. In order to avoid the effect of moisture in air on the test results, the sample bin was filled with nitrogen and the humidity inside the system was less than 2.5%. Additionally, the laboratory temperature was 294 K, and the humidity was below 20%. Meanwhile, the THz time-domain spectra of polyethylene were taken as references. The spectra of references and PGR samples were scanned repeatedly 900 times, and the mean spectra were taken as the acquired data to reduce the effects of random noise. The mean time-domain spectra were transformed into the frequency-domain spectra by Fast Fourier Transform (FFT). On the basis of the Fresnel formula, the absorption coefficient α ( ω ) and refractive index n ( ω ) of the measured sample could be extracted. First, the transmittance T ( ω ) of the sample was expressed as:
T ( ω ) = E s a m p l e ( ω ) E r e f ( ω ) = 4 n ( ω ) [ n ( ω ) + 1 ] 2 E 0 ( ω ) exp [ j ( ω n ( ω ) ω c k ( ω ) ω c ) d ]
E r e f ( ω ) = E 0 ( ω ) exp ( j ω t + j ω c g )
E s a m p e ( ω ) = 1 n ( ω ) + 1 2 n ( ω ) n ( ω ) + 1 E 0 ( ω ) exp ( k ( ω ) ω c d ) exp [ j ω t + i ω c ( g d ) + j n ( ω ) ω c d ]
where ω = 2 π f and f was the frequency. d was the thickness of the sample. g was the distance that THz pulse traveled in free space. c was the speed of light. j was the imaginary part. E 0 ( ω ) was the emitted frequency-domain spectrum. The reference spectrum E r e f ( ω ) was the transmitted frequency-domain waveform received by the detector after passing through the polyethylene. The sample spectrum E s a m p l e ( ω ) was the frequency-domain waveform received by the detector after passing through the sample. 1 / ( n ( ω ) + 1 ) was the transmission coefficient of the THz pulse that entered the sample. 2 n ( ω ) / ( n ( ω ) + 1 ) was the transmission coefficient of the terahertz pulse that exited from the sample.
The absorption coefficient α ( ω ) and refractive index n ( ω ) of the sample were calculated as:
α ( ω ) = 2 k ( ω ) ω c
n ( ω ) = ϕ ( ω ) c ω d + 1
The macroscopic optical properties of the measured sample could be expressed by the complex refractive index n ˜ ( ω ) = n ( ω ) j k ( ω ) . n ( ω ) was the actual refractive index of the sample, which described the dispersion of the sample. k ( ω ) was the extinction coefficient, which described the absorption characteristics of the sample. ϕ ( ω ) was the phase difference between the spectrum of the sample and the reference.

2.3. Data Processing

According to the process of THz spectral acquisition, the time-domain spectra need to be converted into the frequency-domain spectra by FFT first. Then, the THz optical parameters, such as the absorption coefficient and refractive index, are calculated based on the Fresnel formula. As an integral expression for continuous functions, theoretically, FFT assumes that the period of the time signal is infinite. However, only part of the data is intercepted in the actual analysis. Therefore, the basic concept of the data window or data block is adopted, and a limited amount of data is extracted from the continuous-time signal using the tool of window [29]. Finally, the extracted data in the window is calculated by FFT. The purpose of applying the window is to reduce the energy leakage and to improve the picket fence effect [30]. Applying the window in time-domain spectrum shows the characteristic of multiplication, and it shows the characteristic of convolution in the frequency-domain. Additionally, the smoothing process of convolution can be viewed as a set of filters with specific functions. As a result, the energy leakage is reduced because the energy of the original signal at a certain frequency band is displayed in combination with the shape of the filter. Because part of the energy of the original signal will be attenuated by applying the window function, a correction factor needs to be added to the final result. In linear spectrum analysis, the amplitude coefficient is generally used as the correction factor. The energy coefficient is generally used in the power spectrum [31,32]. In this paper, eight window functions (apodization functions), including Boxcar, Triangular, Happ-Genzel, Blackman-Harris 3 terms, Blackman-Harris 4 terms, Norton-Beer Weak, Norton-Beer Medium and Norton-Beer Strong, were used to process the THz spectra.

3. Results and Discussion

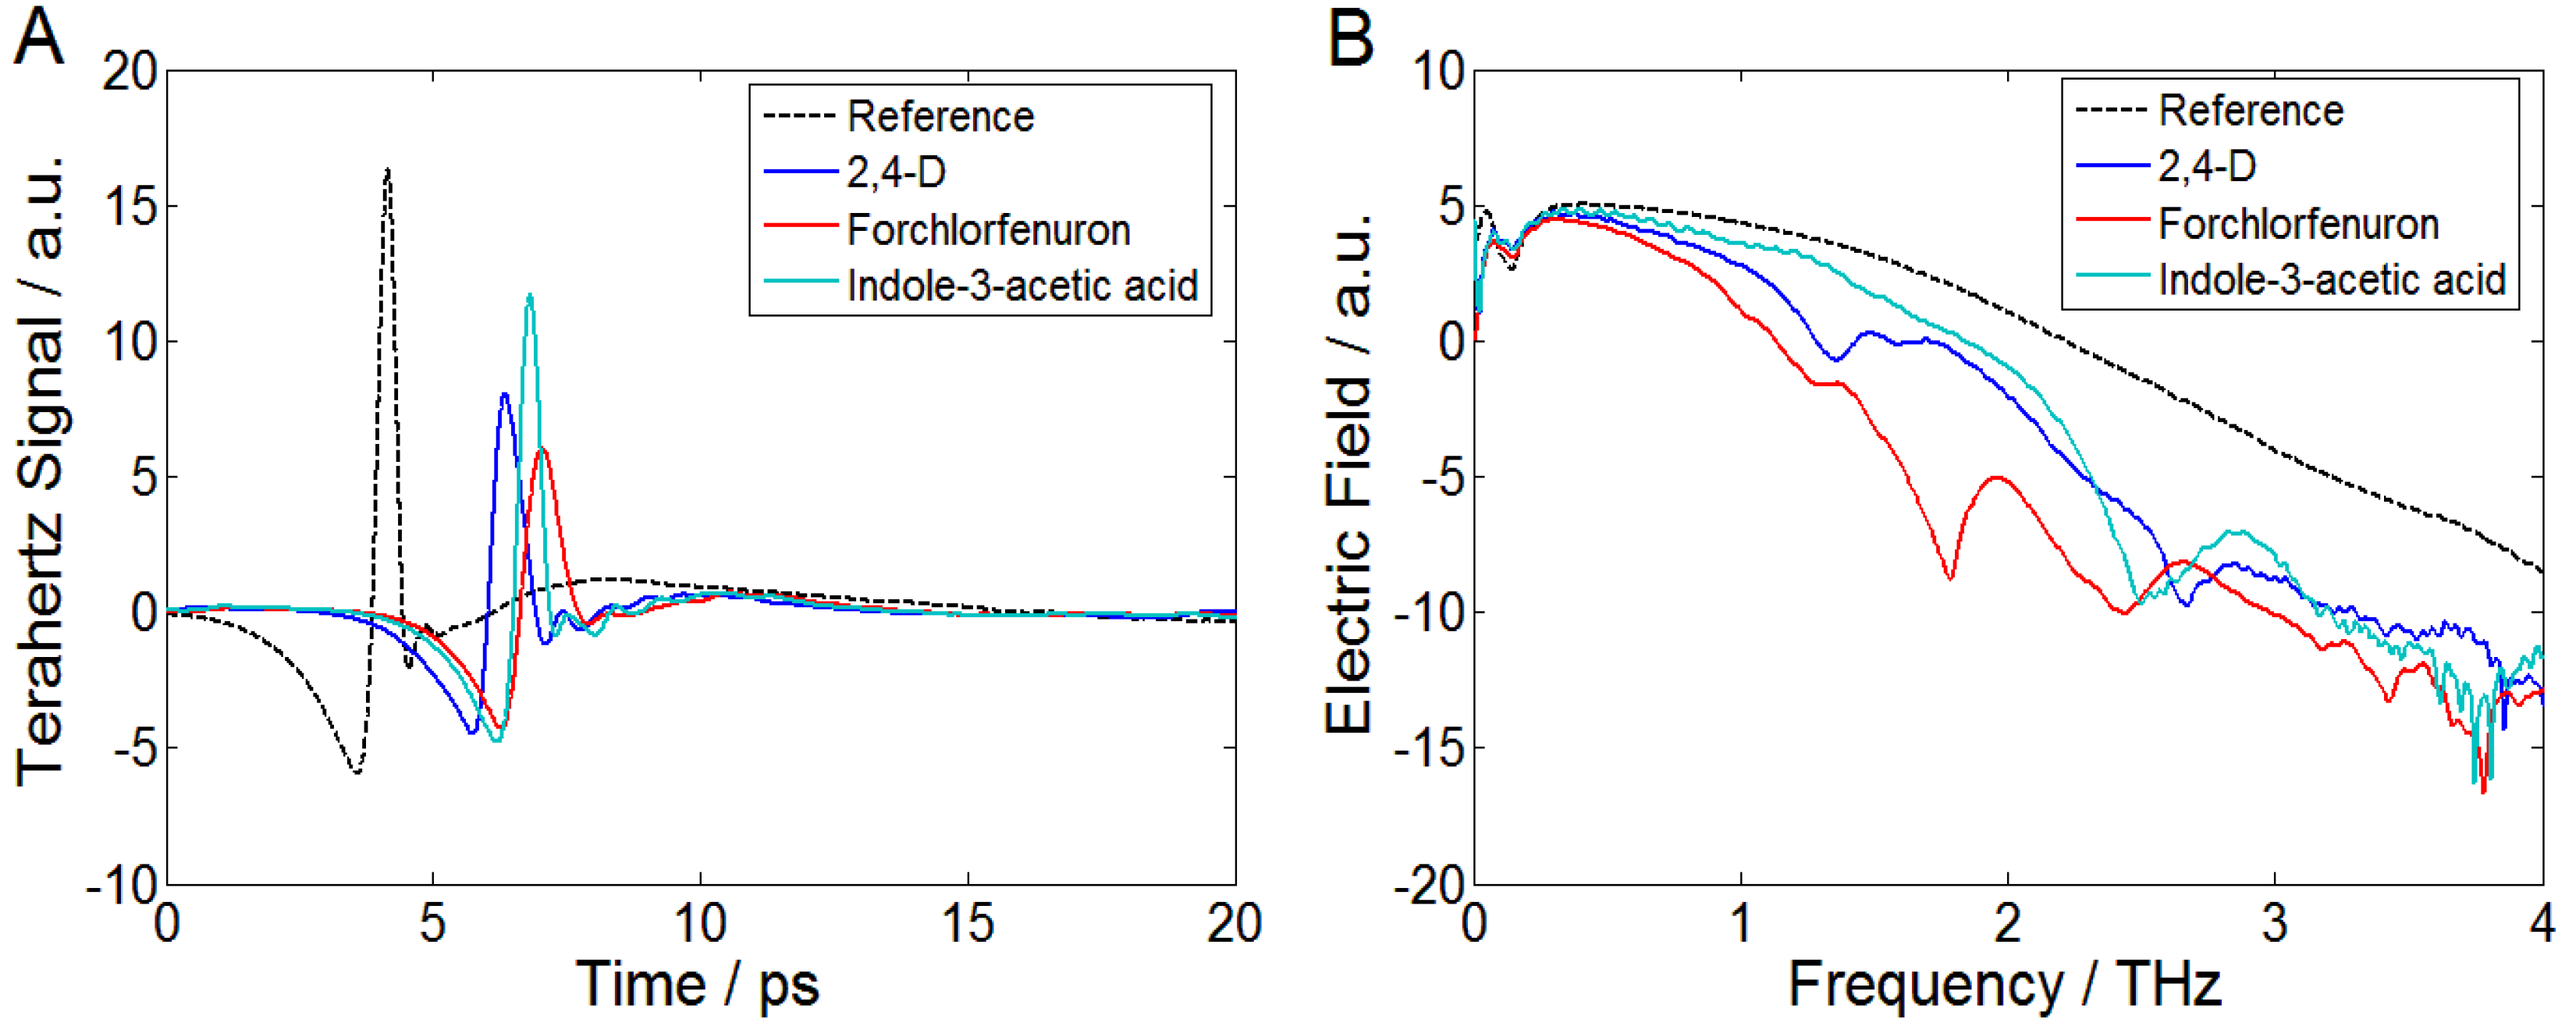
3.1. THz Time-Domain and Frequency-Domain Spectra of PGRs

The THz time-domain and frequency-domain spectra of the reference and the three PGRs are depicted in Figure 1. As can be seen from Figure 1A, the time-domain spectra contained both the amplitude information and the phase information. Compared with the corresponding reference spectrum of polyethylene, the time-domain spectra of the PGRs had amplitude decay and time delay. The amplitude attenuation was caused by the sample absorption of THz radiation. The time delay existed because of a higher refraction index in sample than in nitrogen. Furthermore, scattering was caused when the THz wave passed through the air pores between the PGR particles and the polyethylene particles inside the pellet [33]. Figure 1B shows the logarithmic spectra of the frequency-domain spectra (in dB scale). The reference signal of polyethylene had no significant absorption to THz. However, 2,4-D had three absorption peaks at 1.35, 1.57 and 2.67 THz, respectively. The characteristic absorption peaks of CPPU were located at 1.77 and 2.44 THz. IAA showed one absorption peak at 2.5 THz. As the polyethylene mixed in the PGR samples generally had no absorption of THz radiation, the absorption dips in Figure 1B could be designated as the fingerprints of the corresponding PGRs.

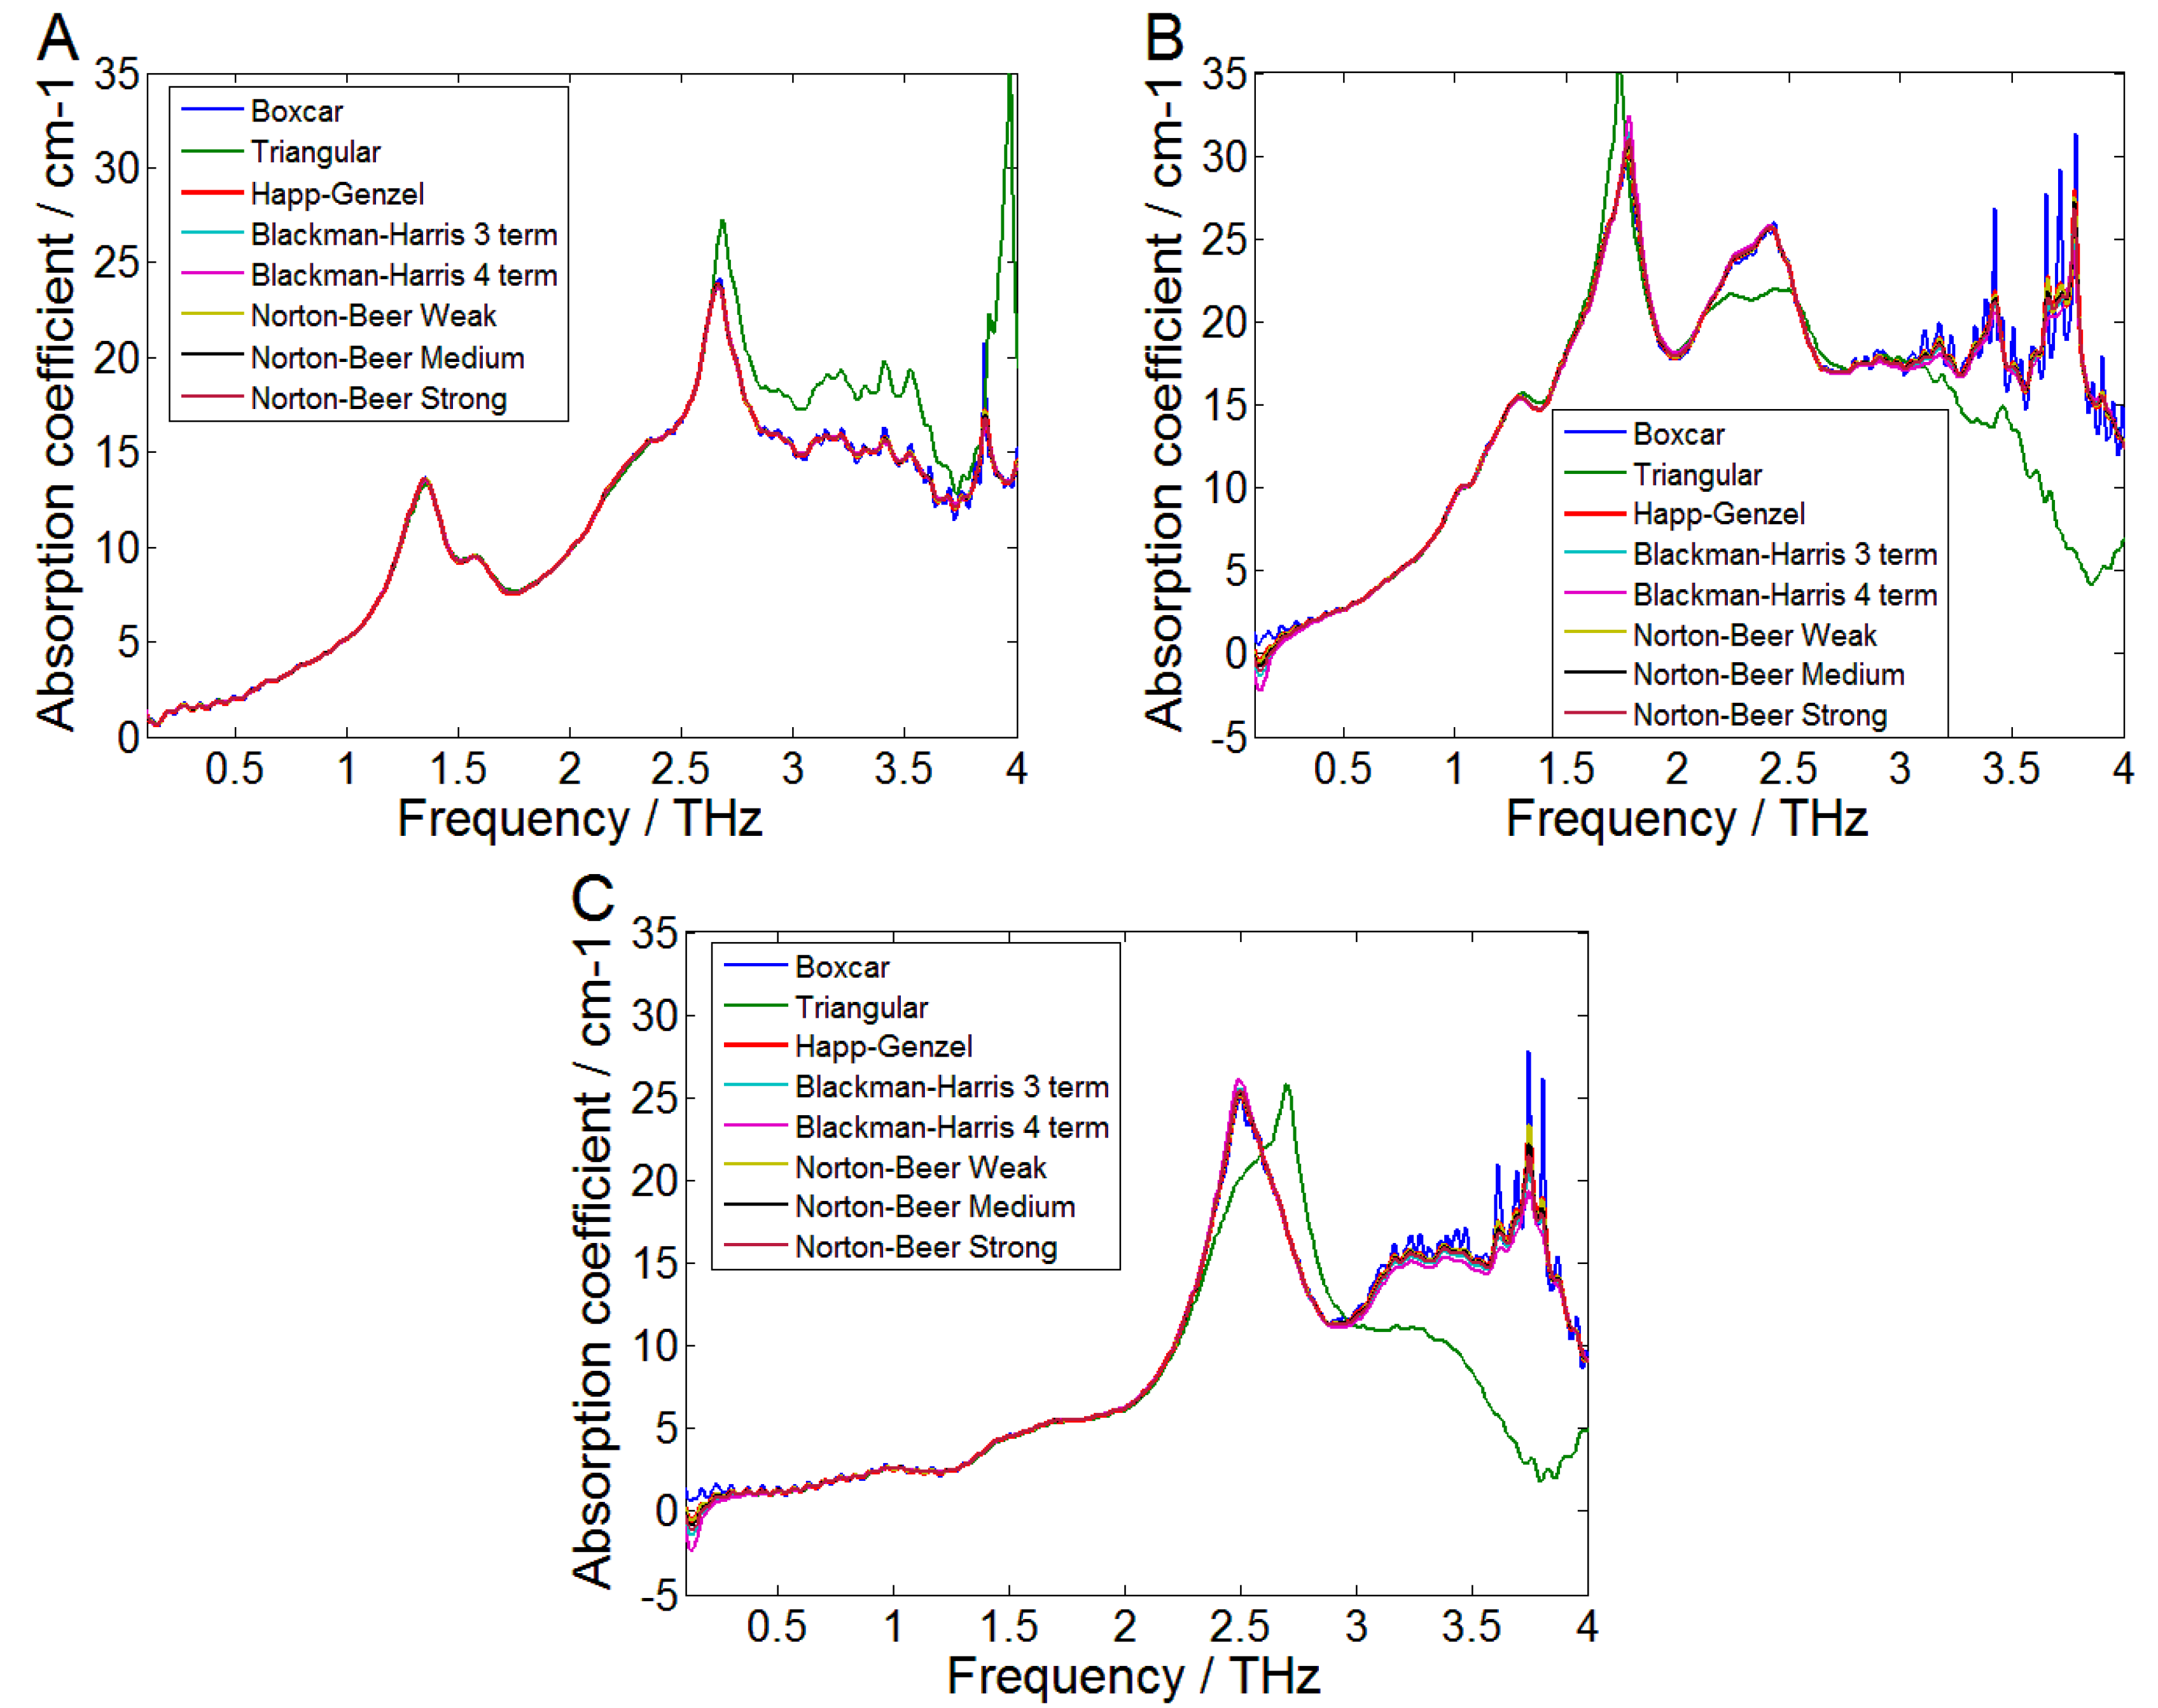
3.2. Spectral Processing by Window Functions

The THz spectra were processed using Boxcar, Triangular, Happ-Genzel, Blackman-Harris 3 terms, Blackman-Harris 4 terms, Norton-Beer Weak, Norton-Beer Medium and Norton-Beer Strong window functions. Figure 2 shows the processed THz absorption spectra of 2,4-D, CPPU and IAA, respectively. They were obtained based on the same time length of 33.5 ps (with resolution of 0.008 ps) in the time-domain. To evaluate the performance of the window functions, the effect of maintaining maximum information and eliminating side lobe should be considered comprehensively. The width of the main lobe spectrum in the window function should be as narrow as possible to obtain a steeper transition band. Meanwhile, the side lobe attenuation should be as large as possible to enhance the attenuation of the stopband. If the height of the side lobe tended to zero and the energy was relatively concentrated in the main lobe, the retrieved spectrum could be similar to the true spectrum. If the side lobe was significantly higher than the noise level of the spectral signal, a pseudospectral line would be formed. Different window functions had different effects on spectrum signals, which was mainly caused by the different amounts of leakage and capabilities of frequency resolution in different window functions. It can be seen from Figure 2 that the noise of the Boxcar was large in the high-frequency region. The spectra of the Triangular had shifts of peak position and peak value compared with other seven window functions. Happ-Genzel had a good balance between signal-to-noise ratio and resolution. Blackman-Harris had high computational accuracy, small side lobe peak and small spectral interference caused by truncation. Norton-Beer optimized the polynomial coefficients so that the first-order side lobes were suppressed to the maximum. The Blackman-Harris 4 term obtained the highest peak values compared with the other window functions (except for Triangular). Therefore, it was selected to process the THz spectrum when conducting FFT. Furthermore, as shown in Figure 2, the spectra in the lower frequencies (0.06–0.2 THz) were affected by the multiple reflections of the samples. At higher frequencies of 3–4 THz, high-frequency oscillation occurred in the spectra due to the interference of random noise. In these frequency bands, the signal-to-noise ratio was low. Hence, the frequency range of 0.2–3 THz was extracted as an effective band for the subsequent analysis work.

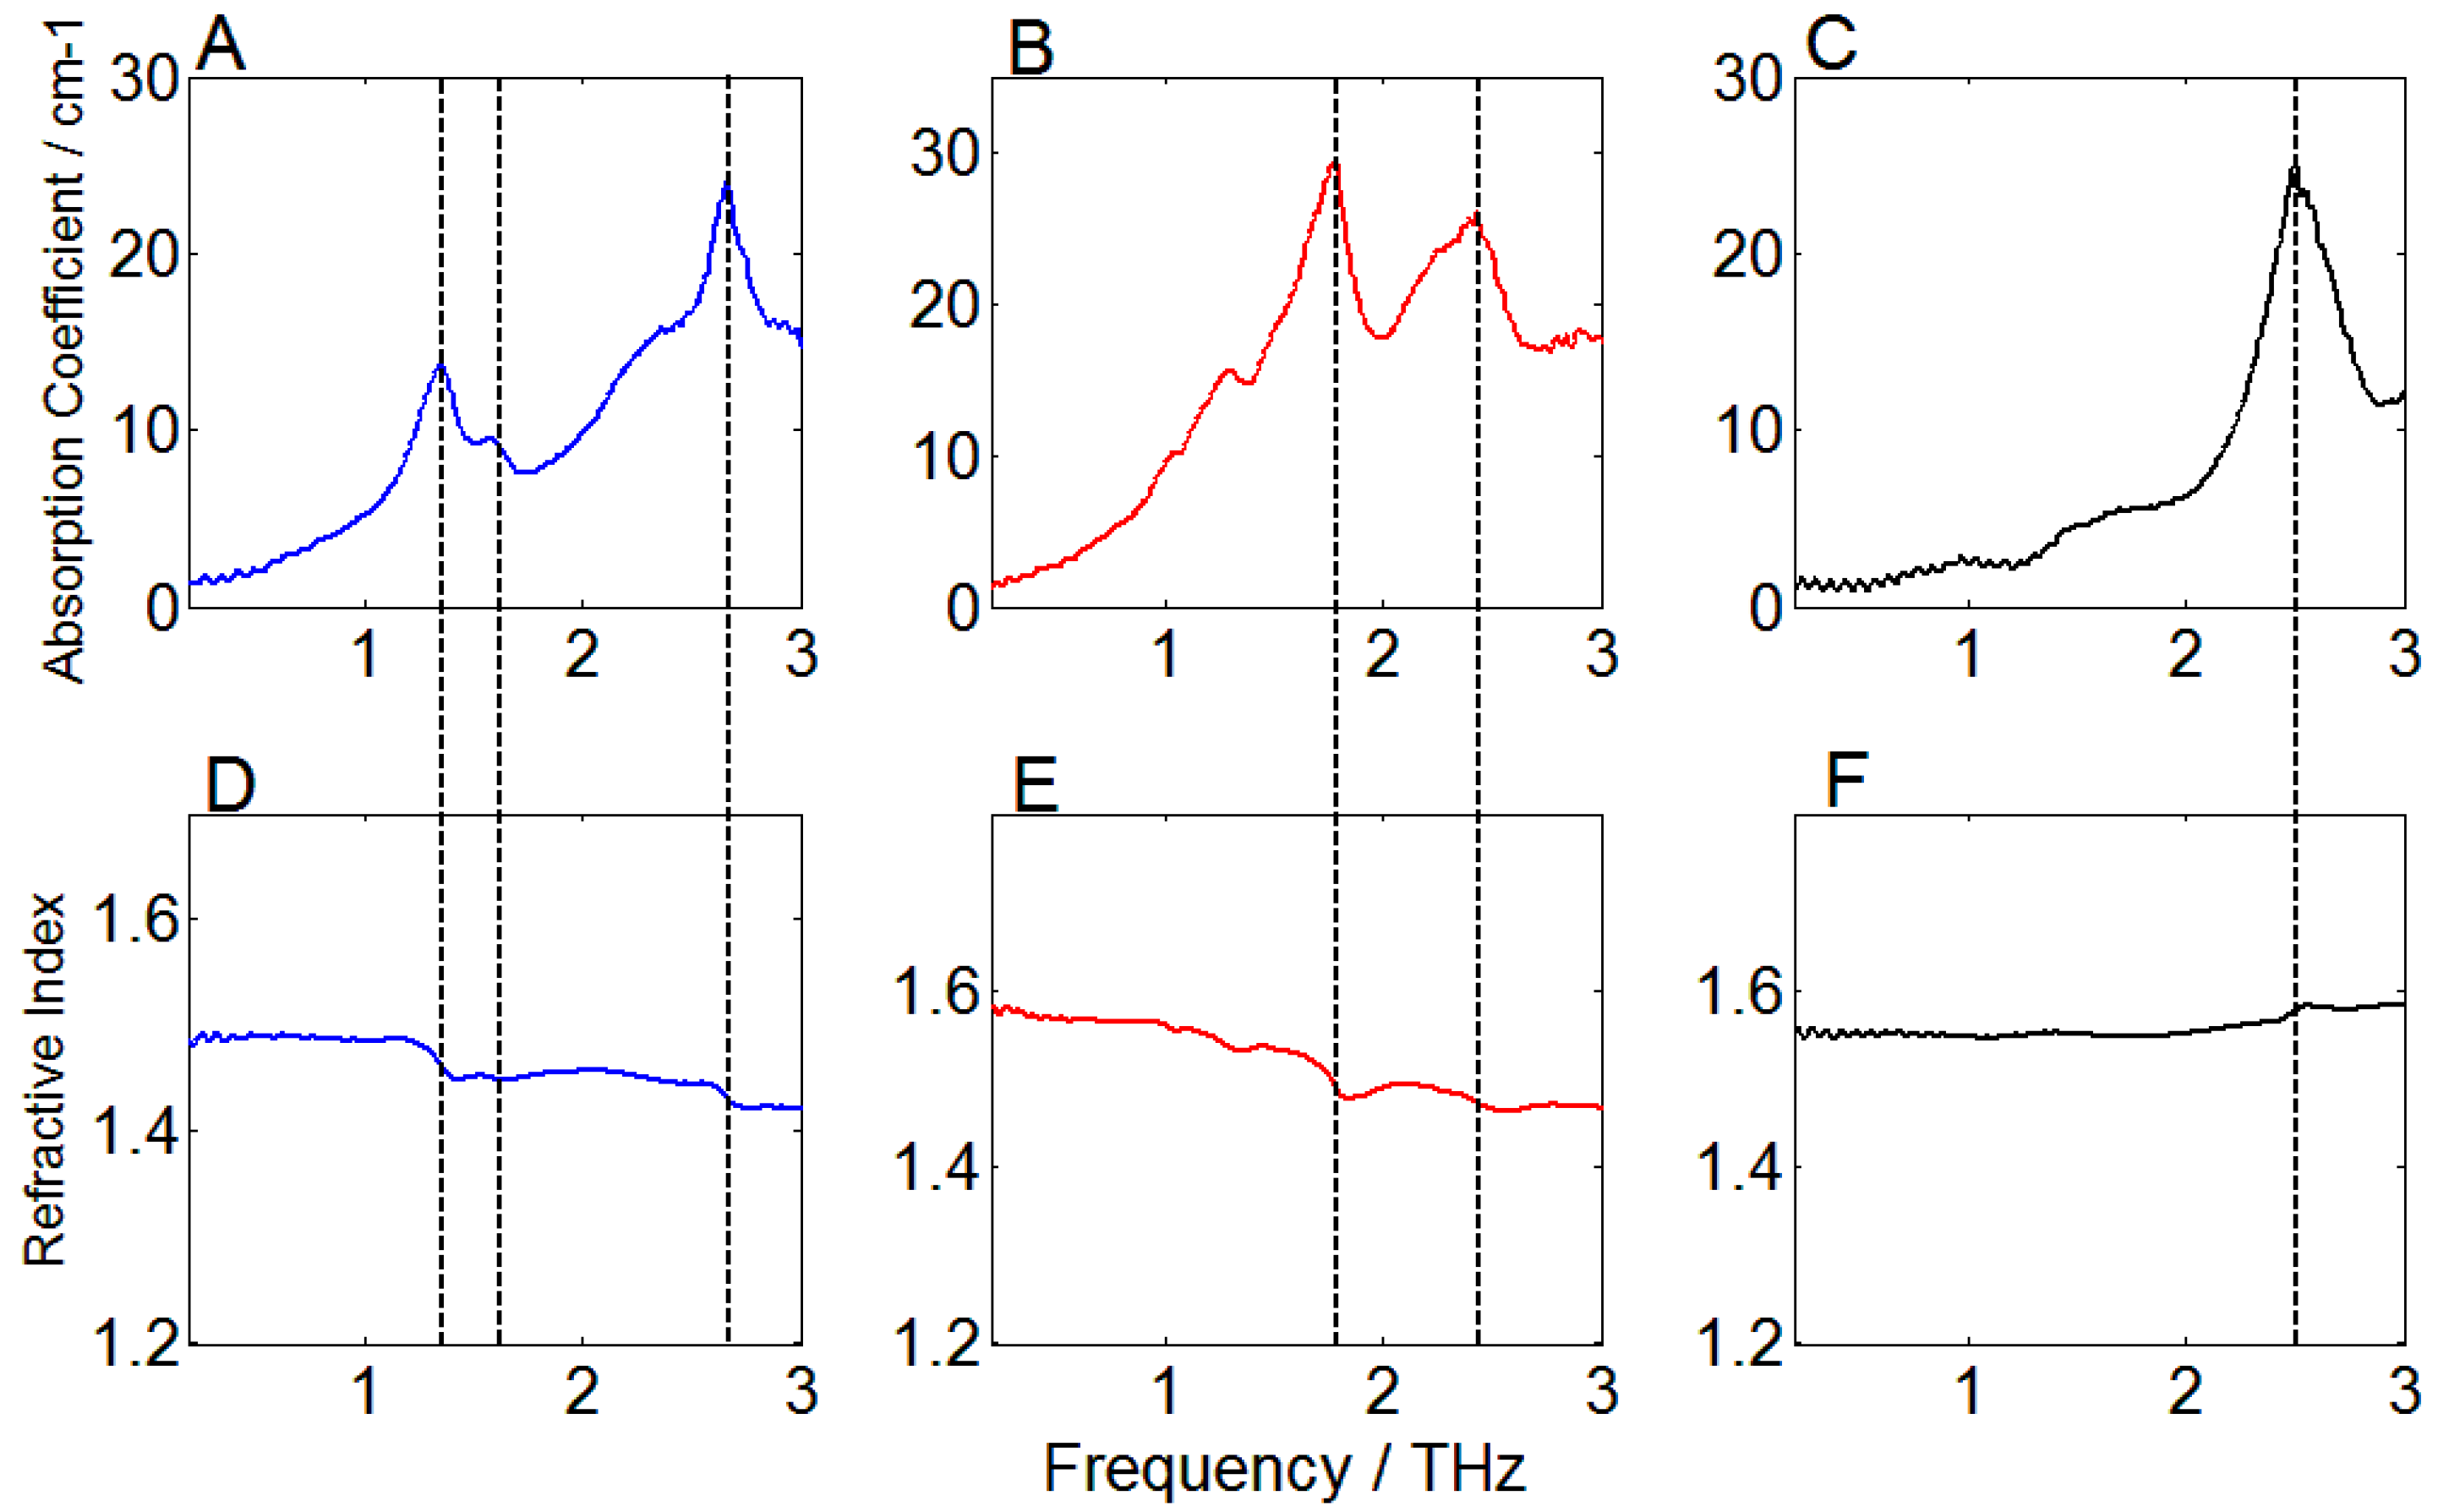
3.3. Absorption Coefficient and Refractive Index of PGRs

According to Equations (2) and (3), the absorption coefficient and refractive index were directly related to the thickness of the sample. Therefore, sample thickness was a key factor affecting the amplitude of the THz spectrum. In this experiment, the measurements of thickness were repeated three times to reduce the influences of measurement error and surface scattering. The average thicknesses of 2,4-D, CPPU and IAA samples were 1.38 mm, 1.53 mm and 1.46 mm, respectively. The window function of the Blackman-Harris 4 term was applied to process the THz spectra. The absorption coefficient and refractive index of the three PGRs in the ranges of 0.2–3 THz are shown in Figure 3. The experimental results indicated that the average refractive index of 2,4-D in 0.2–3 THz was 1.46, and the characteristic absorption peaks were at 1.35, 1.57 and 2.67 THz. The average refractive index of CPPU was 1.52 and there were two absorption peaks at 1.77 and 2.44 THz, respectively. The average refractive index of IAA was 1.56 and there was one characteristic absorption peak at 2.5 THz. For these three PGRs, there was a spectral variation of the refractive index at the location of each characteristic absorption peak. This phenomenon indicated that there was an abnormal dispersion near the absorption peak. As the frequency increased, the baseline of the absorption spectrum raised, which was caused by the scattering of THz radiation. Generally, high absorption corresponded to low refraction. For the high absorption peak of IAA at 2.5 THz, the inverse tendency was shown in the refractive index (Figure 3F). This might be caused by the spectral baseline drift due to noise, such as random error of the instrument and the ambient noise of the environment. Since the absorption characteristics of THz radiation were obviously different, these absorption peaks could be used as fingerprints to identify the chemical components of the PGR samples.

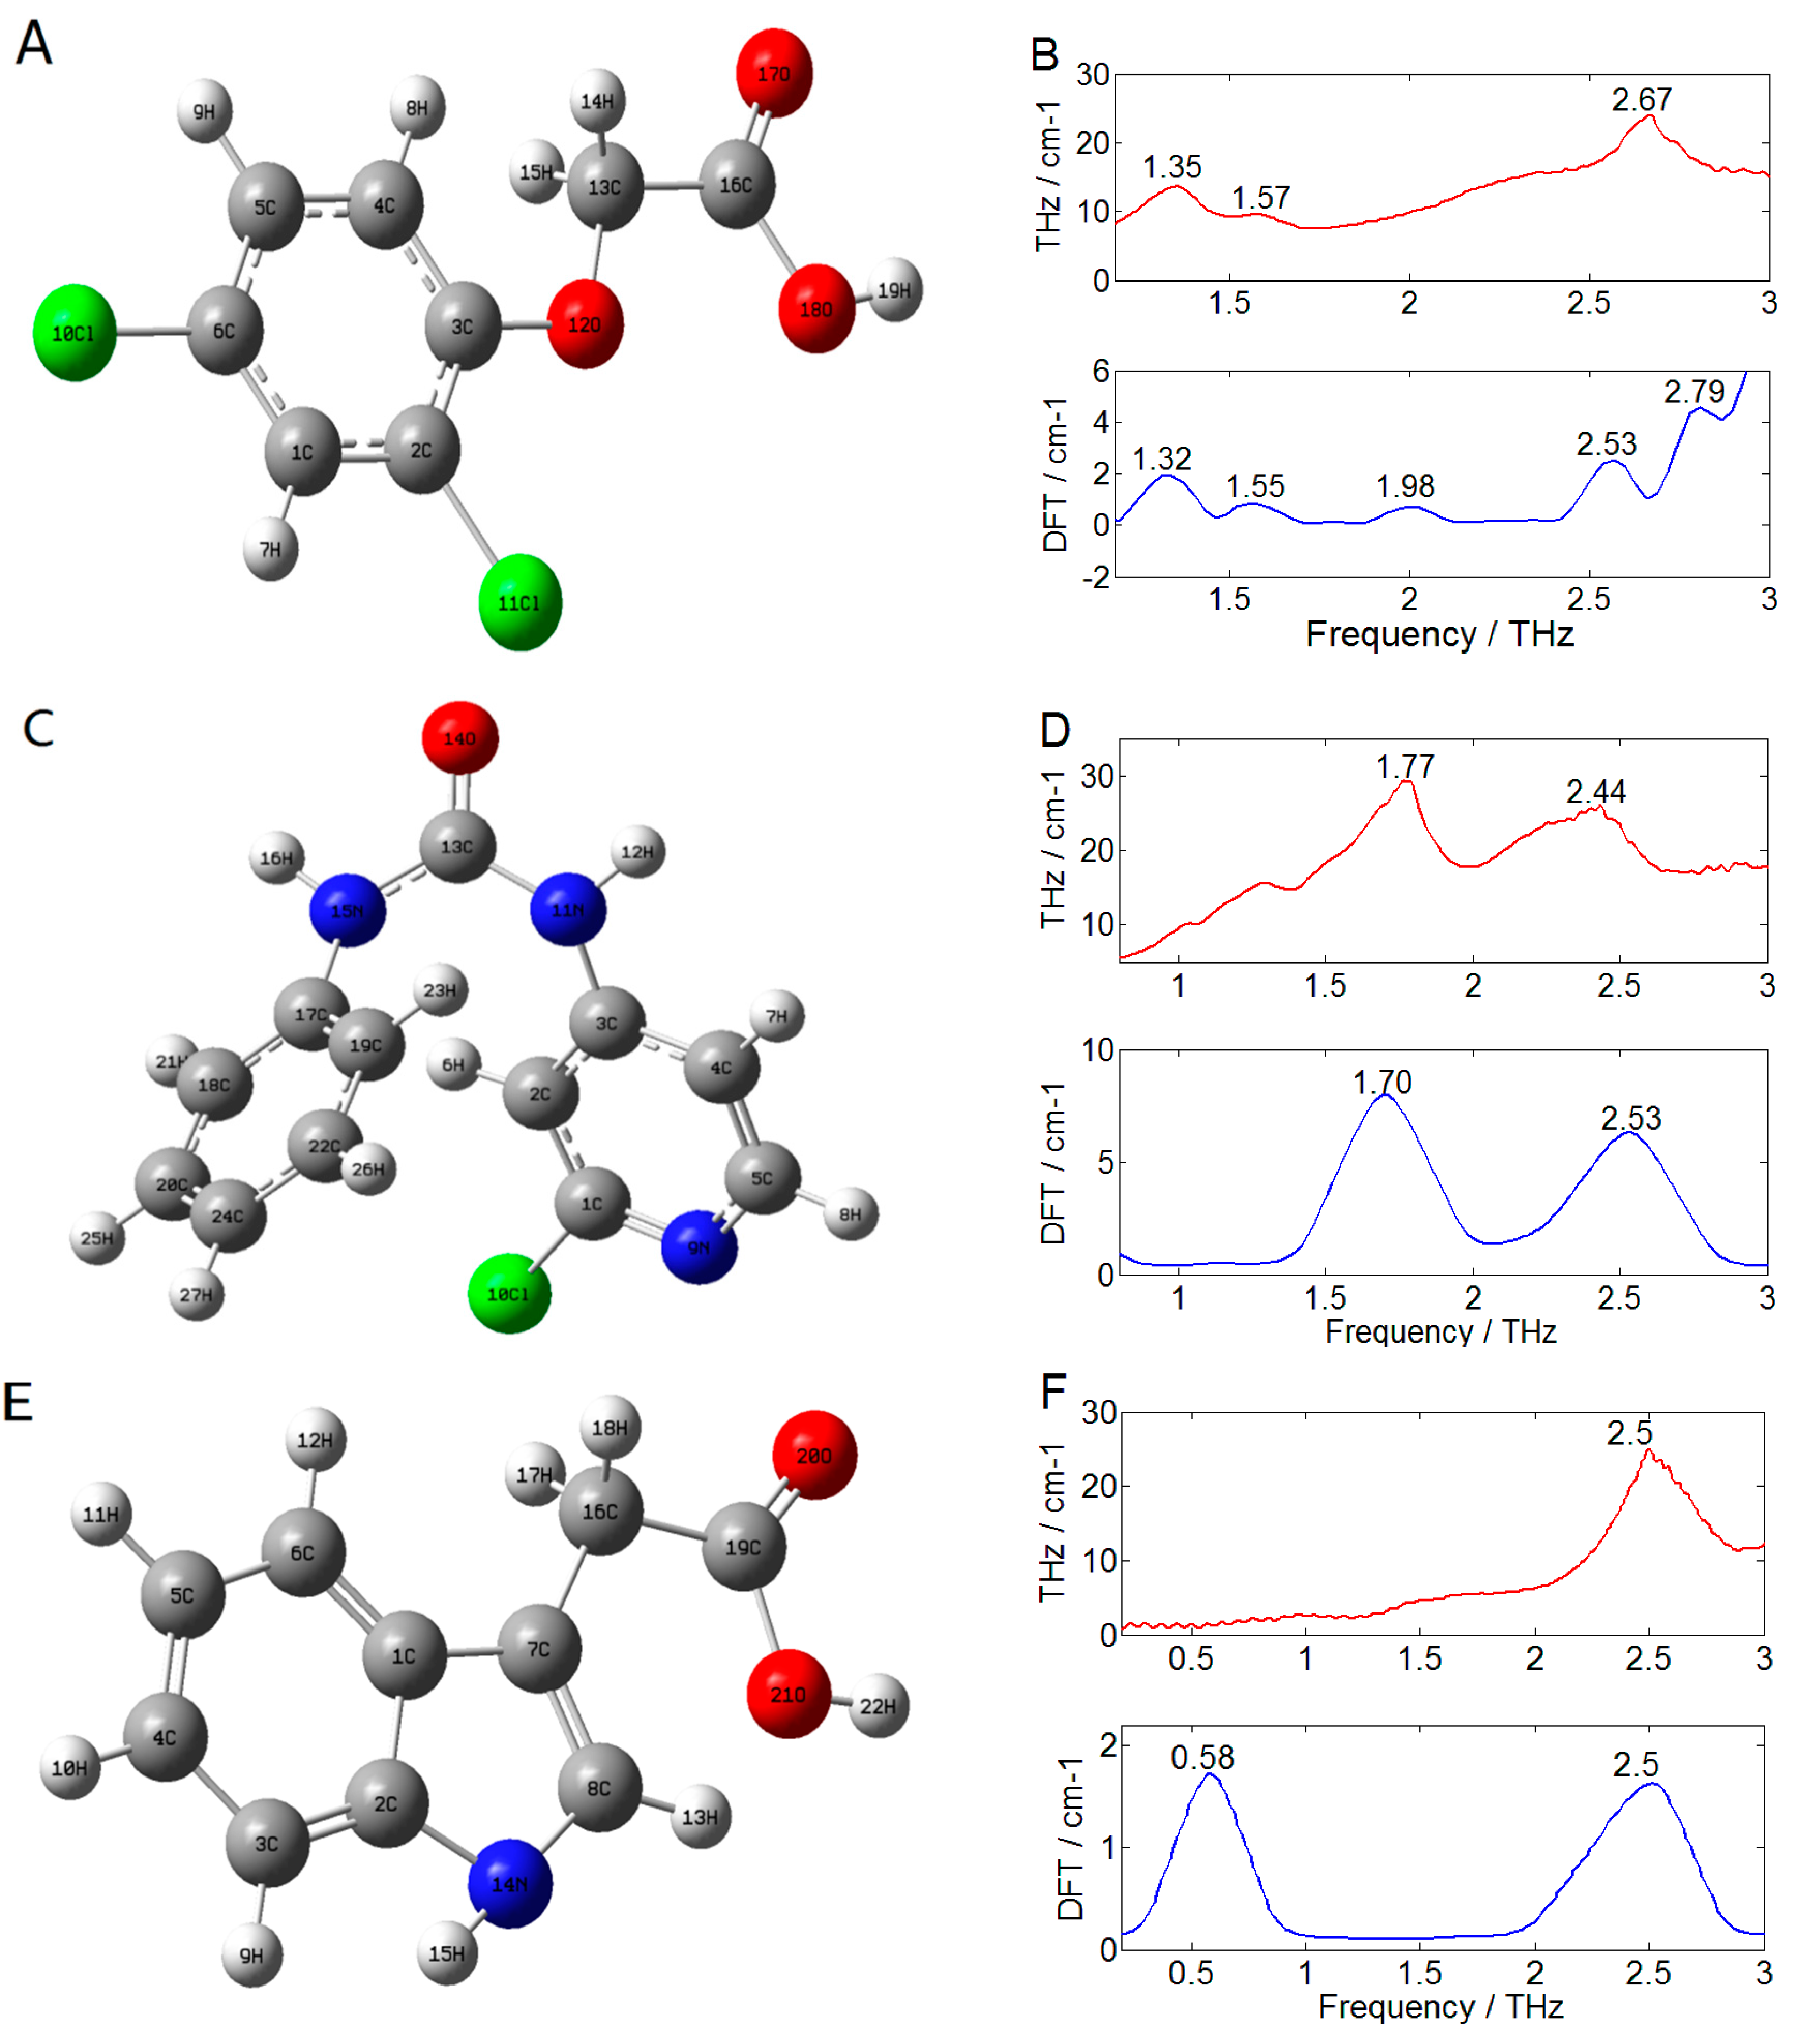
3.4. Theoretical Calculation of THz Spectra by DFT

In order to identify the formation mechanism of the characteristic absorption peaks, the Gaussian 2009 software was used to conduct the quantum chemistry calculation of the three PGRs. DFT was applied for the geometric optimization and frequency calculation of single molecular of PGRs. On the basis of the traditional Hartree Fock theory, the method of calculating various electronic energy information in the molecule was added in DFT. Therefore, the results of DFT were more accurate and the calculation speed was faster. The density functional model of B3LYP Becke with three parameters (B3LYP/6-311G, Lee-Yang-Parr functional) in DFT was used to calculate the molecules of 2,4-D and IAA. Additionally, the model of B3LYP/6-31G (d, p) was used to calculate the molecule of CPPU. These models could be used to calculate the geometric configuration and zero-point energies. They had obvious advantages in geometric optimization of the molecular structure and no imaginary frequency appeared in the optimization result. Therefore, the stable molecular conformation could be obtained.
Figure 4 showed the simulated molecules and the calculated spectra of the three PGRs by DFT. Among them, the simulated results of 2,4-D obtained five absorption peaks, which were located at 1.32, 1.55, 1.98, 2.53 and 2.79 THz, respectively. Two absorption peaks were obtained from the simulated results of CPPU, which were located at 1.70 and 2.53 THz. The two calculated absorption peaks of IAA were located at 0.58 and 2.5 THz, respectively. It could be seen that there were discrepancies of absorption peak position and intensity between the experimental and theoretical results. The reason was that the experimental samples were crystals, while the objects of theoretical calculation were molecules. Moreover, the sample thickness, the crystal field effect, the crystal resonance and the interaction between molecules were not taken into account in the theoretical calculation. Additionally, the theoretical spectra had irregular deviations compared with the experimental spectra. The reason was that the experiment was carried out at laboratory temperature (294 K), but the theoretical calculation was based on a temperature of 0 K, and thus ignored this kind of thermal effect. In addition, the number of absorption peaks obtained by theoretical spectra was larger than that obtained by experimental spectra. The main reason was probably that some of the absorption peaks were not detected due to the limitation of the THz experimental instruments.
The characteristic absorption peaks could be assigned and analyzed using the visualization function of GaussView 5.08. The results showed that these absorption peaks were mainly generated by the collective vibration and twisting of molecules. Table 2 lists the vibration modes of the theoretically calculated absorption peaks. The molecular structures were represented by Descartes coordinates. The absorption peak of 2,4-D at 1.32 THz was attributed to the stretching vibration and external deformation vibration of C-C (13 C, 16 C) in the X-Z plane with Z axis. The absorption peak of 2,4-D at 1.55 THz was ascribed to the interior stretching vibration and external deformation vibration of C-O-C (3 C, 12 O, 13 C) in X-Z plane with Z axis. The absorption peak of 2,4-D at 2.53 THz was attributed to the interaction between the surface stretching vibration of C-O-C (3 C, 12 O, 13C) and the interior surface stretching vibration of C-CL (2 C, 11 CL, 10 CL). The absorption peak of CPPU at 1.70 THz was attributed to the interaction between the external deformation vibration of N-C-N (11 N, 13 C, 15 N) and the interior stretching vibration of C=O (13 C, 14 O) in Y-Z plane with X axis. The absorption peak of CPPU at 2.53 THz was attributed to the external deformation vibration of C-N (3 C, 11 N) in Y-Z plane. The absorption peak of IAA at 2.5 THz was attributed to the interior stretching vibration of C-C-C (7 C, 9 C, 17 C) in the X-Z plane.

4. Conclusions

In this paper, THz spectral characteristics of 2,4-D, CPPU and IAA were studied by using THz-TDS. Eight window functions were applied to process the THz absorption spectra of these three PGRs. Among them, the function of the Blackman-Harris 4 term achieved the best spectral effect. Combined with THz optical parameters extraction models using Fresnel formula, the THz absorption coefficient spectra and refractive index spectra of PGRs in the band of 0.2–3 THz were obtained. The experimental results showed that the three kinds of PGRs had different characteristic absorption peaks in the THz band (2,4-D: 1.35, 1.57 and 2.67 THz, CPPU: 1.77 and 2.44 THz, IAA: 2.5 THz), and the refractive index changed at the location of each characteristic absorption peak. The density functional models of B3LYP/6-311G and B3LYP/6-31G (d, p) in DFT were used for geometric optimization and frequency calculation of single molecules of PGRs. The calculated spectra were in reasonable agreement with the experimental spectra. According to the calculation results of DFT, the vibrational frequencies of the experimental spectra were determined. The vibrational modes corresponding to the absorption peaks of THz spectra were mainly characterized by interior stretching vibration and external deformation vibration of molecular groups. Moreover, the vibration modes and amplitudes varied at different peaks. The results of this study provided the parameters for the detection of PGRs using THz technology. In addition, it provided theoretical guidance and experimental basis for the rapid identifying of PGRs species and the detection of PGRs residues in agricultural products.

Acknowledgments

This work was supported in part by National keypoint research and invention program of the thirteenth (2016YFD0700304) and Natural Science Foundations of China (Grant No. 61405175).

Author Contributions

The work presented here was carried out in collaboration between all authors. Pengcheng Nie and Fangfang Qu conceived the idea. Fangfang Qu, Lei Lin, Tao Dong and Chengyong Cai co-worked on associated data collection and carried out the experimental work. Fangfang Qu drafted the manuscript, Pengcheng Nie and Yong He provided their experience and co-wrote the paper. All authors contributed to, reviewed and improved the manuscript.

Conflicts of Interest

The authors declare no conflict of interest.

References

  1. Rademacher, W. Plant Growth Regulators: Backgrounds and Uses in Plant Production. J. Plant Growth Regul. 2015, 34, 845–872. [Google Scholar] [CrossRef]
  2. Kaur, R.; Singh, K.; Deol, J.S.; Dass, A.; Choudhary, A.K. Possibilities of Improving Performance of Direct Seeded Rice Using Plant Growth Regulators: A Review. Proc. Natl. Acad. Sci. India 2015, 85, 909–922. [Google Scholar] [CrossRef]
  3. Oruç, E.O.; Uner, N. Combined effects of 2,4-D and azinphosmethyl on antioxidant enzymes and lipid peroxidation in liver of Oreochromis niloticus. Comp. Biochem. Physiol. Part C 2000, 127, 291–296. [Google Scholar] [CrossRef]
  4. Stachler, J.M.; Kells, J.J.; Penner, D. Resistance of wild carrot (Daucus carota) to 2,4-D in Michigan. Weed Technol. 2000, 14, 734–739. [Google Scholar] [CrossRef]
  5. Kruger, G.R.; Davis, V.M.; Weller, S.C.; Johnson, W.G. Growth and Seed Production of Horseweed (Conyza canadensis) Populations after Exposure to Postemergence 2,4-D. Weed Sci. 2010, 58, 413–419. [Google Scholar] [CrossRef]
  6. Valverde, A.; Piedra, L.; Aguilera, A.; Boulaid, M.; Camacho, F. Analysis and residue levels of forchlorfenuron (CPPU) in watermelons. J. Environ. Sci. Health. Part B 2007, 42, 801–807. [Google Scholar] [CrossRef] [PubMed]
  7. Peppi, M.C.; Fidelibus, M.W. Effects of Forchlorfenuron and Abscisic Acid on the Quality of ‘Flame Seedless’ Grapes. HortScience 2008, 43, 173–176. [Google Scholar]
  8. Idris, E.S.E.; Iglesias, D.J.; Talon, M.; Borriss, R. Tryptophan-Dependent Production of Indole-3-Acetic Acid (IAA) Affects Level of Plant Growth Promotion by Bacillus amyloliquefaciens FZB42. Mol. Plant-Microbe Interact. 2007, 20, 619–626. [Google Scholar] [CrossRef] [PubMed]
  9. Staswick, P.E.; Serban, B.; Rowe, M.; Tiryaki, I.; Maldonado, M.T.; Maldonado, M.C.; Suza, W. Characterization of an Arabidopsis enzyme family that conjugates amino acids to indole-3-acetic acid. Plant Cell 2005, 17, 616–627. [Google Scholar] [CrossRef] [PubMed]
  10. Spaepen, S.; Vanderleyden, J.; Remans, R. Indole-3-acetic acid in microbial and microorganism-plant signaling. FEMS Microbiol. Rev. 2007, 31, 425–448. [Google Scholar] [CrossRef] [PubMed]
  11. Koca, N.; Karaman, Ş. The effects of plant growth regulators and L-phenylalanine on phenolic compounds of sweet basil. Food Chem. 2015, 166, 515–521. [Google Scholar] [CrossRef] [PubMed]
  12. Satish, L.; Rency, A.S.; Rathinapriya, P.; Ceasar, S.A.; Pandian, S.; Rameshkumar, R.; Rao, T.B.; Balachandran, S.M.; Ramesh, M. Influence of plant growth regulators and spermidine on somatic embryogenesis and plant regeneration in four Indian genotypes of finger millet (Eleusine coracana (L.) Gaertn). Plant Cell Tissue Organ Cult. 2016, 124, 15–31. [Google Scholar] [CrossRef]
  13. Kelley, K.B.; Zhang, Q.; Lambert, K.N.; Riechers, D.E. Evaluation of auxin-responsive genes in soybean for detection of off-target plant growth regulator herbicides. Weed Sci. 2006, 54, 220–229. [Google Scholar] [CrossRef]
  14. Liu, S.J.; Fang, C.G.; Cui, Y.; Jiang, N. Advances in detection technologies of plant growth regulator residue in plant foods. J. Food Saf. Qual. 2016, 7, 8–13. [Google Scholar]
  15. Erban, T.; Trojakova, L.; Kamler, M.; Titera, D. Detection of the desiccant and plant growth regulator chlormequat in honeybees and comb pollen. Vet. Med. 2017, 62, 596–603. [Google Scholar] [CrossRef]
  16. Cui, G.; Rina, S.U.; Song, G.; Ren, X.; Hou, X. Research and Progress of the Pretreatment Choices for Detection of Plant Growth Regulator. Forensic Sci. Technol. 2017, 42, 231–235. [Google Scholar]
  17. Siegel, P.H. Terahertz technology in biology and medicine. IEEE Trans. Microwave Theory Tech. 2004, 52, 2438–2447. [Google Scholar] [CrossRef]
  18. Fischer, B.; Hoffmann, M.; Helm, H.; Modjesch, G.; Jepsen, P.U. Chemical recognition in terahertz time-domain spectroscopy and imaging. Semicond. Sci. Technol. 2005, 20, S246. [Google Scholar] [CrossRef]
  19. Nie, P.; Qu, F.; Lin, L.; Dong, T.; He, Y.; Shao, Y.; Zhang, Y. Detection of Water Content in Rapeseed Leaves Using Terahertz Spectroscopy. Sensors 2017, 17, 2830. [Google Scholar] [CrossRef] [PubMed]
  20. Walther, M.; Plochocka, P.; Fischer, B.; Helm, H.; Uhd, J.P. Collective vibrational modes in biological molecules investigated by terahertz time-domain spectroscopy. Biopolymers 2002, 67, 310–313. [Google Scholar] [CrossRef] [PubMed]
  21. Cen, H.; Weng, H.; Yao, J.; He, M.; Lv, J.; Hua, S.; Li, H.; He, Y. Chlorophyll Fluorescence Imaging Uncovers Photosynthetic Fingerprint of Citrus Huanglongbing. Front. Plant Sci. 2017, 8, 1509. [Google Scholar] [CrossRef] [PubMed]
  22. Siegel, P.H. Terahertz technology. IEEE Trans. Microwave Theory Tech. 2002, 50, 910–928. [Google Scholar] [CrossRef]
  23. Naftaly, M.; Miles, R.E. Terahertz Time-Domain Spectroscopy for Material Characterization. Proc. IEEE 2007, 95, 1658–1665. [Google Scholar] [CrossRef]
  24. Duvillaret, L.; Garet, F.; Coutaz, J.L. A reliable method for extraction of material parameters in terahertz time-domain spectroscopy. IEEE J. Sel. Top. Quantum Electron. 2002, 2, 739–746. [Google Scholar] [CrossRef]
  25. Yan, Z.G.; Hou, D.B.; Cao, B.H.; Zhang, G.X.; Zhou, Z.K. Terahertz spectroscopic investigation of organophosphorous pesticide acephate. J. Zhejiang Univ. 2008, 12, 2207–2211. [Google Scholar]
  26. Baek, S.H.; Lim, H.B.; Chun, H.S. Detection of melamine in foods using terahertz time-domain spectroscopy. J. Agric. Food Chem. 2014, 62, 5403–5407. [Google Scholar] [CrossRef] [PubMed]
  27. Zhang, F.; Wang, H.W.; Tominaga, K.; Hayashi, M.; Hasunuma, T.; Kondo, A. Application of THz Vibrational Spectroscopy to Molecular Characterization and the Theoretical Fundamentals: An Illustration Using Saccharide Molecules. Chem. Asian J. 2017, 12, 324–331. [Google Scholar] [CrossRef] [PubMed]
  28. Cheon, H.; Yang, H.; Lee, S.H.; Kim, Y.A.; Son, J.H. Terahertz molecular resonance of cancer DNA. Sci. Rep. 2016, 6, 37103. [Google Scholar] [CrossRef] [PubMed]
  29. Kim, Y.; Hibino, K.; Sugita, N.; Mitsuishi, M. Simultaneous measurement of surface shape and optical thickness using wavelength tuning and a polynomial window function. Opt. Express 2015, 23, 32869–32880. [Google Scholar] [CrossRef] [PubMed]
  30. Bailoni, A.; Mancini, A.S.; Amendola, L. Improving the galaxy clustering Fisher matrix: window function, bin cross-correlation, and bin redshift uncertainty. arXiv, 2016; arXiv:1608.00458. [Google Scholar]
  31. Traficante, D.D.; Rajabzadeh, M. Optimum window function for sensitivity enhancement of NMR signals. Concepts Magn. Reson. Part A 2015, 12, 83–101. [Google Scholar] [CrossRef]
  32. Agarwal, P.; Singh, S.P.; Pandey, V.K. Mathematical analysis of blackman window function in fractional Fourier transform domain. In Proceedings of the 2014 International Conference on Medical Imaging, m-Health and Emerging Communication Systems (MedCom), Greater Noida, India, 7–8 November 2015. [Google Scholar] [CrossRef]
  33. Liang, L.; Tong, M.M.; Wei, M.S.; Meng, L.I.; Dong, H.B. Research on Scattering in the THz Quantitative Analysis of Granulated Coal. Spectrosc. Spectr. Anal. 2017, 8, 2365–2370. [Google Scholar]
Figure 1. THz spectra of the reference and PGRs. (A) Time-domain spectra; (B) Frequency-domain spectra.
Applsci 08 00420 g001
Figure 2. THz spectral processing of PGRs by window functions. (A) 2,4-D; (B) CPPU; (C) IAA.
Applsci 08 00420 g002
Figure 3. Absorption coefficients and refractive indexes of PGRs. (A) Absorption coefficient of 2,4-D; (B) absorption coefficient of CPPU; (C) absorption coefficient of IAA; (D) refractive index of 2,4-D; (E) refractive index of CPPU; (F) refractive index of IAA.
Applsci 08 00420 g003
Figure 4. Calculated molecule and absorption spectra of three PGRs. (A) 2,4-D molecule; (B) 2,4-D spectra; (C) CPPU molecule; (D) CPPU spectra; (E) IAA molecule; (F) IAA spectra.
Applsci 08 00420 g004
Table 1. Chemical and physicochemical properties of the PGRs.
NO.Plant Growth RegulatorsMolecular FormulaMolecular MassMelting PointWater Solubility
12,4-Dichlorophenoxyacetic acidC8H6CL2O3221.04137–141 °C0.890 g/L
2ForchlorfenuronC12H10ClN3O247.68170–172 °C0.039 g/L
5Indole-3-acetic acidC10H9NO2175.18165–169 °C1.500 g/L
Table 2. The assignment of the calculated absorption peaks.
Calculation (THz)Experiment (THz)Deviation (THz)Assignment
2,4-Dichlorophenoxyacetic acid (2,4-D)
1.32 (vs)1.35+0.03υ(C-C)ip
1.55 (vw)1.57+0.02δ(C-H)oop
1.98 (vw)--υring+δ(C-C-C)ip
2.53 (w)2.67+0.14δ(C-O-C)ip+υ(C-CL)ip
2.79 (w)--υring+υ(C-C)ip
Forchlorfenuron (CPPU)
1.70 (m)1.77+0.07υ(C=O)ip+δ(N-C-N)oop
2.53 (m)2.44−0.09δ(C-N)oop
Indole-3-acetic acid (IAA)
0.58 (w)--δ(C-O)oop
2.5 (w)2.5±0υ(C-C-C)ip
vs: very strong, m: medium, w: weak, vw: very weak, υ: telescopic vibration, oop: surface external bending, ip: surface internal bending, δ: deformation vibration.

