Application of Workflow Technology for Big Data Analysis Service


1
China Mobile Information Security Center, 32 Xuanwumen West Street, Xicheng District, Beijing 100033, China
2
Beijing University of Post and Telecommunications, 10 Xitu Cheng Road, Haidian District, Beijing 100876, China
*
Author to whom correspondence should be addressed.
Appl. Sci. 2018, 8(4), 591; https://doi.org/10.3390/app8040591
Submission received: 28 January 2018
/
Revised: 14 March 2018
/
Accepted: 3 April 2018
/
Published: 9 April 2018
(This article belongs to the Special Issue Advanced Internet of Things for Smart Infrastructure System)
Abstract
:This study presents a lightweight representational state transfer-based cloud workflow system to construct a big data intelligent software-as-a-service (SaaS) platform. The system supports the dynamic construction and operation of an intelligent data analysis application, and realizes rapid development and flexible deployment of the business analysis process that can improve the interaction and response time of the process. The proposed system integrates offline-batch and online-streaming analysis models that allow users to conduct batch and streaming computing simultaneously. Users can rend cloud capabilities and customize a set of big data analysis applications in the form of workflow processes. This study elucidates the architecture and application modeling, customization, dynamic construction, and scheduling of a cloud workflow system. A chain workflow foundation mechanism is proposed to combine several analysis components into a chain component that can promote efficiency. Four practical application cases are provided to verify the analysis capability of the system. Experimental results show that the proposed system can support multiple users in accessing the system concurrently and effectively uses data analysis algorithms. The proposed SaaS workflow system has been used in network operators and has achieved good results.
1. Introduction
With the rapid growth of data types and scale, the requirements for data analysis capabilities have been further enhanced. A data processing system (DPS) [1] collects and manipulates data items to produce meaningful information. Data analysis can assist companies in making market decisions, supporting business development, and improving user experience. Traditional data analysis systems are mostly stand-alone, such as SPSS (https://www.ibm.com/analytics/data-science/predictive-analytics/spss-statistical-software), Statistical Analysis System (https://www.sas.com/en_us/home.html), R (https://www.r-project.org/), and Waikato Environment for Knowledge Analysis (https://www.cs.waikato.ac.nz/ml/weka/). In the era of big data, data processing systems are mostly built on the cloud platform and employ distributed computing technology. The main data analysis methods, such as extract transform load (ETL) process, data mining, querying, and online analytical processing (OLAP), have also been implemented in a distributed computing manner to handle massive data analysis. This study focuses on how to introduce the workflow technology into the big data analysis system so as to improve the analysis performance.
With increasing information, traditional simple data processing systems meet the following challenges: (1) tremendous amounts of data: the scale of data to be processed becomes increasingly large; (2) data complexity: many new data types (e.g., structured and semi-structured data) emerge; (3) diversity of mixed loads: numerous emergent self-analysis requirements are proposed with the development of enterprises and the diversity of data.
Cloud computing [2,3] provides a new solution to traditional data analysis problems. It is a style of computing in which dynamically scalable and often virtualized resources are provided as services over the Internet. This computing style allocates computing tasks to parallel computers rather than local computers or remote servers. The operation of the enterprise data center will be similar to the Internet, which promotes enterprises to allocate limited computing and storage resources to required applications. Cloud computing provides services such as infrastructure-as-a-service (IaaS), platform-as-a-service (PaaS), and software-as-a-service (SaaS). Large amounts of data also promote the development of distributed computing technologies.
Many studies have been conducted on the batch computing of big data [4,5,6]. Google proposed the MapReduce programming model, and its open-source Hadoop has obtained remarkable achievements in theory and practice [7]. Not only batch computing, but also real-time streaming data analysis has drawn the attention of enterprises. For example, Yahoo introduced the S4 distributed stream computing system, and Twitter developed the Storm streaming computing system. Facebook utilizes Data Freeway and Puma to manage real-time data, whereas Microsoft uses the TimeStream system.
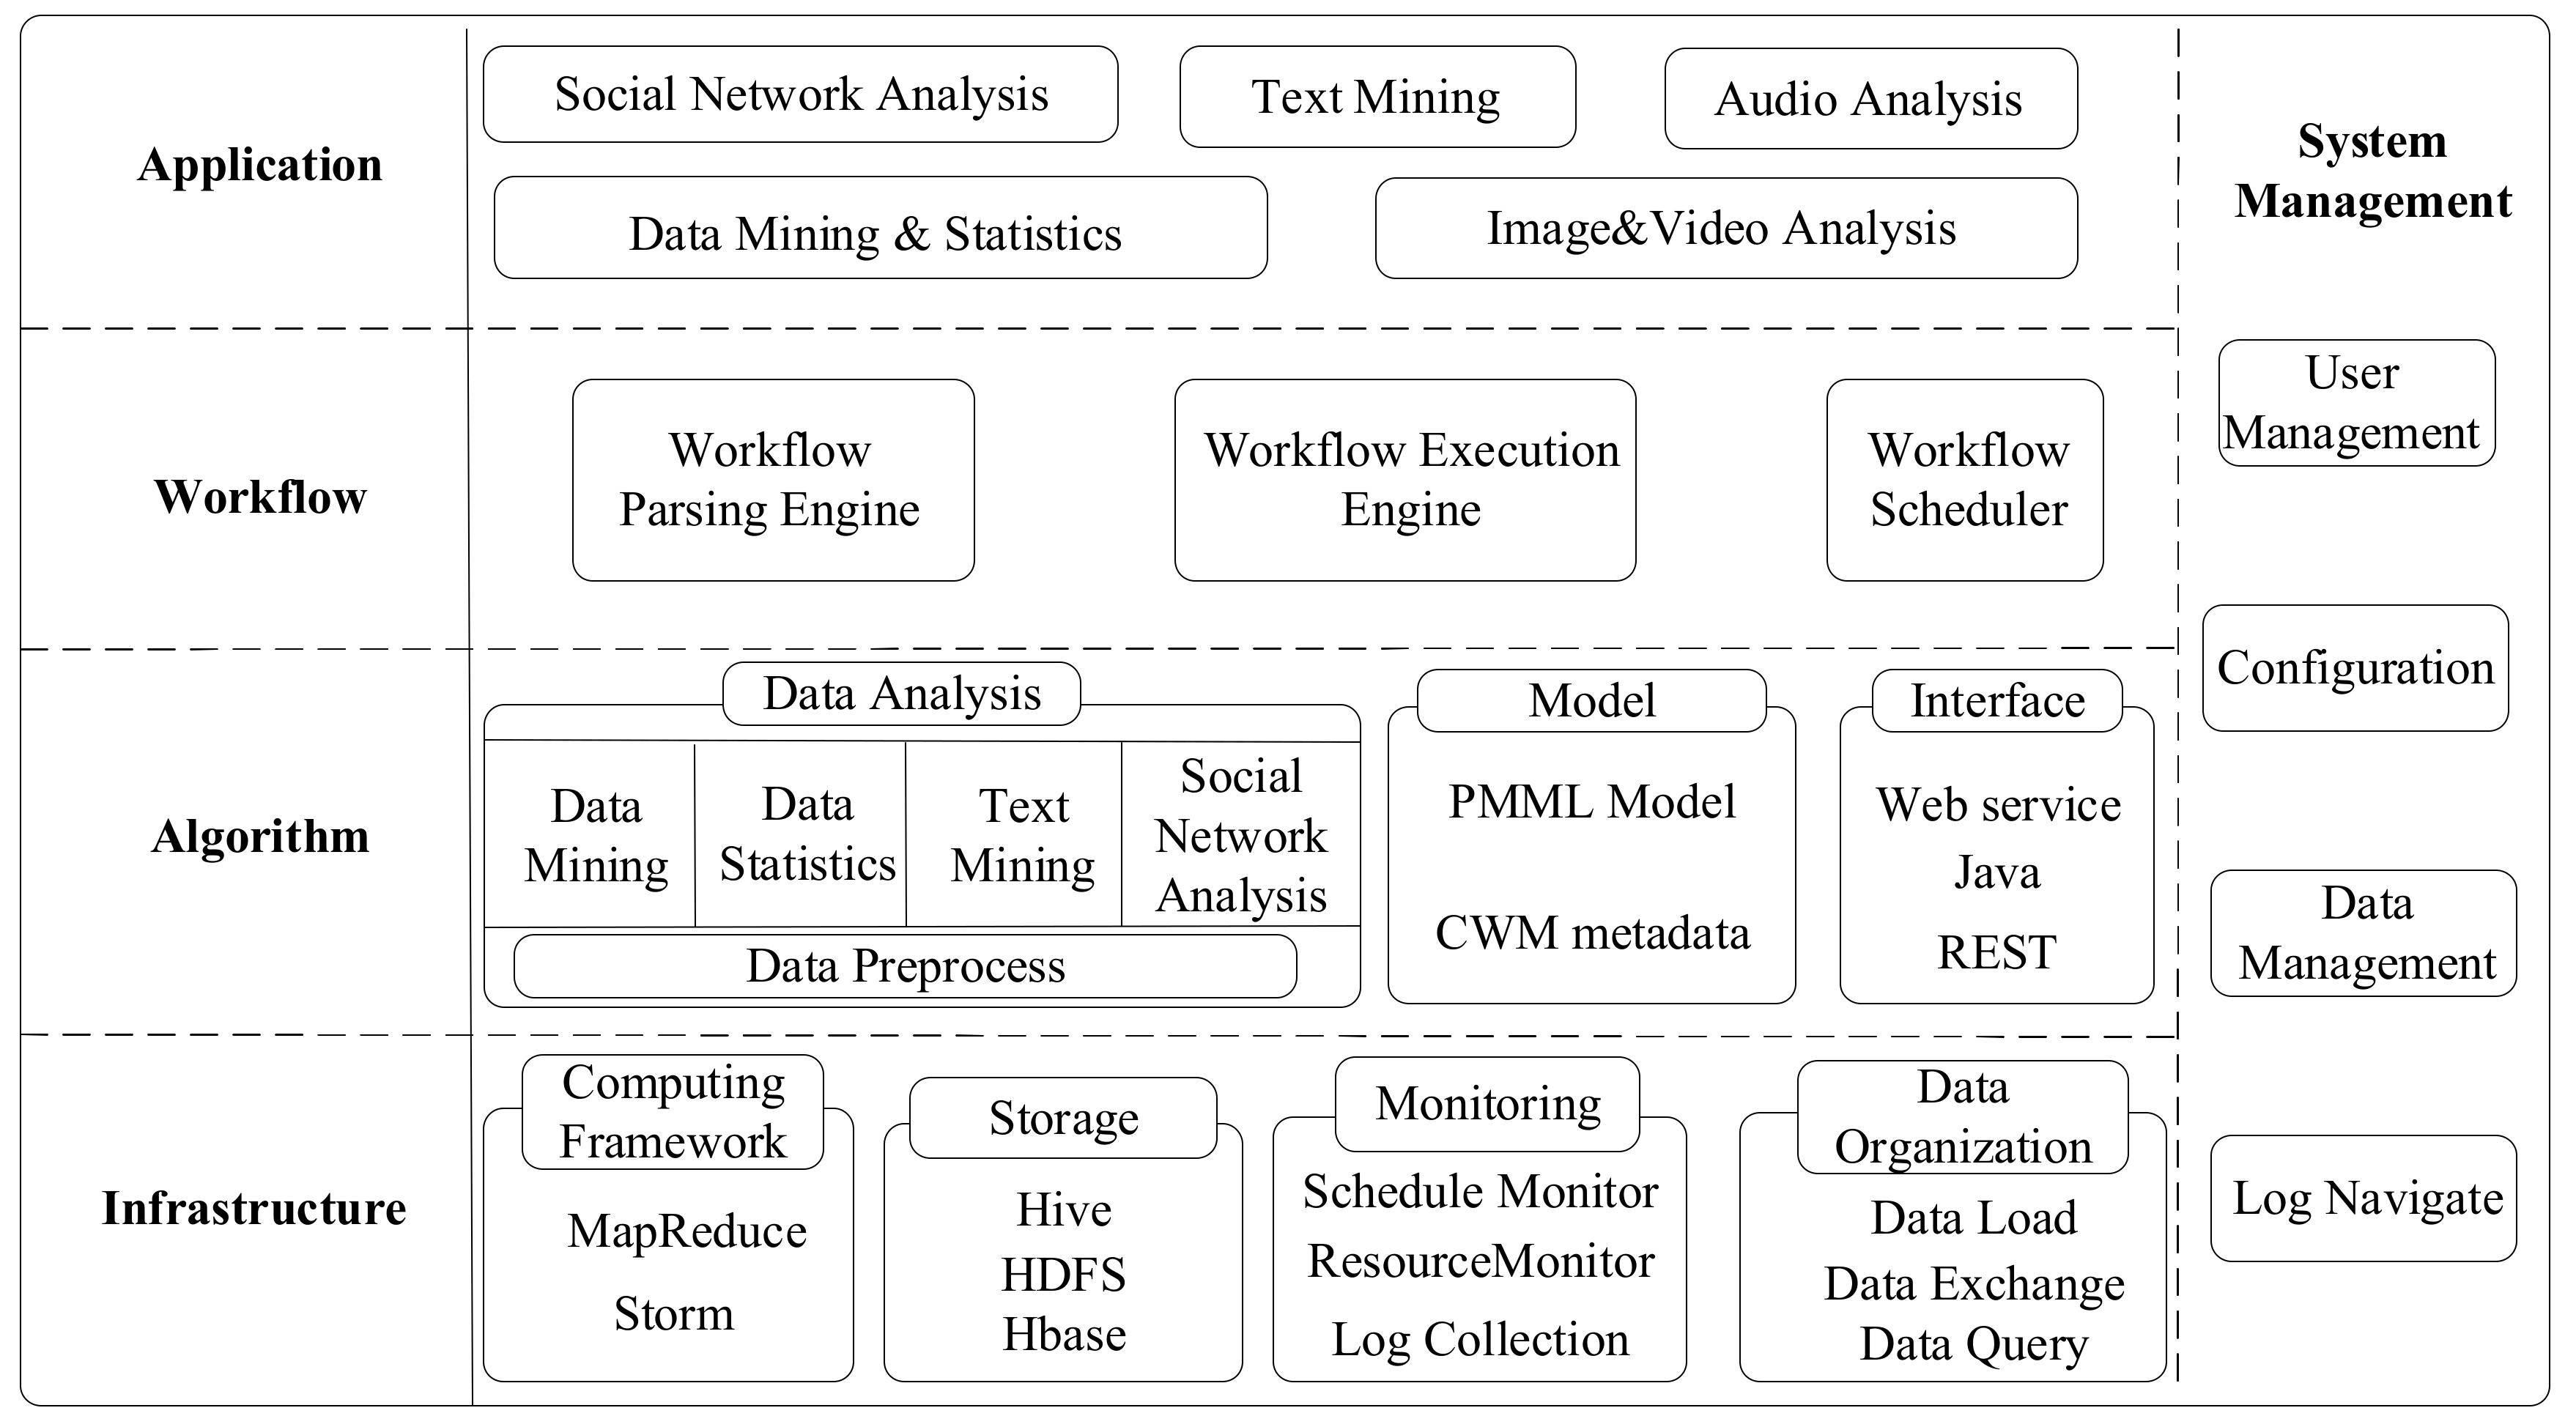
To meet these challenges, we propose a distributed big data analysis system—namely, distributed data mining (DDM) [8,9], which is a typical SaaS. Figure 1 shows the DDM architecture which contains infrastructure, algorithm, workflow, application, and system management. DDM can analyze and store large amounts of data on the basis of parallel computing and distributed storage capacity. This analysis system provides ETL, data mining, OLAP, and reporting services as cloud services via the Internet. The core of DDM is the workflow system. Users rend and customize a series of big data analysis applications. DDM transforms users’ requirements into workflow processes, which can be allocated as parallel task sequences in cloud computing platforms.
Traditional workflow management systems are commonly developed and deployed within enterprises for employees’ collaboration works. Enterprise workflow systems are inappropriate for big data analysis and multi-user high-concurrency situations. Enterprise workflow systems act as Internet applications that may meet some problems, including the following:
- (1)
- Multi-user high concurrency: Generally, the number of users for an enterprise workflow system is a few hundred to several thousand, whereas visits to the Internet often reach millions. Enterprise workflow systems have high rates of system resource occupation, which cannot match with lightweight SaaS applications.
- (2)
- Big data analysis: Traditional workflow systems usually run within memories or databases. During the running process, the workflow status is stored in memory; accordingly, the system memory requirements are proportional to the number of workflows. The number of workflows increases rapidly with the number of users. Traditional workflow systems cannot satisfy the requirement that the number of workflows is unlimited.
- (3)
- Complex business process: Workflows of DDM are big data analysis tasks rather than collaborative office among employees. Big data analysis tasks can usually be divided into several analysis sub-tasks that involve analysis nodes. The interactions among sub-tasks are complex, such as data- or control-dependent. Big data analysis tasks allow more than one starting node, and the priority to sub-tasks can be configured. During the data analysis process, analysis nodes need to be added to workflows dynamically according to the intermediate result. The addition of nodes monitors the execution statuses of tasks and processes them constantly because big data analysis is time consuming.
Although the application of workflow in the cloud computing field has proliferated in recent years, efforts in data analysis—especially big data analysis—are lacking. Duipmans et al. [10] investigated the possibility of integrating business process management into cloud computing. Cordys Process Factory [11] was especially designed as cloud workflow for Google Apps, allowing users to design business application programs on a web browser. Cordys Process Factory provides a structured workflow system into the unsystematic set of Google Apps—that is, a rearrangement of applications and application workflows. IBM introduced LotusLive [12], which provides online business collaboration and social network services. Users can obtain computing capacity via web portals. Although LotusLive was designed as a SaaS model, it mainly provides online business collaboration and social network services. LotusLive is highly coupled with its provided services.
This study proposes a representational state transfer (RESTful)-based lightweight cloud workflow system to solve the aforementioned problems and support big data analysis of SaaS. The system advantages include the following:
- (1)
- Our system provides web-based parallel big data analysis flow tools. Users can drag and drop components that involve parallel data analysis algorithms to create a big data analysis workflow. They can configure algorithm parameters and cloud resources according to their needs. Rich visualization components are offered to show the results.
- (2)
- A lightweight cloud workflow mechanism that can parse workflows into Extensible Markup Language (XML) description documents and directed acyclic graphs (DAGs) is designed. The workflow mechanism uses a RESTful interface to connect with the cloud platform. Workflow databases exist in HBase, which store the parsed XML documents and DAGs. The workflow execution engine employs cloud computing resources to monitor the execution status of workflows and record the information in workflow databases.
- (3)
- Our system proposes a chain cloud workflow execution mechanism to promote the execution efficiency of cloud workflows. The mechanism refactors workflows with maximized resource saving. For example, several jobs can be grouped to execute without intermediate among jobs to reduce input/output (I/O) operations.
- (4)
- The Lambda architecture [13] combines batch and online real-time analysis models, and is employed to meet the needs of different types of data analyses. This architecture makes analysis execution flexible and increases the robustness and flexibility of the system.
The remainder of this paper is structured as follows: Section 2 describes the cloud workflow system for big data analysis, including the working process analysis, workflow execution, and workflow scheduling. Section 3 introduces four typical big data analysis cases—namely, service recommendation, customer churn prediction (CCP), phishing site analysis, and network security situation analysis—to demonstrate the system application value. Section 4 demonstrates an experimental study comparing the results of different workflows on performance, concurrency, and delay response. Section 5 concludes and discusses further works.
2. Big Data Analysis Oriented Cloud Workflow System
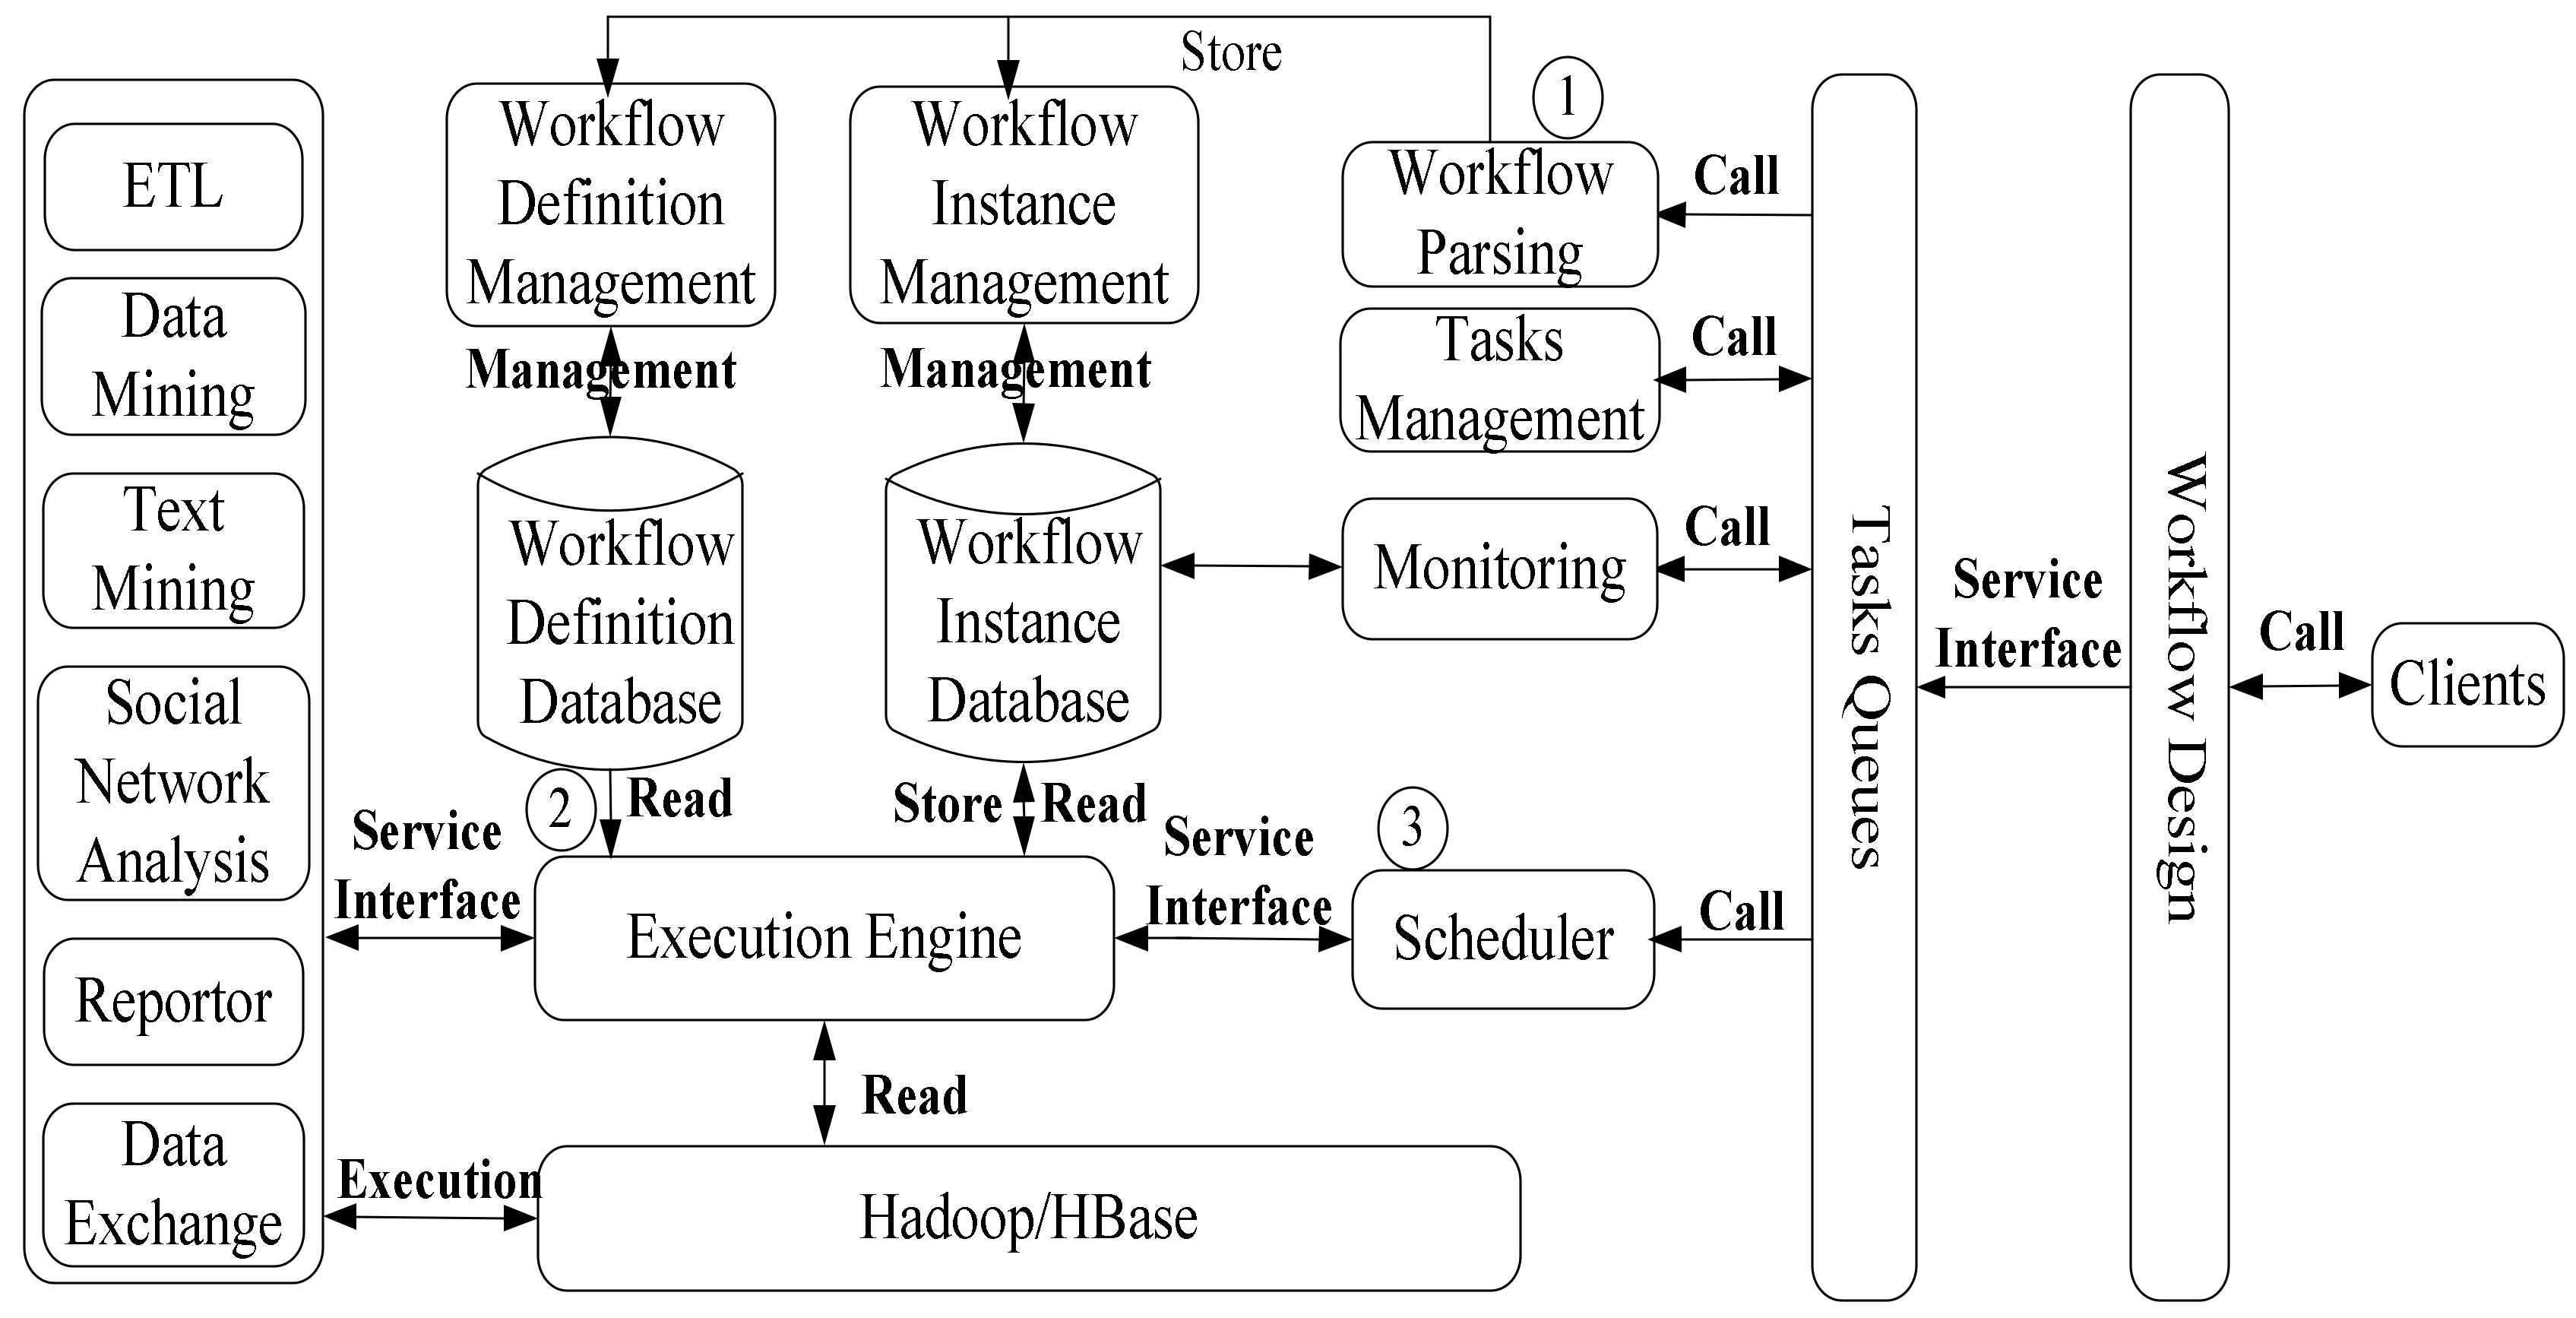
This section describes a big data analysis oriented cloud workflow system that manages and investigates business tasks and supports shared business workflows. Figure 2 shows the system topology that involves three parts—namely, a web server that provides friendly user interfaces (UIs) for users to design their applications; a workflow engine that mainly focuses on workflow parsing, execution, scheduling, and management that can be deployed on a high-performance server or reused in a parallel computing cluster; and a distributed cloud platform that provides real-time analysis capacity, offline data mining capacity, and distributed storage resources.
The parallel cloud platform not only implements big data analysis algorithms, but must also consider how to communicate with workflows. Figure 3 shows the work process of workflows, and the detailed procedures are as follows:
Step 1: Users drag and drop components to create their big data analysis applications as workflows via web UI. The web marks the submitted workflows with normal business (e.g., data exchange, result visualization, and reports) and cloud business (e.g., MapReduce, Hive, and Storm). The normal business can be performed by the web server, whereas the cloud business may be submitted to the distributed cloud platform. The marked workflows will be sent to the workflow parsing engine and stored in the workflow definition database. The workflow will be instantiated according to user’s configuration parameters, and the corresponding parsed XML description documents and DAGs will be stored in the workflow instance database.
Step 2: The workflow execution engine will respond to workflow execution requests after task information is submitted. The cloud platform starts the daemon process and calls the workflow XML definition documents and DAGs. The daemon carries out the tasks in order with control and data streams.
Step 3: A distributed computing platform is constructed using Hadoop, the open source of MapReduce and Google File System, and Storm. Our system combines the advantages of MapReduce, Storm, Hadoop Distributed File System (HDFS), and HBase to analyze big data. The analysis results will be sent to users and the results or analysis data will be stored according to the user’s setting.
Step 4: The workflow execution engine executes the entire process according to the workflow definition, and users can obtain the result on the web UI.
The workflow engine mainly involves three parts: workflow parsing engine, workflow execution engine, and workflow scheduling. They are elucidated below.
2.1. Workflow Parsing Engine
The workflow parsing engine includes workflow definition, XML description, parsing process, and workflow persistence. XML description is employed for two purposes: to record the process information of workflows and as an intermediate form to convert workflows to DAGs. XML description is a markup language to record the process information of workflow, configuration, input data, and output information. XML provides a uniform way to describe and exchange structured data between applications and providers. After the workflow construction, the workflow parsing engine parses the workflow into XML description documents which employ Java Business Process Model Process Definition Language (JPDL) [14] to describe workflow. XML description files are stored in the workflow instance database. Then, the description file is converted into DAG, which is used to guide the workflow implementation. DAG is a directed acyclic graph to recode the execution process of workflows. XML description is an intermediate form which makes it easy to convert workflows to DAGs.
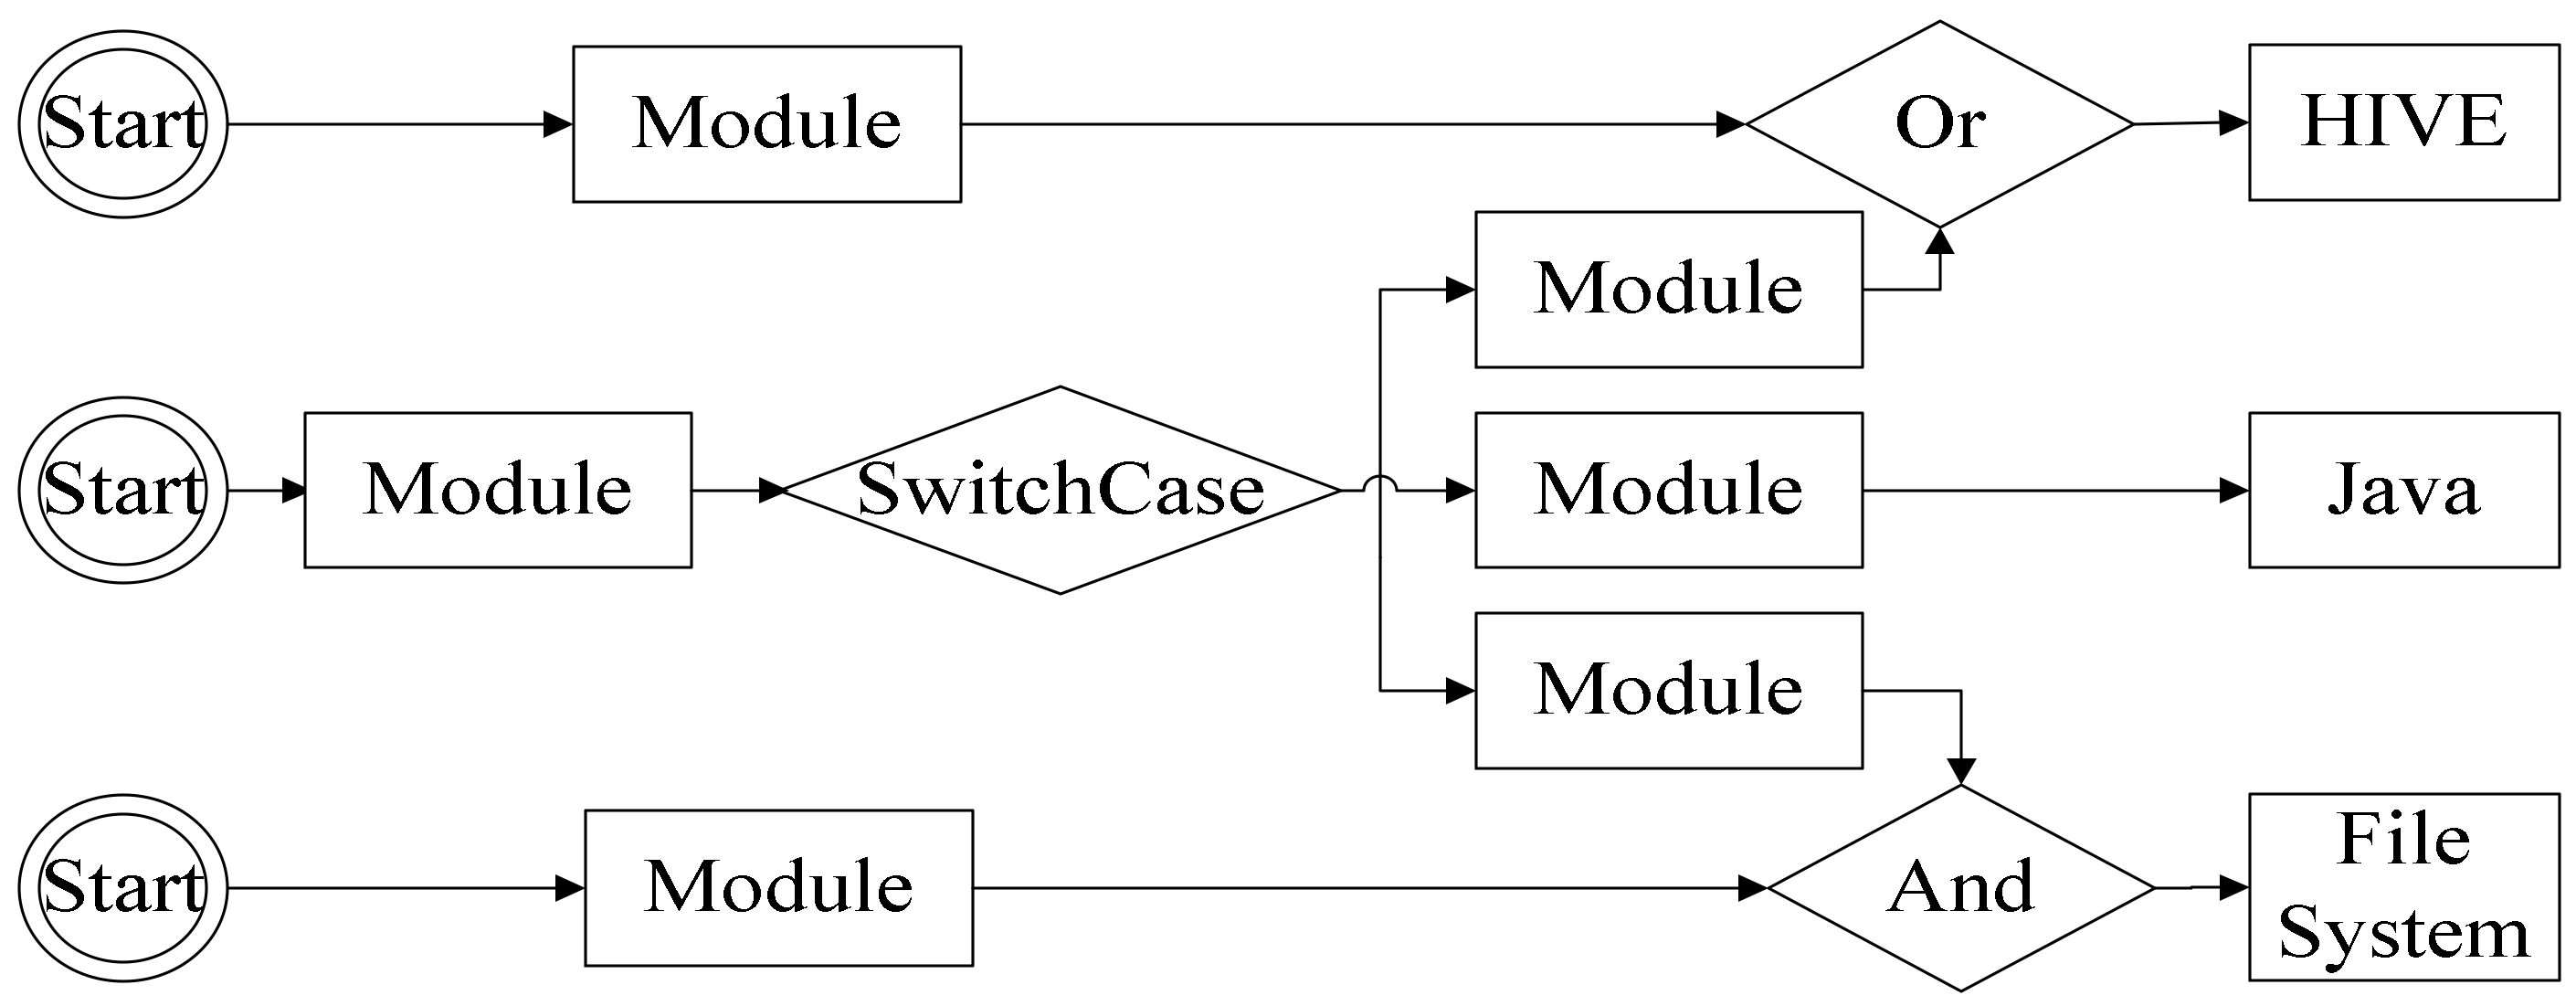
During the workflow parsing process (shown in Figure 4), each node of the workflow represents a component. Nodes can be divided into control nodes and function nodes according to their functions (as shown in Figure 5). Control nodes support many workflow conditions, including And, Or, and SwitchCase. Function nodes implement analysis tasks which include batch offline and real-time online analyses. Offline analysis components use a MapReduce calculation model, whereas real-time online components use a Storm streaming calculation model. Each component should mark the types, resources, parameters, and result outputs. The workflows of big data analyses are data-driven operation processes which automatically run tasks according to the rules of processes or the context state of runtime.
In the workflow parsing process, the parsing engine verifies the configurations of components according to the configuration requirements and sends the verification results to users. Workflow persistence is an important function of workflow engines, while traditional workflow systems reparse the workflow documents and run workflows at each time. In the traditional condition, the workflow statuses, intermediate results, and crucial points are not traceable. Consequently, the workflow persistence stores parsed workflow description files in a workflow description database. Every time workflow engines run workflows, they create workflow instances from the workflow instances in the workflow instance database. The workflow instances record the intermediate statuses, which can assist in operating workflows (e.g., stopping, continuing, workflow monitoring, history result query, and timer execution of the entire workflow executable process).
2.2. Workflow Execution Engines
The workflow-parsing engine parses workflows into JPDL and DAG, which can be stored into workflow description and workflow instance databases. The workflow execution engine reads workflow information from the workflow instance database. During the workflow execution process, different tasks are executed in different ways. This section introduces the interactions between the workflow execution engine and the distributed computing platform, as well as the process of the cloud tasks implemented in the cloud platform as shown in Figure 6.
- (1)
- The web server parses workflow configurations preliminarily. Workflow aspect: the workflows are marked with normal and cloud businesses, and the marked workflow information is transferred to the workflow engine (①); Data aspect: the submitted data can be transferred to the specified location of the cloud platform (②) according to the configurations.
- (2)
- The workflow engine parses the workflows received from the web server and stores the parsed results (which involves JPDL and DAG) into the database. The workflow execution engine initiates an executive request as a RESTful web service to the distributed computing platform (③).
- (3)
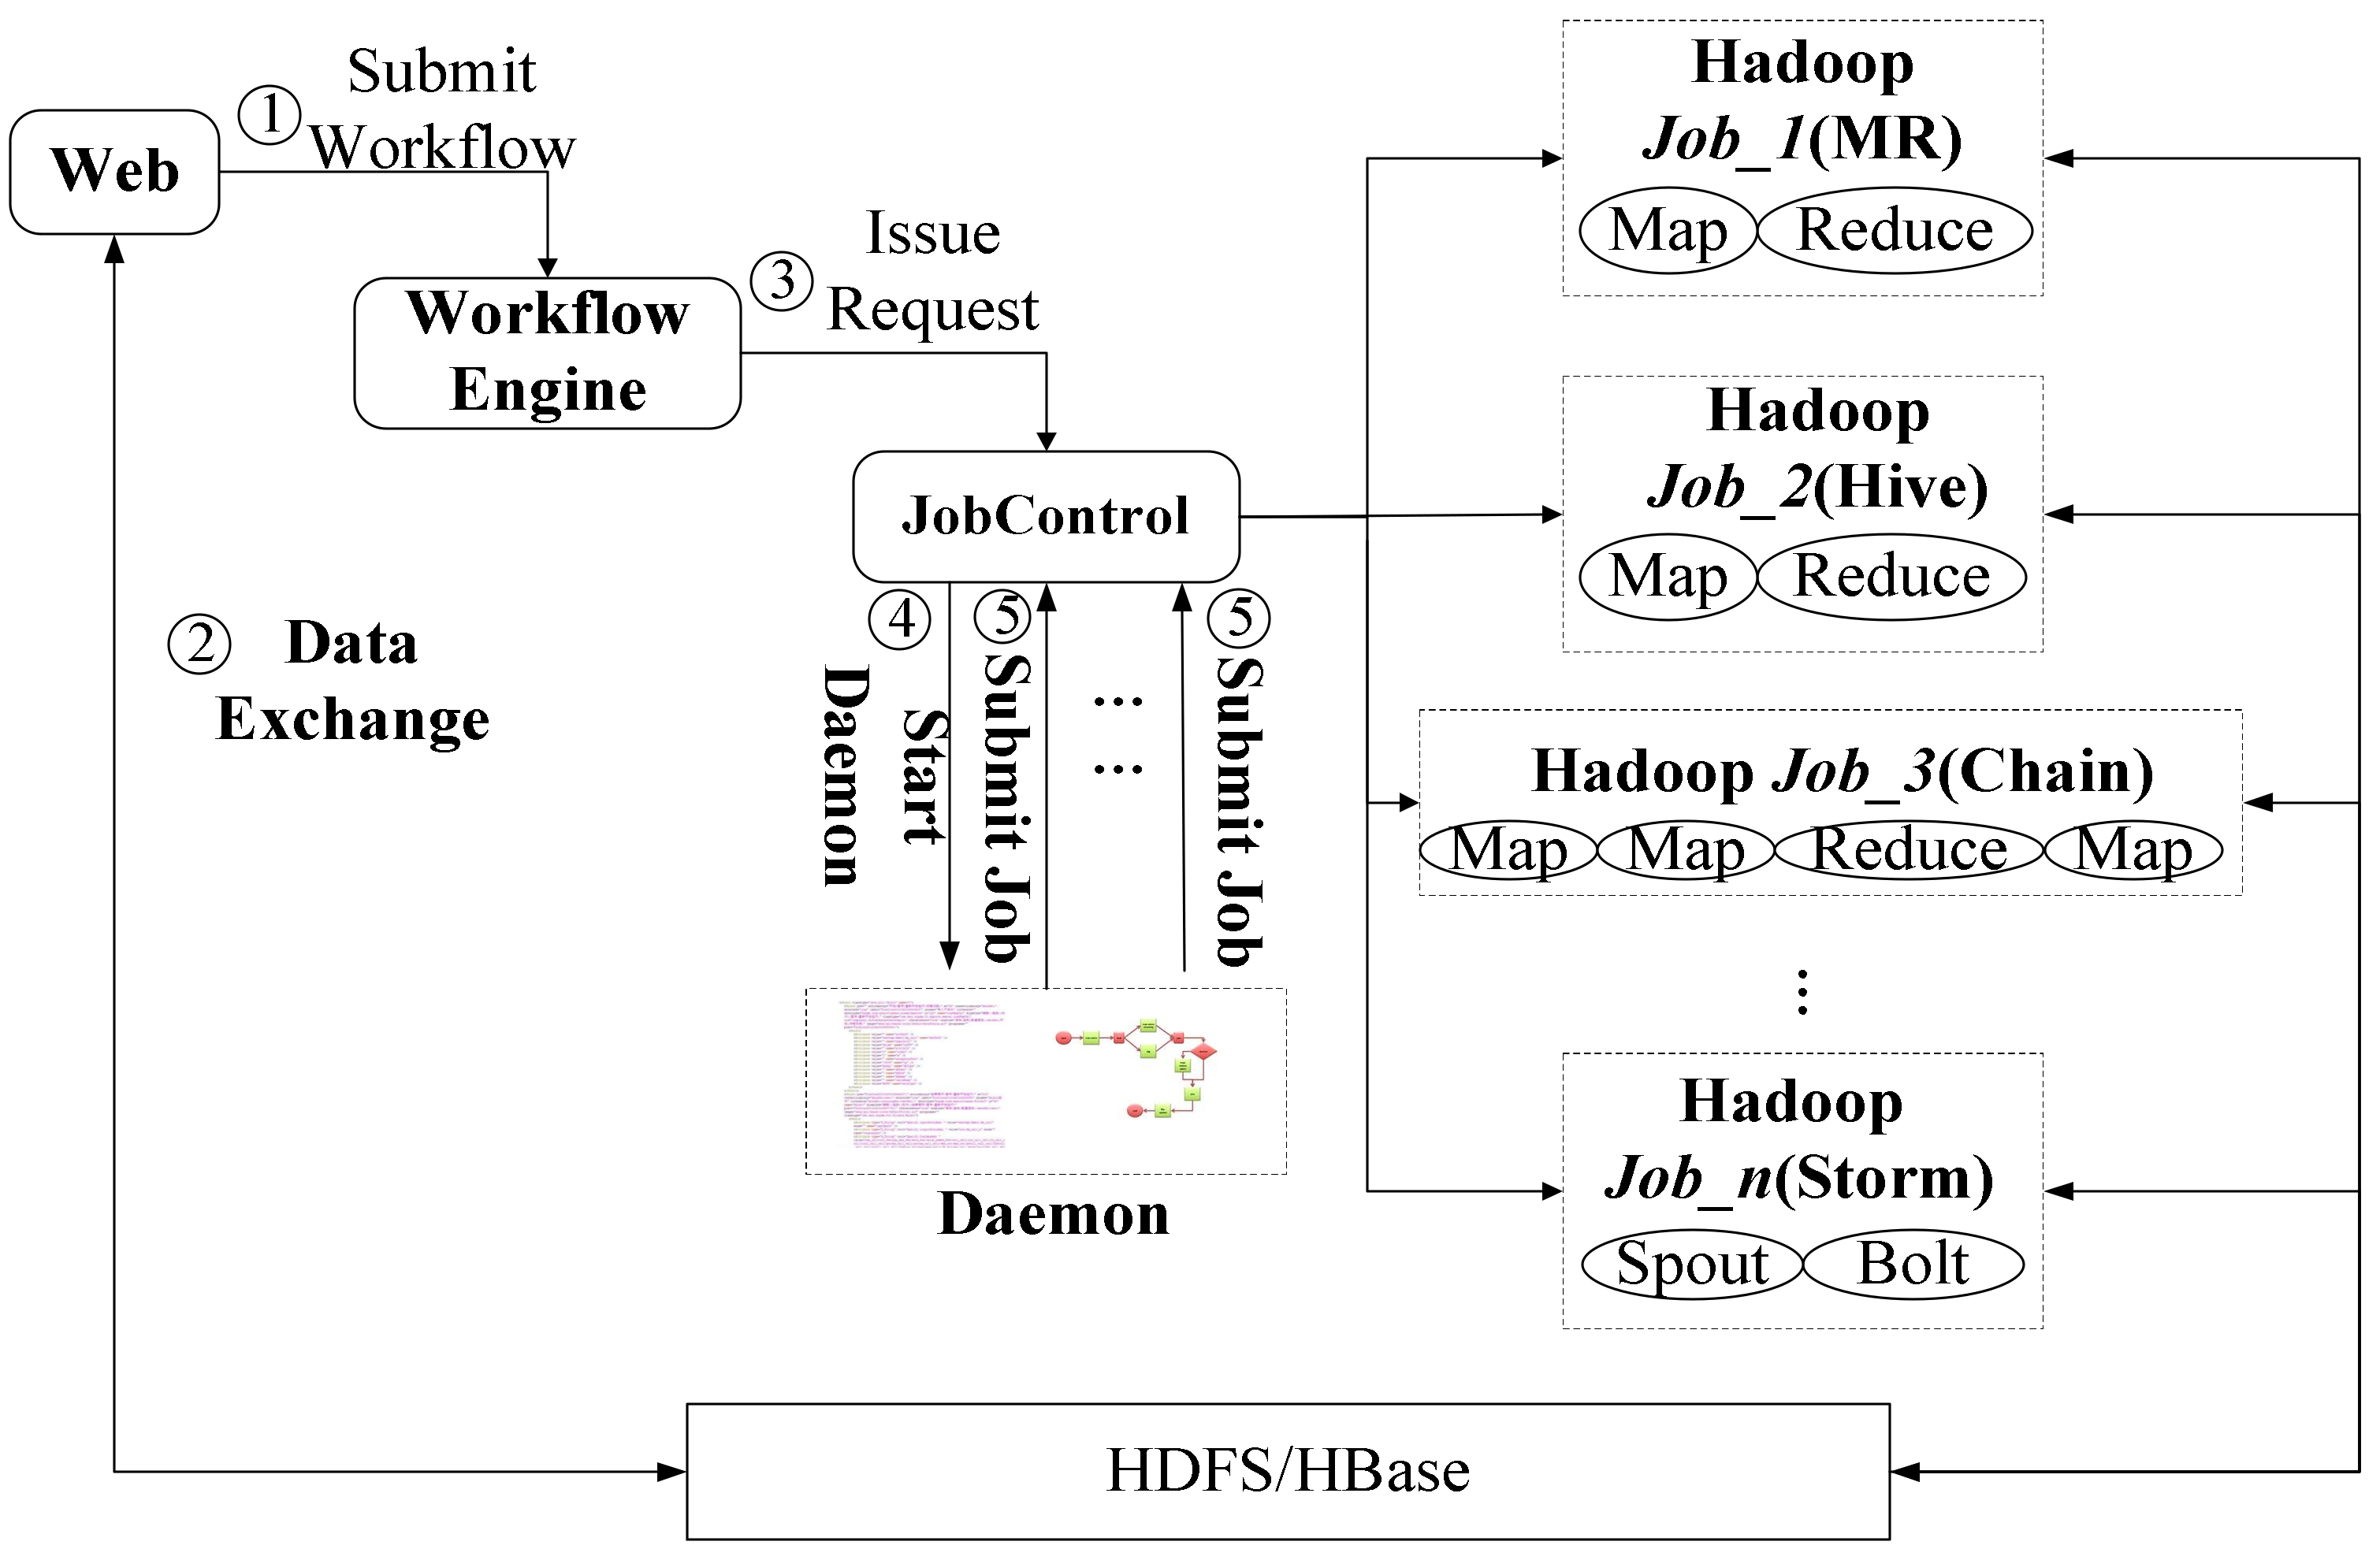
- The cloud platform starts a daemon, which parses the control and data streams of workflows when receiving the initiated executive request (④). In our system, the cloud businesses are divided into batch and online cloud businesses. The batch cloud businesses apply to offline batch data analysis tasks, whereas the online cloud businesses apply to online real-time data streaming analysis tasks. In the cloud platform, batch cloud businesses are implemented using one or more jobs (as shown in Figure 7), and online cloud businesses are executed by Topology structure (the detail is descripted in Section 2.2.2). The daemon invokes job or topology according to the configured control and data streaming to implement tasks in order until web they are finished (⑤). The daemon sends the results to the web server (⑥) that applied to execute normal businesses, which mainly include data visualization and report exhibition in big data analysis applications.
2.2.1. Offline Batch Analysis Model
The offline batch analysis model employs a Hadoop job to execute offline analysis tasks. Each job involves Map and Reduce stages, but the Reduce stage is unnecessary. Figure 7 shows the process of job execution in a cloud platform. When the daemon submits a task, JobTracker coordinates resources to execute it first (M1, M2, and M3) at the Map stage and then at the Reduce stage (R1 and R2). The number of Map and Reduce tasks can be configured by users (3 and 2 in Figure 7 respectively). A pseudo-regular expression is used to demonstrate the job execution: [MAP|REDUCE?]. TaskTracker monitors the entire job execution at the Map and Reduce stages, which run on Java virtual machines independently. The job inputs and outputs in the HDFS, as well as the input data will be sent to a particular location in the HDFS.
- (1)
- Common WorkFlow
The daemon decomposes the DAG into the run time dependencies among jobs. Nonlinear dependencies can be implemented by modular MapReduce. Hadoop provides job and JobControl classes. The former maintains the configuration of sub-tasks and the dependencies among sub-tasks, and the latter controls the entire task process by adding all tasks into JobControl and executing the run() function to ensure the sequential execution of workflows. Under common workflow condition, tasks are executed dependently and sequentially. The definition is as follows:
Definition 1.
CommonWF: Common workflow can be described using pseudo-regular expression as follows:
[MAP|REDUCE?] +
REDUCE is represented as the reducer stage following MAP which means mapper. [·] denotes a job and [MAP | REDUCE?] means to repeat the process one or more times to complete tasks.
- (2)
- Chain WorkFlow
In the case of a common workflow, the output results of each component are written into the hardware. For component-intensive workflows, frequency I/O operations will decrease the workflow performances. In an actual data analysis process, massive data analysis applications need to preprocess and postprocess the data (e.g., select, where, and casewhen). These preprocess or postprocess components are implemented by the MapReduce task in the case of common workflows. Inefficiency occurs when the intermediate results of each step take up I/O and storage resources. The preprocess and postprocess components are often simple and only have mapper functions. Therefore, the workflows can be executed in a modular or combined way. If multiple jobs only have one reducer, they can be combined as ChainJob, which can execute together in a memory (as shown in Figure 8). The combination of multiple process components does not generate the intermediate file or reduce the I/O operations to any great degree. On the basis of the preceding analysis, we propose a chain workflow mechanism wherein the daemon combines jobs dynamically. The definition is as follows:
Definition 2.
ChainWF: The pseudo-regular expression of ChainWF is:
MAP + | REDUCE | MAP*
With ChainJob2 in Figure 8, for example, the ChainWF engine executes multiple mapper preprocess functions with reduce function following, then optionally executes some mapper for postprocessing. In practice, ChainWF combines multiple tasks into a ChainJob and executes them together, thereby improving the performance of workflow execution.
2.2.2. Online Real-Time Analysis Model
The MapReduce architecture focuses on batch computing analysis, which can satisfy many offline analysis needs. However, many highly dynamic real-time analyses (e.g., real-time trend prediction and search query) are needed. We employ Storm [15] in the distributed computing platform to analyze the sequential streaming data.
Storm is different from MapReduce. MapReduce is essentially a batch analysis system which puts data onto the HDFS and distributes them to each node to be analyzed. After each node completes data analysis, the resulting data are sent to HDFS for users. Storm is in-memory computing, which imports data onto memory for computing. Reading from and writing to memory are faster than hardware conditions because the hardware access latency is approximately 75,000 times higher than the memory access, indicating that Storm is better suited to real-time computing than MapReduce.
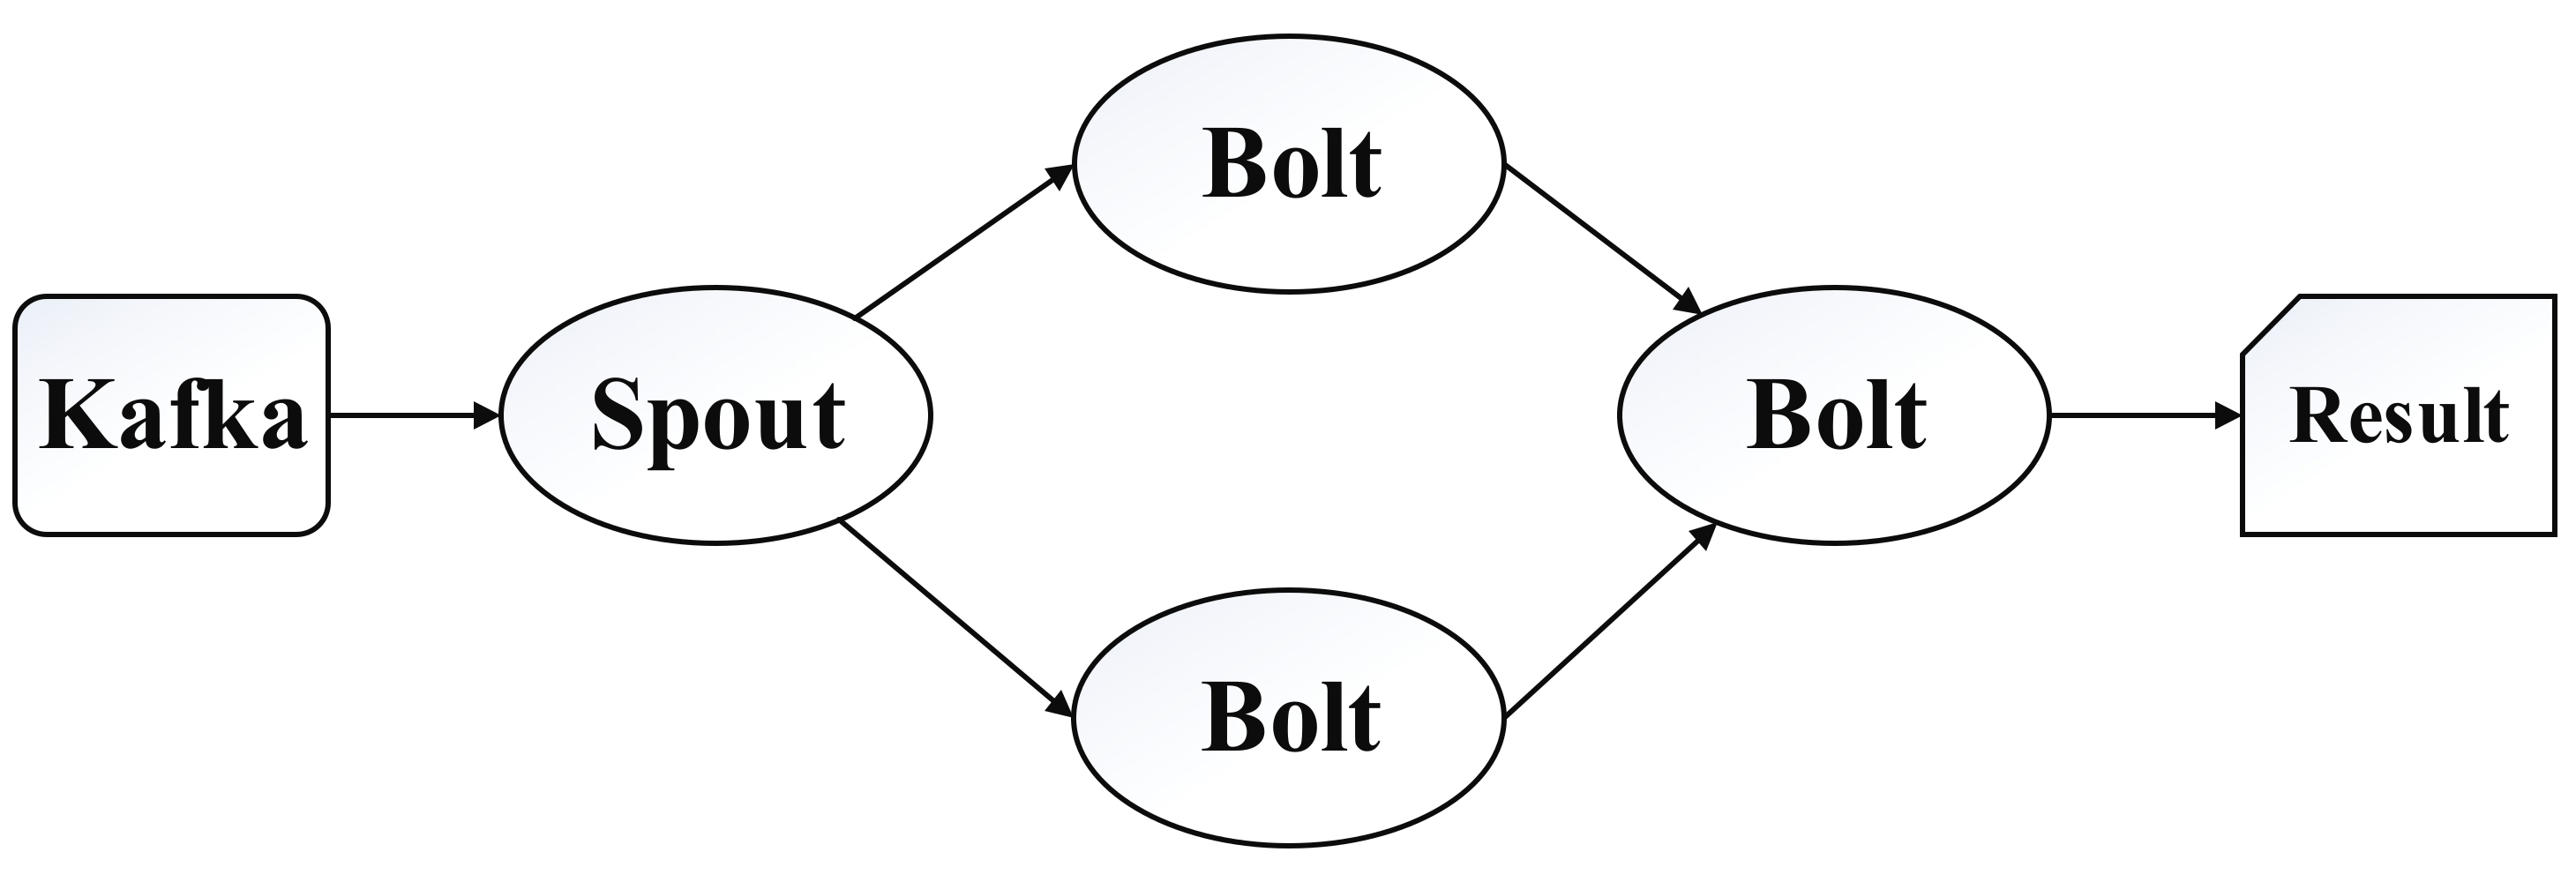
As shown in Figure 9, Storm implements a data streaming model which provides a series of basic elements for parallel computing, such as topology, stream, spout, and bolt. Storm encapsulates a real-time task, given topology includes spouts and bolts, and forms an execution graph based on data streaming. The topology is submitted to a cluster and the master node distributes tasks to worker nodes for execution.
The Storm cluster distributes needed resources for the topology to ensure its smooth implementation. When the topology is completely executed, it releases the occupied computing resources to the Storm cluster. An online real-time workflow can be expressed using pseudo-regular expressions as follows:
[Spout|Bolt+] +
Topology supports one or more tasks to complete one computing component (Spout or Bolt) in parallel, and the Storm cluster distributes multiple tasks to run the component on the basis of users’ definition. Storm defines a stream grouping strategy to transfer tuples between spout and bolt. In topology construction, users need to define which stream type can input data onto the bolt. Storm currently provides seven stream grouping strategies: shuffle grouping, fields grouping, all grouping, global grouping, non grouping, direct grouping, and local and shuffle grouping.
Figure 10 shows that the Storm cluster has two nodes—namely, master and work nodes.
- The master node runs the daemon Nimbus, which is similar to JobTracker in Hadoop. Nimbus is mainly responsible for distributing code, allocating tasks to the work node, and monitoring the running state of the cluster.
- The work node runs the daemon Supervisor which monitors tasks allocated by Nimbus and start/stop worker process. Each worker process executes the topology sub-tasks. Multiple distributed work nodes can cooperate to complete a Topology.
Zookeeper can coordinate the interaction between Nimbus and Supervisor and store all the running states in the Storm cluster. The processes of Nimbus and Supervisor are fail-fast or stateless.
2.2.3. Lambda Architecture
Combining offline batch (MapReduce) and online real-time analyses (Storm) into the same cluster is important. O’Neill [16] proposed three fusion methods according to coupling degree. They are as follows:
- (1)
- Using the same data analysis language to develop analysis projects and execute the projects in the two models which run in the same clusters.
- (2)
- Using different data analysis languages and running the two models in the same cluster (sharing the same resource management, such as physical resources and data).
- (3)
- Loose coupling that executes the two models in different logistic clusters using virtualization technologies (resource allocation between the two models is isolated and can share data).
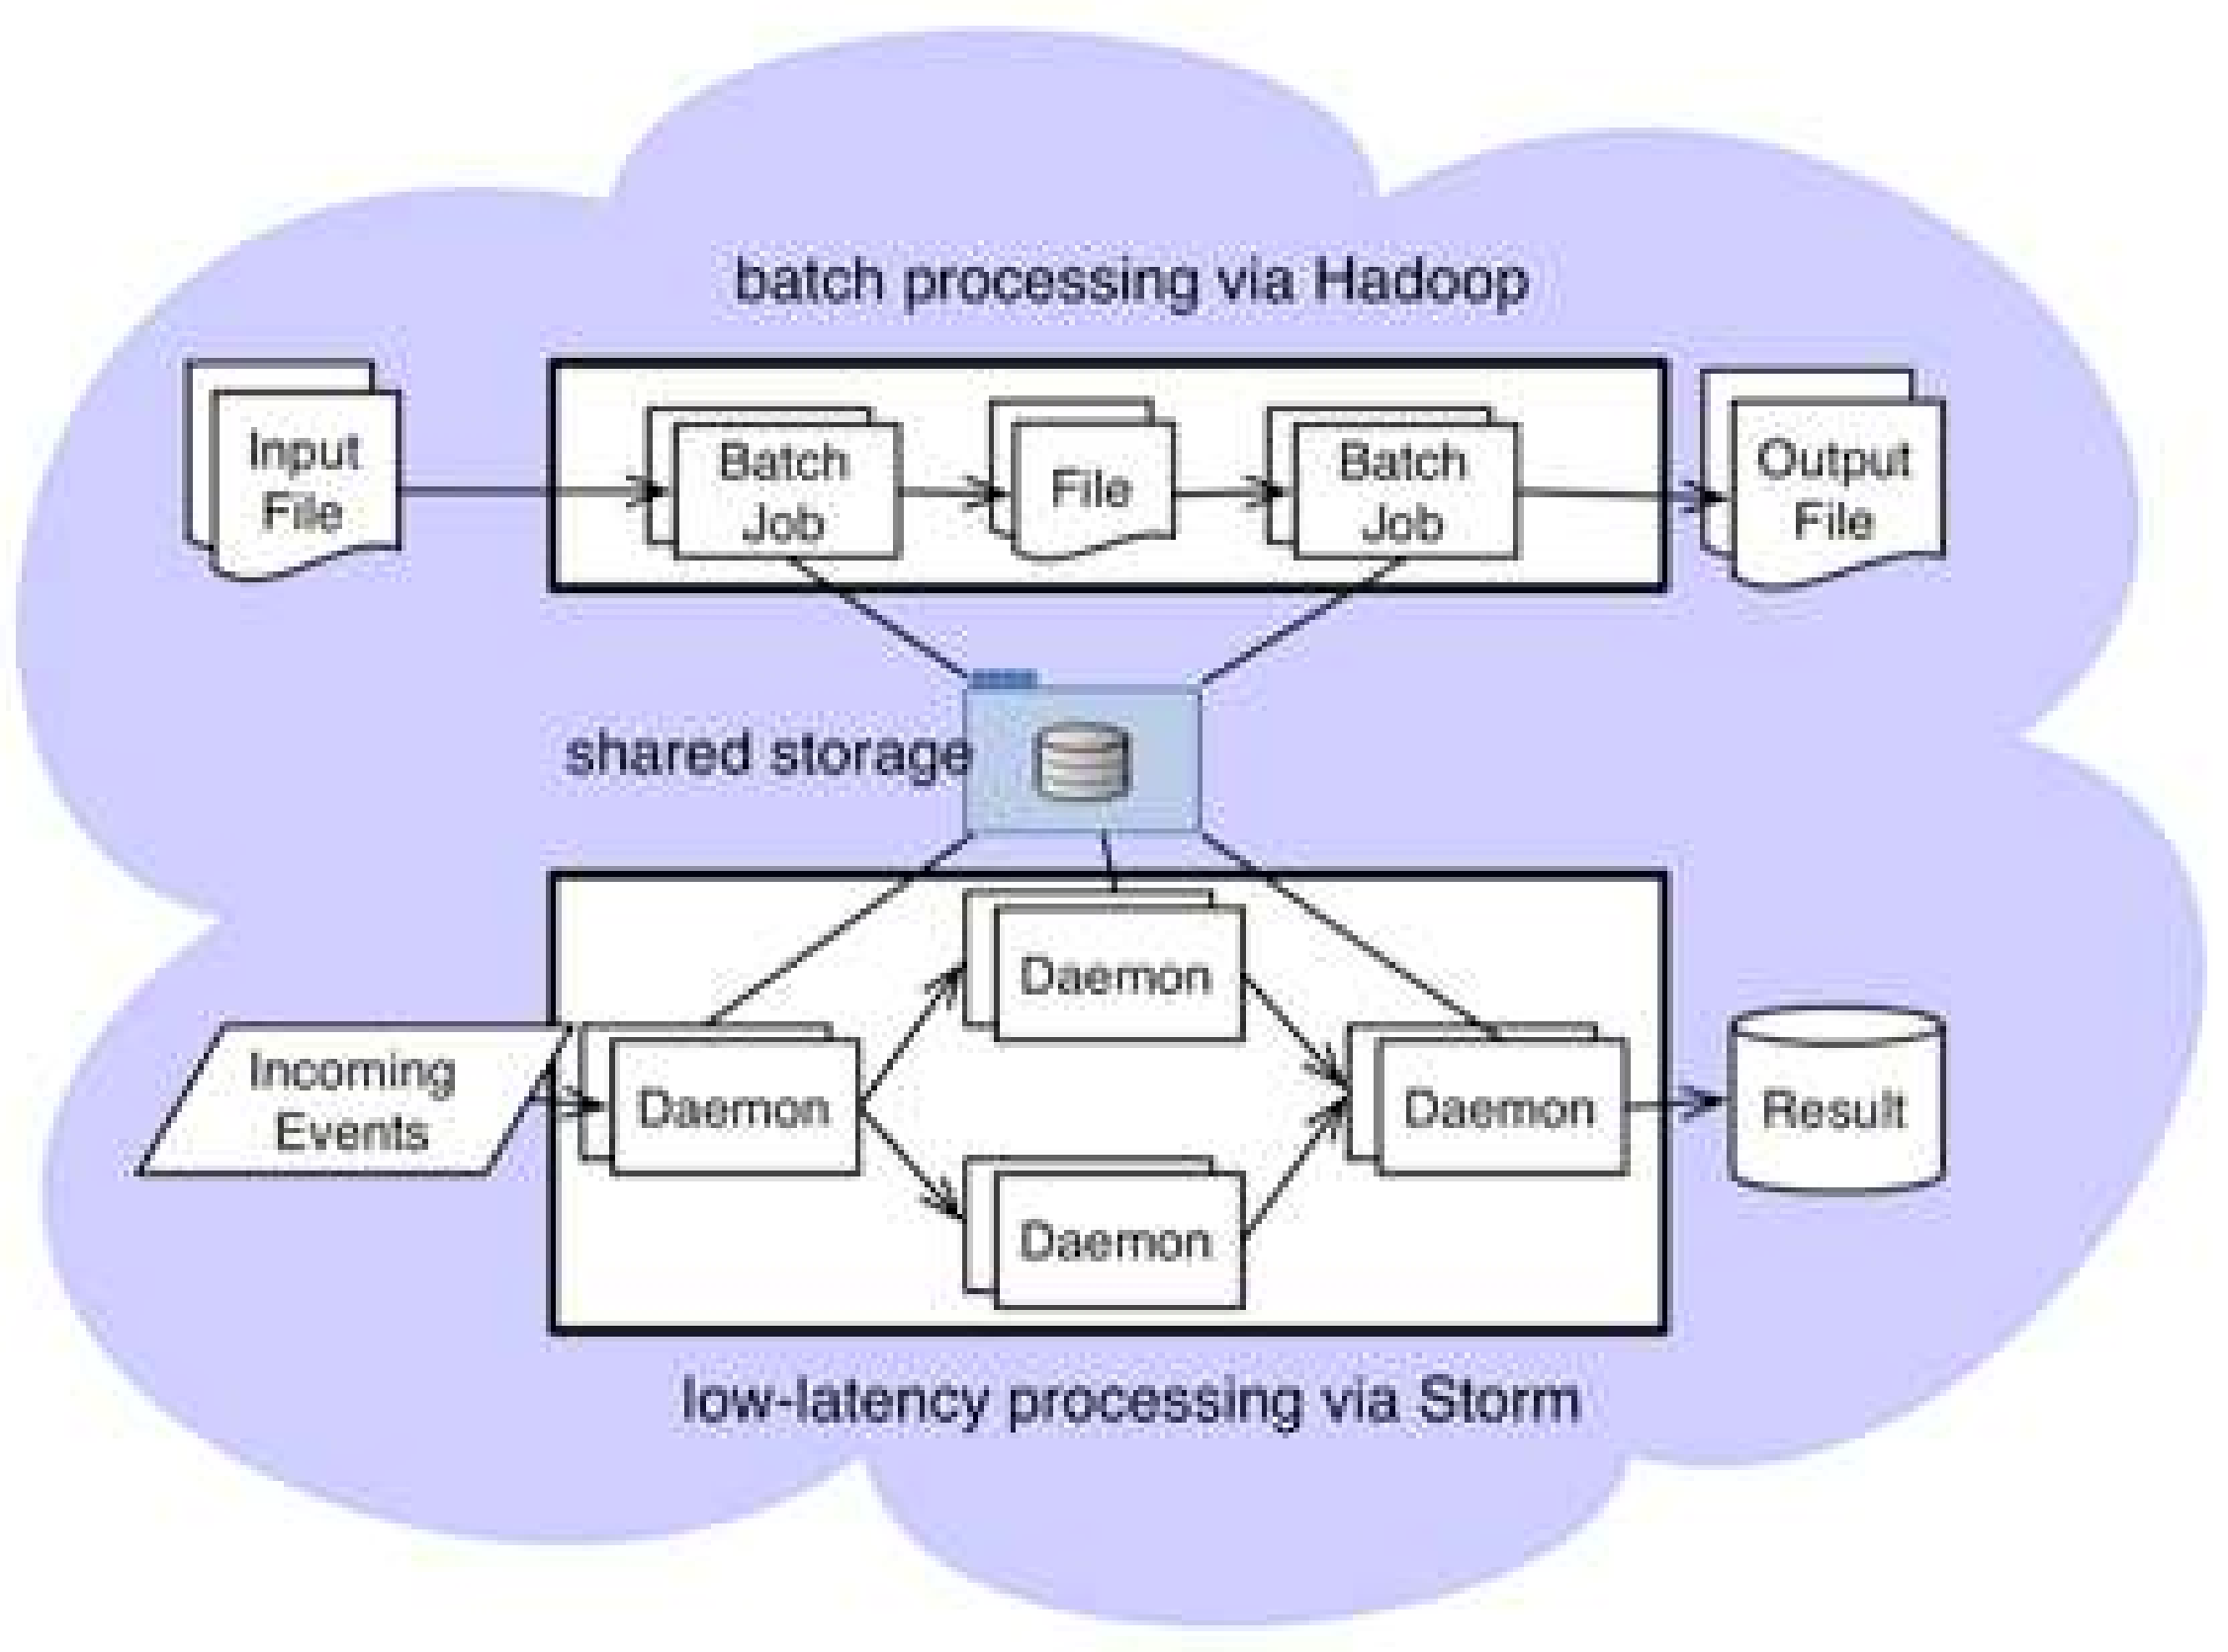
From the second fusion idea, we employ storm-yarn (yet another resource negotiator) to integrate the two analysis models into the same cluster; this is also known as “Lambda architecture” (as shown in Figure 11). A zookeeper is employed to manage resources and sharing data through a storage medium such as HDFS or HBase. The lightweight integration not only puts the two models into the same cluster harmoniously, but also keeps the two model frameworks independently.
2.3. Workflow Scheduler
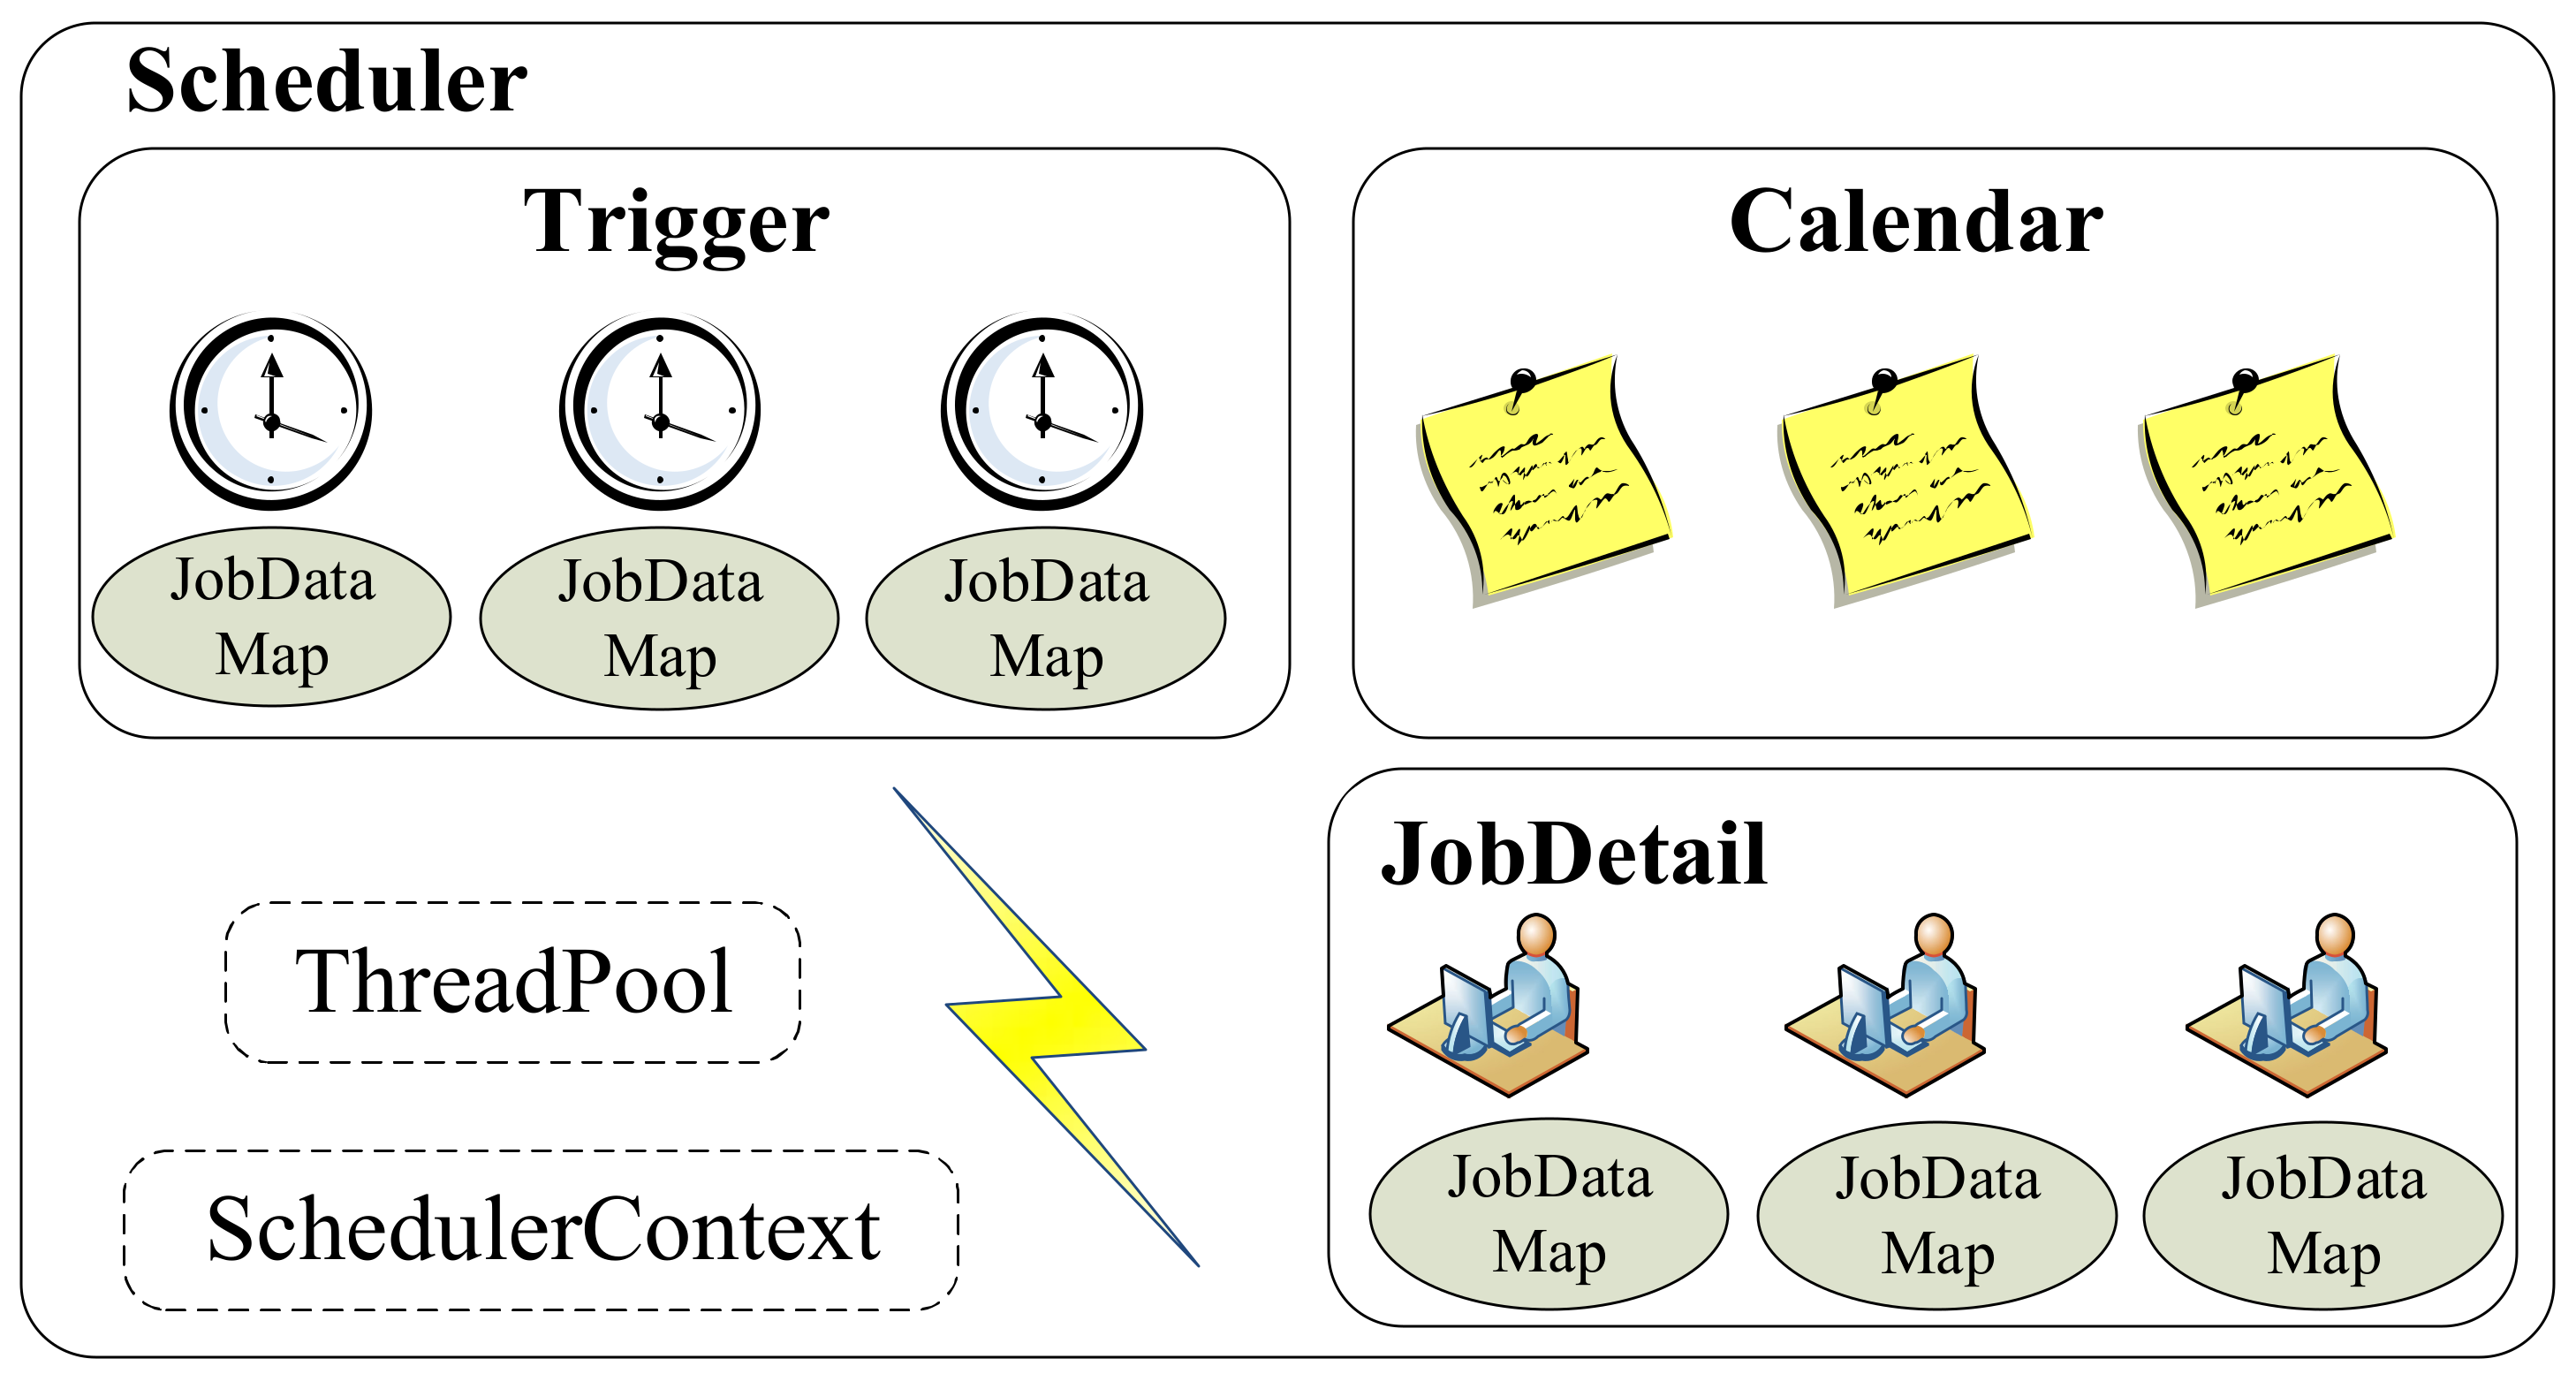
Workflow scheduler includes time scheduling and workflow dependency. Time scheduling is important in big data analysis, which mainly needs offline analysis periodically and online real-time analysis, such as constructing daily business reports. Workflow dependency means that another process would be triggered after a process is executed. “Workflow scheduler module” refers to the scheduling framework Quartz [17] (as shown in Figure 12), which employs Job, Trigger, and Scheduler as three core concepts. Job is an interface. A developer implements an interface definition to execute tasks. JobDetail describes the implemented interface and related static information, such as job name, description, and association with the listener. Trigger is a class that describes the time trigger rules of a triggered job, and it includes SimpleTrigger and CronTrigger. SimpleTrigger applies to trigger execution periodically, and CronTrigger is developed for workflow dependency. Scheduler is a container of workflow scheduling. Trigger and JobDetail can register in the scheduler. Scheduler binds Trigger for JobDetail so that when Trigger is triggered, the corresponding job is executed.
3. Case Study
This system not only allows users to construct business workflows by themselves, but also provides data analysis templates, such as user behavior analysis, user’s interest analysis, customers churn prediction [18], and social network analysis. This section introduces service recommendation and CCP using telecom operators’ data. Two security applications for phishing site detection and network security situation analysis are proposed to demonstrate the practicality and efficiency of the system.
3.1. Service Recommendation
Workflow definition: For telecommunication services, customer behavior has a specific mode, which can help operators in service recommendation and proposing new services according to customers’ needs. Service recommendation mainly includes two sub-tasks: customer cluster and service recommendation. Figure 13 shows the workflow process of service recommendation.
- Customer Cluster: Customers are divided into multiple clusters, in which customers having similar behavior characteristics are grouped. The “Input” component imports data to the platform. The “Select” component selects related features for applications because raw data have many features. The “K-means” component divides customers into multiple clusters of similar consumer behavior.
- Service Recommendation: We use a classification method to find the latent relationship between customers’ properties and selected services on the basis of the result of customer clustering. In this scenario, the classification labels correspond to service numbers. The “Input” component imports data to the platform. The “Select” and “Delete” components filter features. The service numbers are discrete; thus, we select the “C45” component to classify new customers into service types.
Workflow instance: Analyzing class data requires preprocessing by filtering 39 columns and 300 million rows of raw data into 20 columns including customers’ attributes, charge, voice communication (calling, called, local, roaming, long distance, and the corresponding number of calls and time of calls), and message information. In the application, customers can be clustered into six clusters: advanced, advanced call, advanced value-added, midrange call, midrange value-added, and low-end customers. The clusters of customers and the number of services are used to train the classification model, which can predict customers’ behavior to recommend suitable services for new coming customers.
Result: The cloud platform involved 86 nodes and each node had four Intel Xeon E5504 CPUs, 8 GB memory, and 1 TB drives. In this application, we employed 29 GB raw data for two months, which involved personal information, customers’ behavior, and the services they actually selected. The workflow analyzed 29 GB of raw data in 37 min and 46 s and obtained 89% accuracy compared with the actual result. The service recommendation model was applied to the operator’s business. Practical application demonstrates that the proposed workflow has certain practical value and can help enterprises to improve their business experiences.
3.2. Customer Churn Prediction
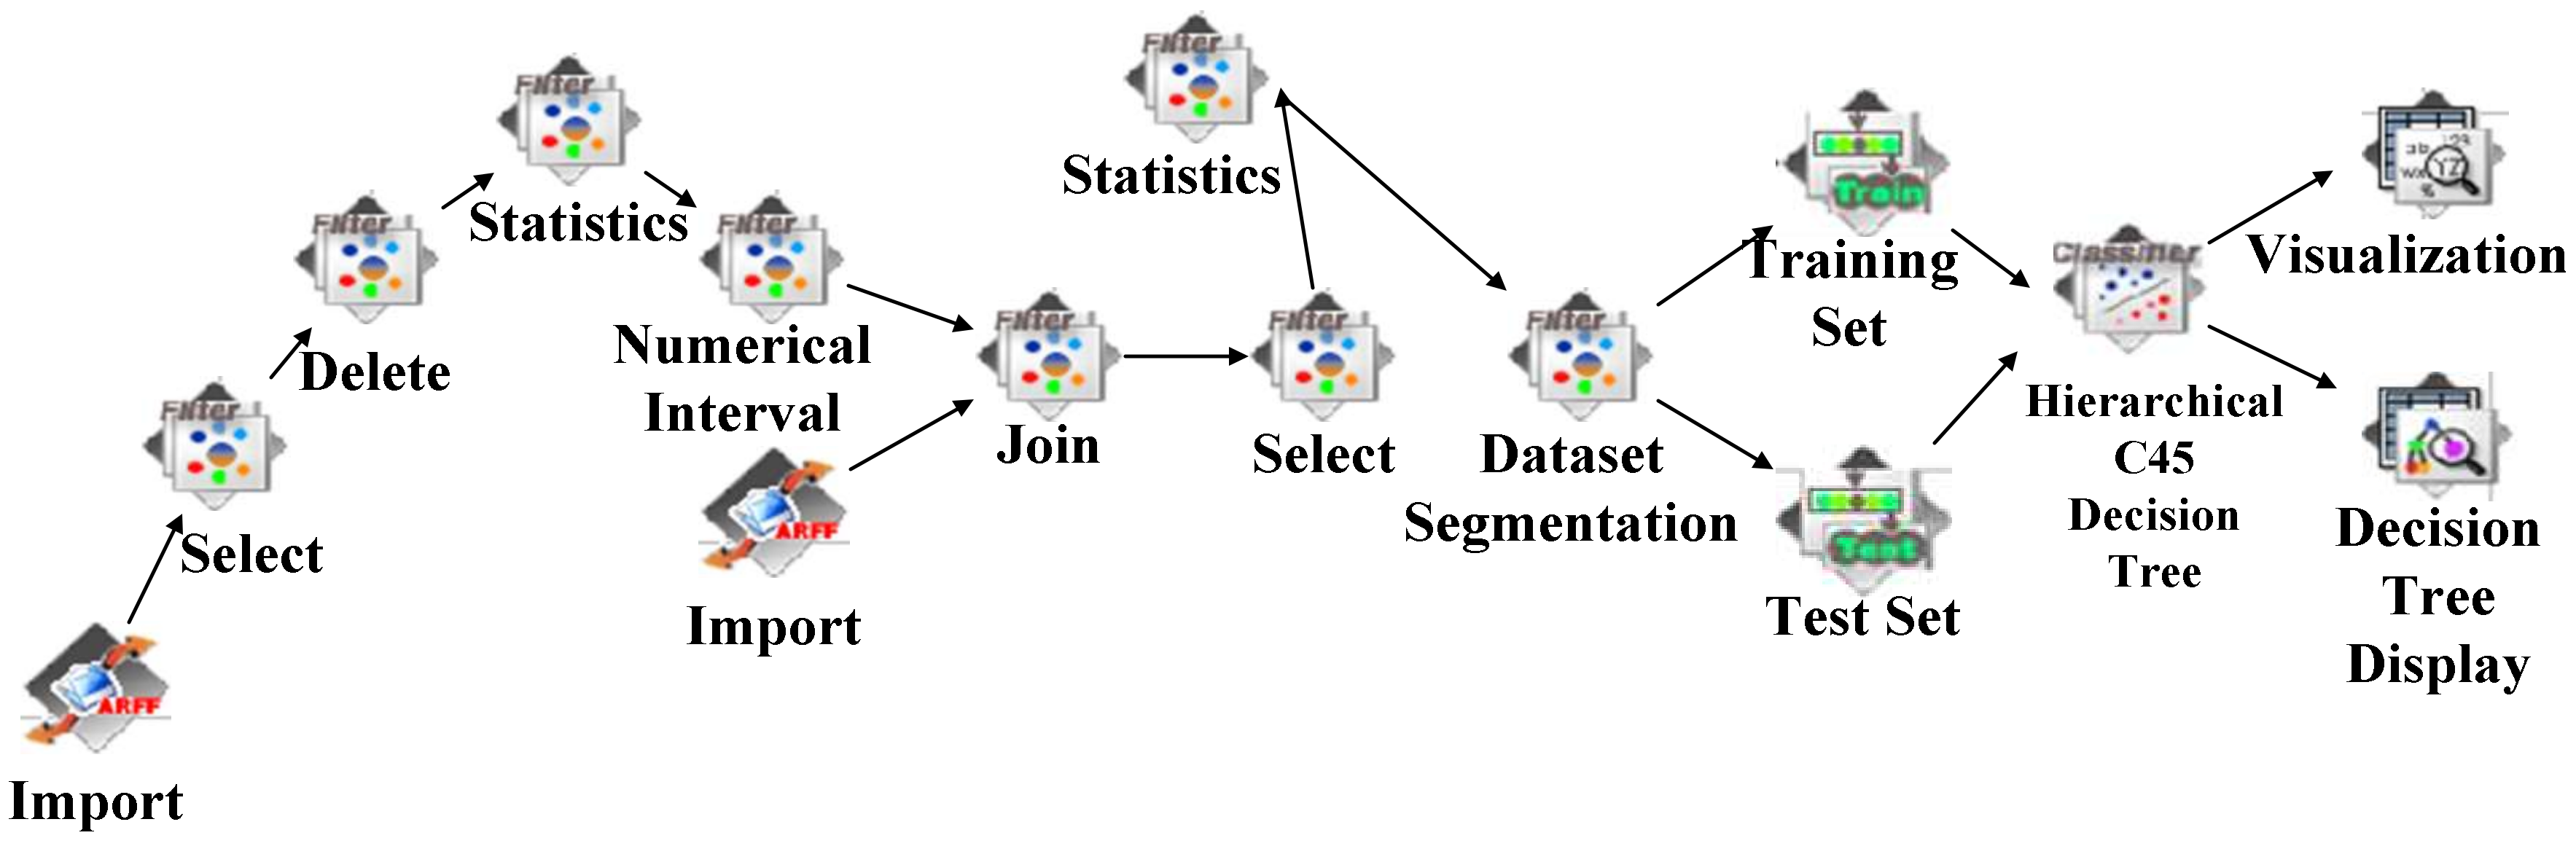
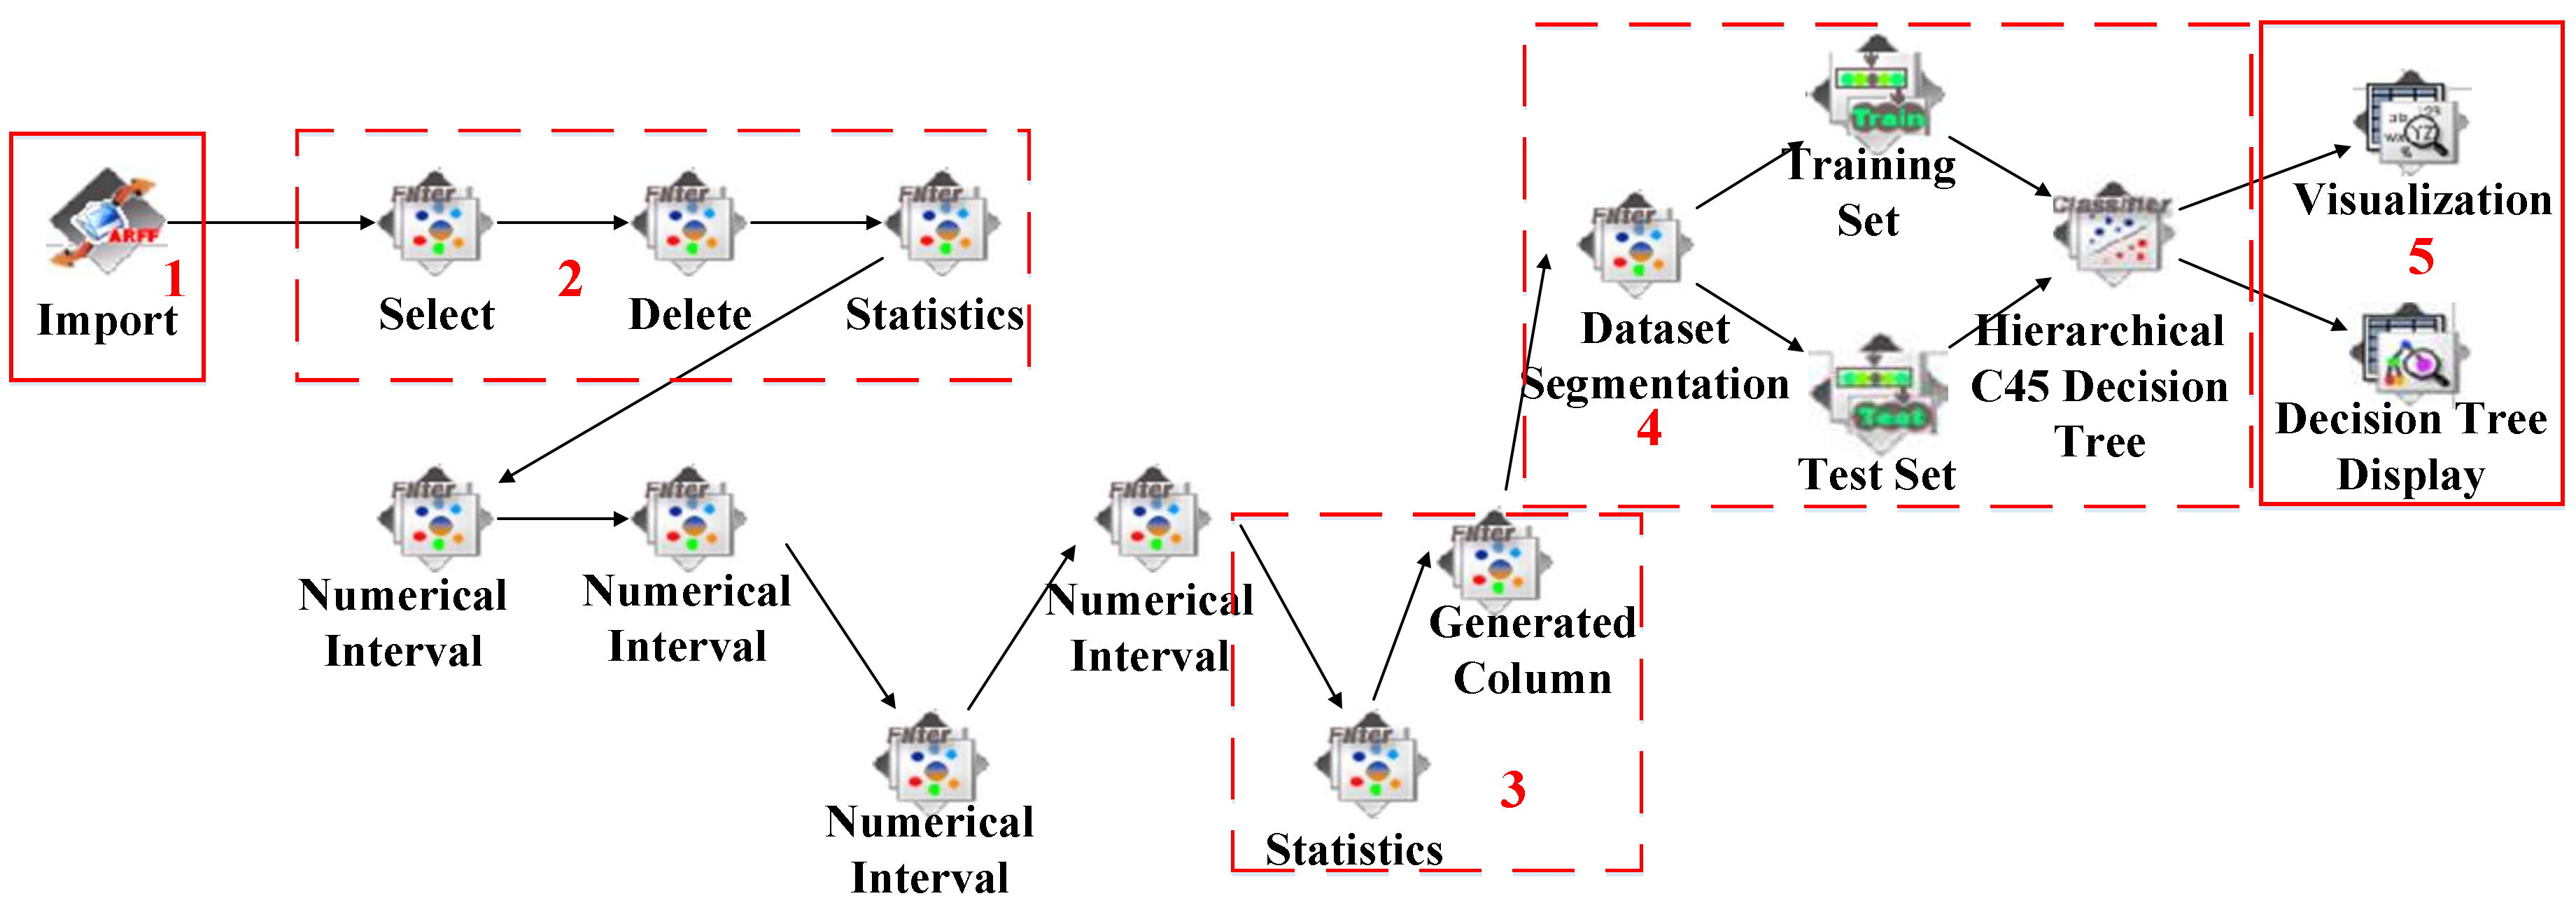
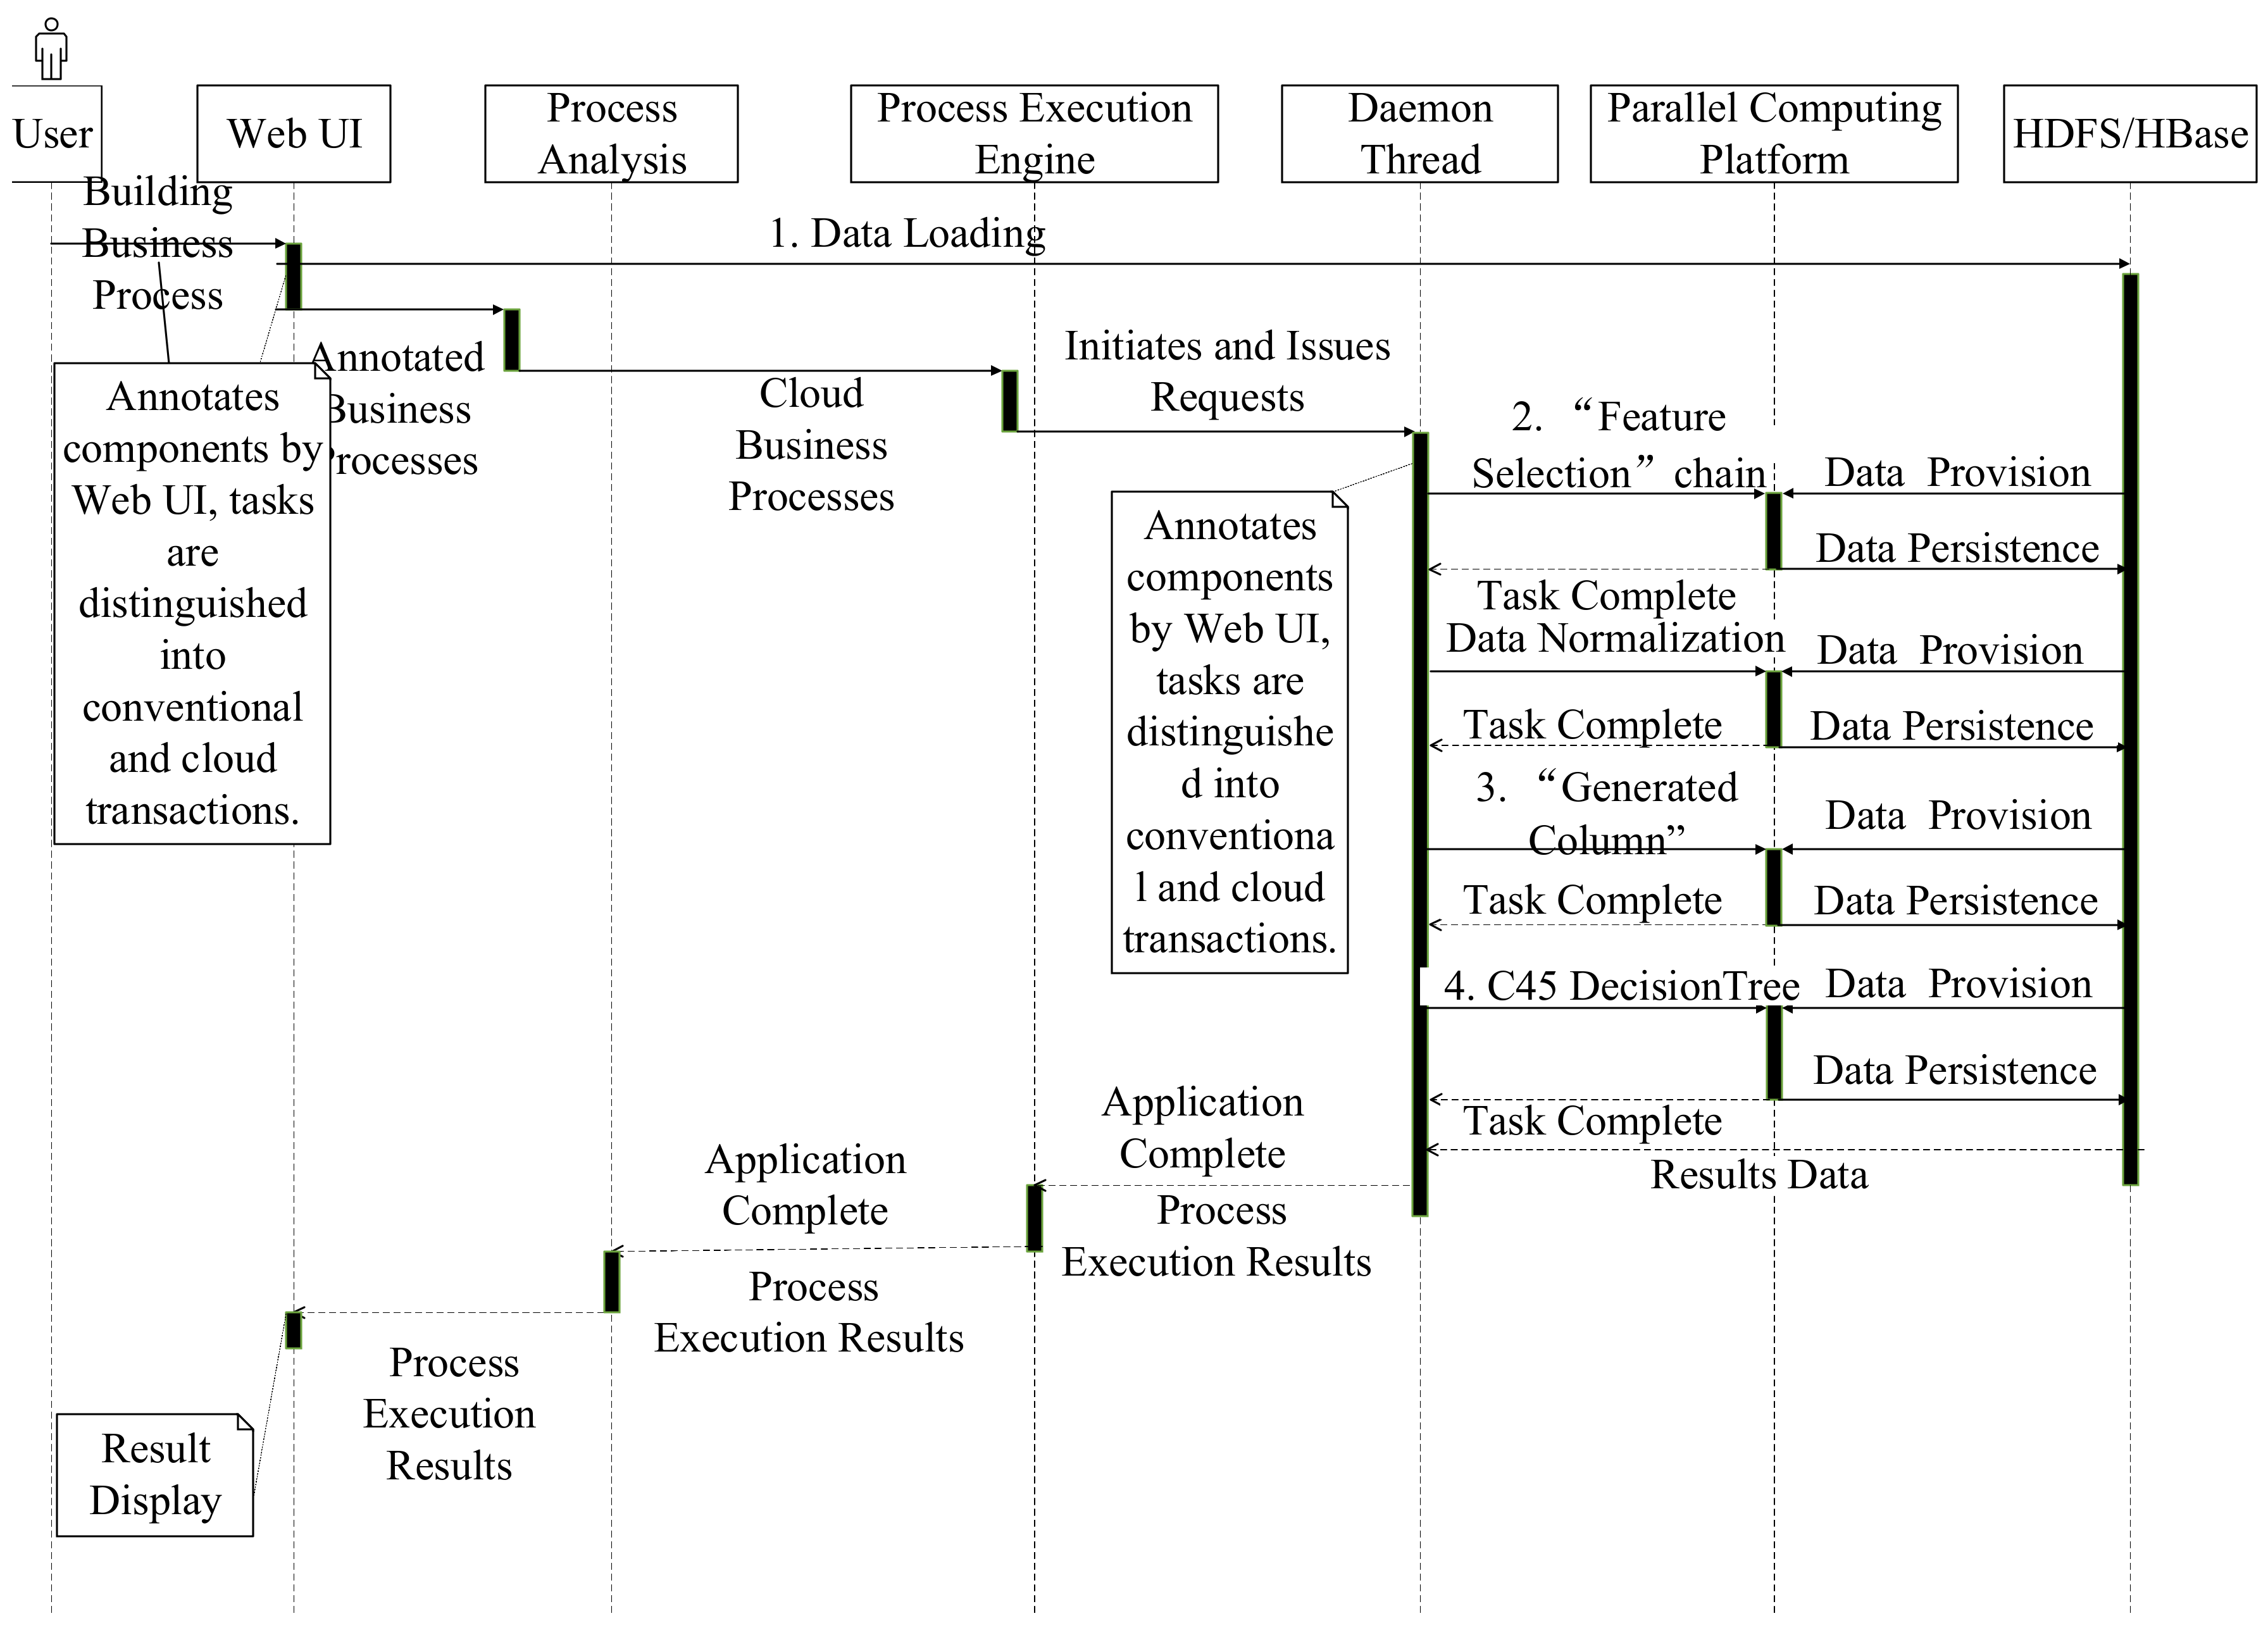
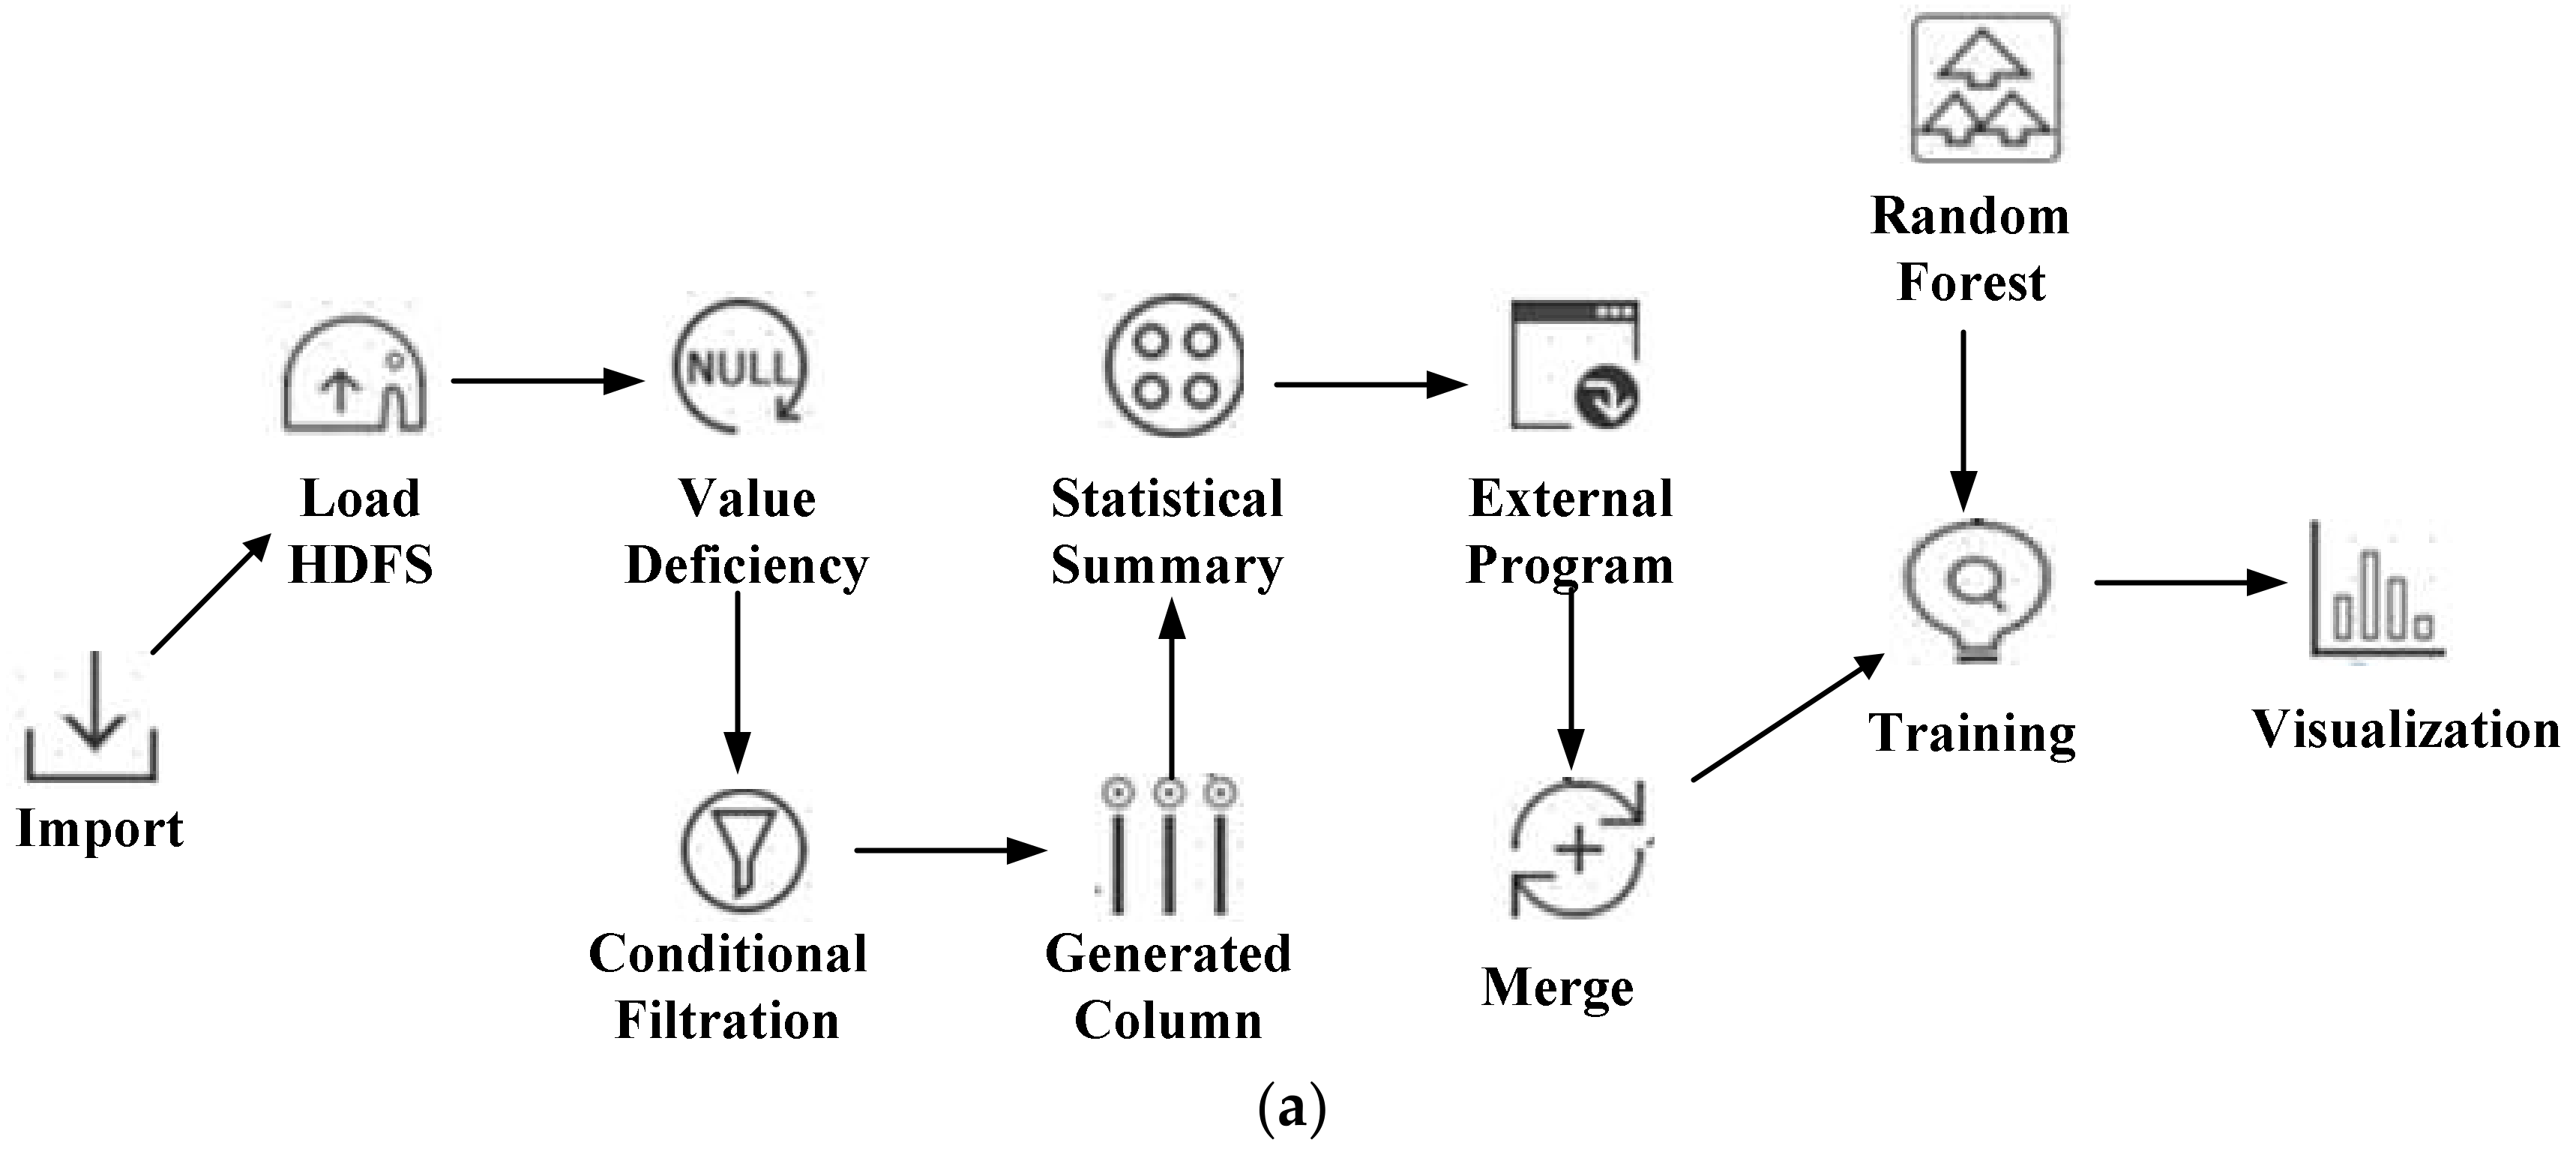
Workflow definition: CCP is used to discover a group of high loss probability and significance-value customers for prevention and control. The factors that cause the loss of customers are numerous; therefore, we select the decision tree mining algorithm for modeling. The core idea of CCP is to employ training data with prior knowledge to train the decision tree model. Using a decision tree to analyze test data can discover strong loss customers. (1) The “Input” component imports data; (2) sheltering and interval data features; (3) a new column is added for each customer as the classification label; (4) the decision tree model which employs hierarchical C45 decision tree is trained. The “Visualization” and “Decision Tree Display” components are used to display the result.
Workflow instance: The raw data were a total of 12 GB including 14.17 million records. We selected 18 features that cover the number and duration of local calls, long distance calls, roaming calls, and message information. The preprocessed data were a total of 315 MB including 785 records.
3.3. Phishing Site Discovery
Phishing websites steal users’ accounts and passwords by masquerading as bank or e-commerce websites. Phishing websites usually spread through e-mail, in which a disguised link connects the recipient to a phishing website. The page of the phishing website is almost exactly the same as the real web interface, which asks the visitor to provide an account and a password. In general, a phishing website structure is simple; it only has one or several pages, and the Uniform Resource Locator (URL) is slightly different from the real website. Once a user is tricked by the phishing website, it causes the disclosure of user information and actual property damage. Effective identification of phishing sites can avoid losses for users. Domain Name System (DNS) is a distributed database of domain names and Internet Protocol (IP) addresses mapped to each other, thereby enabling users to access the Internet conveniently. We can model the static and dynamic characteristics of DNS traffic through the big-data analysis of the DNS system’s traffic and logs, which can effectively identify phishing sites. DNS packet characteristics are extracted, including the length of DNS package, DNS responding time, sending frequency, domain name dispersion, IP dispersion, recursive path, and domain lifetime. An anomaly behavior model is constructed on the basis of the DNS packet characteristics to detect phishing domain names. DNS-based phishing website discovery is divided into two steps: offline model training and online real-time discovery.
Offline model training: Offline analysis employs the MapReduce computing framework. User behavior features (e.g., malicious fast flux duration, domain name and timestamp, and the survival time of DNS response) are extracted from large amounts of DNS requests and response information, and a phishing website classification model is established on the basis of the marked training set (as shown in Figure 16). This model is effective against phishing website variants that can serve for phishing websites discovery, warning, handling, and sharing.
Real-time discovery: The phishing website discovery model is implemented in the DNS server. The model can detect and filter users’ network access information in real-time on the basis of the streaming computing framework Storm, which would not generate extra impacts on users. Users’ real-time HTTP (Hypertext Transfer Protocol) and DNS requests information is integrated into the phishing website discovery model. The model can detect whether the request is a phishing website in a short period of time. Figure 17 shows the workflow in the ChainWF model. The detailed discovery process is illustrated in Figure 18.
3.4. Network Security Situation Analysis
Network security situation analysis uses big data analysis and data mining technology to analyze security logs and network traffic information to guarantee network security situations. For network operators, network businesses are subject to several security threats, such as zombie Trojan-worm attacks, malicious URLs, distributed denial-of-service (DDoS) attacks, and abnormal bot behavior. Discovering these malicious attacks and monitoring the real-time network flow to intercept the malicious attacks can greatly improve the quality of network services to avoid the malicious attack invasion. Network security situation analysis mainly includes two tasks: malicious attack behavior analysis and network traffic real-time analysis.
Malicious attack behavior analysis: The core ideas of big data analysis on security logs and network traffic are to integrate multiple data for correlation analysis and discover rule sets of malicious behavior. The security logs mainly include web, intrusion detection system (IDS) equipment web attack, international Data Corporation (IDC), server, database, network management, DNS, and firewall logs. Rule correlation analysis, attack behavior discovery, scenario correlation analysis, and historical traceability methods are used to analyze web attacks, SQL (Structured Query Language) injection, sensitive information leak, data pack download transmission, cross-site scripting (XSS) attacks, and password-cracking attack applications. Batch analysis of network traffic data and logs using parallel MapReduce includes four parts: NetFlow collection, dependent graph construction, PageRank algorithm application, and cluster model (DBSCAN) establishment. The detailed analysis process is shown in Figure 19. The analysis can build analysis models and discover the malicious attack behaviors. Table 1 demonstrates part of the behavior features of web attacks. In our experiments, we employed actual operational data, including 720 million records, approximately 77 GB, and continuous 23 h. The experimental data generated a dependent graph including 16 billion nodes and 57 billion links.
Network traffic real-time analysis: Deploying bypass network flow monitoring at the Internet exit and using Hadoop for storage and Storm for streaming analysis, the detecting model—trained in the batch analysis step—can detect the security threats and risks in the network flow deeply. The network traffic analysis mainly includes collecting NetFlow data, router configuration data, zombie Trojan-worm attacks, and malicious URL attack events; as well as employing dimensional analysis, behavior pattern analysis, fingerprint analysis, outlier detection, and protocol revert methods to mine the malicious behavior model and rules. The model could carry out web vulnerability discovery and detection of command-and-control attacks, suspicious scanning, malicious bot behavior, advanced persistent threat (APT) attacks, and DDoS attacks on network traffic and intercept the suspected actions.
4. Experiments
This section provides experiments on the proposed workflow system. We employed 12 servers with the same configuration (Huawei RH2285 2U server, Intel Xeon CPU E5530 @ 2.40GHz 2 Dual 4-core 16 GB memory 4 TB hard drive) to construct test clusters deployed on the same network. The detailed configurations of clusters are presented in Table 2.
4.1. Efficiency of ChainWF Mechanism
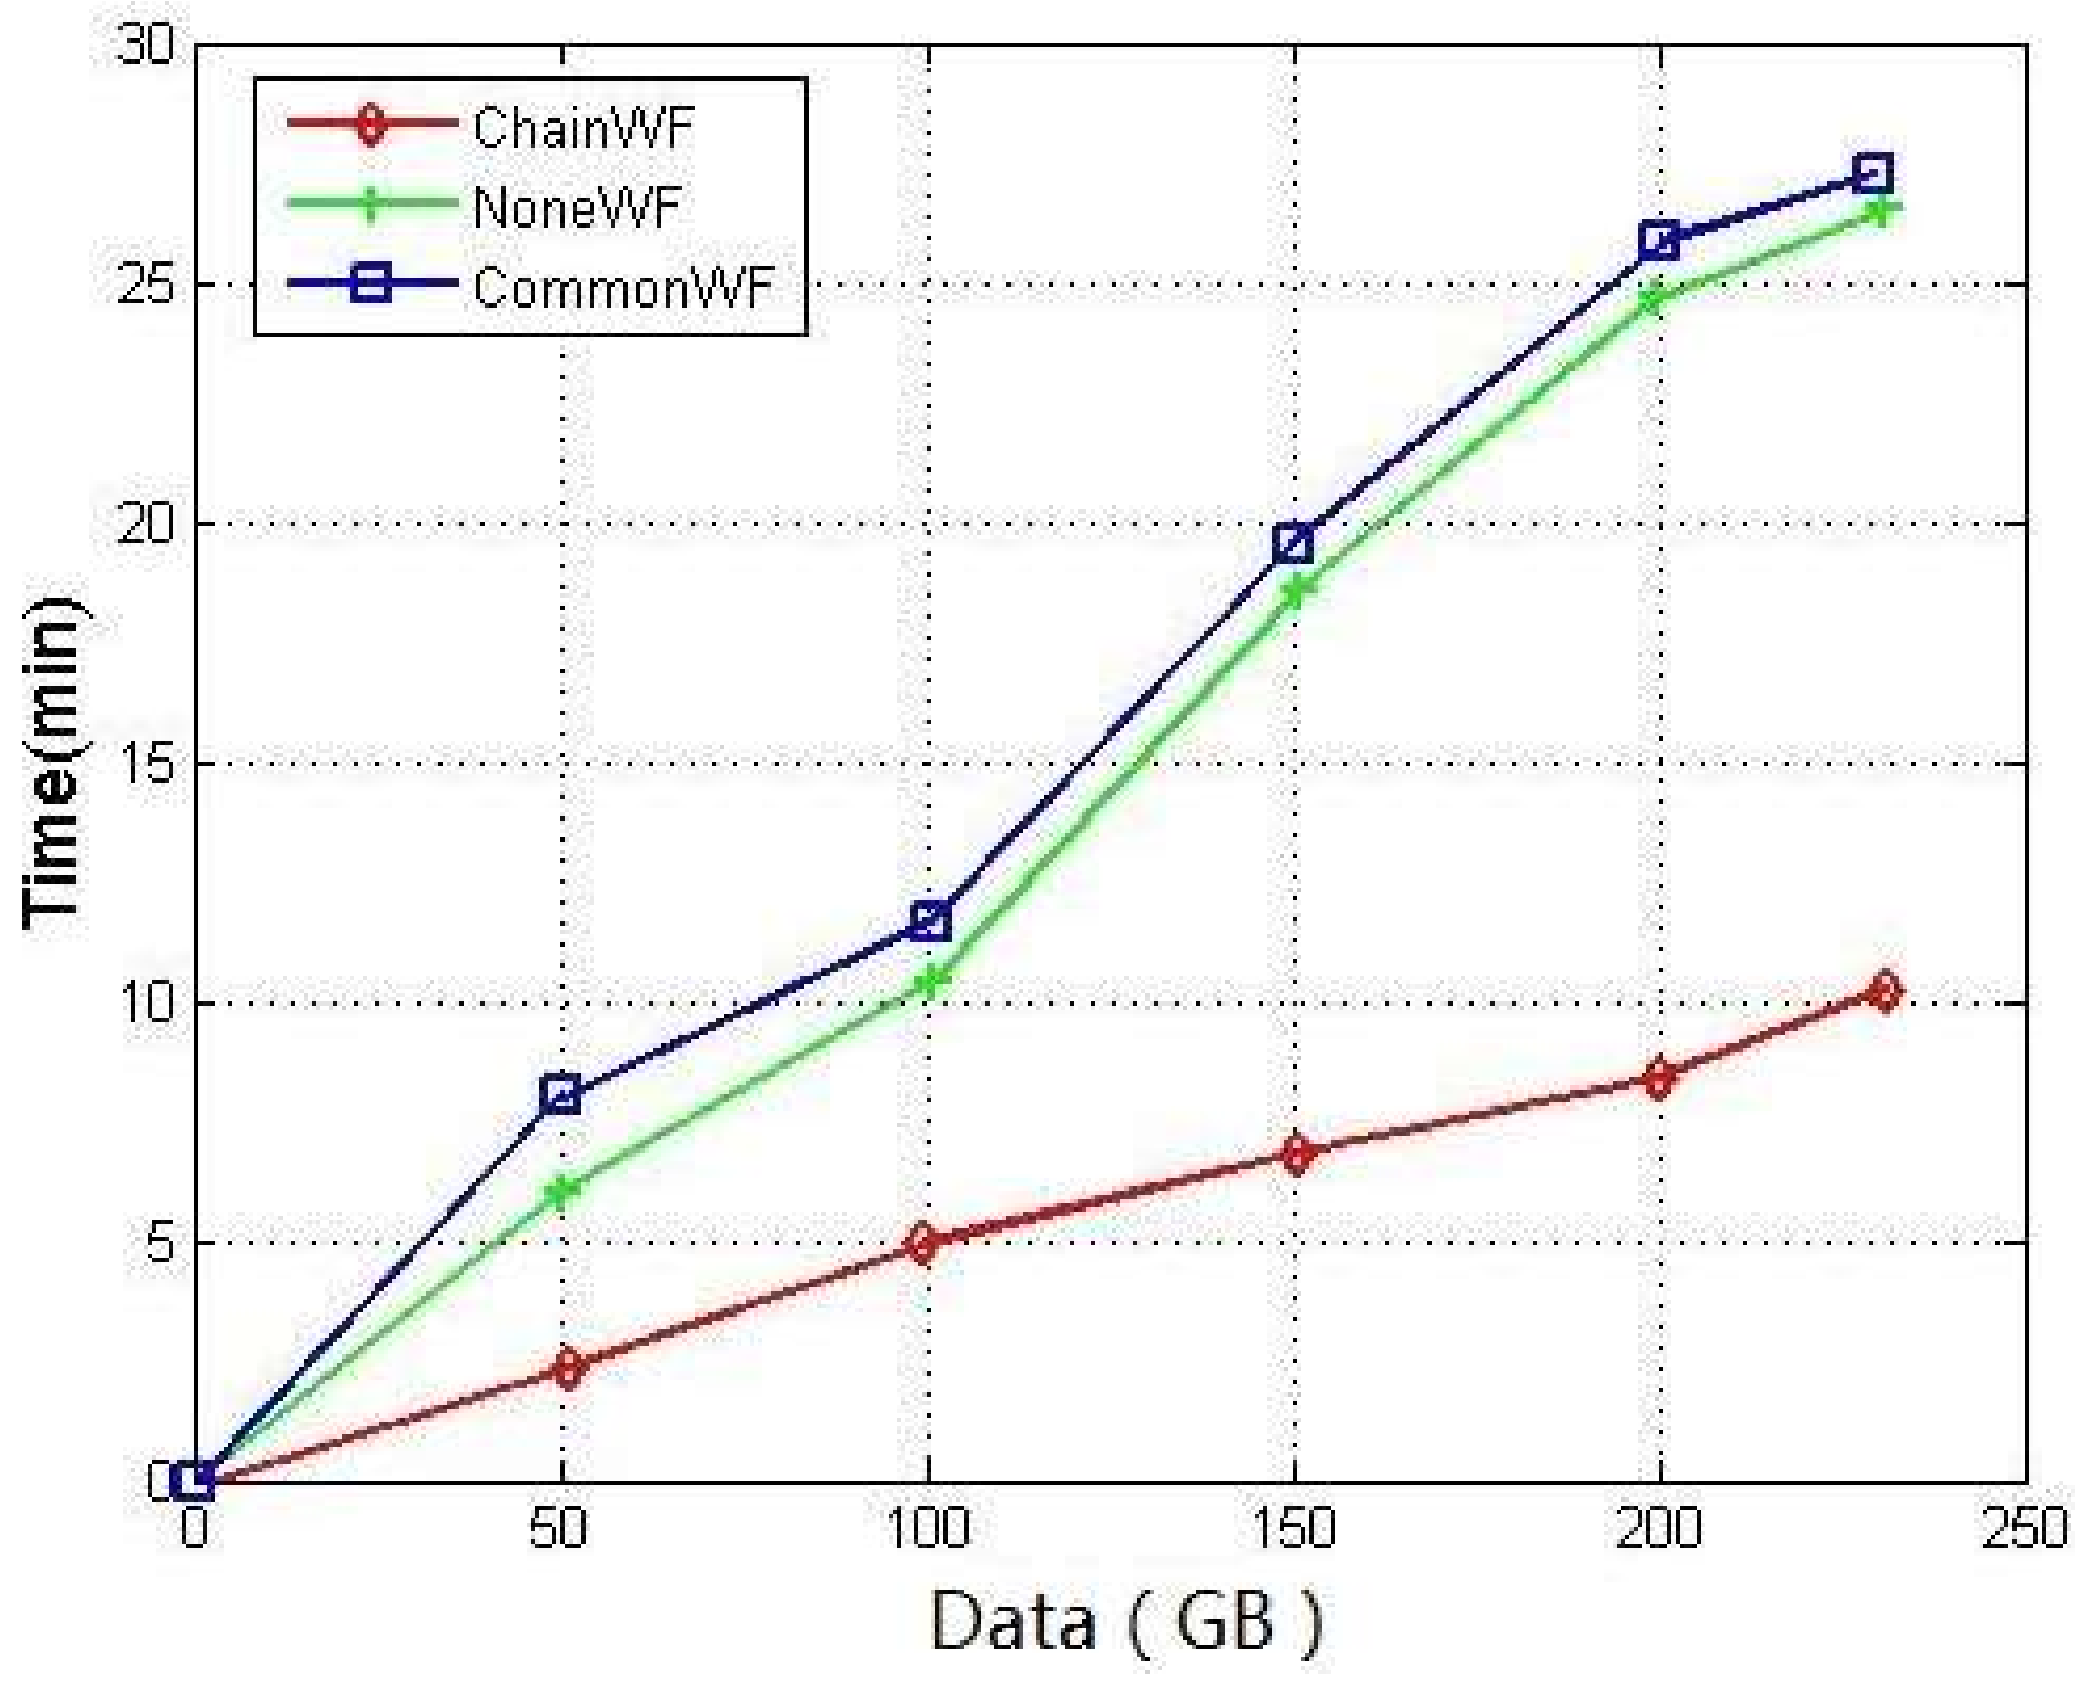
The data analysis workflow shown in Figure 20 is taken as an example. We evaluated the performance of the proposed cloud-based workflow system by comparing three different execution forms: without workflow system and executing tasks manually (NoneWF), common workflow (CommonWF), and chain workflow (ChainWF).
The example workflow is a Groupby operation which includes a normal business (“Input” component) and two cloud businesses (“Column generation” and “Groupby” component). For ChainWF, the “Generated Column” and “Groupby” components are combined as a chain component in which analyzed data would not be written into hard drive and stored in the memory until they are completed. The analysis results would be stored into the specified location of HDFS or HBase according to users’ configuration. The test data were actual Wireless Application Protocol (WAP) log data including 43 files (phone numbers, time, and WAP websites). The test results are shown in Figure 21. The horizontal axis presents the test data scale ranging from 50 GB to 230 GB, and the vertical axis is the run time.
The experimental results show that the required run times of NoneWF and CommonWF were almost the same and higher than that of ChainWF. The results illustrate that integrating a workflow system into cloud-based data analysis systems could not impact the performance of the data analysis system. The workflow system makes it easy for users to use data analysis algorithms. The experiments show that the ChainWF improved the performance greatly compared with the CommonWF. ChainWF combines several components into a combination component which can avoid writing the output data of each component into the hard disk and utilizes the efficient computing capability of the cloud platform.
4.2. Concurrency
Multi-user concurrent operation is a significant feature of a cloud-based big data intelligent analysis system. Table 3 shows the response time of several users accessing the system at the same time. The experimental results demonstrate that when 5000 users logged in to the system at the same time, the system average response time was 4.69 s. This feature can meet the needs of multi-user high concurrency.
4.3. Performance of Offline Batch Analysis Model
Cloud-based big data intelligent analysis needs to deal with massive data that requires high capacity. Social network analysis is taken as an example. We evaluated the performance of an offline batch analysis framework (as shown in Table 4). Social network analysis mainly solves the network structure data problems, such as discovering tight communities from user communication networks. The analysis includes in/out degree, single-source shortest path, closeness, clustering coefficient, and so on. In this experiment, we set the number of Map and Reduce as 60. The complexities of data replacement, in/out degree, average, maximum, edge/node statistics, single-source shortest path, and closeness were linear. The performances of clustering coefficient and community discovery analysis were easily influenced by the input data. Large local density subgraphs in the input data may lead to unbalanced calculation, which would cost considerable time in task completion. The complexity of the sparse graph was approximately linear.
4.4. Performance of Online Real-Time Analysis Model
Online real-time analysis can perform continuous calculation and logical analysis that can respond dynamically to events and data changes. Fine-grained logical analysis, personalized service, and fine operation and maintenance are supported. Two metrics—throughput and latency—can be used to measure the performance of online real-time analysis. Excellent online real-time analysis systems should exhibit high real-time performance and low response delay. In this experiment, we used the data analysis workflow shown in Figure 22 as the test workflow to evaluate the performance of real-time analysis. The test workflow involved I/O data, statistical analysis, aggregation operations, and multi-table joins. The data were progressively entered into the system and the entire test data increased to more than one million.
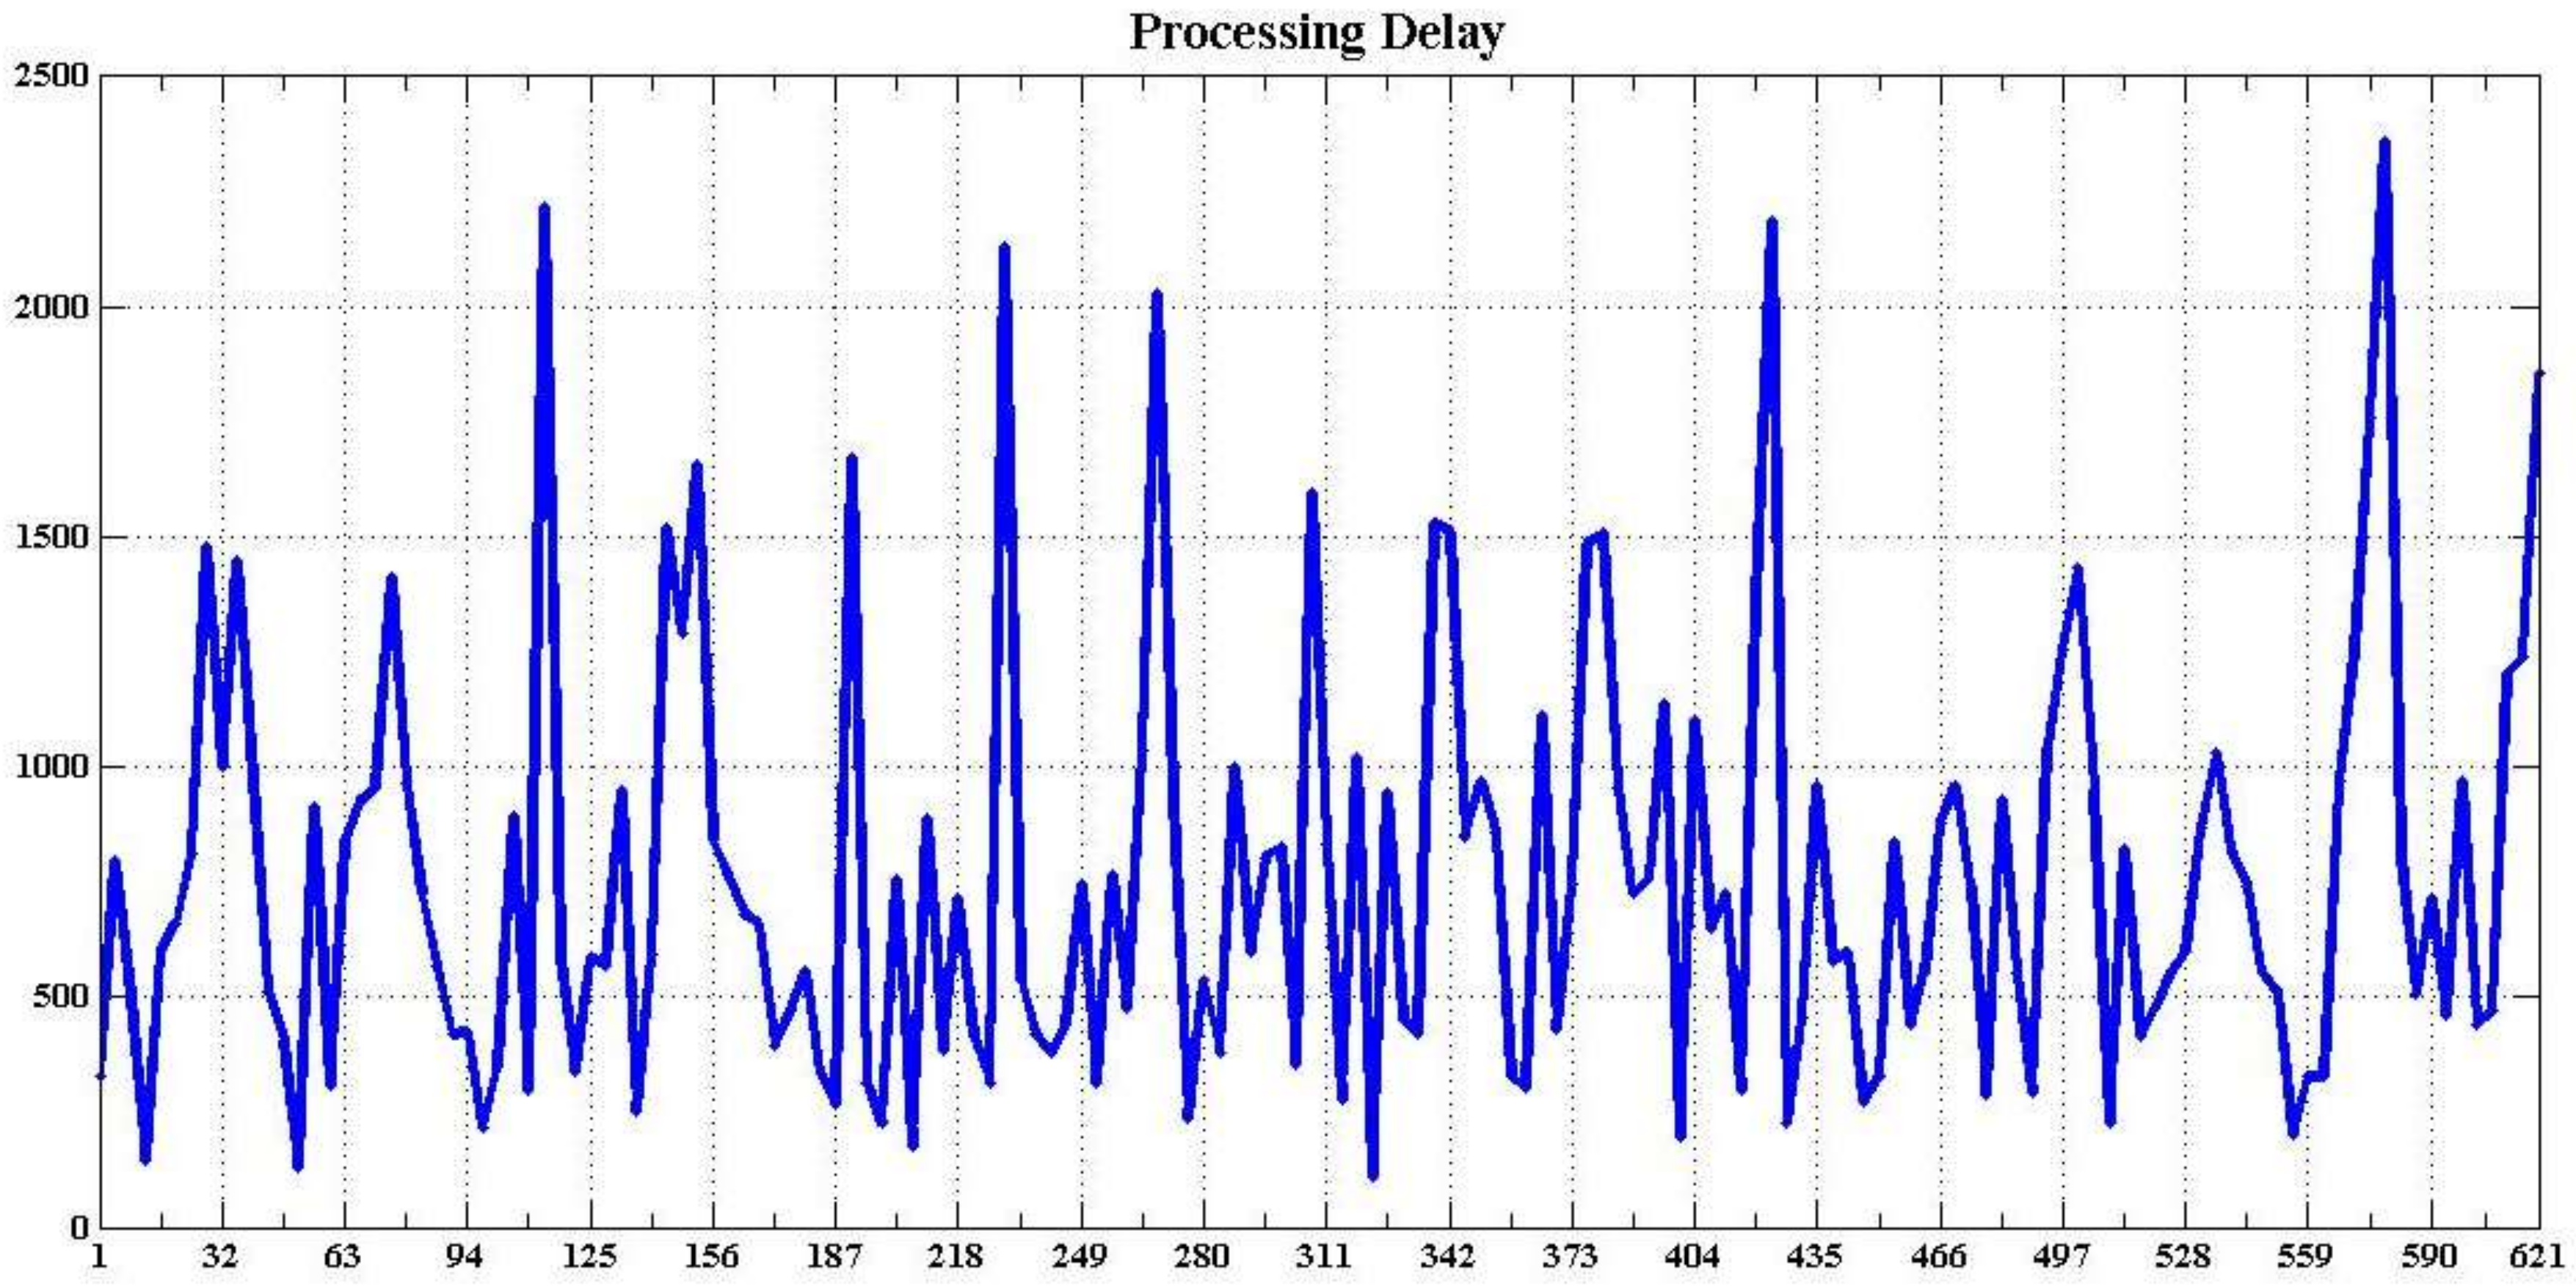
Figure 23 shows the throughput analysis of the system. The system throughput changed smoothly over time and the average throughput was approximately 34,702 records/s. This result can meet the needs of real-time analysis. The latency of data analysis was mostly in milliseconds (as shown in Figure 24). A few large delays (several hundred milliseconds) were observed because task scheduling caused the data middleware to have numerous resources at a time to send considerable data to the spout module. The platform could process the data at any time; therefore, the spout module would not accumulate much data because data sent by the middleware can be processed in time.
5. Conclusions and Further Works
In this study, we proposed a RESTful-based lightweight cloud workflow system. The system integrates distributed big data intelligent analysis algorithms, provides users with a UI to configure workflow, and supports workflow parsing, execution, storage, scheduling, and other functions. An integration method for batch offline and online real-time analyses was proposed to execute distributed data analysis algorithms flexibly to deal with online streaming data analysis, which could improve the robustness and flexibility of the system. We also introduced the ChainWF mechanism to combine multiple tasks into a ChainJob and execute them together, thereby improving the performance of workflow execution.
We introduced four typical big data analysis cases—service recommendation, customer churn prediction, phishing site discovery, and network security situation analysis—to demonstrate the details of cloud workflow in terms of workflow parsing, execution, and communication with the cloud platform. We employed Lambda architecture to integrate the two analysis models into the same cluster to deal with batch and streaming computing tasks. Experiments compared the efficiency of different workflow mechanisms and the concurrency of the system. The results showed that the proposed system could support multiple users in accessing the system concurrently, and effectively used the data analysis algorithms. The performances of the batch and real-time analysis models were also tested. The system was found to effectively deal with batch and real-time analyses.
In future works, we will improve the research of big data stream computing architecture and the key technology. With the detailed application requirements, we will develop, implement, test, and optimize a big data streaming computing workflow system that faces special domain. This system will promote the workflow system in the application of big data analysis.
Author Contributions
Bin Zhang and Le Yu conceived and designed the experiments; Le Yu and Shuai Zhao performed the experiments; Le Yu and Yunbo Feng analyzed the data; Yunbo Feng and Lijun Liu contributed analysis tools; Bin Zhang, Le Yu, Yunbo Feng, and Lijun Liu wrote the paper.
Conflicts of Interest
The authors declare no conflict of interest.
References
- Data Process System. Available online: https://en.wikipedia.org/wiki/Data_processing_system (accessed on 16 February 2018).
- Cloud Computing. Cloud Computing [EB/OL]. Available online: http://en.wikipedia.org/wiki/Cloud_computing (accessed on 16 February 2018).
- Li, B.; Zhang, L.; Ren, L.; Chai, X.; Tao, F.; Wang, Y.; Yin, C.; Huang, P.; Zhao, X.; Zhou, Z. Typical characteristics, technologies and applications of manufacturing. Comput. Integr. Manuf. Syst. 2012, 18, 1345–1356, (In Chinese with English Abstract). [Google Scholar]
- Li, B.D.; Mazur, E.; Diao, Y.L. SCALLA: A platform for scalable one-pass analytics using MapReduce. ACM Trans. Database Syst. 2012, 37, 1–43. [Google Scholar] [CrossRef]
- Morales, G.D.F. SAMOA: A platform for mining big data streams. In Proceedings of the 22nd International Conference on World Wide Web, Rio de Janeiro, Brazil, 13–17 May 2013; ACM Press: New York, NY, USA, 2013; pp. 777–778. [Google Scholar]
- Lim, L.; Misra, A.; Mo, T.L. Adaptive data acquisition strategies for energy-efficient, smartphone-based, continuous processing of sensor streams. Distrib. Parallel Databases 2013, 31, 321–351. [Google Scholar] [CrossRef]
- White, T. Hadoop: The Definitive Guide; O’Reilly Media: Sebastopol, CA, USA, 2012. [Google Scholar]
- Yu, L.; Zheng, J.; Wu, B.; Shen, W.C.; Wang, B.; Qian, L.; Zhang, B.R. BC-PDM: Data mining, social network analysis and text mining system based on cloud computing. In Proceedings of the 18th ACM SIGKDD International Conference on Knowledge Discovery and Data Mining, Beijing, China, 12–16 August 2012; pp. 1496–1499. [Google Scholar]
- Lam, C. Hadoop in Action; Manning Publications Co.: Shelter Island, NY, USA, 2010; pp. 265–270. [Google Scholar]
- Duipmans, E.; Pires, L.F. Business Process Management in the cloud: Business Process as a Service (BPaaS); University of Twente: Enschede, The Netherlands, 2012. [Google Scholar]
- Cordys. Google apps + BPM: Power to the business user [EB/OL]. March 2009. Available online: http://www.cordys.com/cordyscmscn_com/cn_google_apps.php (accessed on 16 February 2018).
- IBM. Online Collaboration: lotusLive [EB/OL]. August 2010. Available online: https://www.lotuslive.com/en/ (accessed on 16 February 2018).
- Marz, N.; Warren, J. Big Data: Principles and Best Practices of Scalable Realtime Data Systems; Manning Publications Co.: Shelter Island, NY, USA, 2015. [Google Scholar]
- JPDL. JPDL:[EB/OL]. Available online: http://docs.jboss.com/jbpm/v3/userguide/jpdl.html (accessed on 16 February 2018).
- Apache Storm [EB/OL]. Available online: http://storm.apache.org/ (accessed on 16 February 2018).
- O'Neill, B.; Goetz, P.T. Storm Blueprints: Patterns for Distributed Real-Time Computation; Packt Publishing: Birmingham, UK, 2014. [Google Scholar]
- Quartz. Quartz: Enterprise Job Scheduler [EB/OL]. Available online: http://quartz-scheduler.org/ (accessed on 16 February 2018).
- Yu, X.; Cao, J.; Gong, Z. Review on customer churn issue. Comput. Integr. Manuf. Syst. 2012, 18, 2253–2263. (In Chinese) [Google Scholar]
Figure 1.
Architecture of distributed data mining (DDM). HDFS: Hadoop Distributed File System; REST: representational state transfer; PMML: Predictive Model Markup Language.
Figure 1.
Architecture of distributed data mining (DDM). HDFS: Hadoop Distributed File System; REST: representational state transfer; PMML: Predictive Model Markup Language.

Figure 2.
System topology.

Figure 3.
Work procedure. ETL: extract transform load.

Figure 4.
Workflow parsing engine. DAG: directed acyclic graph; UI: user interface; XML: Extensible Markup Language.
Figure 4.
Workflow parsing engine. DAG: directed acyclic graph; UI: user interface; XML: Extensible Markup Language.

Figure 5.
Workflow operation tree.

Figure 6.
Batch workflow execution process.

Figure 7.
Batch workflow tasks executive process.

Figure 8.
ChainWF mechanism.

Figure 9.
Storm topology.

Figure 10.
Real-time workflow tasks executive process. YARN: Yet Another Resource Negotiator.

Figure 11.
Lambda architecture.

Figure 12.
Workflow scheduling.

Figure 13.
Service recommendation workflow: (a) customers cluster; (b) service recommendation for customers.
Figure 13.
Service recommendation workflow: (a) customers cluster; (b) service recommendation for customers.


Figure 14.
Customer churn prediction (CCP).

Figure 15.
Sequence Diagram of CCP.

Figure 16.
The process of phishing site discovery. DNS: Domain Name System; ISP: internet service provider; URL: Uniform Resource Locator; SVM: Support Vector Machine.
Figure 16.
The process of phishing site discovery. DNS: Domain Name System; ISP: internet service provider; URL: Uniform Resource Locator; SVM: Support Vector Machine.

Figure 17.
Online stream classification model: (a) Off-line batch model training; (b) Online real-time identification intercept.
Figure 17.
Online stream classification model: (a) Off-line batch model training; (b) Online real-time identification intercept.


Figure 18.
“Phishing website” analysis sequence diagram.

Figure 19.
Malicious attack behavior discovery.

Figure 20.
Data analysis workflow.

Figure 21.
The performance of different execution forms.

Figure 22.
Online real-time test workflow.

Figure 23.
Throughput analysis of the system.

Figure 24.
The latency of data analysis.


Table 1.
Web attacks behavior features.
| Web Attacks | Features |
|---|---|
| URL Guess | eWebEditor, Fckeditor, editorAdmin, Manage, System, login |
| SQL Injection Attacks | %20AnD%201=1 %20AnD%201=2 |
| SQL Injection Worm | DeClArE%20@, eXeC(@, vArChAr(, /**/@ |
| Webshell Logs | Action=filesystem, fsAction=, @eval, mkdir, systeminfo, netstat, caidao |
| Struts2/Xwork Remote Execution | allowStaticMethodAccess, xwork, u0023, execute, PUT, wget, ps%20- |
Table 2.
Cluster configuration information.
| Node Name | IP | Roles |
|---|---|---|
| Node1 | 192.168.32.112 | Namenode, RescourceManager, Nimbus, ZooKeeper |
| Node2 | 192.168.32.113 | Datanode, supervisor |
| Node3 | 192.168.32.114 | Datanode, supervisor |
| Node4 | 192.168.32.115 | Datanode, supervisor |
| Node5 | 192.168.32.116 | Datanode, supervisor |
| Node6 | 192.168.32.117 | Datanode, supervisor |
| Node7 | 192.168.32.118 | Datanode, supervisor, zookeeper |
| Node8 | 192.168.32.119 | Datanode, supervisor |
| Node9 | 192.168.32.120 | Datanode, supervisor |
| Node10 | 192.168.32.121 | Datanode, supervisor |
| Node11 | 192.168.32.122 | Datanode, supervisor |
| Node12 | 192.168.32.123 | Datanode, supervisor |
Table 3.
Response time.
| The Number of Users | Average Response Time (s) |
|---|---|
| 100 | 3.23 |
| 500 | 3.54 |
| 1000 | 4.38 |
| 5000 | 4.69 |
Table 4.
The performance of social network analysis workflow.
| Dataset (million) | Workflow Executive Time (Sec) | |||||||||
|---|---|---|---|---|---|---|---|---|---|---|
| Data Replace | In/Out Degree | Average | Maximum | Edges/Nodes Statistics | Clustering Coefficient | Community Discovery | Diameters | Single-Source Shortest Path | Closeness | |
| 50 | 420 | 88 | 76 | 77 | 125 | 300 | 1800 | 1983 | 641 | 34 |
| 100 | 426 | 76 | 79 | 79 | 155 | 356 | 3720 | 2278 | 651 | 33 |
| 200 | 423 | 78 | 81 | 79 | 155 | 605 | 4512 | 2312 | 656 | 36 |
| 300 | 440 | 108 | 82 | 78 | 158 | 805 | 5452 | 2498 | 679 | 39 |
| 400 | 463 | 105 | 79 | 77 | 158 | 602 | 5433 | 2693 | 687 | 40 |
| 500 | 513 | 113 | 80 | 79 | 162 | 741 | 6238 | 2944 | 705 | 60 |
| 600 | 537 | 113 | 82 | 79 | 163 | 817 | 5831 | 2933 | 711 | 65 |
| 800 | 662 | 119 | 84 | 79 | 164 | 1431 | 5044 | 3236 | 732 | 70 |
| 1000 | 750 | 121 | 85 | 80 | 169 | 1406 | 5554 | 4337 | 765 | 84 |
© 2018 by the authors. Licensee MDPI, Basel, Switzerland. This article is an open access article distributed under the terms and conditions of the Creative Commons Attribution (CC BY) license (http://creativecommons.org/licenses/by/4.0/).
Share and Cite
MDPI and ACS Style
Zhang, B.; Yu, L.; Feng, Y.; Liu, L.; Zhao, S. Application of Workflow Technology for Big Data Analysis Service. Appl. Sci. 2018, 8, 591. https://doi.org/10.3390/app8040591
AMA Style
Zhang B, Yu L, Feng Y, Liu L, Zhao S. Application of Workflow Technology for Big Data Analysis Service. Applied Sciences. 2018; 8(4):591. https://doi.org/10.3390/app8040591
Chicago/Turabian StyleZhang, Bin, Le Yu, Yunbo Feng, Lijun Liu, and Shuai Zhao. 2018. "Application of Workflow Technology for Big Data Analysis Service" Applied Sciences 8, no. 4: 591. https://doi.org/10.3390/app8040591
Note that from the first issue of 2016, this journal uses article numbers instead of page numbers. See further details here.