Displays Based on Dynamic Phase-Only Holography


Envisics Ltd., Milton Keynes MK5 8PG, UK
*
Author to whom correspondence should be addressed.
Appl. Sci. 2018, 8(5), 685; https://doi.org/10.3390/app8050685
Submission received: 15 March 2018
/
Revised: 16 April 2018
/
Accepted: 24 April 2018
/
Published: 27 April 2018
(This article belongs to the Special Issue Liquid Crystal on Silicon Devices: Modeling and Advanced Spatial Light Modulation Applications)
Abstract
:Static holographic displays of high quality are works of art. We are creating commercial displays using dynamic phase-only spatial light modulators (SLMs). The main advantages of this approach are light efficiency and fault tolerance. When polarized lasers are used as the illumination source, there is no requirement for polarizers in the light engine. Moreover, the illumination beam can be directed towards bright points of the image and away from dark regions. Due to the many-to-one correspondence between the pixels in the SLM and the points in the image, faults in high complexity SLMs will be annealed in the image. Compared with normal displays where etendue is of overriding importance for light efficiency, holographic displays favor small pixel devices. Smaller pixel devices generate a larger reconstruction which improves the etendue for a second stage imaging system.
1. Introduction
Holographic displays are one of the strong contenders for realizing true 3D displays. The first display holograms were based on off-axis holograms recorded on a photographic plate [1]. In order to develop dynamic displays, computer-generated holograms (CGHs) are written on to a spatial light modulator (SLM). The current complexity of SLMs limits the size of the CGH. However, prototypes have been developed using SeeReal [2], Microsoft Research [3], Light Blue Optics [4], and the European Real3D project [5]. This work has focused on the reconstruction of 2D scenes and has grown from student work [6] to commercialization within 10 years.
2. Fourier and Fresnel Holography
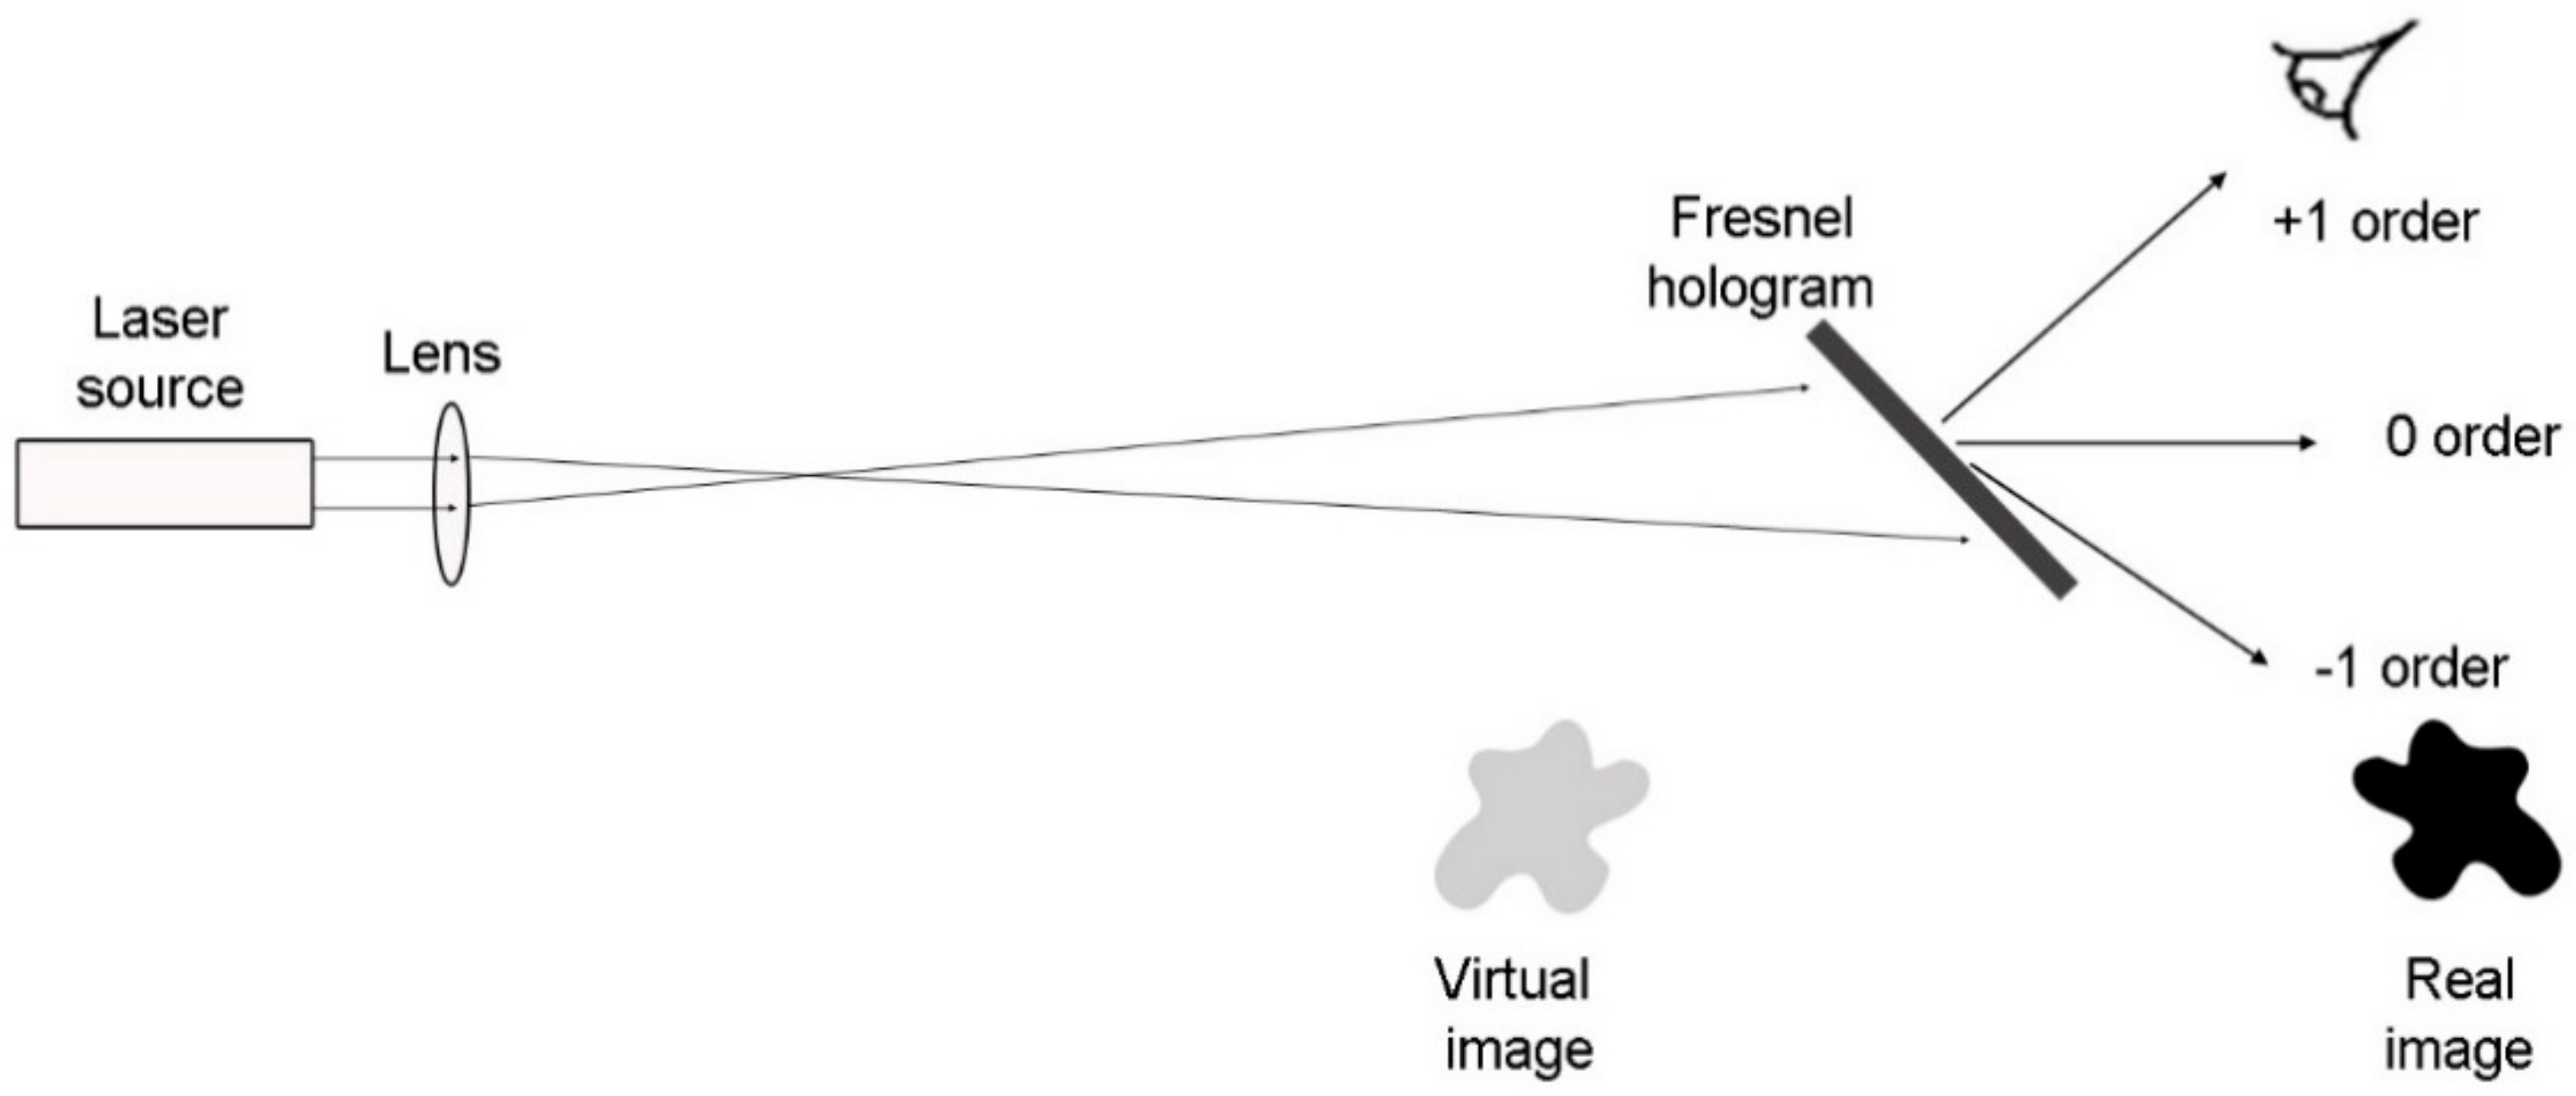
The first display holograms were off-axis Fresnel holograms, which captured interference between an object wave and a plane wave reference beam. Since the hologram is the viewing window, there was an interest in using holographic recording media of a large size (see Figure 1) [7].
The 0 order beam in Figure 1 has the same size as the illumination beam. Therefore, a high resolution holographic recording was important so that the angular separation of the orders was sufficient. Unfortunately, SLMs are not available with the same size and resolution as the photographic plates used in Reference [1].
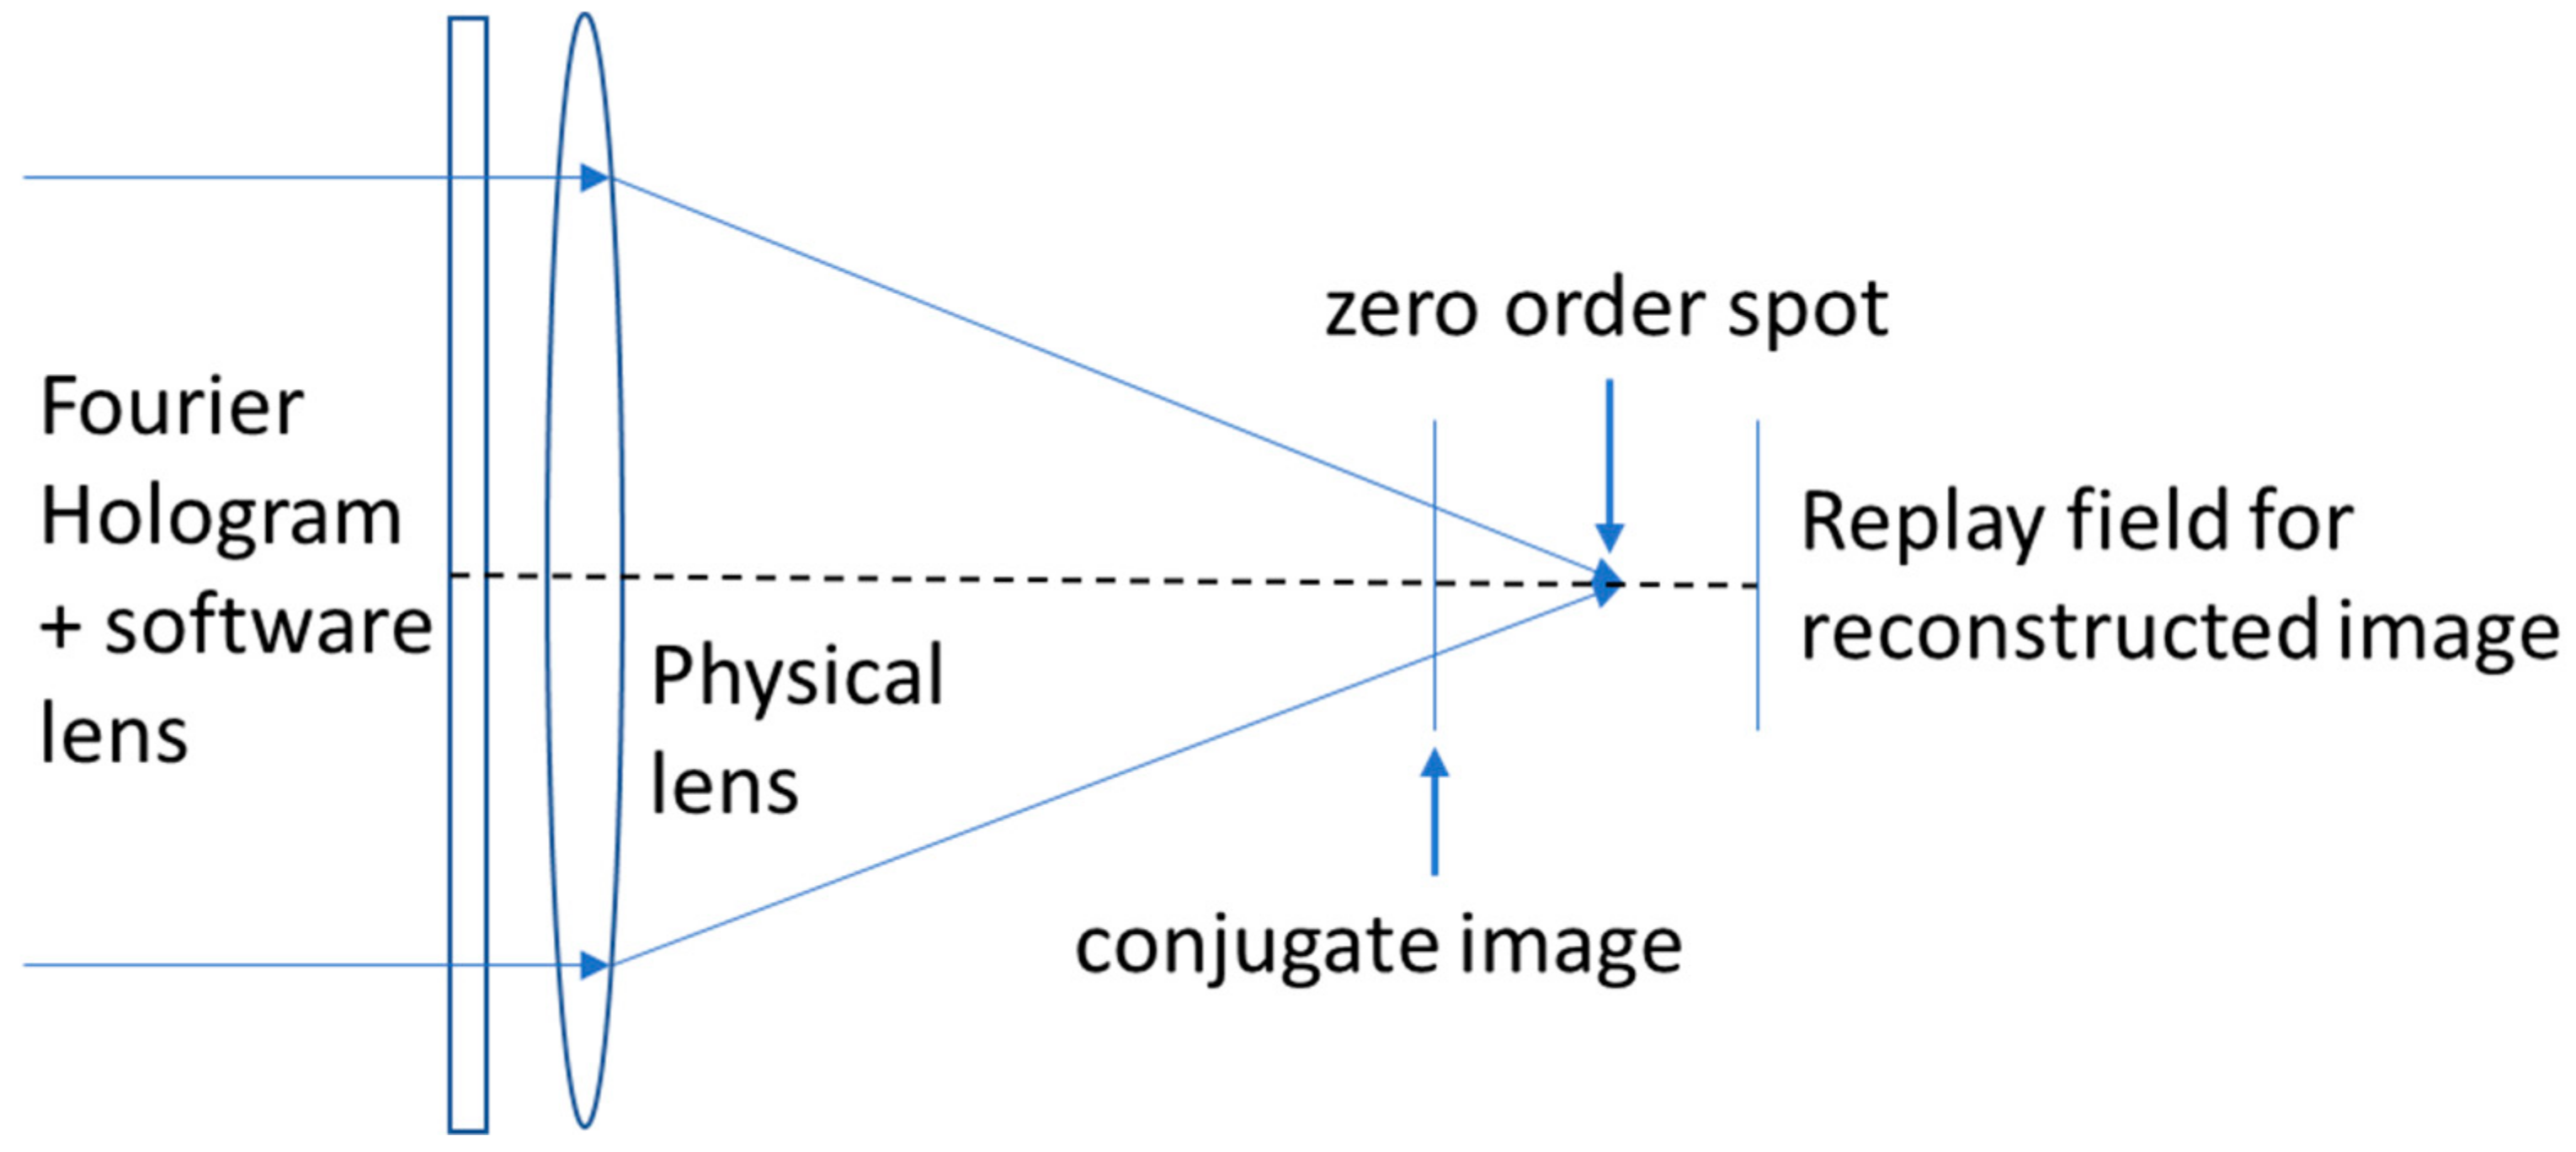
In order to capitalize on the limited SBWP available from the SLM, a Fourier arrangement is used for the hologram replay. A Fourier hologram is the hologram that is recorded when the plane reference beam is focused on a spot at the same distance as the object. The beams interfering at the hologram plane will then have approximately equal radii of curvature. This reduces the interference fringing between the two beams, which demands a share of the SBWP. When illuminated by a plane wave, the Fourier hologram will reconstruct the object at infinity. If the Fourier hologram is reconstructed with a plane wave and a lens is placed in the reconstructed beam, the reconstruction is placed in the focal plane of the lens (see Figure 2).
The advantage of the Fourier arrangement is that the image size can be adjusted by varying the focal length of the physical lens. Unfortunately, increasing the image size reduces the field of view (FOV) [8] so that additional components are required to increase the field of view (see Section 5). The zero order, which is formed by all the light transmitted by the hologram that is not diffracted, is focused to a spot at the focal point of the lens. In addition, the many-to-one correspondence, which promotes the fault tolerance, is accentuated in the Fourier case compared with the Fresnel hologram.
In order to separate the reconstructed image from the conjugate image in the Fourier arrangement, a software lens is superimposed on the hologram [9]. The nature of the software lens depends on the modulation used in the hologram. For a binary amplitude modulation, the lens is a Fresnel zone plate. For a binary phase hologram, it is a phase zone plate and, for an analogue phase hologram, it is a phase Fresnel lens. In Figure 3, the positions of the reconstructed image and the conjugate image are shown for the case of a weak diverging software lens superimposed on the Fourier hologram. The reconstructed image is separated from both the zero order spot and the conjugate image. The zero order spot can be readily removed by spatial filtering. The size of the reconstructed image is proportional to the distance of the replay field from the hologram. The Fourier arrangement was used by Qinetiq in their Active Tiling 3D display system [8].
3. Spatial Light Modulators (SLMs)
The SLM is responsible for the shape of the wave front in the display system which, by free-space propagation, determines the resultant display. In order to achieve a fully complex wave front, which varies in amplitude and phase at each point on the wave front, it is currently necessary to cascade or superimpose two SLMs using beam splitters or a grating or combine two areas from a single SLM. The value of complex coding would be minimal computation and near perfect reconstruction. The sub-systems required for complex coding are currently being researched in a number of laboratories [2,10]. It has been possible to achieve initial holographic display systems at the full resolution of the SLM by using limited modulation devices in particular phase-only electrically addressed devices [11] and amplitude-only optically addressed [9] devices. The former are principally Liquid Crystal on Silicon (LCOS) SLMs and the latter are Liquid Crystal Light Valves (LCLVs) [12]. Due to the technical maturity of the LCOS SLMs, they are the focus of the present paper.
LCOS devices are composed of a liquid crystal layer above a semiconductor backplane. The front substrate is a cover glass coated with a transparent conductor to act as a common electrical conductor. The lower substrate is a CMOS backplane with an additional outer aluminum layer that is used to create a pixelated mirror surface. These mirrors also act as the pixel electrodes. The LCOS devices have the advantage that the signal lines, the gate lines, and the transistors are below the mirrored surface, which results in a high fill factor (typically greater than 90%). Relatively conservative 0.18 and 0.35 micron processes with 5 V drive capability and high yield are used by the LCOS fabrication houses. Additionally, the small feature sizes enabled by CMOS processing allow for very small pixel sizes. The maximum diffraction angle of the spatial light modulator is inversely proportional to the pixel pitch.
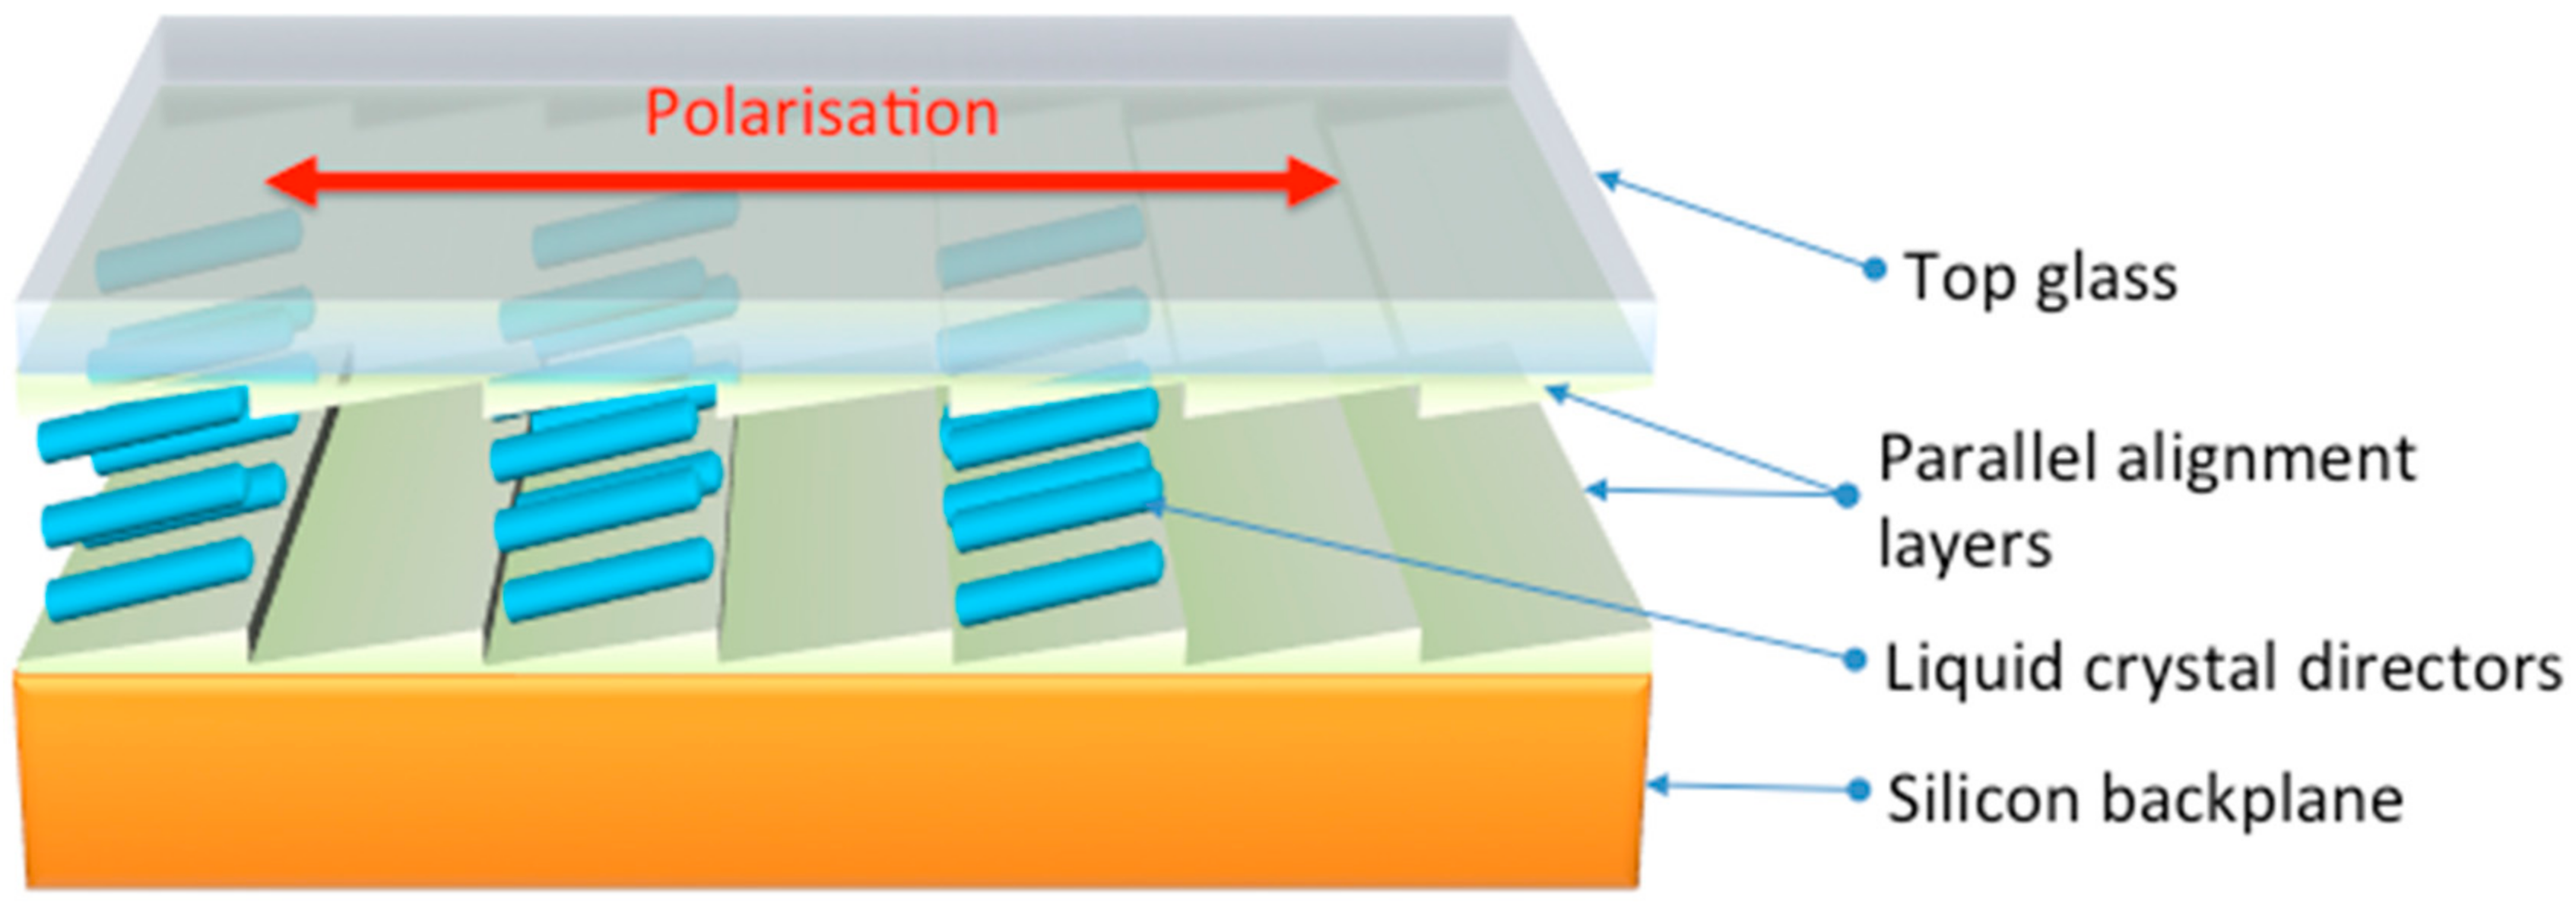
The perfect phase modulating spatial light modulator (PSLM) would ideally have characteristics similar to a holographic film including a continuous modulation surface (i.e., no pixels) and analogue phase modulation that is capable of greater than 2π phase delay in a large number of steps. Phase-only holograms have been created using liquid crystal TV screens [13]. They have been developed over the last decade so that there is now a reasonably sized supply [11]. All current multilevel phase-only modulating devices use ‘Electrically Controlled Birefringence’ (ECB), which is shown in Figure 4.
ECB was the first electro-optic effect to be observed in liquid crystals [14]. It is the birefringence reduction in a planar aligned nematic liquid crystal (NLC) layer upon application of an electric field. The birefringence reduction allows the phase modulation of the reflected beam to be reduced by 2π when the polarization of the incident light is parallel to the alignment direction. The birefringence reduction is due to a tilted director where the angle of tilt is determined by two competing torques including the elastic torque within the material that tries to align the director parallel to the alignment direction and a field-induced torque that tends to align the director parallel to the field. When both torques exist, there is a competition between them and the director aligns to minimize the total energy. At the edge of the pixel, the electric field has a component parallel to the cell substrate surfaces, which is known as the lateral field, the non-uniform field [15], or the inhomogeneous field [16]. It is now more commonly referred to as a fringing field. In addition, there is a reverse tilt declination over the driven pixel due to the conflict between the pre-tilt and the director rotation because of the vertical electric field.
There are two methods for matrix addressing the CMOS pixel array. The analogue address known as the Dynamic Random Access Memory (DRAM) is used for driving the nematic LC to a number of grey levels. The digital address known as Static Random Access Memory (SRAM) applies digital bit array sequences to the LCOS. In the SRAM device, analogue modulation depth is achieved by temporal multiplexing. If the response time of the LC is slow relative to the period of the sequence, then the LC gives an average response, which is the required analogue RMS value. For example, a thick LC layer will provide the required average and give higher phase modulation depth than 2π. However, additional problems arise in the effective resolution of the device and the frame speed.
Due to the growth of the pico-projector and near-eye markets, there has been a push towards high resolution LCOS micro-displays. Developing a phase-only spatial light modulator based upon these existing micro-display backplanes enables the incumbent liquid crystal assembly facilities to be used without significant upfront capital investment.
In small pixel LCOS devices, the NLC layer must be designed to minimize the fringing field. Otherwise, when high resolution patterns are used, the available phase retardation from a pixel falls short of what is intended. The effect on the performance of the device is that the resolution is severely reduced at high spatial frequencies. The design of the NLC layer to minimize the effect of the fringing field is considerably assisted by using a thin NLC layer [16].
The frame speed also benefits from a thin NLC layer. A doubling of the cell thickness causes a four times increase in the liquid crystal rise and fall times [17]. For phase only modulation, it is important to delay the illumination of the SLM until the director of the liquid crystal is stable. Therefore, a slower liquid crystal response time directly impacts the available illumination time and reduces the display brightness. The reduced liquid crystal response times may be achieved either by using high birefringence liquid crystals and, thereby, enabling the cell gap to be reduced or by operating the spatial light modulator at more than 45 °C, which lowers the viscosity. The latter option is not available when SRAM backplane devices are used because the reduced viscosity gives an enhanced phase ripple and consequent noise in the replay field.
In practice, all of these techniques are utilized at least partially to achieve an acceptable level of performance from the PSLM. The finished device is equipped with a ceramic backplane for low thermal resistance (see Figure 5). The limited space bandwidth product (SBWP) of current SLMs (1–10 megapixels) does not allow overly complex, off-axis holograms. Therefore, current implementations are restricted to 2D displays.
4. Algorithms
Computational holography makes high demands on computational resources. Therefore, a large effort has been deployed in fine-tuning the algorithms in order to minimize the computational burden. A large reduction of computational efforts has been achieved by incorporating into the design, the limited resolution of the human visual system (HVS), and the position of the viewer (defined eye box or eye tracking device). The extra computational resources can be deployed for a high contrast, low noise image, or a display, which must be updated at video rates or faster. The following discussion tracks the advances, which have been made in reducing the computational burden and then summarizes our efforts with the production of holograms for 2D display in consumer products.
The Active Tiling 3D display system of Qinetiq [9] employed a variant of the diffraction-specific (DS) algorithm [18]. The DS algorithm advanced computational holography by providing solutions in four problem areas including noise, speed, 3D object definition, and encoding. The noise problem was the appearance of the DC term in the hologram replay, which was solved by using an off-axis reference beam in Reference [1]. This solution places significant demands on the limited SBWP of SLMs and is currently not practical for dynamic holography. These DC terms are omitted in the DS algorithm. The speed of the computation was increased by a factor of over 100 by taking account of the limited resolution of the HVS. The object in Reference [1] existed in space while computer models exist as point-clouds or patch-models. Algorithms, which sum the contributions from the object elements (points or patches) in these computer models over the whole hologram, are computationally expensive. The DS algorithm improved the speed of computation by pre-computing the basis fringes for the diffraction of light in discrete directions so that the run-time computation is reduced to table look-up and multiplication by the desired replay field amplitudes. Crucially, amplitude modulated fringes allow a linear superposition while if the basis fringes were phase coded, then linear superposition is only valid for small phase modulation depth (Appendix B in ref. [18]). Amplitude modulation of the 3D holographic display has been preferred to this day [19].
The wave front-recording plane (WRP) method [19] is based on adding the contributions from the object elements over small areas on a plane close to the object. A look-up table can be adopted for increased speed in the first step. The Fresnel diffraction from the WRP to the hologram plane is calculated using the fully complex FFT algorithm so that the modulation format of the computed hologram can be chosen as amplitude, phase, or fully complex. However, the computational effort required for 3D objects still places a demonstrator as a lab project rather than a consumer item. The approach taken here is to begin the work with 2D displays in consumer products and extends the work towards 3D when consumer acceptance has improved to the extent that design of a custom ASIC can be commercially viable.
The initial holographic display systems are based on phase-only holograms (or kinoforms). A phase-only hologram, which is computer-generated was announced in 1969 [20], and an iterative algorithm for the design of these kinoforms known as the GS algorithm was presented a few years later [21]. The advantage of the phase-only hologram for display is that a significant portion of the light energy arrives at the image plane. This enables a more efficient display system but comes at the expense of a significant noise floor. The GS iterative phase retrieval algorithm for calculating the kinoform produces relatively noisy images with poor contrast. This is also known as the Iterative Fourier Transform Algorithm (IFTA) [22]. We have developed a new generation of iterative phase retrieval algorithms that deliver outstanding image quality, which was exemplified in Reference [23]. The latest generation of iterative algorithms can now achieve satisfactory display quality within 10 iterative cycles including a mean square error of less than 1 and a contrast ratio of greater than 5000:1 [24].
5. System Application
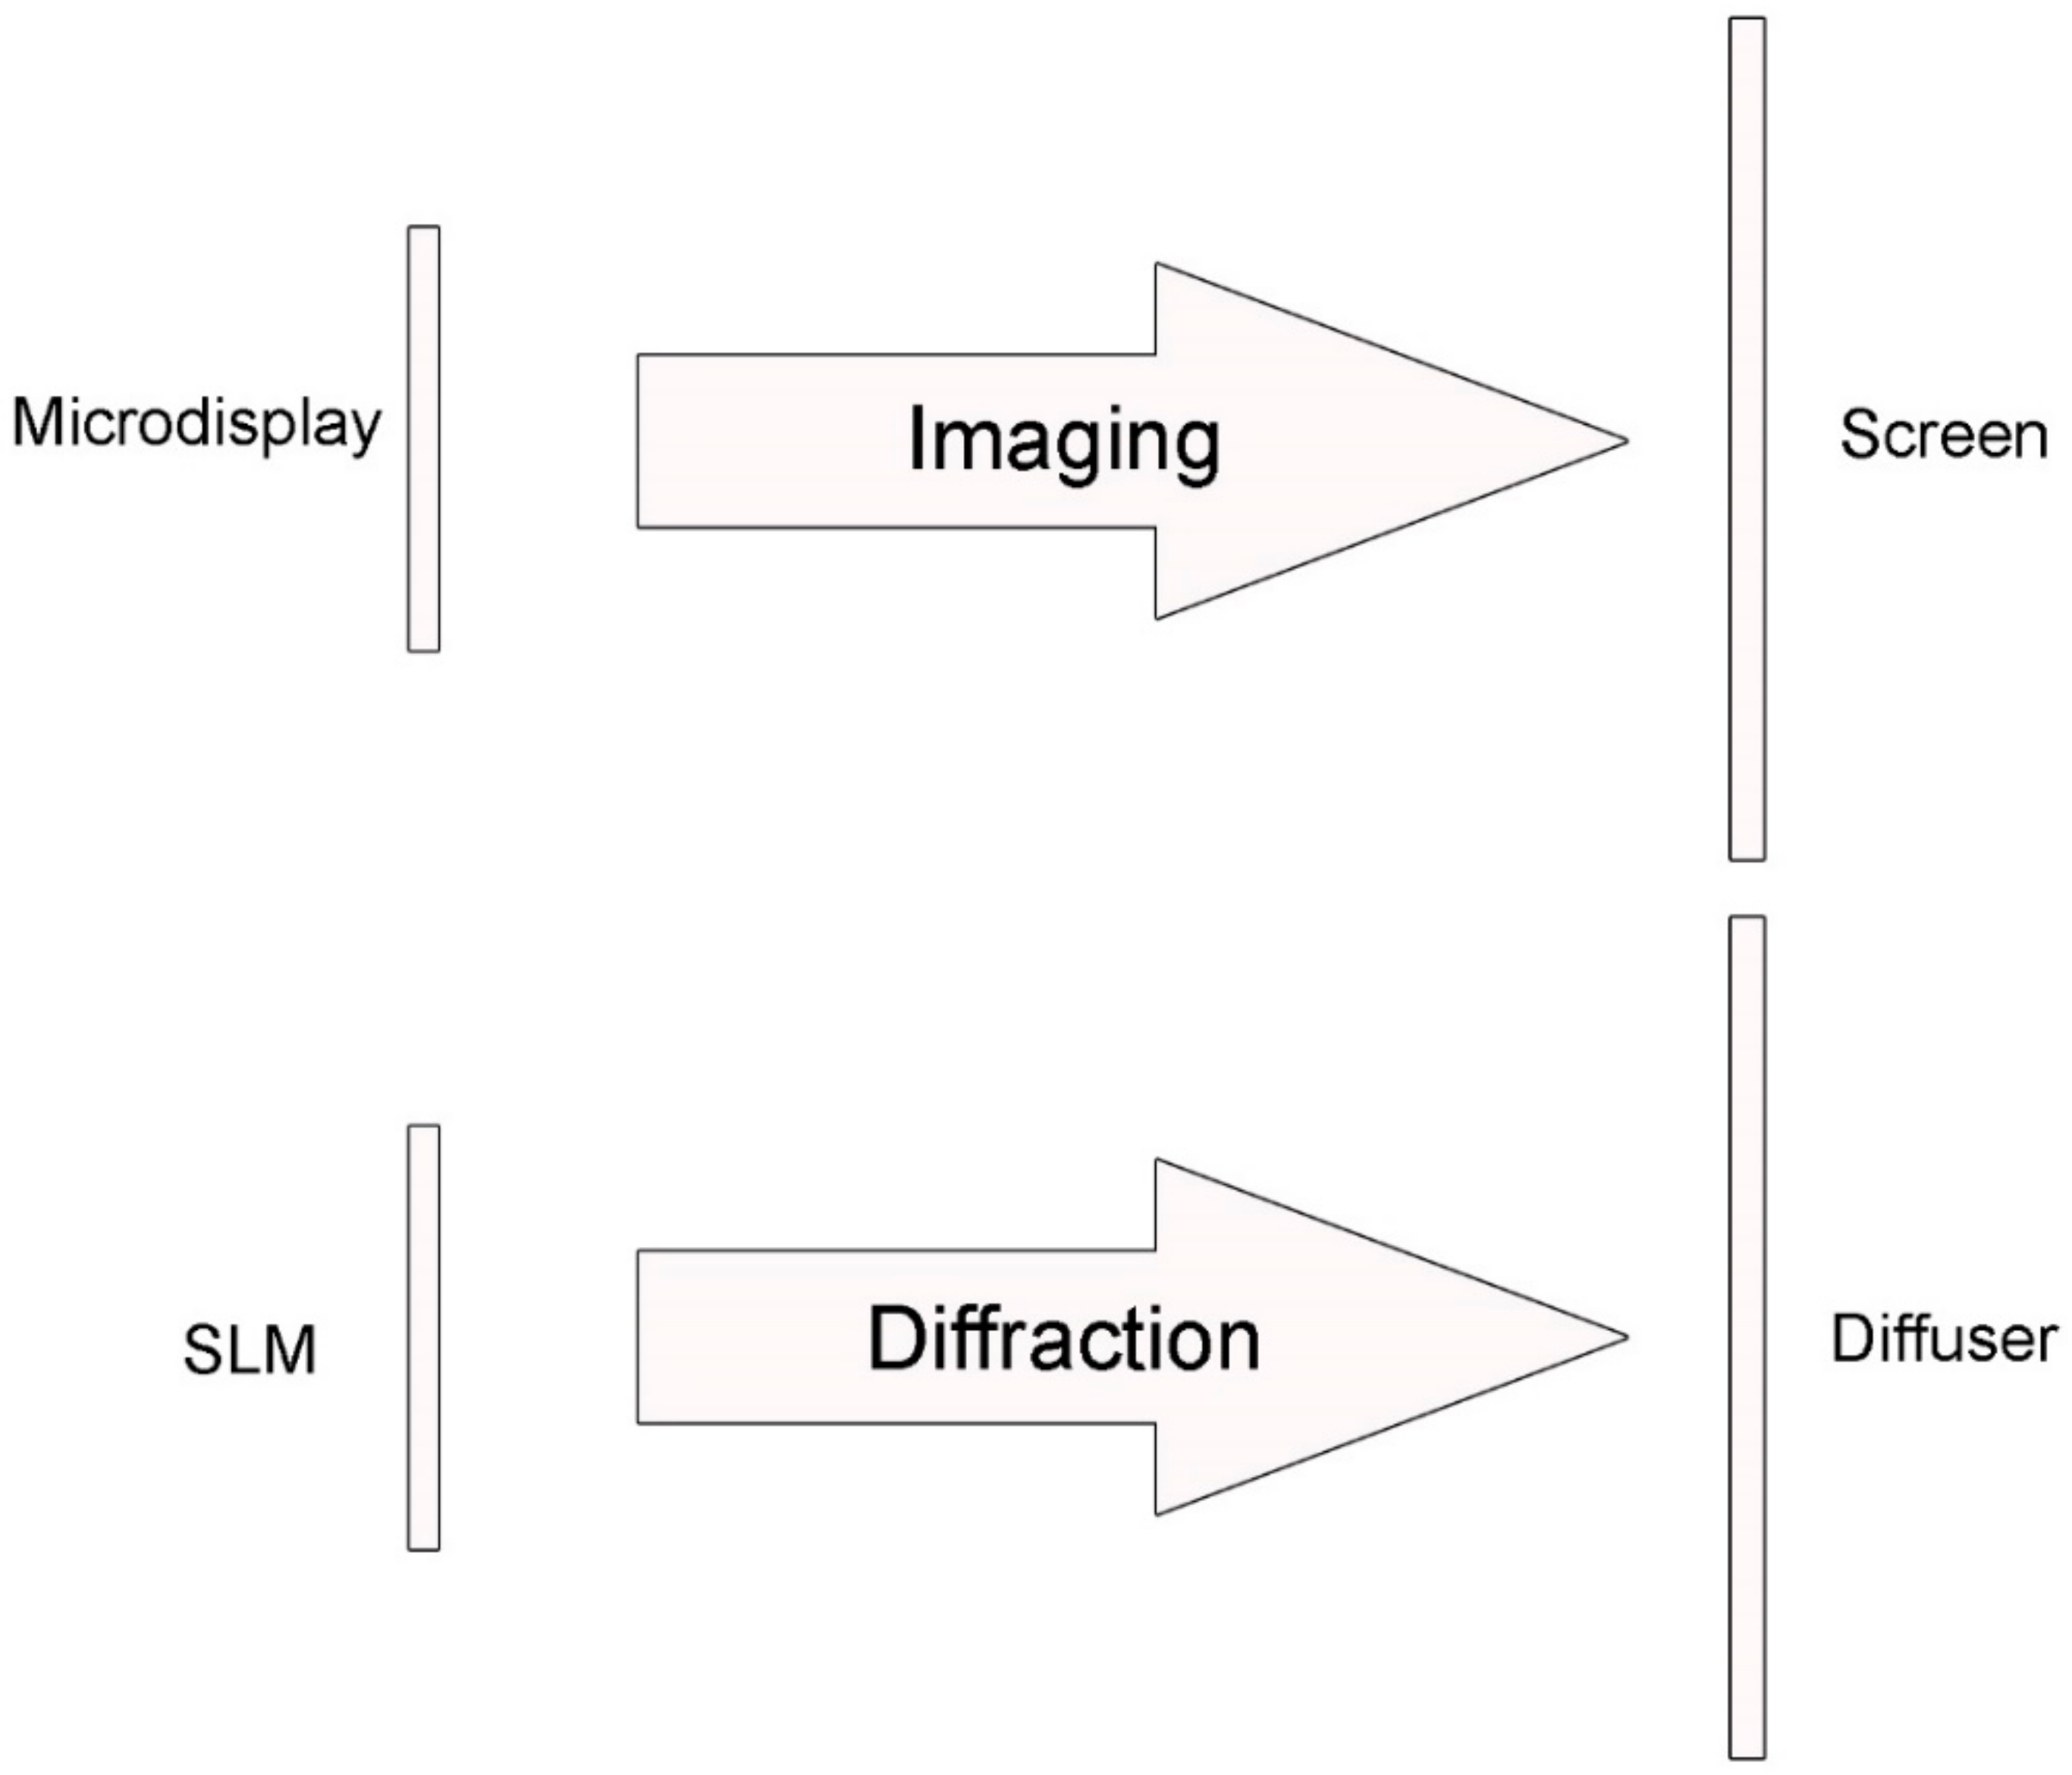
The two methods of projection presented in Figure 6 are fundamentally different in terms of the device, optics, and projection image quality. Conventional displays employ imaging where a large size of micro-display is preferable in order to increase the etendue of the system. The NA of the optics adjacent to the micro-display is large for the same reason. In diffractive projection, the light throughput is, in principle, not limited by etendue considerations. Diffractive spread from the SLM to the screen creates the projected image. The complex projection optics of the imaging system is reduced to a Fourier lens. Since large diffraction angles allow the volume of the entire display engine to be reduced, a small pixel size is highly desirable. The quality of the projected image in an imaging system can be markedly influenced by pixel defects and inter-pixel gaps. In contrast, the projected image in a diffractive projection is fault tolerant with regard to the SLM and the inter-pixel gaps do not influence the image. Since coherent light is used in the diffractive system, there is a degree of speckle in the image.
The product of the image size and the field of view (FOV) in a Fourier transform system is given by the product of the number of pixels in the SLM and the wavelength of the coherent light illumination [8]. For 3D direct view, two distinct approaches have emerged. The first is to increase the number of pixels in the SLM by using Active Tiling from a fast electrically addressed SLM onto an optically addressed SLM [8]. The second is to settle for the number of pixels in current SLMs to restrict the view presented to the eye using eye tracking and increased optics associated with the display [25]. For 2D display, based on the SLMs discussed in Section 3, the product of the image size and the field of view is still far smaller than the field of view that is commercially acceptable. Therefore, a two-stage design is adopted where the first stage results in the projected image on a diffuser and the second stage is an imaging system. The FOV of the diffuser is engineered to give the correct aspect ratio for the FOV of the final image. The image size is magnified in the imaging system so that the FOV*image size product is an invariant. The brightness of the magnified image is consequently equal to the brightness at the diffuser if there is no attenuation in the imaging system. This is the brightness given in our previous study [23]. In order to reduce the speckle in the final projected image, the diffuser is rotated.
The design of the diffraction system is relatively simple in concept. A coherent light source is collimated and illuminates an LCOS device, which displays the phase-only hologram and the reflected beam is brought to a focus by a lens. No polarizers are required if the light source is polarized, e.g., a diode laser. Laser-based light sources offer an improved color gamut in comparison with white LED light sources. In order to provide a display that is competitive in the market place, a large effort is made in the system detail. This will be outlined in this section.
The beam-shaping optics for the diode laser should be designed for high efficiency with minimum wave front error at the LCOS. It is often convenient to tilt the LCOS plane with respect to the collimated beam in order to avoid the use of either a beam splitter or an X-cube. The former attenuates the throughput and the latter is costly. In a conventional amplitude-modulating display, this would lead to a tilted image plane and additional complications for the optics downstream of this plane. The many-to-one correspondence again allows flexibility in the design of the hologram so that the image plane can be perpendicular to the optical axis. The major benefit of a phase only holographic head up display in comparison with an LED/TFT solution for a typical HUD specification is in the throughput and this was detailed in Reference [23].
Due to the many-to-one correspondence between the pixels in the SLM and the points in the image, there is no longer a direct relationship between the pixels on the LCOS device and the pixels in the replay field. The size of the pixels in the replay field is determined by the physical process of optical diffraction. The aperture of the LCOS device is the limiting aperture so that the replay field pixels are ellipses with their long axis vertical, which corresponds to the short axis of the LCOS. When the illumination of the LCOS is uniform, these spots are sinc squared functions. This results in the most compact spot. Uniform illumination with no concomitant light loss is an “ideal” objective, which is difficult to achieve in practice. In order to assess the approaches to beam shaping, Romero and Dickey introduced a dimensionless parameter β [26].
where R is the dimension of the input beam, D is the dimension of the output beam, λ is the wavelength, and f is the distance between input and output, which is commonly the focal length of the collimating lens. The 1/e2 radius of the Gaussian waist is a convenient measure for R and the half width of the LCOS aperture is convenient for D. The small 1/e2 radius of a laser diode favors large radius output beams. The relatively small aperture of the LCOS leads to a small β. The design of the beam shaping optics becomes more difficult as β decreases. The collimation optic design minimizes both the loss of intensity and the wave front error at the LCOS. The latter minimizes spot size increases due to pupil aberrations.
A good compromise is to expand the Gaussian beam profile and apodise it using the LCOS aperture. The illumination beam profile is an elliptical Gaussian beam with a 1/e2 waist radius, , at the corner of the LCOS. The horizontal and vertical waists, and , are in the same ratio as the rectangular aperture of the LCOS (approx. 2:1) and the perimeter of the active area is 0.707 and 0.707 The spot size (3 dB diameter) will then be seen in the equation below [27].
The power captured by the LCOS aperture at this apodisation is 71% of the incident beam. One of the differentiating features of a phase-only holographic display is its ability to redirect light in the formation of the target image. For low information content images such as those used in head up displays, this causes a concentration of the light energy in the utilized pixels, which significantly increases the brightness of the illuminated areas of the display. This is termed “Holographic Gain.” Taking the reciprocal of the pixel utilization approximates the Holographic Gain. A typical figure for the Holographic Gain in a head up display application is 5.
The size and resolution of a device such as an SLM can be expressed in a single parameter, which is a dimensionless product of the two and the Space Bandwidth Product (SBWP). The size of the LCOS device shown in Figure 7 is L∆uxM∆v. The resolution in the x-direction is (∆u)−1 and the resolution in the y-direction is (∆v)−1. Therefore, the SBWP is equal to the number of pixels in the device, LxM, when the resolution is not reduced by, for example, fringing fields. The spot separation in the replay field can be controlled by hologram repetition [28], which is also illustrated in Figure 7. If the size of the hologram is C × B pixels within an LCOS aperture of M × L pixels, then the repetition ratios are M/C and L/B in the x-axes and y-axes. We employ a repetition ratio of around 1.4 to give a pleasing replay field display. Since the separation of the spots is (/B∆u, /C∆v), the maximum resolution in the replay field in an ideal case will be (/1.4, /1.4). The ideal case assumes a perfect Gaussian beam, no speckle noise, and a perfect optical system.
In addition to improving the image quality, the size of the hologram has been reduced, which facilitates the speed of computation.
Defining the spot separation is important for reducing the overlap between the side lobes of the spots, which produce unnecessary speckle noise. It will also define the maximum resolution of the display, which is the image size divided by the spot separation (Nx/1.4, Ny/1.4). The actual resolution is determined principally by the performance of the LCOS device. As discussed previously, we use thin NLC layers in order to guarantee a phase modulation amplitude between neighboring pixels of the device, which matches the intended pixels by the algorithm used to compute the hologram. Therefore, pixels at the extremity of the image field benefit from the full modulation capability of the backplane.
6. Head-Up Display
The first commercial application of this technology has been the holographic head-up display (HUD) [23]. The holographic system is capable of delivering identical levels of performance at much lower power levels or significantly brighter images than those currently possible with LED backlights [23] and those that use LED front illumination. Advantageously, the holographic display allows defects in the display device to be annealed, software control of the pixellation of the display, and holographic gain. The LCOS SLMs allow the largest format of all 2D display technologies for the required power levels of the HUD. Over the past 10 years, patents in this area of display technology have increased sixteen folds.
7. Conclusions
Author Contributions
J.C. developed the first commercial application of the holographic head-up display technology around which this paper is structured; N.C. wrote the paper.
Conflicts of Interest
The authors declare no conflict of interest.
References
- Leith, E.N.; Upatnieks, J. Wavefront Reconstruction with Diffused Illumination and Three-Dimensional Objects. J. Opt. Soc. Am. 1964, 54, 1295–1301. [Google Scholar] [CrossRef]
- Häussler, R.; Gritsai, Y.; Zschau, E.; Missbach, R.; Sahm, H.; Stock, M.; Stolle, H. Large real-time holographic 3D displays: Enabling components and results. Appl. Opt. 2017, 56, F45–F52. [Google Scholar] [CrossRef] [PubMed]
- Maimone, A.; Georgiou, A.; Kollin, J. Holographic near-eye displays for virtual and augmented reality. ACM Trans. Gr. 2017, 36. [Google Scholar] [CrossRef]
- Buckley, E. 70.2: Invited Paper: Holographic Laser Projection Technology. SID Symp. Dig. Tech. Pap. 2008, 39, 1074–1079. [Google Scholar] [CrossRef]
- Finke, G.; Kozacki, T.; Kujawińska, M. Wide viewing angle holographic display with a multi-spatial light modulator array. Proc. SPIE 2010, 77230A. [Google Scholar] [CrossRef]
- Christmas, J.L. Real Time Holography for Displays. Ph.D. Thesis, University of Cambridge, Cambridge, UK, 2009. [Google Scholar]
- Collier, R.J.; Burckhardt, C.B.; Lin, L.H. Optical Holography; Academic Press/Bell Telephone Laboratories: Murray Hill, NJ, USA, 1971. [Google Scholar]
- Slinger, C.; Cameron, C.; Stanley, M. Computer-Generated Holography as a Generic Display Technology. Computer 2005, 38, 46–53. [Google Scholar] [CrossRef]
- Moreno, I.; Campos, J.; Gorecki, C.; Yzuel, M.J. Effects of Amplitude and Phase Mismatching Errors in the Generation of a Kinoform for Pattern Recognition. Jpn. J. Appl. Phys. 1995, 34, 6423. [Google Scholar] [CrossRef]
- Lee, H.-S.; An, J.; Seo, W.; Choi, C.-S.; Kim, Y.-T.; Sung, G.; Seo, J.; Song, H.; Kim, S.; Kim, H.; et al. 54-2: Invited Paper: Holographic Display and its Applications. SID Symp. Dig. Tech. Pap. 2017, 48, 808–810. [Google Scholar] [CrossRef]
- Collings, N.; Christmas, J.L.; Masiyano, D.; Crossland, W.A. Real-Time Phase-Only Spatial Light Modulators for 2D Holographic Display. J. Disp. Technol. 2015, 11, 278–284. [Google Scholar] [CrossRef]
- Collings, N. Optically addressed spatial light modulator for 3D Display. J. Nonlinear Opt. Phys. Mater. 2011, 20, 453–457. [Google Scholar] [CrossRef]
- Pourzand, A.; Favre, S.; Collings, N. The Optimization of a LCTV for Phase-Only Filtering; EOS Topical Meetings Digests Series Volume 6; Optics and Information Paper 3.5; EOS Topical Meetings: Teddington, UK, 1995. [Google Scholar]
- Freedericksz, V.; Zolina, V. Forces causing the orientation of an anisotropic liquid. Trans. Faraday Soc. 1933, 29, 919–930. [Google Scholar] [CrossRef]
- Blinov, L.M.; Chigrinov, V.G. Modulated and nonuniform structures in nematic liquid crystals. In Electrooptic Effects in Liquid Crystal Materials; Partially Ordered Systems; Springer: New York, NY, USA, 1994. [Google Scholar]
- Chigrinov, G.; Kompanets, I.N.; Vasiliev, A.A. Behaviour of Nematic Liquid Crystals in Inhomogeneous Electric Fields. Mol. Cryst. Liq. Cryst. 1979, 55, 193–208. [Google Scholar] [CrossRef]
- Wu, S.; Efron, U. Electro-Optic Behavior of Thin Nematic Liquid Crystal Cells. Proc. SPIE 1986, 613, 172–177. [Google Scholar]
- Lucente, M. Diffraction-Specific Fringe Computation for Electro-Holography. Ph.D. Thesis, Massachusetts Institute of Technology, Cambridge, MA, USA, 1994. [Google Scholar]
- Shimobaba, T.; Nakayama, H.; Masuda, N.; Ito, T. Rapid calculation algorithm of Fresnel computer-generated-hologram using look-up table and wavefront-recording plane methods for three-dimensional display. Opt. Express 2010, 18, 19504–19509. [Google Scholar] [CrossRef] [PubMed]
- Lesem, L.B.; Hirsch, P.M.; Jordan, J.A. The Kinoform: A New Wavefront Reconstruction Device. IBM J. Res. Dev. 1969, 13, 150–155. [Google Scholar] [CrossRef]
- Gerchberg, R.W.; Saxton, W.O. A Practical Algorithm for the Determination of Phase from Image and Diffraction Plane Pictures. Optik 1972, 35, 237–246. [Google Scholar]
- Wyrowski, F.; Bryngdahl, O. Iterative Fourier-transform algorithm applied to computer holography. J. Opt. Soc. Am. A 1988, 5, 1058–1065. [Google Scholar] [CrossRef]
- Christmas, J.; Collings, N. 75-2: Invited Paper: Realizing Automotive Holographic Head Up Displays. SID Symp. Dig. Tech. Pap. 2016, 47, 1017–1020. [Google Scholar] [CrossRef]
- Mullins, B.; Greenhalgh, P.; Christmas, J. 59-5: Invited Paper: The Holographic Future of Head up Displays. SID Symp. Dig. Tech. Pap. 2017, 48, 886–889. [Google Scholar] [CrossRef]
- Leister, N.; Schwerdtner, A.; Fütterer, G.; Buschbeck, S.; Olaya, J.; Flon, S. Full-color interactive holographic projection system for large 3D scene reconstruction. Proc. SPIE 2008, 69110V. [Google Scholar] [CrossRef]
- Romero, A.; Dickey, F.M. Mathematical and physical theory of lossless beam shaping. In Laser Beam Shaping Theory and Techniques; CRC Press: Boca Raton, FL, USA, 2000; pp. 21–162. [Google Scholar]
- Marom, E.; Chen, B.; Ramer, O.G. Spot size of focused truncated gaussian beams. Opt. Eng. 1979, 18, 79–81. [Google Scholar]
- Wyrowski, F.; Hauck, R.; Bryngdahl, O. Computer-generated holography: hologram repetition and phase manipulations. J. Opt. Soc. Am. A 1987, 4, 694–698. [Google Scholar] [CrossRef]
- Zhang, H.; Xie, J.; Liu, J.; Wang, Y. Optical reconstruction of 3D images by use of pure-phase computer-generated holograms. Chin. Opt. Lett. 2009, 7, 1101–1103. [Google Scholar] [CrossRef]
- Bruckheimer, E.; Rotschild, C.; Dagan, T.; Amir, G.; Kaufman, A.; Gelman, S.; Birk, E. Computer-generated real-time digital holography: First time use in clinical medical imaging. Eur. Heart J. Cardiovasc. Imaging 2016, 17, 845–849. [Google Scholar] [CrossRef] [PubMed]
Figure 1.
Viewing geometry for an off-axis Fresnel hologram.
Figure 2.
Fourier hologram with a physical lens.

Figure 3.
Fourier hologram with a physical lens and software lens.

Figure 4.
Electrically Controlled Birefringence Mode.

Figure 5.
High performance, phase-only SLM.

Figure 6.
High performance, phase-only SLM.

Figure 7.
Pixel layout of LCOS.

© 2018 by the authors. Licensee MDPI, Basel, Switzerland. This article is an open access article distributed under the terms and conditions of the Creative Commons Attribution (CC BY) license (http://creativecommons.org/licenses/by/4.0/).
Share and Cite
MDPI and ACS Style
Christmas, J.; Collings, N. Displays Based on Dynamic Phase-Only Holography. Appl. Sci. 2018, 8, 685. https://doi.org/10.3390/app8050685
AMA Style
Christmas J, Collings N. Displays Based on Dynamic Phase-Only Holography. Applied Sciences. 2018; 8(5):685. https://doi.org/10.3390/app8050685
Chicago/Turabian StyleChristmas, Jamieson, and Neil Collings. 2018. "Displays Based on Dynamic Phase-Only Holography" Applied Sciences 8, no. 5: 685. https://doi.org/10.3390/app8050685
Note that from the first issue of 2016, this journal uses article numbers instead of page numbers. See further details here.