Fatigue Equation of Cement-Treated Aggregate Base Materials under a True Stress Ratio
by
 ,
,
Songtao Lv
1,3 ,
,
Chaochao Liu
1,*,
Jingting Lan
1,
Hongwei Zhang
2,
Jianlong Zheng
1 and 
Zhanping You
3
1
National Engineering Laboratory of Highway Maintenance Technology, Changsha University of Science & Technology, Changsha 410004, China
2
Inner Mongolia Communications Construction Engineering Quality Supervision Bureau, Hohhot 010051, China
3
Department of Civil and Environmental Engineering, Michigan Technological University, Houghton, MI 49931, USA
*
Author to whom correspondence should be addressed.
Appl. Sci. 2018, 8(5), 691; https://doi.org/10.3390/app8050691
Submission received: 4 April 2018
/
Revised: 26 April 2018
/
Accepted: 26 April 2018
/
Published: 29 April 2018
(This article belongs to the Special Issue Achievements and Prospects of Functional Pavement: Materials and Structures)
Abstract
:The objective of this article is to establish a fatigue equation based on the true stress ratio for cement-treated aggregate base materials. The true stress ratio herein means the ratio of the stress and the true strength of the cement-treated aggregate base materials related to loading rates and curing times. The unconfined compressive strength tests and compressive resilience modulus tests were carried out under various loading rates and curing times of 3, 7, 14, 28, 60, 90 days, respectively. According to the test results, the relationship between the unconfined compressive strength (a mix design parameter in China) and the compressive resilience modulus (a structural design parameter and the construction quality control parameter in China) of the cement-treated aggregate base material with different curing times was established. However, it was found that the strengths varied with the loading rates, which is not reflected in the existing fatigue equations. Therefore, it is questionable to obtain the stress ratio of fatigue tests with a fixed strength value obtained from the standard strength test where the loading rate is fixed (in China, the fixed loading rate is 1 mm/min for cement-treated aggregate base materials). Thus, in this paper, the four-point bending strength (i.e., flexural strength) test was carried out at different loading rates to resolve such deficiencies. Based on the strength test results at different loading rates, the true stress ratio of the fatigue test corresponding to the fatigue loading rate can be calculated. Then the four-point bending fatigue test was conducted to establish an improved fatigue equation characterized by the true stress ratio. The results show that the patterns of variation for unconfined compressive strength increasing with the curing time were similar to that of the compressive resilience modulus. The fatigue equation curve based on the true stress ratio can be extended to the strength failure point of (1, 1), where both the true stress ratio and the fatigue life value are one. The internal relationship between the strength failure and the fatigue failure was unified. This article provides a theoretical method and basis for unifying the mix design parameters and the construction quality control parameters.
1. Introduction
The semi-rigid base asphalt pavement structure has several advantages, such as strong bearing capacity, excellent integrity, and an excellent ability of dispersing upper loads, etc. Meanwhile, the material can be obtained easily [1,2]. Based on these advantages, semi-rigid base asphalt pavements have been adopted for over 80% of freeways in China. Therefore it is necessary to pay more attention to the design and construction of semi-rigid base asphalt pavements.
The cement-treated aggregate base material is usually defined as a mixture of aggregate, small amounts of cement, and water. When the cement reacts with the water, the hydration products combine the aggregate particles, thereby enhancing the strength and stiffness and improving the durability and impermeability. However, the performance of cement stabilized materials is also affected by many factors, such as aggregate type [3], cement content [4], moisture content [5], fiber content [6], curing time [7], curing condition [8], stress states [9], compaction degree and so on. Therefore many tests on the performance of cement-treated aggregate base materials have been conducted. Deng et al. studied the fatigue attenuation pattern of semi-rigid base materials in laboratory tests. It was noted that the process of fatigue failure can be divided into three stages: the strain stability stage, strain development stage and cracking stage [10]. Chai et al. adopted the falling weight deflectometer (FWD) to measure the performance of a test road in Malaysia’s cement-treated aggregate base and found that it is feasible to use the FWD to evaluate the properties of the cement-treated aggregate base structure. The empirical relationship between pavement deformation and stiffness modulus can be established [11]. Danish scholars predicted the resilient modulus of semi-rigid base asphalt pavement through a large amount of experiments, and found that with the increase of the load times, the modulus decreased gradually. The final modulus becomes 3% of its initial modulus [12,13]. It is observed that the fatigue curves of the cement-treated aggregate base material are close to that of the Portland Cement Association (PCA), and the S-N fatigue equation was recommended to predict the fatigue life of semi-rigid materials [14].
Although the performance of cement-treated aggregate base materials has been studied, there are two aspects that have been mostly ignored.
One is the effect of the curing time on the mechanical performance indicator during the construction period. The strength of cement-treated aggregate base material increases with the degree of hydration reaction. If the curing time is insufficient, early fatigue damage occurs easily under the loads of construction trucks. In China, the compressive modulus at the curing time of 90 days is adopted as a structural design parameter, while the design parameter of the mixture proportion design is the unconfined compressive strength at the curing time of seven days. Thus, the curing times are inconsistent with each other.
Another aspect is that the effects of the loading rates on the strength of the cement-treated aggregate base material were not considered when the S-N equation was established. A fixed strength value was used to determine the stress ratio of the fatigue test when the S-N equation was used to evaluate the fatigue properties of the cement-treated aggregate base material. However, it was found that the strength varies with the loading rate [15,16], which is not reflected in the existing fatigue equations [17,18,19,20]. Therefore, it is questionable to obtain the stress ratio of the fatigue tests with a fixed strength value obtained from the standard strength test when the loading rate is fixed (in China, the fixed loading rate is 1mm/min). Pell pointed out that the S-N fatigue equation should be applied in the range of Nf = 104~108. If it goes beyond that range, the linear relationship does not necessarily exist. Moreover, when the stress level is larger than the strength obtained by the standard strength test, the stress ratio will be larger than 1, which means that the fatigue life under this stress level will be less than 1, but the actual fatigue life is much greater than 1 [21].
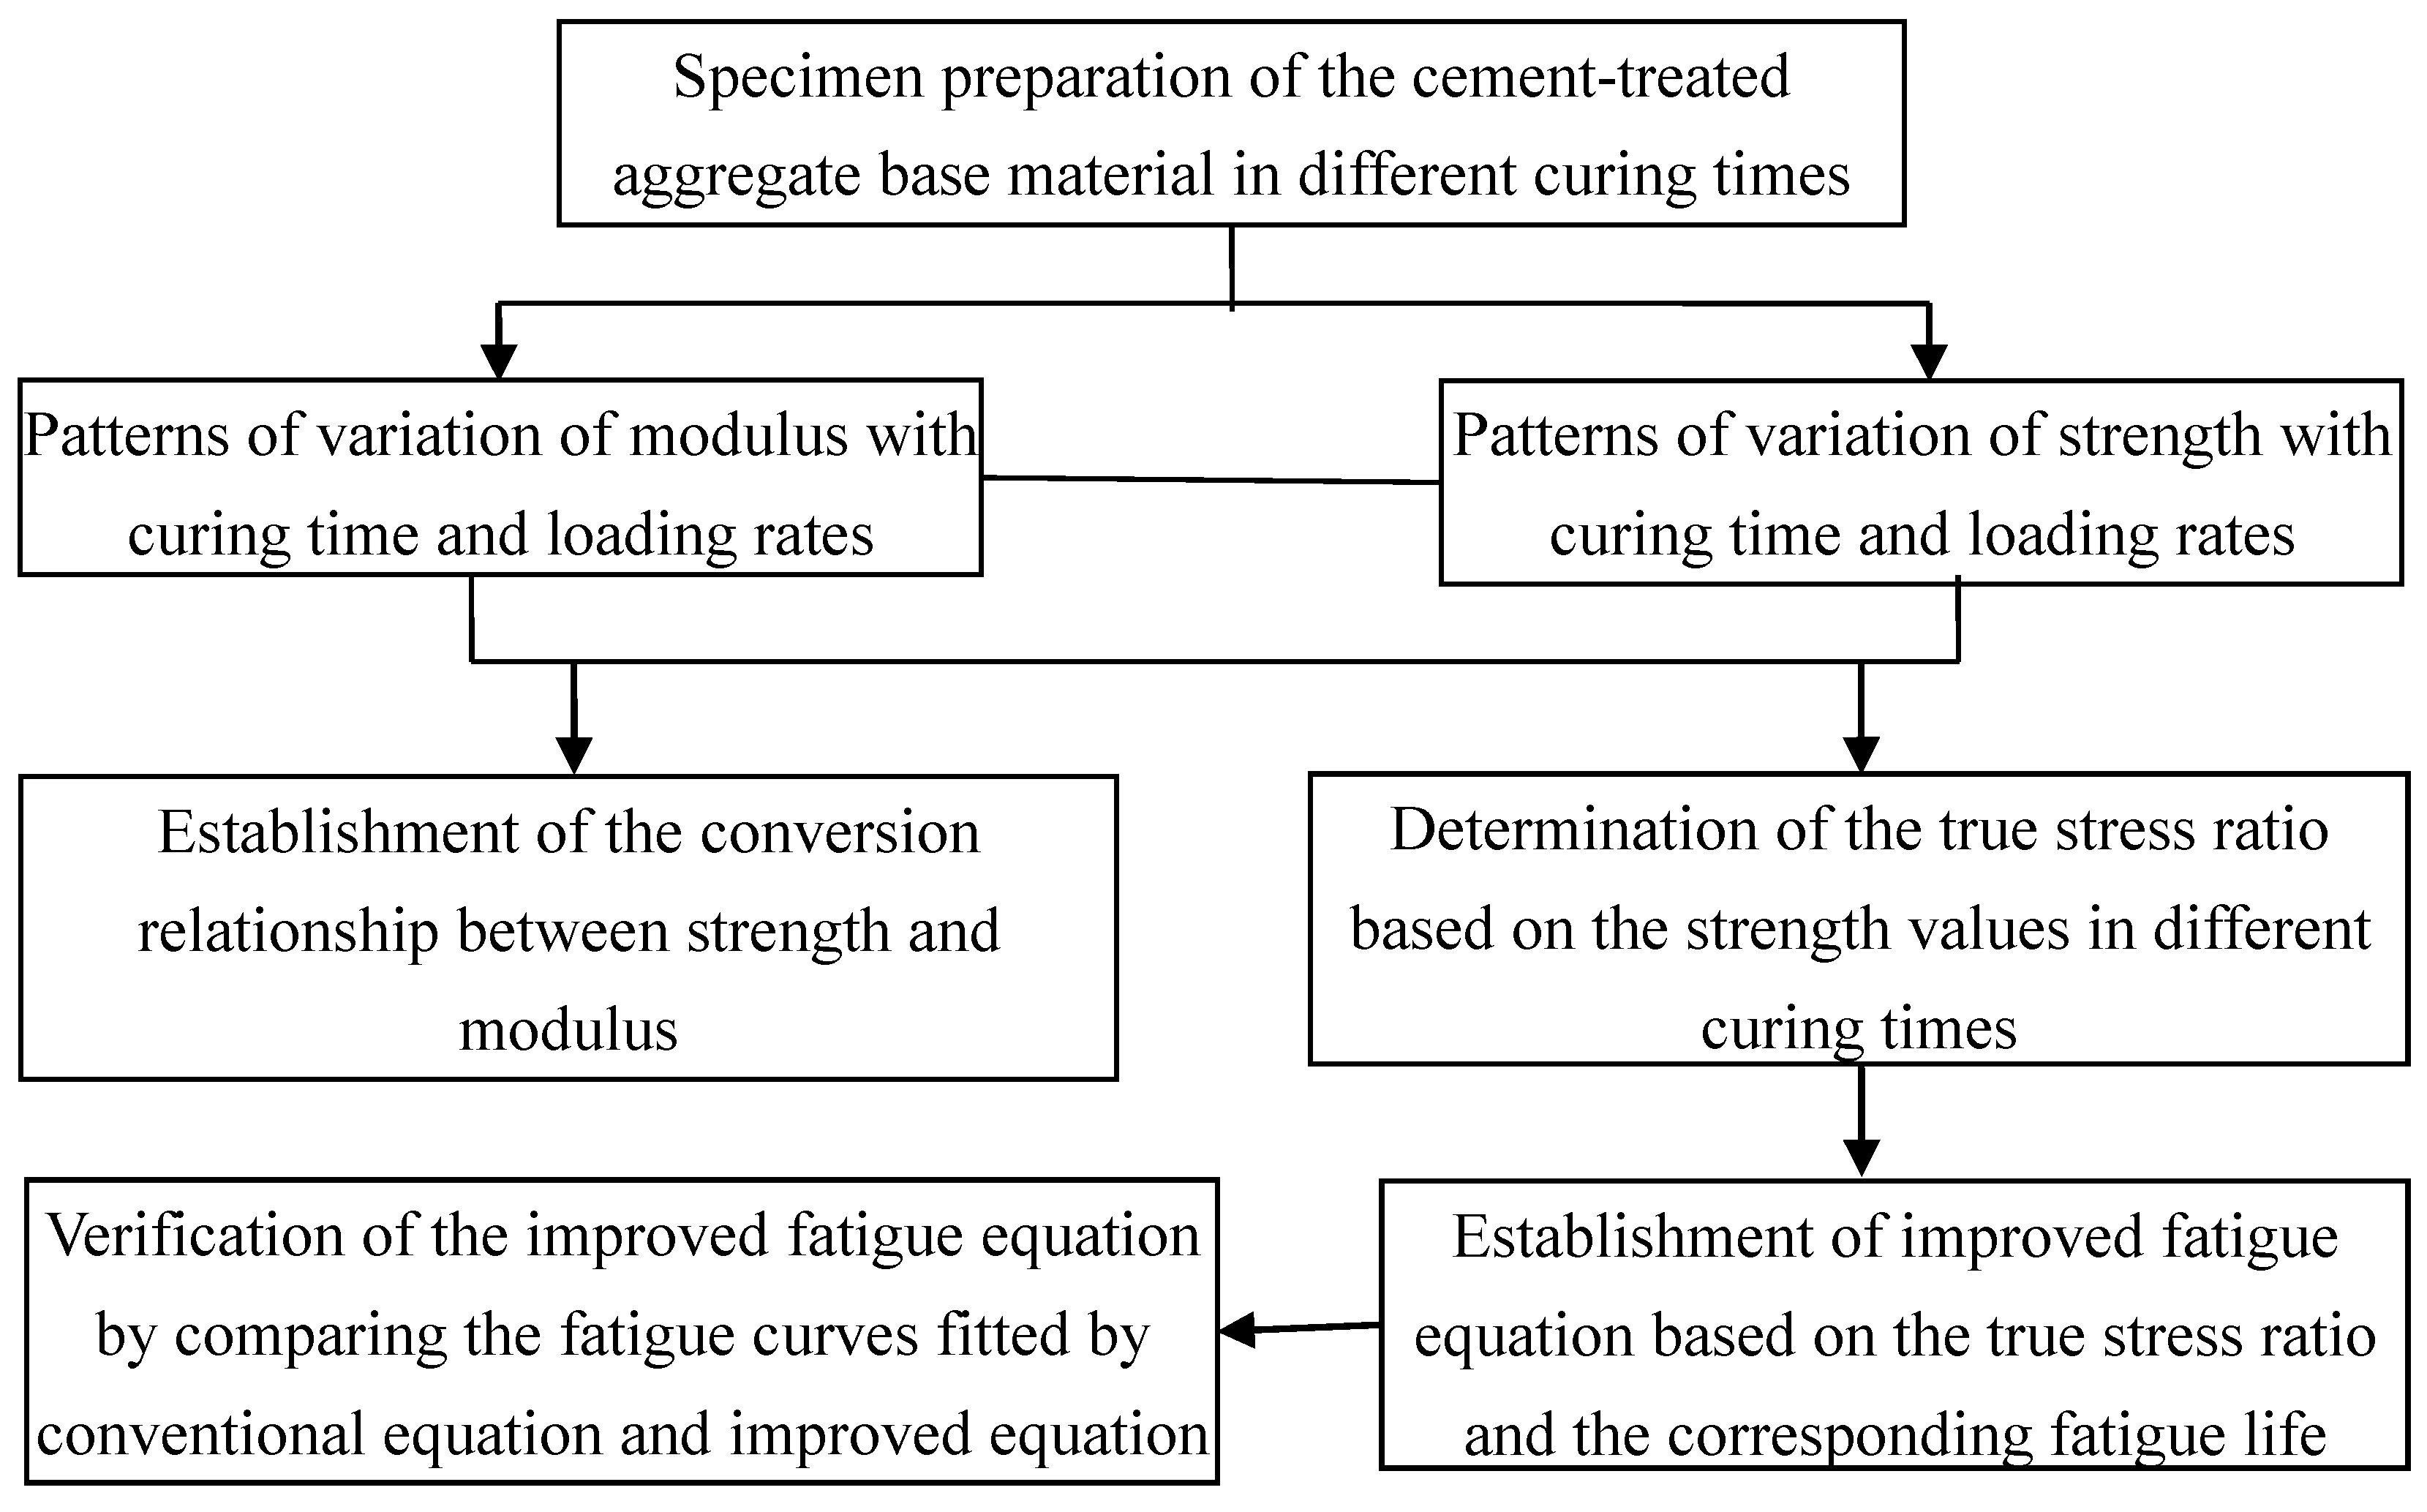
Therefore, in this paper, the analysis was conducted according to the flow chart, as shown in Figure 1. According to the results of the research, the relationship between the unconfined compressive strength (a mixed design parameter) and the compressive resilience modulus (a structural design and construction quality control parameter) of the cement-treated aggregate base material with different curing times was established. Meanwhile, an improved fatigue equation was proposed, which was characterized by the true stress ratio.
2. Material Properties and Mixture Design
2.1. Cement
Portland cement was used as cementitious in the cement-treated aggregate base material and the strength level was 42.5 MPa. Its additives are fly ash and the technical properties are presented in Table 1; the technical requirements are from the Chinese Construction Specifications for Highway Road Bases (JTJ/T F20-2015) [22].
2.2. Aggregate
According to the Chinese Construction Specifications for Highway Road Bases (JTJ/T F20-2015) [22], the gradation of cement-treated aggregate base material is shown in Figure 2:
The aggregate is limestone and the technical indicators are shown in Table 2.
2.3. Mixture Proportion Design
After obtaining the suitable aggregates and determining the synthetic gradation of the mineral aggregate according to Figure 2, the traditional mixture design procedure of the cement-treated aggregate materials was generally as follows: (1) Select the range of the preliminary cement content by weight [22]; (2) Use the preliminary estimated cement content obtained in step (1) to perform the moisture-density testing, and the maximum dry density and the optimum moisture content could be obtained; (3) Prepare the specimens by using the maximum dry density and the optimum moisture content obtained from step (2); (4) Determine the average unconfined compressive strength of the specimens after the seven-day curing time. If the average unconfined compressive strength fulfills the design requirement, the cement content and the water content determined in step (2) are adequate for cement-treated aggregate materials. Otherwise, repeat the above procedure to obtain the required mixture by adjusting the material. Thus, according to the procedure of mixture proportion design, the cement content was determined to be 4.5%, the optimum water content was determined to be 4.6%, and the maximum dry density was determined to be 2.35g/cm3.
3. Unconfined Compressive Strength Test
3.1. Preparation of Specimens for the Unconfined Compressive Strength Test
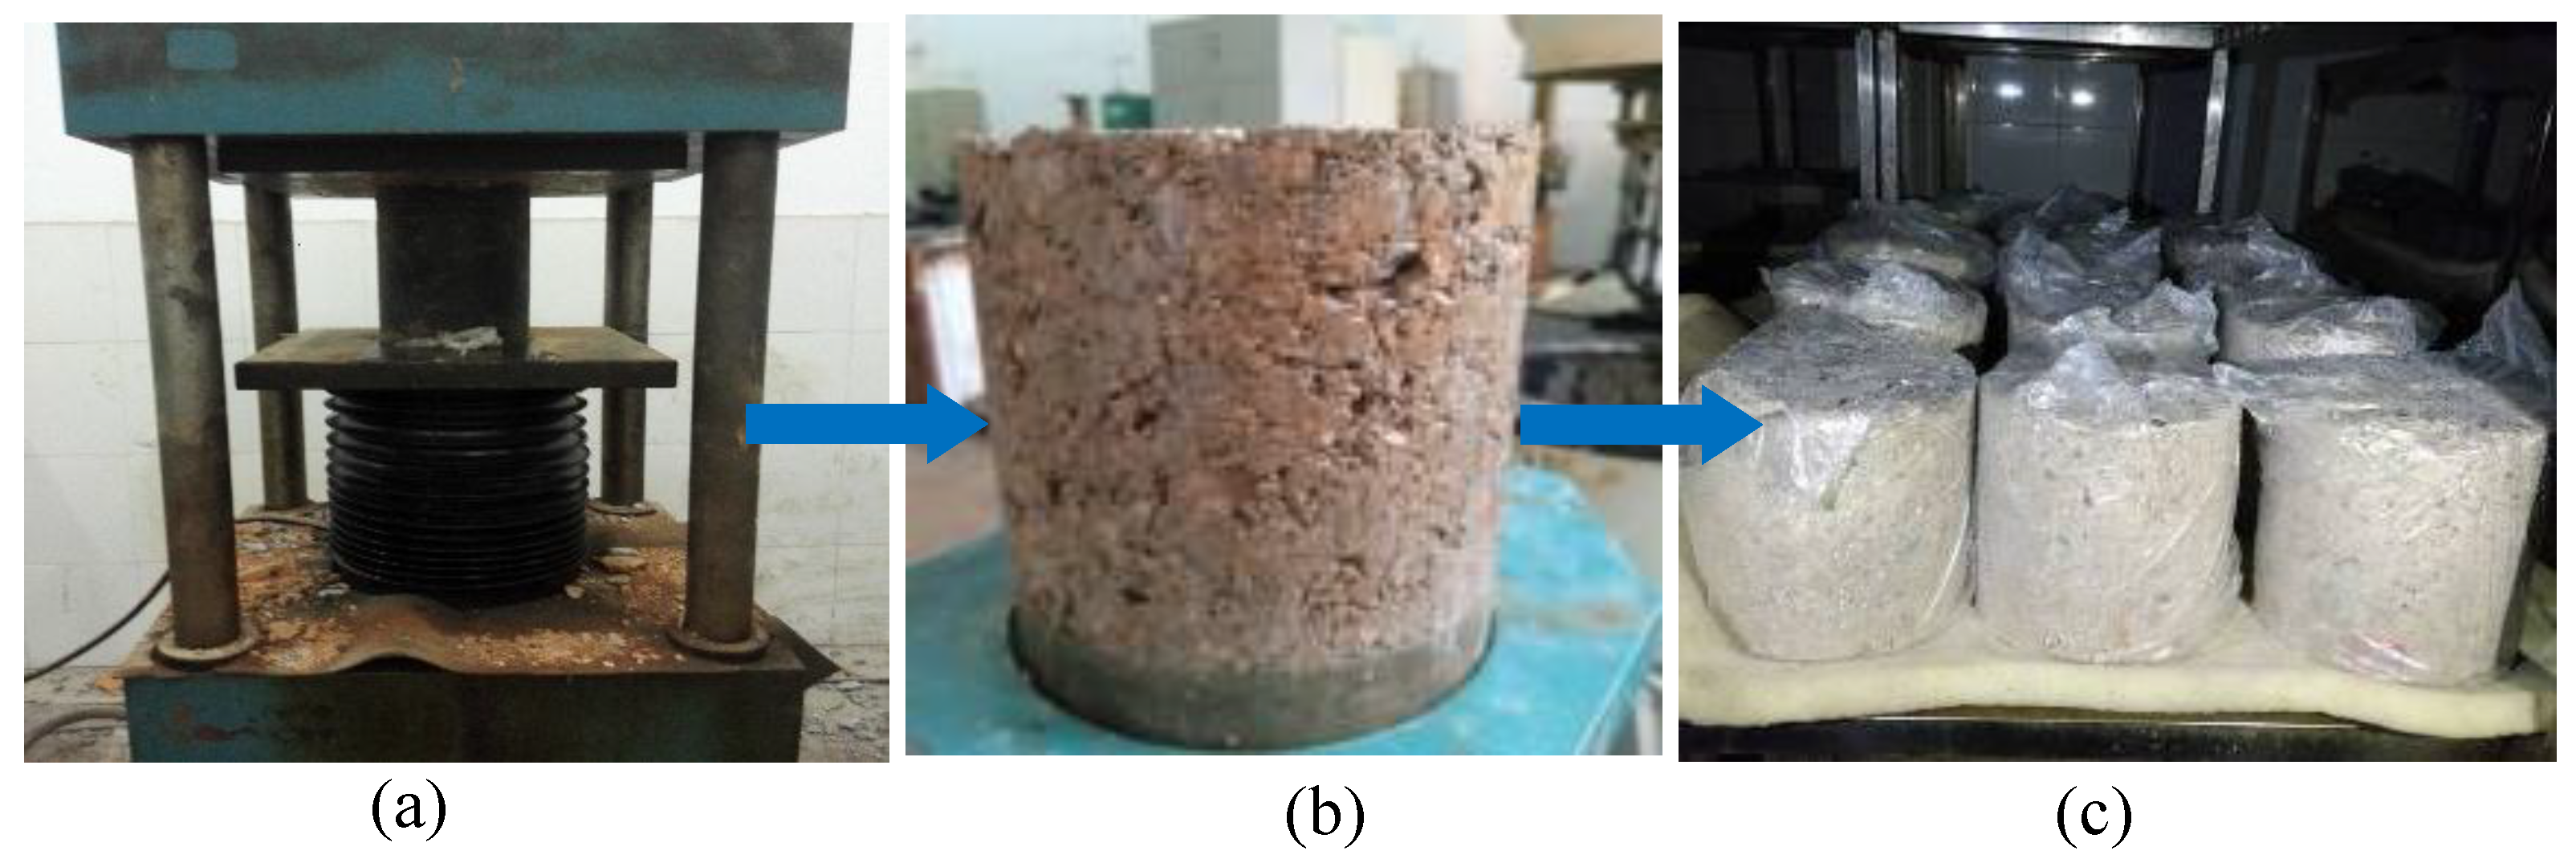
According to the Chinese Test Methods of Materials Stabilized with Inorganic Binders for Highway Engineering (JTG E51-2009) [23], the static pressure method was employed to prepare the specimens. The cylinder specimen for unconfined compressive strength and resilience modulus tests were fabricated with the static compactor. The compacting rate was 1 mm/min until the top and bottom heel blocks were pressed into the mold, as shown in Figure 3a, and the diameter and height of the specimens were Φ150 mm and 150 mm, respectively. After the molds were released, as shown in Figure 3b, the specimens were wrapped in plastic bags and moved to a standard curing room with a temperature of 20 ± 2 °C and a humidity not less than 95% for the required curing time, as shown in Figure 3c.
3.2. The Test Process of Unconfined Compressive Strength Test
The cement-treated aggregate base material specimens were prepared with curing times of 3 days, 7 days, 14 days, 28 days, 60 days, 90 days. At the end of a certain curing time, the specimens were put in a sink where they were immersed in water, as shown in Figure 4a, and the water temperature was about 20 ± 2 °C. After being immersed for 24 h, the specimens were taken out of the sink and their height was measured, as shown in Figure 4b. The specimens with a height in the range of 150 ± 2 mm were abandoned as nonstandard specimens. Then, the standard specimens were used to determine the strength of the cement-treated aggregate base material by Material Tests System (MTS), as shown in Figure 4c; the loading rate of the standard strength test was 1mm/min. Furthermore, the cement-treated aggregate base material specimens with a curing time of 28 days were chosen to determine the strength under the loading rates of 0.1, 0.5, 1, 3, 5, 10 mm/min. Figure 4d illustrates the specimen after failure.
According to the Test Methods of Materials Stabilized with Inorganic Binders for Highway Engineering (JTG E51-2009) [23], the ultimate failure load P could be obtained by the MTS, and the unconfined compressive strength of the specimens were calculated by Equation (1).
where Sc is the unconfined compressive strength of the specimen (MPa); P is the ultimate failure load (kN); and A is the cross sectional area of the specimen (mm2).
3.3. Analysis of Unconfined Compressive Strength Test Results
The specimens were placed in a standard curing room continuously for 3 days, 7 days, 14 days, 28 days, 60 days and 90 days. The unconfined compressive strength test was carried out. The test results of cement-treated aggregate base material with different curing times are shown in Table 3.
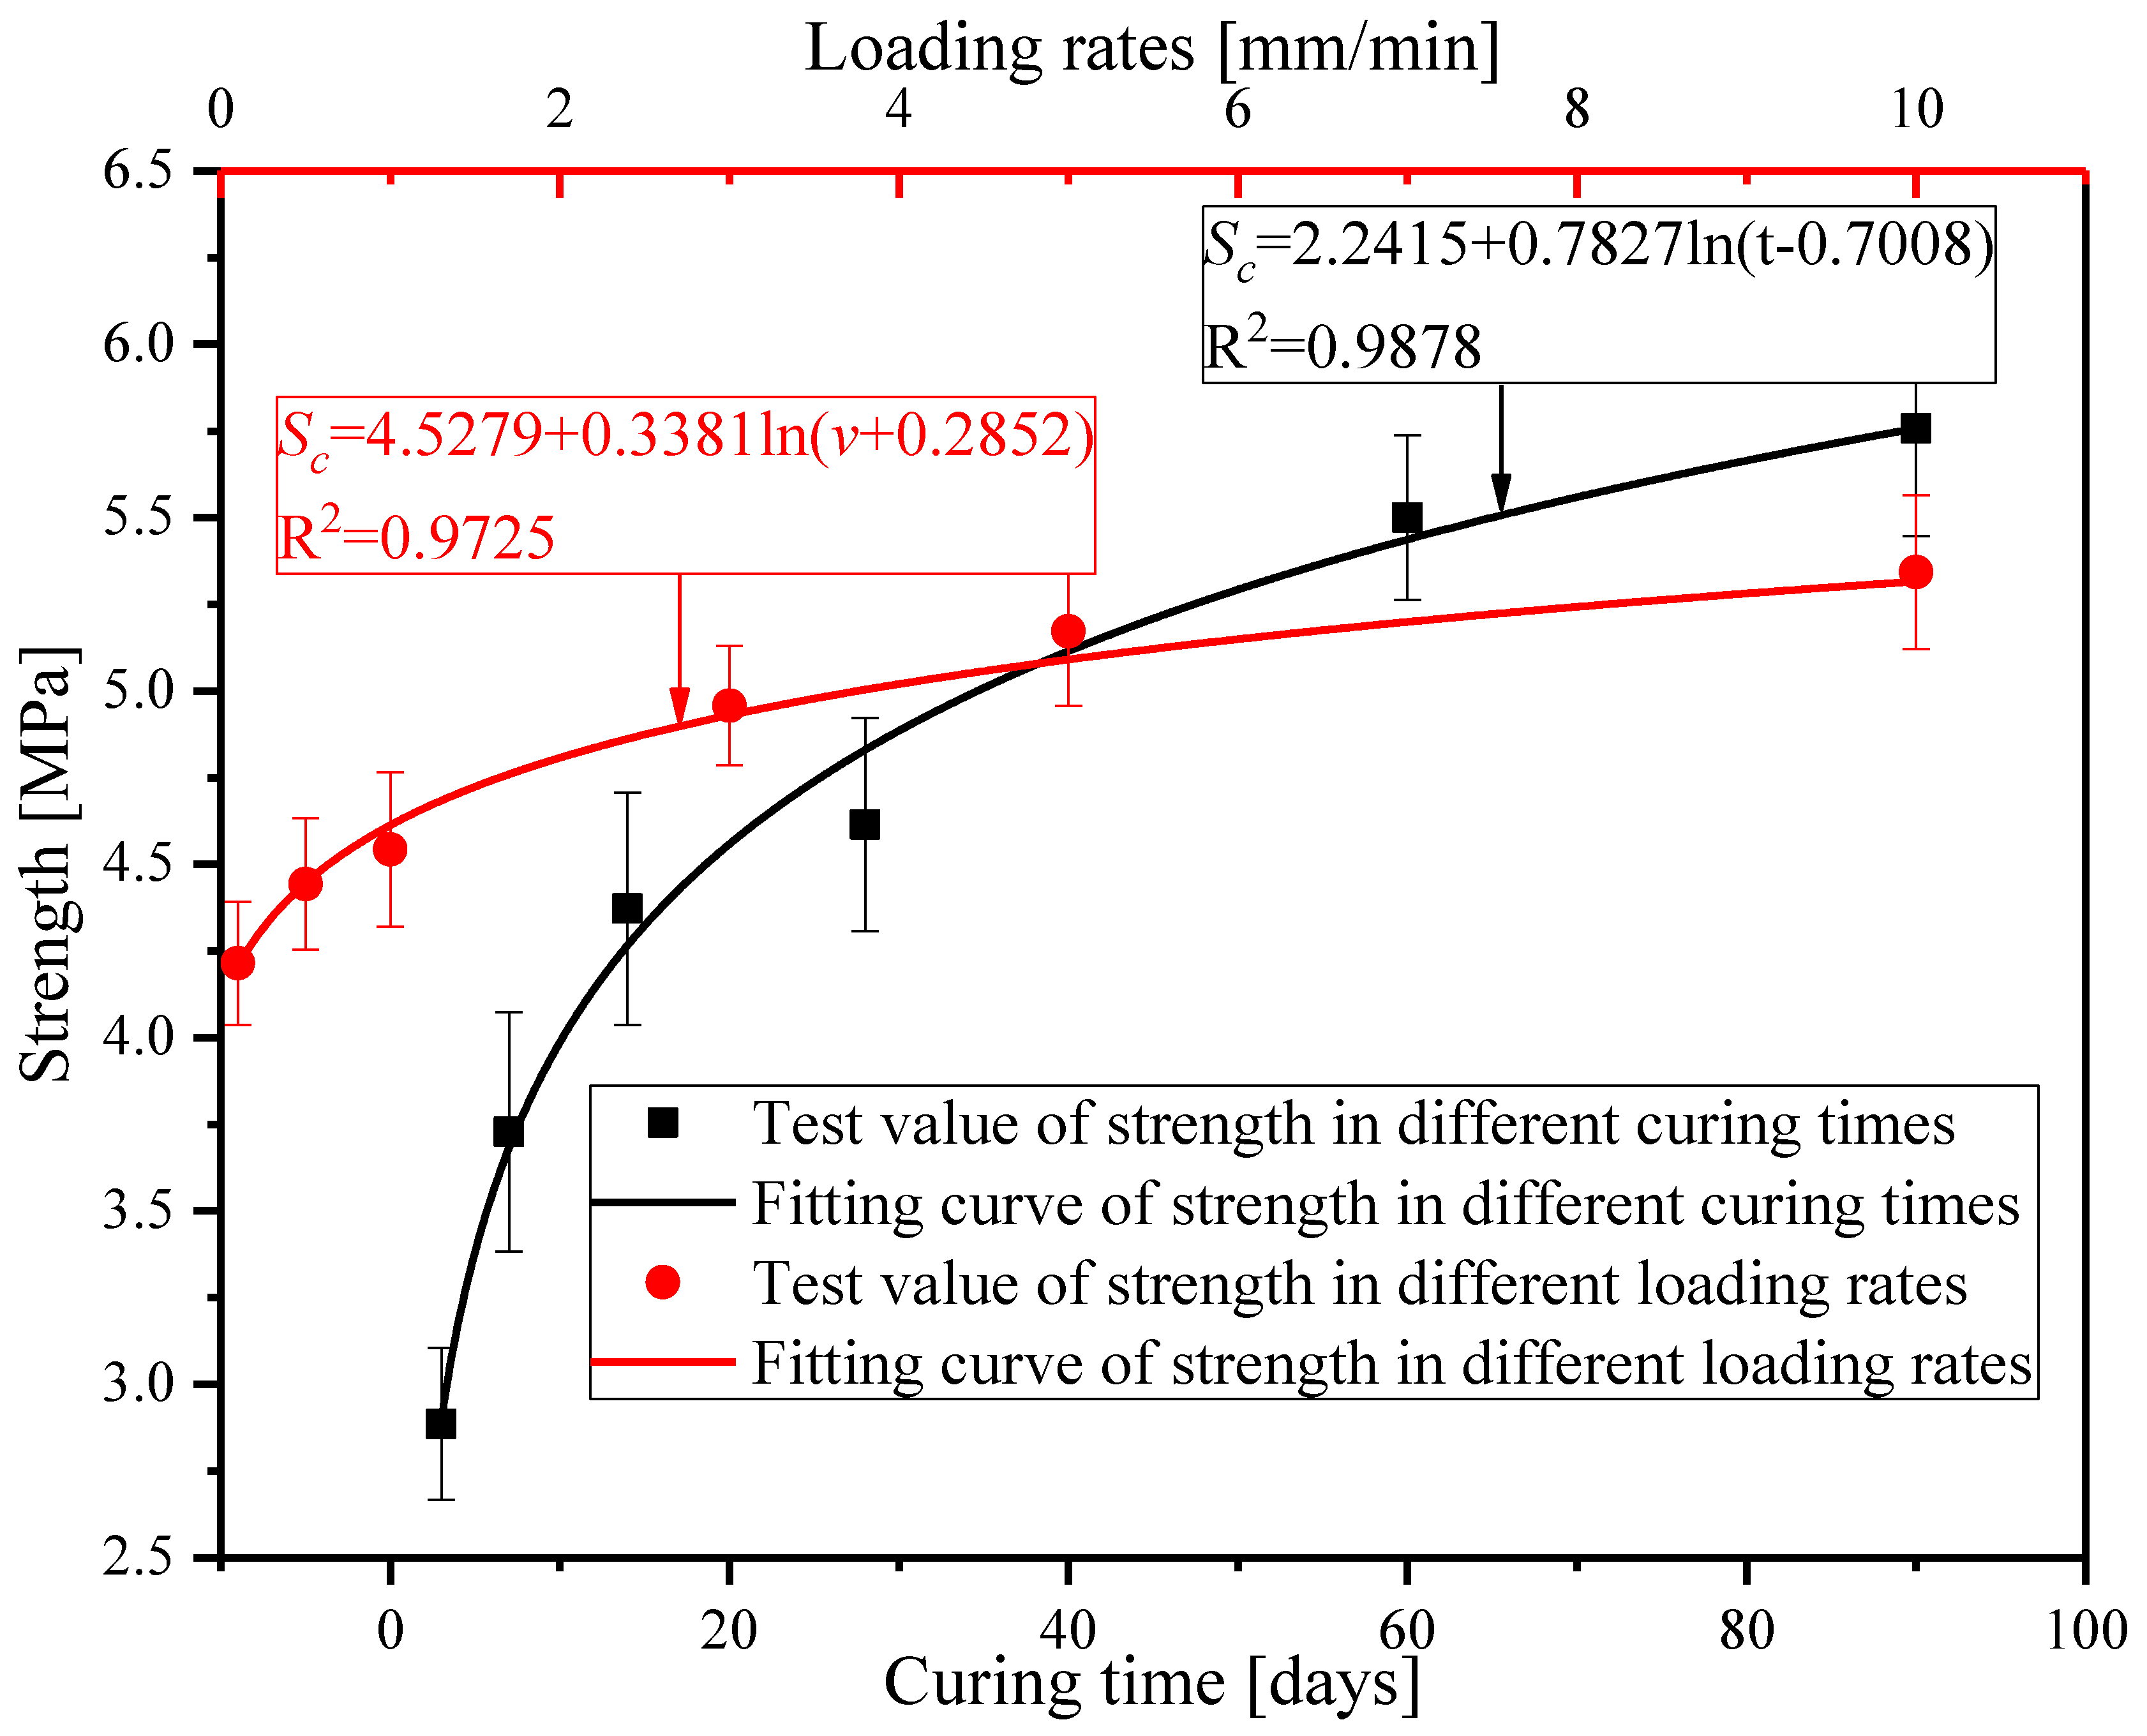
From the test results for unconfined compressive strength presented in Table 3, it can be noted that the unconfined compressive strength of the cement-treated aggregate base material varied dramatically in both curing times and loading rates. The pattern of variation was described by a logarithmic equation, and the strength test resulted in different curing times and different loading rates, fitted by Equations (2) and (3), respectively. The fitting results are shown in Figure 5, where R2 is the correlation coefficient of the fitting.
where Sc is the compressive strength; t is the curing time; v is the loading rate; a1, a2, b1, b2, c1, and c2 are the fitting parameters.
From the fitting results, it can be noted that:
- (1)
- The effect of the curing time on the strength of the cement-treated aggregate base material is larger than the loading rate. The strength value increases with an increased curing time. For example, the strength at a curing time of 90 days was two times larger than that of three days. The strength increased quickly with the curing time in the early period, and tended to be stable in the later period. In the first 28 days, the strength value increased by about 58.6% (from 2.9 MPa to 4.6 MPa). This is consistent with the findings in the literature [24,25]. The strength increased slowly in the later period, therefore, the semi-rigid base layer should be maintained for more than 28 days before the upper layers are paved.
- (2)
- The strength of the cement-treated aggregate base material is affected by the test loading rate significantly, but much less than the curing time. The strength value increased by about 26% (from 4.2 MPa to 5.3 MPa) with the increased loading rate (from 0.1 mm/min to 10 mm/min). Therefore, when the compressive strength was taken as the pavement design parameter, the effect of the loading rate should be considered.
4. Unconfined Compressive Resilient Modulus Test
4.1. Compressive Resilient Modulus Test Process
The preparation of specimens for the modulus test was the same with that for the strength test. The static resilient modulus test method was adopted. The compressive modulus test was carried out in accordance with the Chinese Test Methods of Materials Stabilized with Inorganic Binders for Highway Engineering (JTG E51-2009) [23]. The stress and strain used for static resilient modulus calculations were obtained through seven stages of loading and unloading. According to the strength tests results, the ultimate failure loads corresponding to certain test conditions were determined as P, and then 0.1 P, 0.2 P…, 0.7 P were employed as the loading level for the seven stages of the loading and unloading procedure. The displacement extensometer was implemented to measure the corresponding strain and placed on both sides of the specimen, as shown in Figure 6.
According to each loading level Pi and the corresponding deformation li, the resilience modulus could be calculated by Equation (4).
where Ec is the compressive resilience modulus (MPa); Pi is the loading level (MPa), and i = 1, 2…, 7; h is the specimen height (mm); A is the cross sectional area of the specimen (mm2); and li is the deformation corresponding to the loading level Pi (mm).
4.2. Patterns of Variation of Compressive Modulus at Different Curing Times and Loading Rates
The modulus of the cement-treated aggregate base material with a curing time of 3 days, 7 days, 14 days, 28 days, 60 days and 90 days was determined under the loading rate of 1mm/min. Then, modulus tests of the cement-treated aggregate base material specimens with a curing time of 28 days were conducted under the loading rates of 0.1 mm/min, 0.5 mm/min, 1 mm/min, 3 mm/min, 5 mm/min, 10 mm/min. The test results are presented in Table 4.
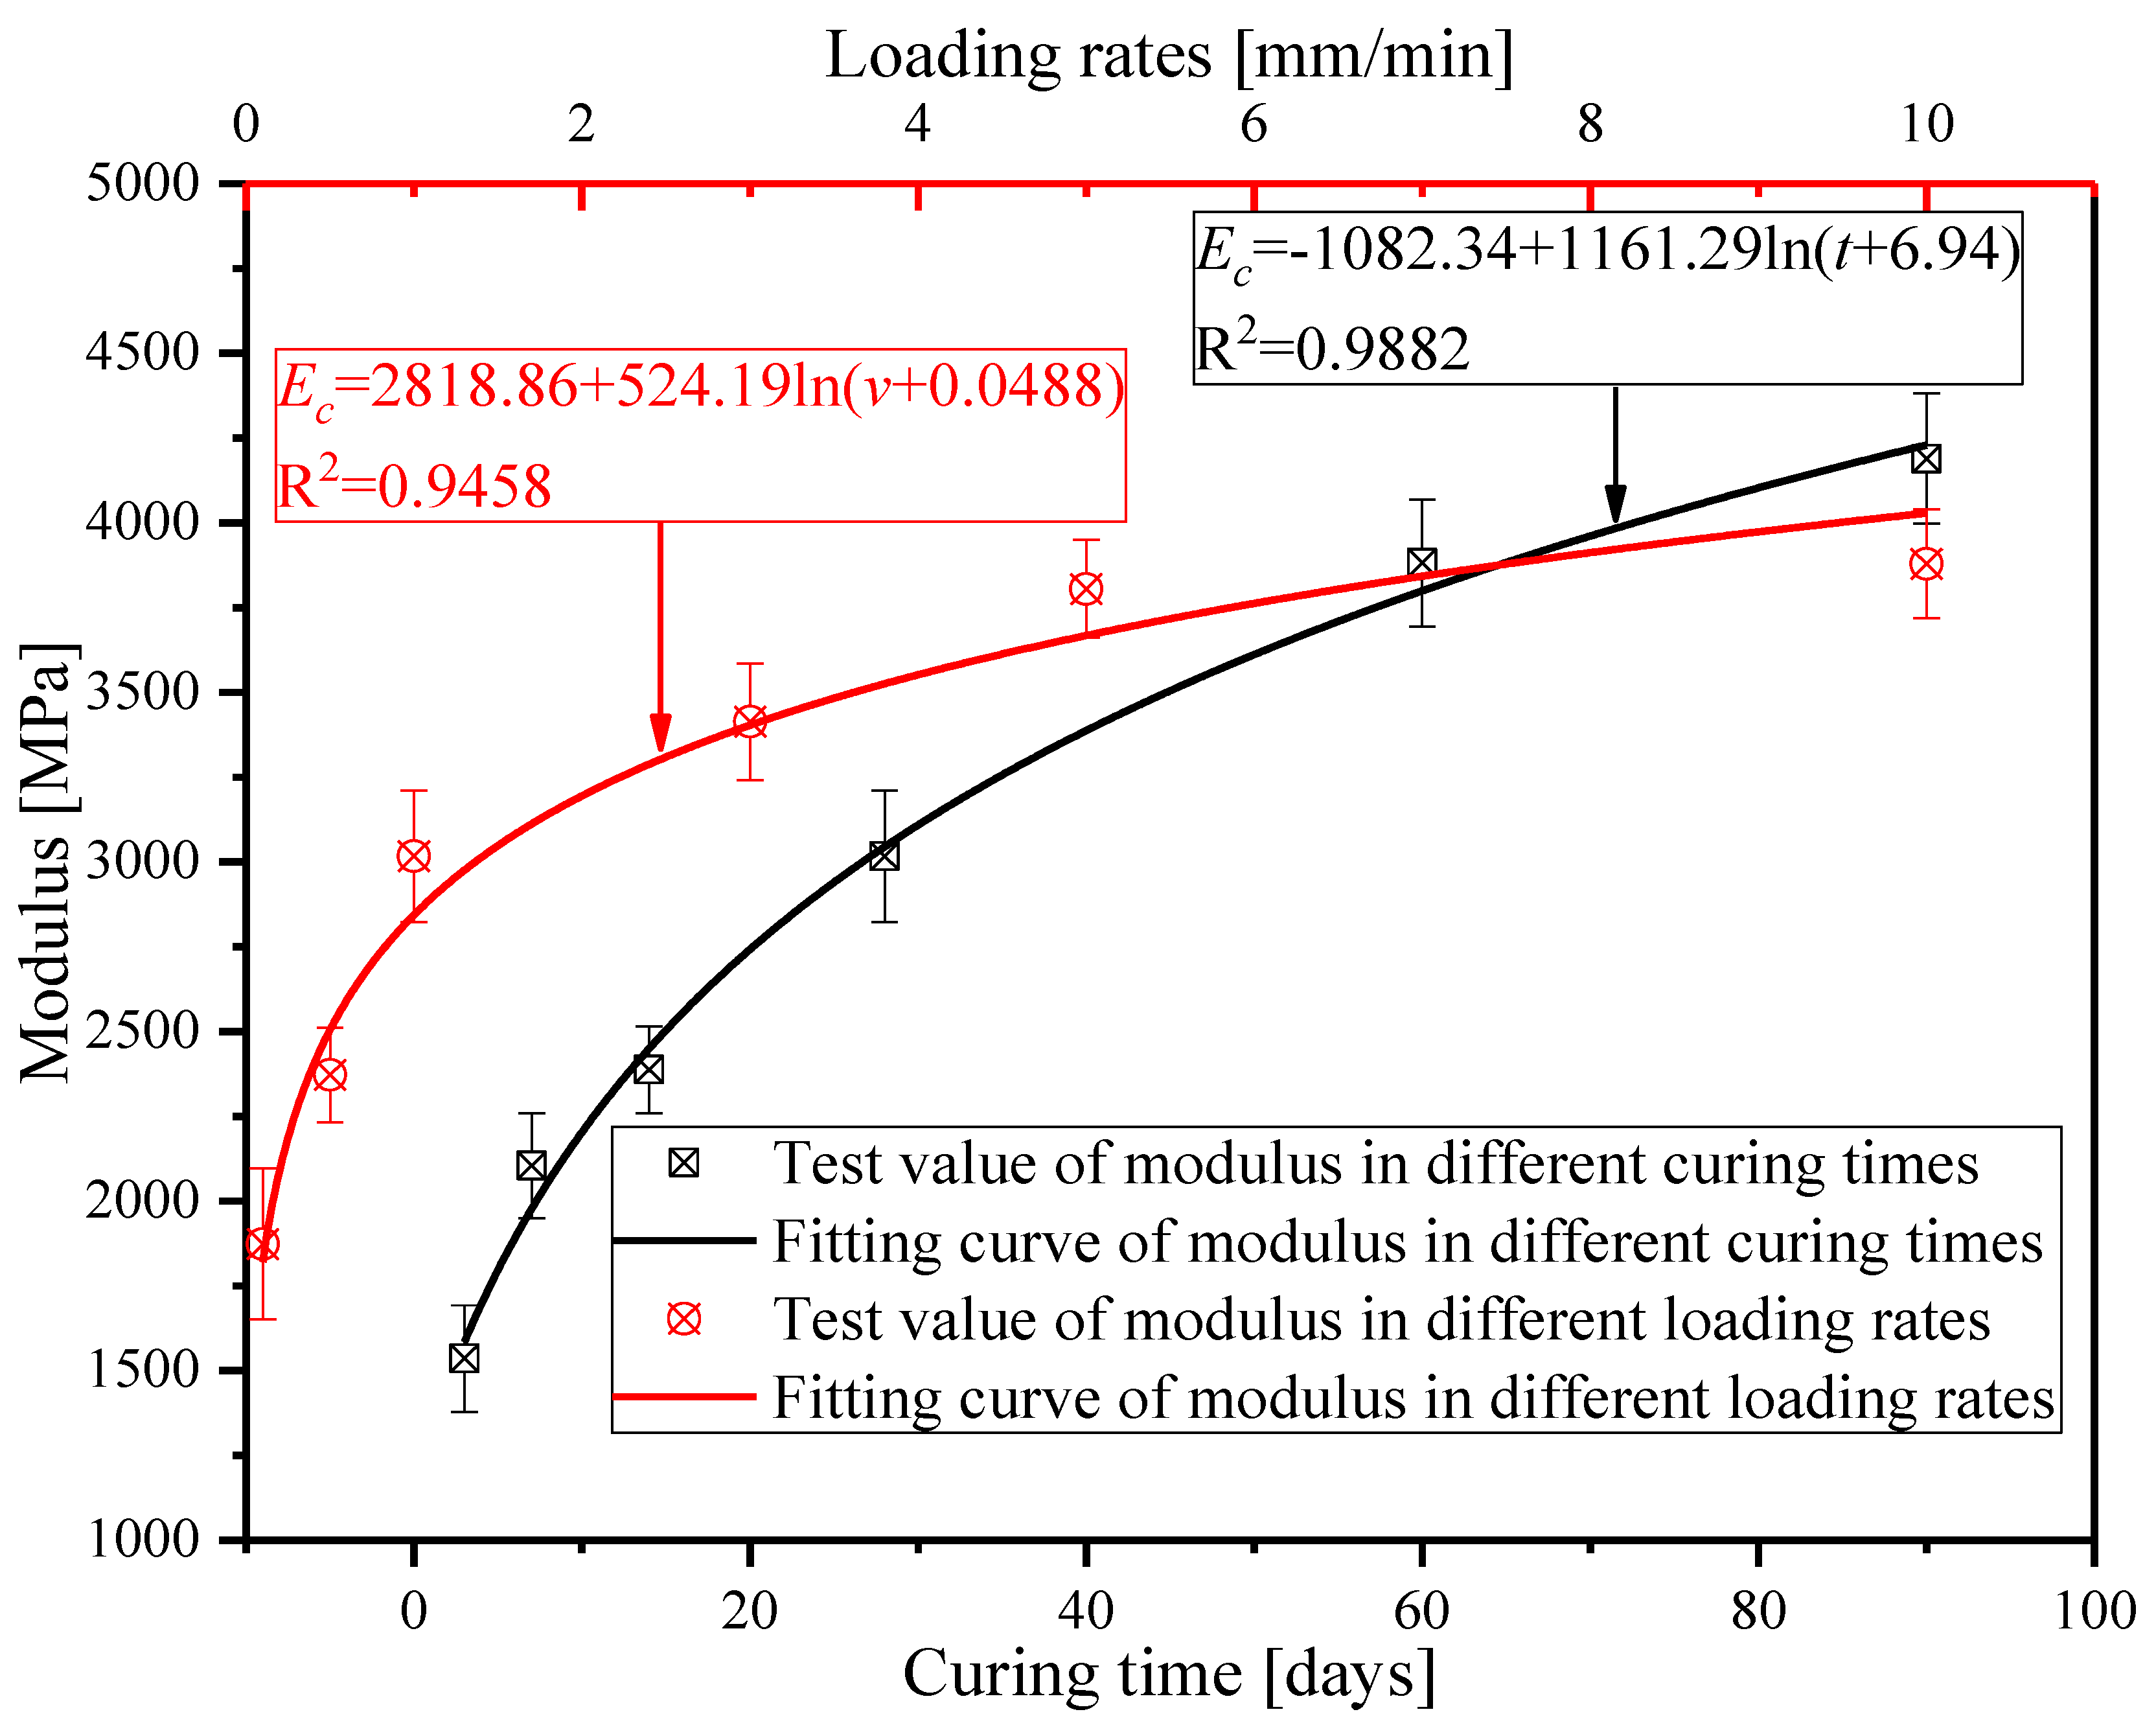
From the results of the unconfined compressive strength test presented in Table 4, it can be noted that the unconfined compressive modulus of the cement-treated aggregate base material varied significantly with both curing times and loading rates. The patterns of variation might be similar to that of strength, so the average value of the modulus test results with different curing times and loading rates were fitted by Equations (5) and (6), as shown in Figure 7, where R2 is the correlation coefficient.
where Ec is the compressive modulus, t is the curing time, v is the loading rate; m1, m2, n1, n2, p1, and p2 are the fitting parameters.
Based on the fitting results, it can be observed that:
- (1)
- The effect of the curing times on the modulus of the cement-treated aggregate base material was similar to that for the strength. The modulus varied dramatically with the curing times, especially from 3 days to 28 days, the modulus value increased by 96 % (from 1536 MPa to 3017 MPa). The modulus increased slowly with the later curing times, therefore the cement-treated aggregate base should be maintained for about 28 days after being paved, before paving the upper layer.
- (2)
- The modulus of the cement-treated aggregate base material is also affected by the loading rates. The modulus value increased by about 107% (from 1873 MPa to 3879 MPa) with the increase of the loading rates (from 0.1 mm/min to 10 mm/min). Therefore, when the compressive resilience modulus is taken as the pavement design parameter, the effect of the loading rates on it should be considered.
4.3. The Relationship between Unconfined Compressive Strength and Compressive Modulus
According to the Chinese Specification for Design of Highway Asphalt pavement (JTG D20-2017) [26], the control indicator is the unconfined compressive strength in the mix proportion design of the semi-rigid base material. However, the material design parameters for pavement structure design are the compressive resilient modulus, thus these two parameters are mismatched. In order to bridge the gap between the material design and the structural design, the relationship between the unconfined compression strength and the compression resilient modulus was established. Through comparing the patterns of variation illustrated in Figure 5 and Figure 7, it can be found that the curing time has similar effects on the strength and modulus, as well as the loading rates. This means that a relationship between the strength and modulus could be established.
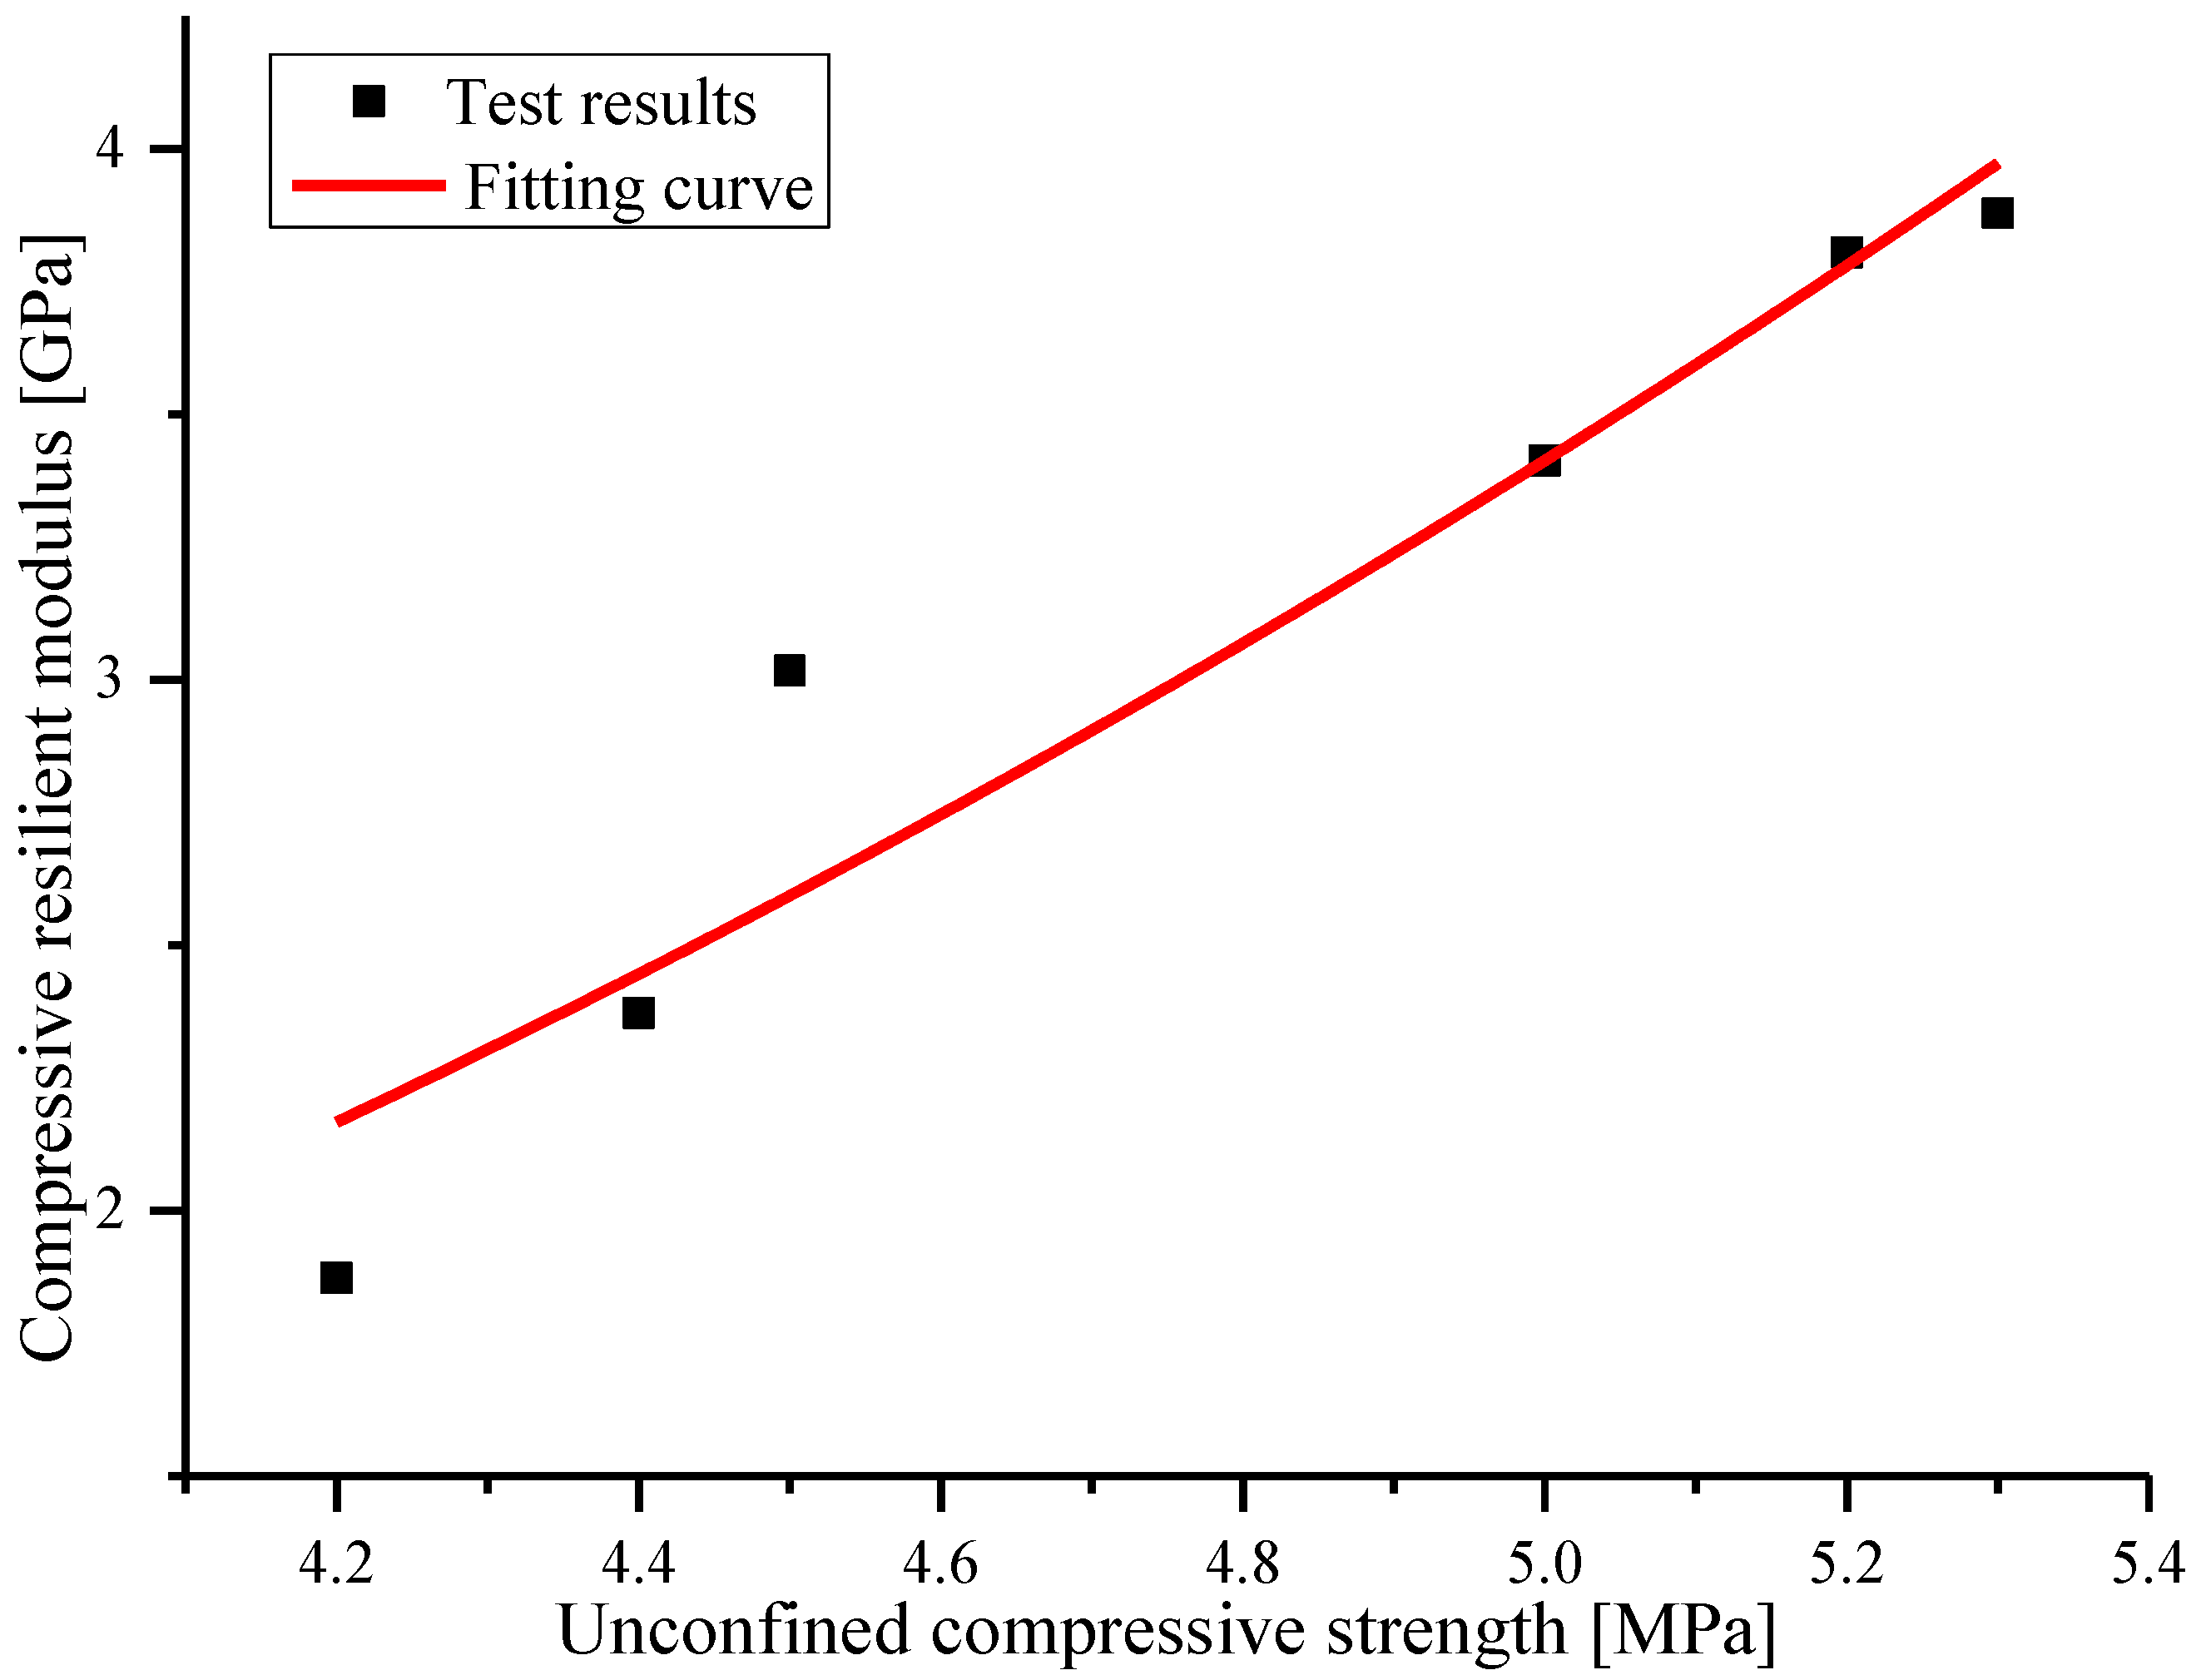
Under the same test conditions, the patterns of variation for the curing times to the strength and to the modulus were similar. Taking the curing time as an intermediate variable, the relationship between the strength and the modulus was proposed by regression analysis, as shown in Figure 8. Thus, the strength and modulus of the cement-treated aggregate base material could be transformed into each other at the same curing time. This was the same for the loading rates, as shown in Figure 9.
Taking the curing time as an intermediate variable (with the same curing times), the regression analysis equation was obtained as follows.
Similarly, taking the loading rates as the intermediate variable (with the same loading rates), the regression analysis equation was obtained as follows.
The regression analysis results bridged the gap between the material design and the structural design. This article provided a theoretical and methodical basis for the unification of the material design parameters and the structural design parameters.
5. Fatigue Equation of the Cement-Treated Aggregate Base Material Based on the True Stress Ratio and Nominal Stress Ratio
5.1. S-N Fatigue Equation
The S-N fatigue equation was established by Chaboche [27,28]
where D is the damage; N is the cycle number; M, α and γ are the material parameters related to temperature, stress amplitude and average stress; and σ is the stress level.
Through the integration of Equation (9), Equation (10) can be obtained:
When D(N) = 1, then N = Nf, the equation of fatigue life Nf can be obtained from Equation (10):
where Nf is the fatigue life.
Let , n = γ, and Equation (11) can be transformed to:
where k and n are the fitting parameters of the fatigue equation;
Let , , and Equation (11) can be transformed to:
where St is the strength obtained by the standard strength test; and t is the nominal stress ratio in fatigue test, t= σ/St.
Equations (12) and (13) are the conventional S-N fatigue equations, which have been widely used in characterizing the fatigue performance of pavement materials.
From the definition of the S-N equation, it could be noted that the stress ratios were determined with a certain strength value, obtained by the standard strength test method. The loading rates of the standard strength test are fixed, such as 1 mm/min or 50 mm/min. However, Section 3.1 showed that the strength of the cement-treated aggregate base material varied with the loading rates. Thus, it might bring a large error into the fatigue properties. When the stress level is larger than the failure strength obtained by the standard strength test, the stress ratio calculated by the standard strength was larger than 1, which means that the fatigue life of cement-treated aggregate base material under this stress level will be less than 1. However, the actual fatigue life is much greater than 1, according to the lab test. Therefore it is necessary to establish an improved S-N fatigue equation, which can consider the effects of the loading rates on the strength of the cement-treated aggregate base material.
5.2. Establishment of the Fatigue Model Based on the True Stress Ratio
- (1)
- Fatigue tests
In this paper, the four-point bending fatigue test was employed to characterize the fatigue properties of the cement-treated aggregate base material. The specimens for the four-point bending fatigue test were prepared using the static compaction method and the size of specimen was 100 mm × 100 mm × 400 mm, as shown in Figure 10.
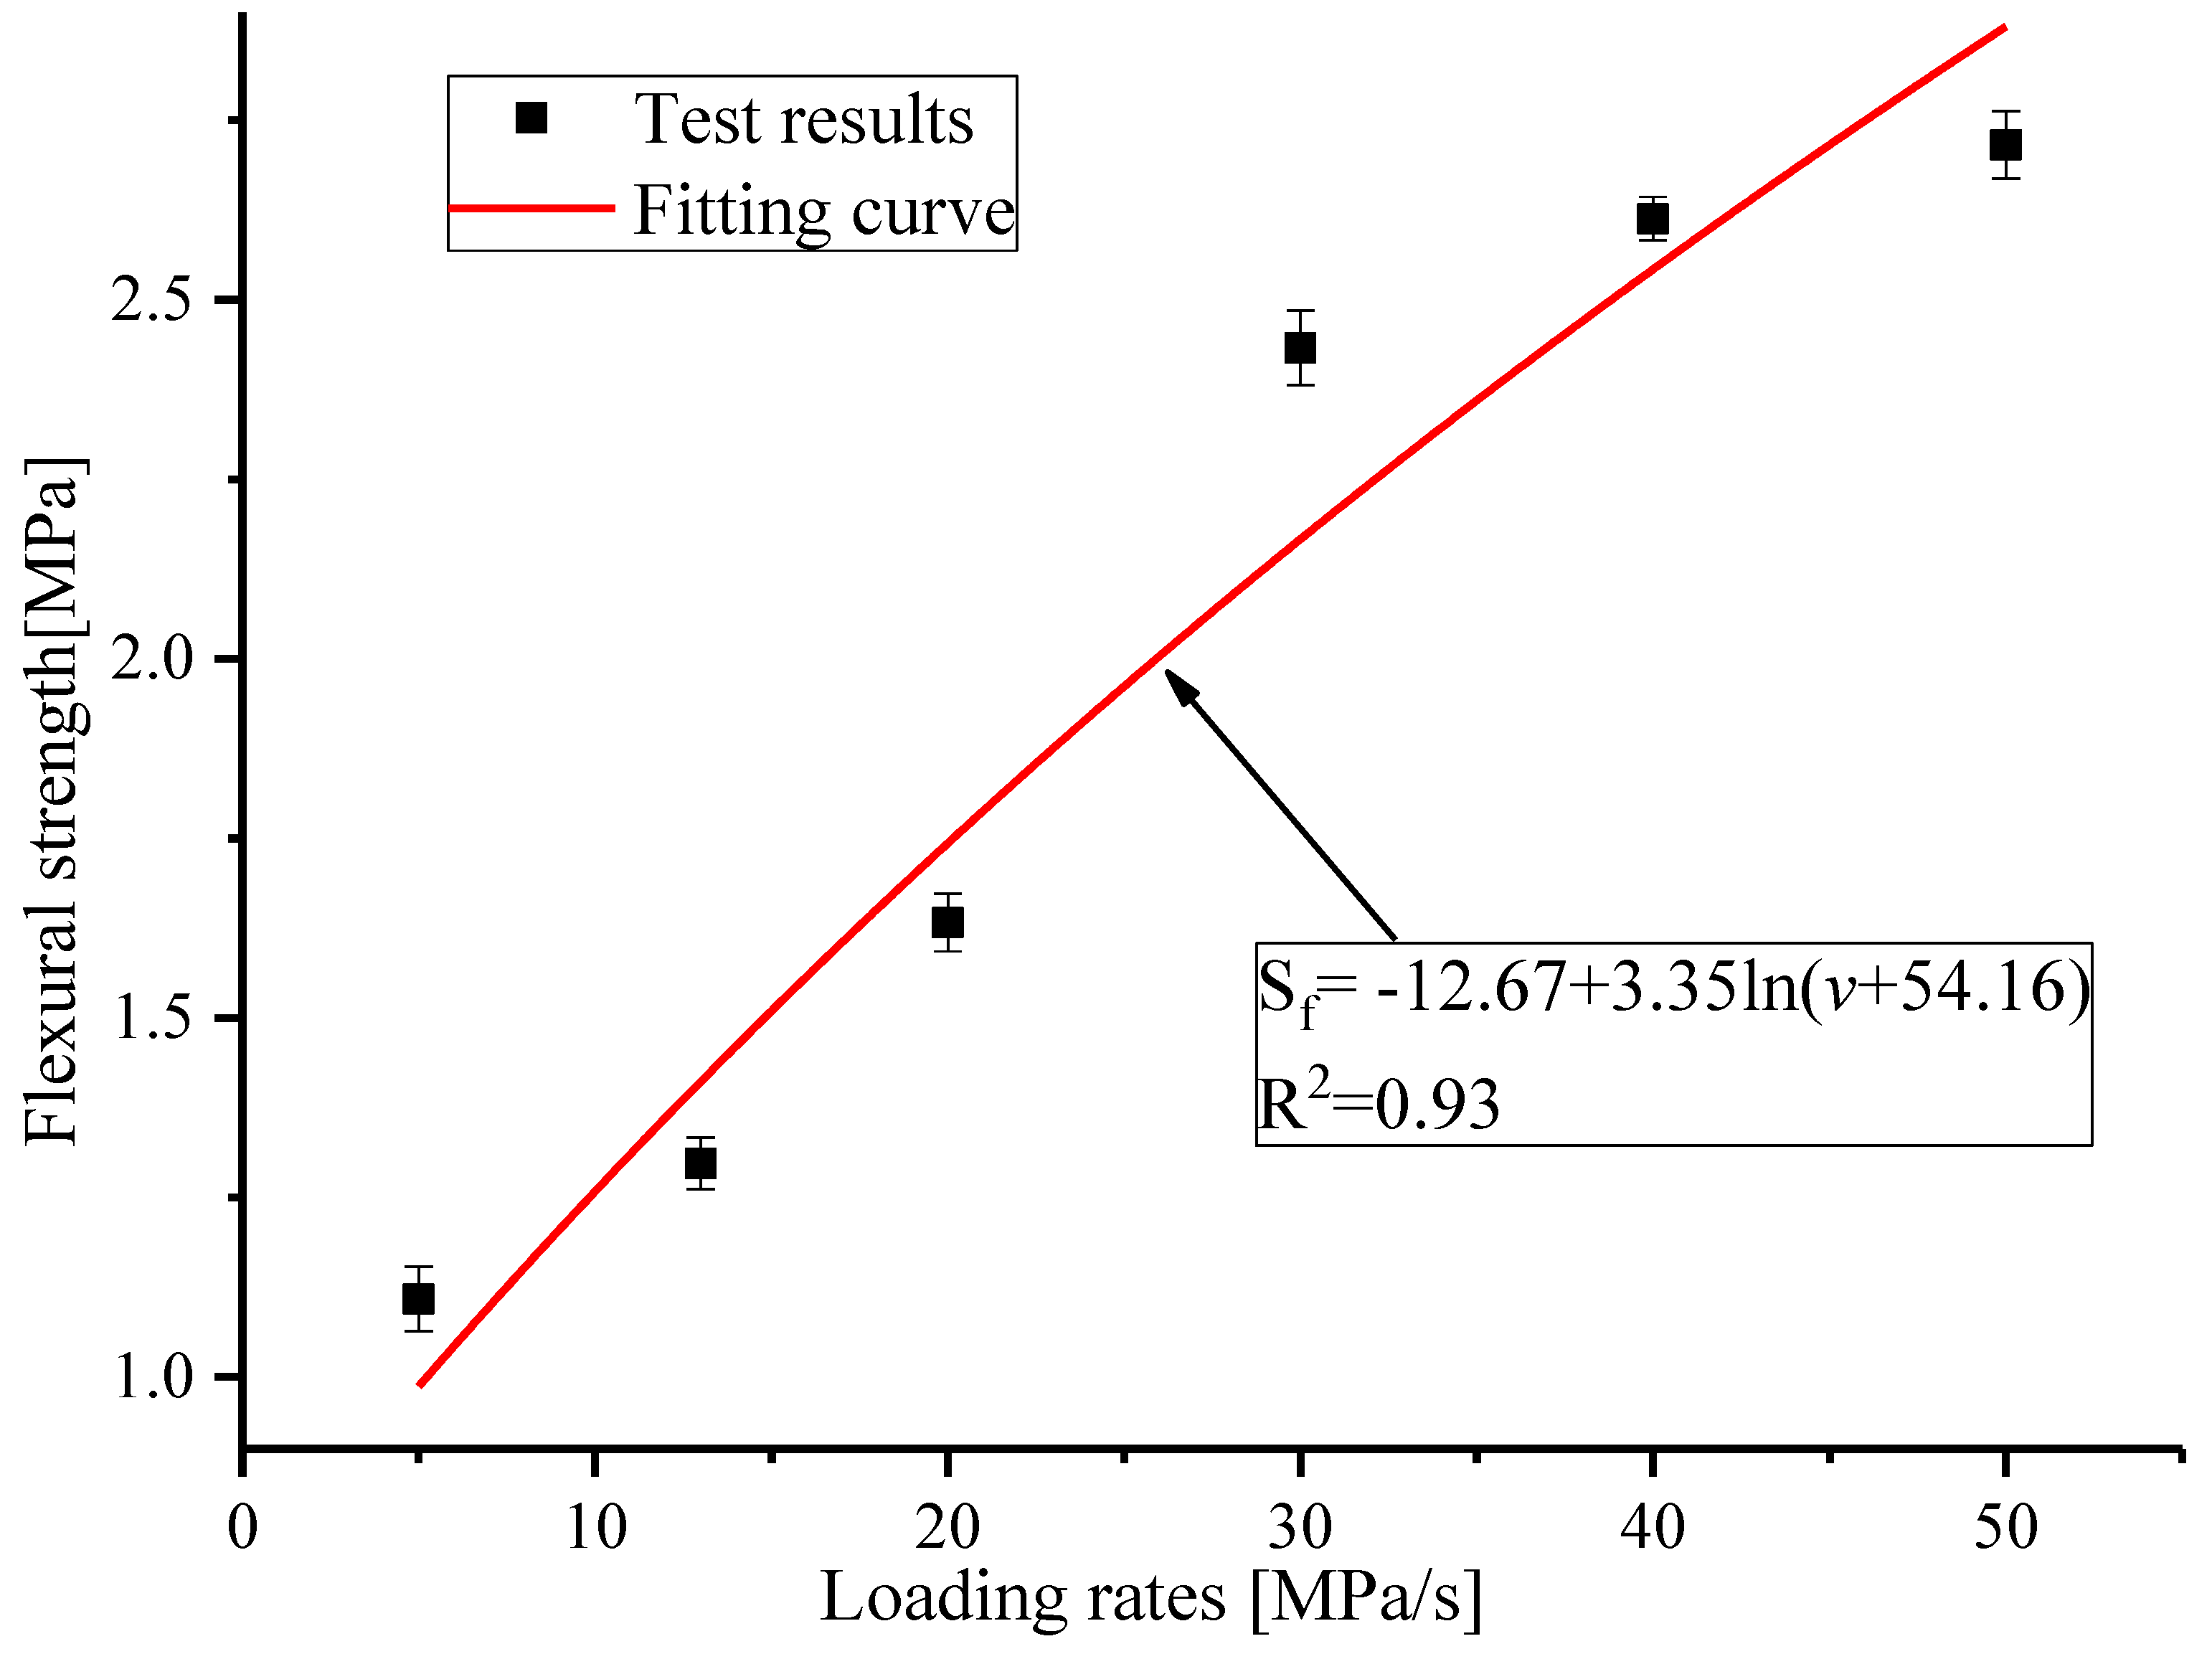
Prior the flexural fatigue test, the flexural strength tests were conducted under the standard loading rate of 13 MPa/s, which was calculated by the strength value and the loading time of the strength test. In this way the nominal stress ratio can be determined. Then the strength tests under different loading rates (5 MPa/s, 20 MPa/s, 30 MPa/s, 40 MPa/s, and 50 MPa/s) were conducted to determine the true stress ratio of the fatigue test. The true stress ratio refers to the ratio of fatigue stress level to strength and the strength is related to the loading rates. The procedure of flexural strength tests is the same for the unconfined compressive strength tests described in Section 3.2. The flexural strength of the specimen can be calculated according to Equation (14).
where Sf is the flexural strength (MPa); P is the ultimate failure loads (kN); L is the distance between two supporting points (mm); b is the width of the specimen (mm); and h is the height of the specimen (mm).
The test results are presented in Table 5.
As mentioned above, the standard loading rate was 13 MPa/s. From Table 5, it can be observed that the corresponding standard strength was 1.3 MPa when the standard loading rate was 13 MPa/s. The corresponding standard strength of 1.3 MPa was used to calculate the nominal stress ratio.
The fitting result for flexural strength with loading rates is shown in Figure 11; R2 is the correlation coefficient.
From the fitting results, it can be noted that the patterns of the variation of flexural strength with loading rates are similar to those of unconfined compressive strength.
- (2)
- S-N fatigue equation characterized by nominal stress ratio and true stress ratio
Generally, the average speed of vehicles on the road is about 60~80 km/s, at which point the pavements receive a loading frequency nearly equivalent to 10 Hz. Thus 10 Hz was taken as the loading frequency of the fatigue tests. The sinusoidal wave illustrated in Figure 12a was implemented as the loading waveform, and σ is the stress level. Based on the resulst of the flexural strength tests and the loading frequency, the control parameters of the four-point bending fatigue tests, namely stress level, nominal stress ratio and true stress ratio, could be calculated. The calculated results are presented in Table 6. According to the test setting parameters in Table 6, the four-point bending fatigue tests were carried out as shown in Figure 12b, and the test results are presented in Table 6.
The fatigue life of the cement-treated aggregate base material was fitted by S-N fatigue equation with a nominal stress ratio and true stress ratio, respectively. The fitting results are shown in Figure 13.
It can be observed from Figure 13 that:
① When stress levels of 1.5 MPa, 2.0 MPa and 2.5 MPa were exerted on the specimens during the four-point bending fatigue tests, the nominal stress ratios calculated by the standard strength 1.30 MPa were larger than 1. For these stress ratios, the fatigue life should theoretically be less than 1. However, their actual average fatigue lives were 312, 34 and 8, respectively, as shown in Table 6. Meanwhile, when the nominal stress ratio was 1, the actual fatigue life was 247, as shown in Figure 13, which means that the fatigue curve will not go through the point of (1, 1). The reason for this is that the strength of the cement-treated aggregate base material increases with the loading rates. However, the fatigue equation characterized by the nominal stress ratio could not consider it.
② When the true stress ratios were adopted in the S-N fatigue equation to reveal the characteristics of the cement-treated aggregate base material, the discrepancy mentioned above was eliminated. Based on the test and fitting results, the fatigue curve characterized by the true stress ratio will pass through the point of (1, 1), as shown in Figure 13. The parameter k′ of the fatigue equation Nf = k′(1/t)n′ was 1, so the equation can be expressed as Nf = (1/t)n′. This indicates that the fatigue life Nf will be 1 when the stress ratio t is 1, which means the fatigue equation curve based on the true stress ratio can be extended to the strength failure point of (1, 1), where both the true stress ratio and the fatigue life are 1. The Nf = 1 represents the strength failure where the fatigue life is 1. Therefore, based on the test and fitting of the results, the fatigue curve reveals the internal relationship between the strength failure and the fatigue failure.
The fatigue equation based on the true stress ratio is more rational than the fatigue equation of the nominal stress ratio. The fatigue test results can be extended in both directions of the fatigue curve. However, if the fatigue curve characterized by the nominal stress extends in the two directions, it will lead to a larger deviation. The greater the scope of the extension, the greater the deviation.
The effect of the loading rates on strength can be considered in the S-N fatigue equations characterized by the true stress ratio. It increases the accuracy of the fatigue life prediction for the cement-treated aggregate base material.
6. Conclusions
The unconfined compressive strength tests and compressive resilience modulus tests of the cement-treated aggregate base material were carried out under different loading rates and with different curing times. Meanwhile, the fatigue equations characterized by the true stress ratio were established by four-point bending fatigue tests. The following conclusions can be drawn from the above:
- (1)
- The unconfined compressive strength, compressive resilient modulus and flexural strength of cement-treated aggregate base materials are significantly affected by both the curing times and the loading rates.
- (2)
- When the nominal stress ratio reaches 1, that is, when the stress level reaches the strength value tested by the traditional strength test method, the theoretical fatigue life is expected to be 1, however, the actual fatigue life based on the conventional fatigue equation is 247. Thus, a large degree of discrimination exists between the theoretical value and the actual value. For the improved fatigue equation, the fatigue life is 1 when the stress ratio is 1 and the actual test result is consistent with the theoretical value expressed by the equation.
- (3)
- The S-N fatigue equation was modified by the true stress ratio, by which the fatigue curve could extend to the point of (1, 1). The relationship between the strength failure and the fatigue failure was established. It is consistent with the actual situation.
- (4)
- A comparison of the result between the existing and improved fatigue equation will be conducted to find more detailed differences and to develop advanced equations; this research will be conducted in the future with international materials and standards.
Author Contributions
S.L. and C.L. conceived the experiments; C.L., J.L. and H.Z. performed the experiments; S.L. and C.L. wrote the paper; J.Z. and Z.Y. outlined and revised the paper.
Acknowledgments
This work was supported by National Natural Science Foundation of China (51578081, 51608058), Chinese Academy of Engineering Consulting Research Project(2017-XY-17), The Ministry of Transport Construction Projects of Science and Technology (2015318825120), Key Projects of Hunan Province-Technological Innovation Project in Industry (2016GK2096), National Engineering Laboratory Open Fund Project (kfh160102), Scientific and Technological Innovation Project of Hunan Province for University Graduate Students (CX2017B457),The Guangxi Zhuang Autonomous Region Traffic and Transportation Department Transportation Projects of Science and Technology (2013-32), and The Inner Mongolia Autonomous Region Traffic and Transportation Department Transportation Projects of Science and Technology (NJ-2016-35).
Conflicts of Interest
The authors declare no conflict of interest.
References
- Judycki, J.; Jaskula, P. Structural Design and Sensitivity Analysis of Semi-Rigid Pavement of a Motorway. Eng. J. 2012, 16, 117–126. [Google Scholar] [CrossRef]
- Sun, J.; Xiao, T.; Dou, Y.; Yang, C. Study on the Rational Thickness of Surface Course on Semi-Rigid Base Asphalt Pavement. Geohunan Int. Conf. 2011, 37–44. [Google Scholar] [CrossRef]
- Jiang, Y.; Chen, Z.; Peng, B.; Dai, J. Mixture design method and anti-cracking performance of cement stabilizing crashed rock pavement with dense skeleton type. J. Xian Highw. Univ. 2002, 22, 9–12. [Google Scholar]
- Paige-Green, P.; Netterberg, F. Cement Stabilization of Road Pavement Materials: Laboratory Testing Programme Phase 1; Cement & Concrete Institute: Midrand, South African, 2004. [Google Scholar]
- Guthrie, W.S.; Young, T.B. Evaluation of Transition Cement for Stabilization of Frost-Susceptible Base Material in Conjunction with Full-Depth Recycling in Weber Canyon, Utah. Int. Conf. Cold Reg. Eng. 2006, 1–13. [Google Scholar] [CrossRef]
- Poveda, E.; Ruiz, G.; Cifuentes, H.; Yu, R.; Zhang, X. Influence of the fiber content on the compressive low-cycle fatigue behavior of self-compacting SFRC. Int. J. Fatig. 2017, 101, 9–17. [Google Scholar] [CrossRef]
- Hou, X.; Zhang, P.; Zhang, M. Study on Fracture Toughness of Cement Treated Aggregate. Adv. Mater. Res. 2011, 280, 76–79. [Google Scholar] [CrossRef]
- George, K.P. Shrinkage characteristics of soil-cement mixtures. Highw. Res. Rec. 1968, 225, 42–48. [Google Scholar]
- Lv, S.; Liu, C.; Yao, H.; Zheng, J. Comparisons of synchronous measurement methods on various moduli of asphalt mixtures. Construct. Build. Mater. 2018, 158. [Google Scholar] [CrossRef]
- Deng, X.J.H.; Yang, J. Cyclic test study on fatigue characteristics of semi rigid pavement. J. Southeast Univ. 1995, 25, 94–99. [Google Scholar]
- Chai, G.; Oh, Y.N.E.; Balasubramaniam, A. In-Situ Stabilization of Road Base Using Cement. In Proceedings of the Fifteenth International Offshore and Polar Engineering Conference, Seoul, Korea, 19–24 June 2005. [Google Scholar]
- Busch, C.; Thøgersen, F.; Henrichsen, A. Development and Validation of a Mechanistic Recursive-Incremental Deterioration Model for Cement-Stabilized Base Courses. Transp. Res. Rec. J. Transp. Res. Board 2006, 1974, 128–137. [Google Scholar] [CrossRef]
- Judycki, J. Comparison of fatigue criteria for flexible and semi-rigid pavements. In Proceedings of the Conference on Asphalt Pavements—International Society of Asphalt Pavementsavements, Seattle, WA, USA, 10–14 August 1997. [Google Scholar]
- Yao, Z. A Review on Design Criteria of Asphalt Pavements. Highway 2003, 2, 43–49. [Google Scholar]
- Kim, J.; West, R.C. Application of the Viscoelastic Continuum Damage Model to the Indirect Tension Test at a Single Temperature. J. Eng. Mech. 2010, 136, 496–505. [Google Scholar] [CrossRef]
- You, Z.; Adhikari, S.; Kutay, M.E. Dynamic modulus simulation of the asphalt concrete using the X-ray computed tomography images. Mater. Struct. 2009, 42, 617–630. [Google Scholar] [CrossRef]
- González, J.M.; Miquel Canet, J.; Oller, S.; Miró, R. A viscoplastic constitutive model with strain rate variables for asphalt mixtures—Numerical simulation. Comput. Mater. Sci. 2007, 38, 543–560. [Google Scholar] [CrossRef]
- Lundström, R.; Isacsson, U.; Ekblad, J. Investigations of stiffness and fatigue properties of asphalt mixtures. J. Mater. Sci. 2003, 38, 4941–4949. [Google Scholar] [CrossRef]
- Lv, S.; Zheng, J. Normalization method for asphalt mixture fatigue equation under different loading frequencies. J. Cent. South Univ. 2015, 22, 2761–2767. [Google Scholar] [CrossRef]
- CEB. Fatigue of Concrete Structures; State of the Art Report, Bulletin d’Information No. 188; Comité Euro-International du Béton: Paris, France, 1988. [Google Scholar]
- Zheng, J.; Lv, S. Nonlinear fatigue damage model for asphalt mixtures. China J. Highw. Transp. 2009, 22, 21–28. [Google Scholar]
- JTJ/T F20-2015. The Chinese Construction Specifications for Highway Road Bases; Renmin Communication Press: Beijing, China, 2015. [Google Scholar]
- JTG E51-2009. The Chinese Test Methods of Materials Stabilized with Inorganic Binders for Highway Engineering; Renmin Communication Press: Beijing, China, 2009. [Google Scholar]
- Zhuang, S.; Liu, P.; Sun, Z. Investigation on deformation and its influencing factors of cement-stabilized macadam base. J. Build. Mater. 2003, 6, 356–363. [Google Scholar]
- Sun, Z.; Wang, T.; Zhi-Hong, X.; Liu, Z.; Qiu, Y.; Xiao, L. Trial Study on Influence Factors of Cement-Stabilized Macadam Strength. J. Build. Mater. 2006, 9, 285–290. [Google Scholar]
- JTG D20-2017. The Chinese Specification for Design of Highway Asphalt Pavement; Renmin Communication Press: Beijing, China, 2017. [Google Scholar]
- Lv, S.; Luo, Z.; Xie, J. Fatigue performance of aging asphalt mixtures. Polimery 2015, 60, 126–131. [Google Scholar] [CrossRef]
- Lv, S.; Wang, X.; Liu, C.; Wang, S. Fatigue Damage Characteristics Considering the Difference of Tensile-Compression Modulus for Asphalt Mixture. J. Test. Eval. 2018, 46. [Google Scholar] [CrossRef]
Figure 1.
Flow chart of the work.

Figure 2.
Gradation curve of cement-treated aggregate base material.

Figure 3.
Preparation of cement-treated aggregate base material specimens. (a) Hydrostatic molding (b) Specimen demolding (c) Specimen curing.
Figure 3.
Preparation of cement-treated aggregate base material specimens. (a) Hydrostatic molding (b) Specimen demolding (c) Specimen curing.

Figure 4.
The procedure of the unconfined compressive strength test (a) Specimens immersed in water (b) Selection of standard specimens (c) Strength test (d) Failure sample of unconfined compressive strength.
Figure 4.
The procedure of the unconfined compressive strength test (a) Specimens immersed in water (b) Selection of standard specimens (c) Strength test (d) Failure sample of unconfined compressive strength.

Figure 5.
Patterns of variation of unconfined compressive strength with curing time and loading rates.
Figure 5.
Patterns of variation of unconfined compressive strength with curing time and loading rates.

Figure 6.
Device of compression resilience modulus test.

Figure 7.
Patterns of variation for compressive resilient modulus with curing times and loading rates.
Figure 7.
Patterns of variation for compressive resilient modulus with curing times and loading rates.

Figure 8.
Fitting curve of strength and modulus with the same curing times.

Figure 9.
Fitting curve of strength and modulus with the same loading rates.

Figure 10.
Specimen of fatigue test (a) specimen molding (b) specimen after being demolded (c) specimens curing.
Figure 10.
Specimen of fatigue test (a) specimen molding (b) specimen after being demolded (c) specimens curing.

Figure 11.
Pattern of variation of flexural strength with loading rates.

Figure 12.
Fatigue test (a) Loading waveform (b) Flexural test.

Figure 13.
Fatigue curve fitted by nominal stress ratio and true stress ratio.


Table 1.
The technical indicators of cement.
| Test Projects | Test Results | Technical Requirement | |
| Fineness detection | 1.8 | ≤10% | |
| Setting time (min) | initial setting/min | 275 | ≥180 |
| final setting/min | 408 | ≥360 | |
| Stability(mm) | 3 | ≤5 | |
| Strength of cement mortar (MPa) | 3 days flexural strength | 4.7 | ≥2.5 |
| 3 days unconfined compressive strength | 19.9 | ≥10 | |
| MgO content (%) | 3.1 | ≤5% | |
| SO3 content (%) | 1.1 | ≤3.5% | |
| Loss on ignition | 0.9 | ≤3.0% | |
| Specific surface area (selectivity indicator) | 410 | 300 m2/kg~450 m2/kg | |
| Initial setting time | 110 | ≥90 min | |
| Final setting time | 690 | ≤720 min | |
Table 2.
The technical indicators of the aggregate.
| Test Projects | Test Results | Technical Requirement [20] |
|---|---|---|
| Content of flat and elongated particles in coarse aggregate (%) | 11.7% | ≤20% |
| Crushed stone value (%) | 19.8% | ≤30% |
| Less than 0.6mm particle Liquid limit/plastic index | 26.5% | liquid limit ≤ 28% |
| 6.2 | plastic index ≤ 9 | |
| Content of soft stone (%) | 0.9 | ≤3 |
Table 3.
Test results of unconfined compressive strength with different curing times.
| Curing Time (t/d) | Loading Rates (mm/min) | Unconfined Compressive Strength of Parallel Specimens Sc (MPa) | Average Value (MPa) | Cv (%) | ||||||
|---|---|---|---|---|---|---|---|---|---|---|
| 1 | 2 | 3 | 4 | 5 | 6 | 7 | ||||
| 3 | 1 | 3.1 | 2.7 | 2.8 | 3.2 | 2.6 | 3.0 | 2.8 | 2.9 | 7.58 |
| 7 | 3.4 | 4.3 | 3.5 | 4.0 | 3.6 | 3.9 | 3.4 | 3.7 | 9.36 | |
| 14 | 4.7 | 3.9 | 4.1 | 4.2 | 4.8 | 4.6 | 4.3 | 4.4 | 7.65 | |
| 28 | 5.1 | 4.3 | 4.3 | 4.7 | 4.9 | 4.4 | 4.6 | 4.6 | 6.70 | |
| 60 | 5.5 | 5.9 | 5.7 | 5.4 | 5.2 | 5.3 | 5.5 | 5.5 | 4.33 | |
| 90 | 5.9 | 5.8 | 5.5 | 5.6 | 5.3 | 6.0 | 6.2 | 5.8 | 5.40 | |
| 28 | 0.1 | 4.3 | 4 | 4.2 | 4.3 | 4.5 | 4 | 4.2 | 4.2 | 6.92 |
| 0.5 | 4.3 | 4.2 | 4.7 | 4.6 | 4.6 | 4.4 | 4.3 | 4.4 | 7.57 | |
| 1 | 4.6 | 4.3 | 4.3 | 4.7 | 4.9 | 4.4 | 4.6 | 4.5 | 6.70 | |
| 3 | 5.2 | 4.8 | 4.7 | 5.1 | 4.9 | 5.0 | 5.1 | 5.0 | 3.60 | |
| 5 | 5.4 | 5.3 | 4.9 | 5.4 | 5.2 | 5.1 | 4.9 | 5.2 | 4.16 | |
| 10 | 5.3 | 5.2 | 5.0 | 5.6 | 5.1 | 5.4 | 5.2 | 5.3 | 7.46 | |
Table 4.
Test results of the compressive resilient modulus with different curing times and loading rates.
Table 4.
Test results of the compressive resilient modulus with different curing times and loading rates.
| Curing Times (t/d) | Loading Rates (v/mm/min) | Unconfined Compressive Modulus of Parallel Specimens Ec (MPa) | Average Value (MPa) | Cv (%) | ||||||
|---|---|---|---|---|---|---|---|---|---|---|
| 1 | 2 | 3 | 4 | 5 | 6 | 7 | ||||
| 3 | 1 | 1830 | 1515 | 1573 | 1370 | 1518 | 1578 | 1365 | 1536 | 10.20 |
| 7 | 1 | 1919 | 1946 | 2294 | 2126 | 1988 | 2276 | 2179 | 2104 | 7.37 |
| 14 | 1 | 2564 | 2493 | 2344 | 2397 | 2379 | 2156 | 2378 | 2387 | 5.35 |
| 28 | 1 | 3004 | 3243 | 2806 | 2793 | 3286 | 3049 | 2935 | 3017 | 6.43 |
| 60 | 1 | 3556 | 3974 | 4026 | 3860 | 3762 | 3869 | 4125 | 3882 | 4.82 |
| 90 | 1 | 4222 | 4204 | 4107 | 4571 | 4127 | 3942 | 4150 | 4189 | 4.58 |
| 28 | 0.1 | 1876 | 2163 | 1636 | 1599 | 2140 | 1784 | 1912 | 1873 | 11.86 |
| 28 | 0.5 | 2424 | 2296 | 2351 | 2189 | 2634 | 2306 | 2405 | 2372 | 5.87 |
| 28 | 1 | 3004 | 3243 | 2806 | 2793 | 3286 | 3049 | 2935 | 3017 | 6.43 |
| 28 | 3 | 3437 | 3679 | 3523 | 3356 | 3240 | 3482 | 3176 | 3413 | 5.04 |
| 28 | 5 | 3628 | 3827 | 3741 | 3976 | 3664 | 3792 | 4006 | 3805 | 3.80 |
| 28 | 10 | 4040 | 3713 | 3863 | 3752 | 3941 | 4120 | 3723 | 3879 | 4.16 |
Table 5.
Flexural strength tests results with different loading rates.
| Curing Times (t/d) | Loading Rates v (MPa/s) | Flexural Strength Tests Results of Parallel Specimens Sf (MPa) | Average Value (MPa) | Cv (%) | ||||||
|---|---|---|---|---|---|---|---|---|---|---|
| 1 | 2 | 3 | 4 | 5 | 6 | 7 | ||||
| 90 | 5 | 1.10 | 1.11 | 1.13 | 1.02 | 1.17 | 1.11 | 1.12 | 1.11 | 4.53 |
| 13 | 1.29 | 1.31 | 1.3 | 1.28 | 1.36 | 1.3 | 1.24 | 1.30 | 3.59 | |
| 20 | 1.57 | 1.68 | 1.62 | 1.64 | 1.6 | 1.68 | 1.64 | 1.63 | 4.03 | |
| 30 | 2.38 | 2.35 | 2.47 | 2.46 | 2.44 | 2.50 | 2.43 | 2.43 | 5.22 | |
| 40 | 2.59 | 2.66 | 2.61 | 2.64 | 2.57 | 2.6 | 2.62 | 2.61 | 3.04 | |
| 50 | 2.72 | 2.62 | 2.77 | 2.73 | 2.74 | 2.71 | 2.72 | 2.72 | 4.65 | |
Table 6.
Tests results of flexural fatigue under different stress levels.
| v (MPa/s) | σ (MPa) | Sfv (MPa) | t1(%) | t2(%) | Fatigue Life of Parallel Tests Nf | Average Nf | |||
|---|---|---|---|---|---|---|---|---|---|
| 1 | 2 | 3 | 4 | ||||||
| 5 | 0.25 | 1.11 | 0.19 | 0.23 | 12,687,941 | 12,619,781 | 12,809,765 | 12,753,580 | 12,717,767 |
| 13 | 0.65 | 1.30 | 0.50 | 0.50 | 2283 | 2251 | 2237 | 2189 | 2239 |
| 20 | 1.00 | 1.63 | 0.77 | 0.61 | 567 | 596 | 582 | 603 | 587 |
| 30 | 1.50 | 2.43 | 1.15 | 0.62 | 302 | 317 | 320 | 309 | 312 |
| 40 | 2.00 | 2.61 | 1.54 | 0.77 | 30 | 37 | 33 | 36 | 34 |
| 50 | 2.50 | 2.72 | 1.69 | 0.91 | 6 | 8 | 10 | 8 | 8 |
where v is loading rate; σ is stress level; Sf is the flexural strength value; t1 is the nominal stress ratio, t1 = σ/1.3 MPa, 1.3 MPa is the standard strength; and t2 is the true stress ratio, t2 = σ/Sfv.
© 2018 by the authors. Licensee MDPI, Basel, Switzerland. This article is an open access article distributed under the terms and conditions of the Creative Commons Attribution (CC BY) license (http://creativecommons.org/licenses/by/4.0/).
Share and Cite
MDPI and ACS Style
Lv, S.; Liu, C.; Lan, J.; Zhang, H.; Zheng, J.; You, Z. Fatigue Equation of Cement-Treated Aggregate Base Materials under a True Stress Ratio. Appl. Sci. 2018, 8, 691. https://doi.org/10.3390/app8050691
AMA Style
Lv S, Liu C, Lan J, Zhang H, Zheng J, You Z. Fatigue Equation of Cement-Treated Aggregate Base Materials under a True Stress Ratio. Applied Sciences. 2018; 8(5):691. https://doi.org/10.3390/app8050691
Chicago/Turabian StyleLv, Songtao, Chaochao Liu, Jingting Lan, Hongwei Zhang, Jianlong Zheng, and Zhanping You. 2018. "Fatigue Equation of Cement-Treated Aggregate Base Materials under a True Stress Ratio" Applied Sciences 8, no. 5: 691. https://doi.org/10.3390/app8050691
Note that from the first issue of 2016, this journal uses article numbers instead of page numbers. See further details here.